
Abstract
Pathogen recognition following infection in mammals depends mainly on TLRs and NLRs. Herein, we evaluate the role of NOD1 and NOD2 signaling in the inflammatory responses of the middle ear (ME) mucosa and leukocytes recruitment to infection site during otitis media (OM). OM is a common pediatric disease with prevalent repercussions on hearing health. While many risk factors have been implicated to OM proneness, immunity and the triggering of inflammation are central to OM pathology. We observed that many genes encoding members of the NOD leucine-rich repeat and their downstream adaptor/effector molecules were strongly regulated during the course of OM. When compared to wild type C57BL/6 mice, NOD1- and NOD2-deficient mice were susceptible to prolonged OM infection by non-typeable Haemophilus influenza. NOD1-deficient mice appeared to have reduced macrophage enlistment with a delayed inflammatory response by neutrophils and prolonged mucosal hyperplasia, whereas NOD2 knockouts exhibited an overall reduction in the number of leukocytes recruited to the ME, leading to delayed bacterial clearance. Altogether, these data show that the NODs play a role in the pathogenesis and recovery of OM and reinforce the importance of innate immune signaling in the protective host response.
Introduction
Otitis media (OM) is a widespread pediatric disease. 1 It is associated with bacterial infection of the middle ear (ME) and results in inflammation that leads to mucus secretion, fluid accumulation, and mucosal hyperplasia in the ME cavity. Although OM is typically not an imminent health threat in the US, health care expenditures due to office visits, emergency room visits, medications, and surgeries exceed 5 billion dollars annually.2,3 While acute OM usually resolves spontaneously in a few days, a substantial fraction of children experience persistent or recurrent infection.4,5 For those, fluid and mucus in the ME cause conductive hearing loss during a critical period of language development and learning. 6 Accordingly, there are an estimated 34 million children living with hearing loss, much of which avoidable. 7 Moreover, severe OM can result in irreversible hearing impairment, and in extreme cases lead to meningitis. Worldwide, OM and associated complications claim the lives of at least 28,000 due to lack of access to modern health care. It is also estimated that undertreated OM causes half of the world’s burden of serious hearing loss.8,9 Hence, OM is a significant public health issue in both developed and developing countries. 10
OM is strongly associated with bacterial infection of the ME, primarily by non-typeable Haemophilus influenzae (NTHi), Streptococcus pneumoniae, or Moraxella chatarrhalis. 11 Among other factors contributing to OM are Eustachian tube (ET) dysfunction, 12 upper respiratory bacterial or viral infection, 13 genetics, 14 allergy, 15 and environmental factors such as exposure to cigarette smoke. 16 The combination of an increase in bacterial presence in the nasopharynx along with ET dysfunction is believed to be the most common path to infection in the ME. 17
As noted above, uncomplicated OM resolves in a few days. This is too rapid for the effective engagement of cognate immunity. Therefore innate immunity is thought to be the normal mechanism of OM resolution. 18 The innate immune system is part of the host defense mechanism, which involves recognition and reaction against microorganisms to activate an inflammatory response to control host infection, without the need for prior sensitization. Although the immunological etiology of OM has been investigated, more is needed to be known about how and which part of the innate immune system first reacts with pathogens invading the ME cavity.
Detection of microbial infection or tissue damage occurs via PRRs. The most notable PRRs include the TLRs and NLRs. The role of TLRs in OM pathogenesis has been characterized experimentally.19,20 However, to date it is not clear whether the NLRs, including NOD1 and NOD2, play a role in mediating the innate immune response of the ME during OM. The exploration of this and other pathways could provide more detailed information about innate immunity regulation in OM.
The NLRs are a family of cytoplasmic PRRs that are known to mediate cytosolic recognition of microbial molecules. NOD1 and NOD2 are the first NLR members to be identified and are composed of a C-terminal leucine-rich repeat (LRR) domain, a central NOD, and an N-terminal caspase activation and recruitment domain (CARD). Their structure allows the NOD proteins to detect muropeptides, which are conserved within bacterial peptidoglycans (PGNs). 21 Once activated, NOD1 and NOD2 oligomerize and recruit RIP2 through a homotypic CARD–CARD interaction to trigger NF-κB and MAPK activation that in turn stimulates the expression of pro-inflammatory cytokines, chemokines, and antibacterial peptides to fight the infection (Figure 1). 22 Interestingly, although the NLRs are normally intracellular, NOD1 and NOD2 can also dynamically traffic to the extracellular membrane under certain circumstances. 23
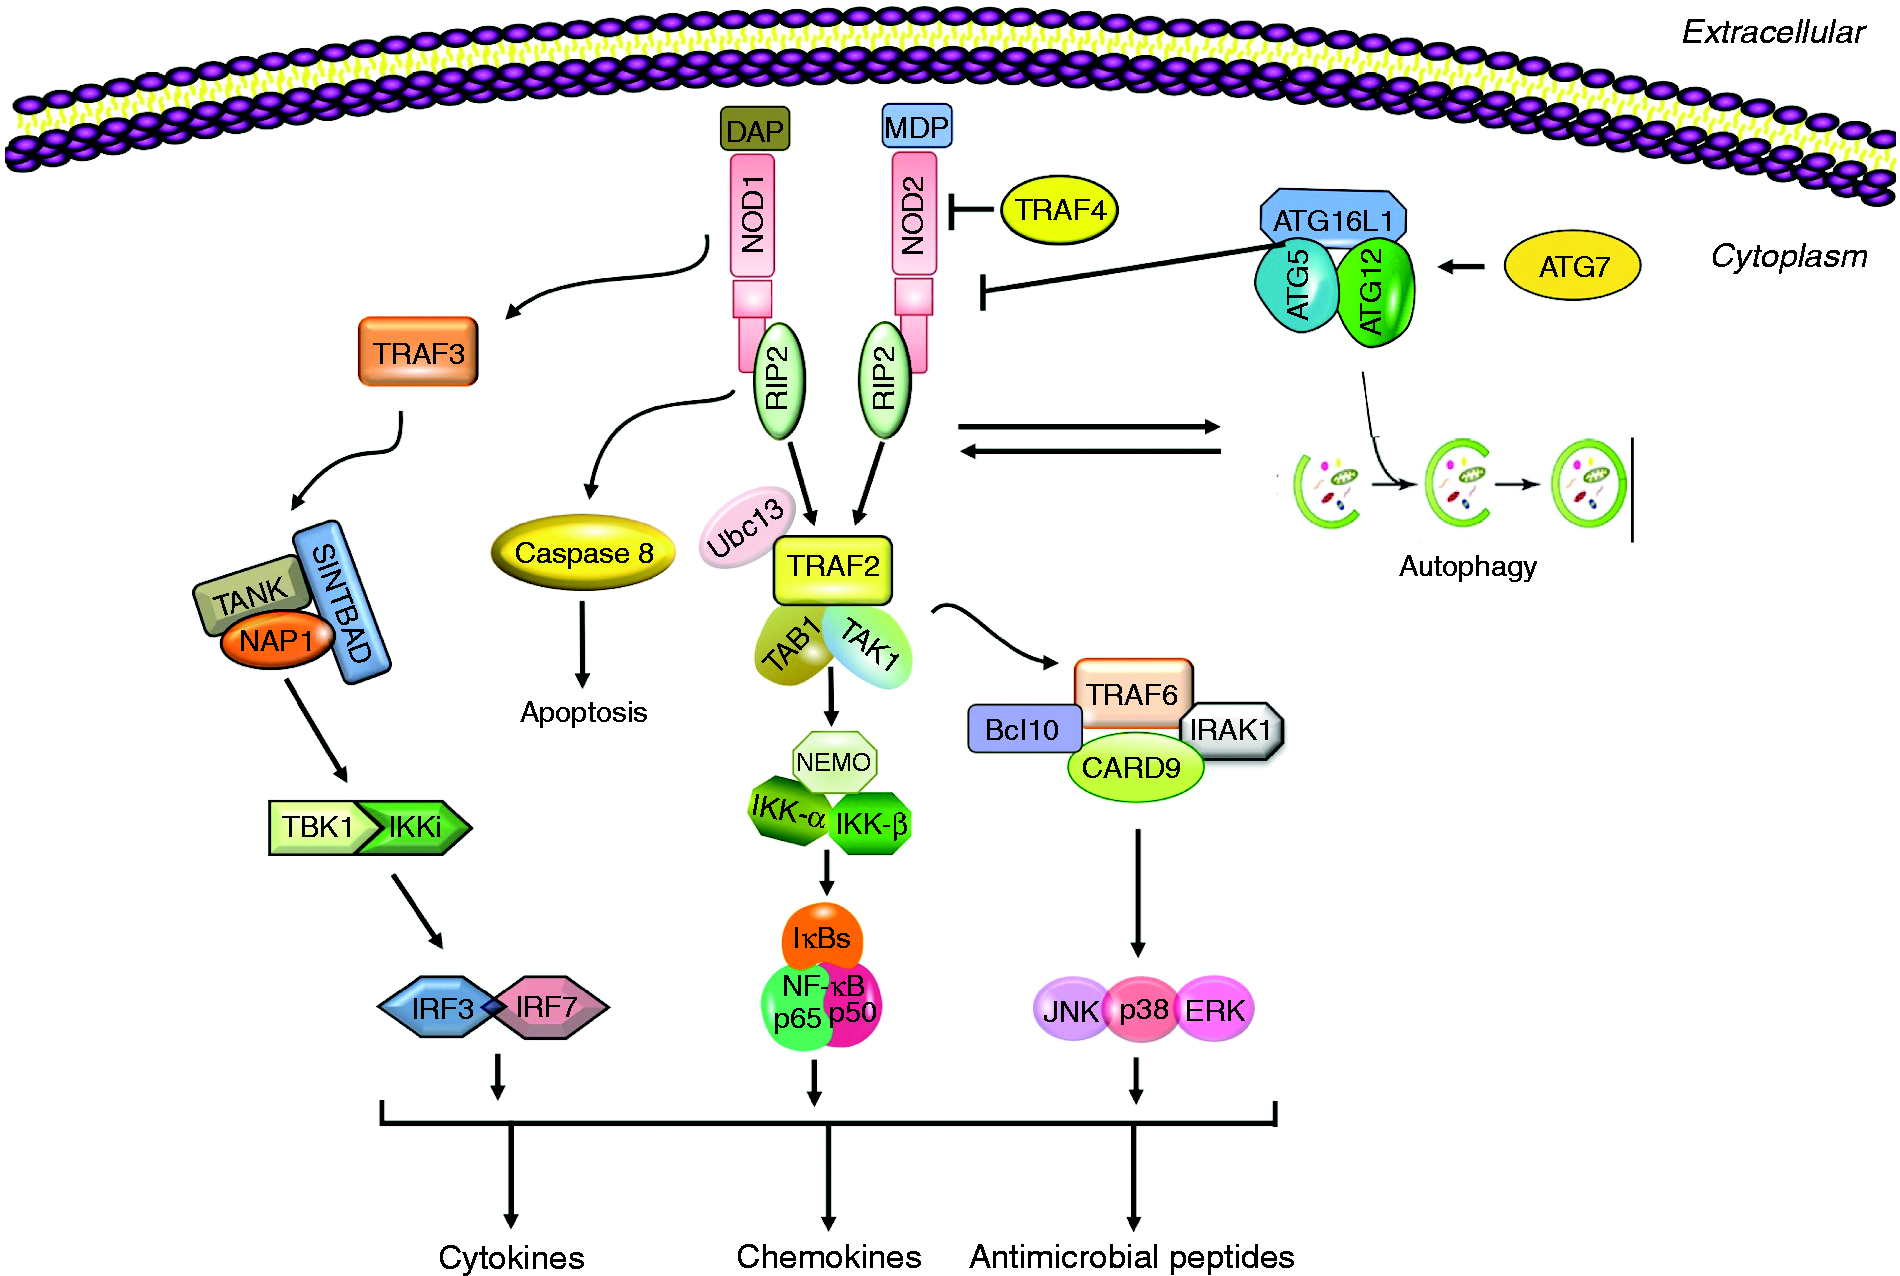
A schematic representation of NOD1 and NOD2 PRR signaling. Detection of bacterial peptidoglycan (PGN) peptides such as MDP (found in both Gram-negative and -positive bacteria) and DAP (found mainly in Gram-negative bacteria only) triggers NOD oligomerization and down-stream proinflammatory signaling pathways via the effector RIP2, leading to the production of cytokines, chemokines and antimicrobial peptides. NODs also contribute to the activation of autophagy, which can inhibit NOD2.
NOD1 and NOD2 are primarily involved in mediating antibacterial defense. NOD1 recognizes PGN-derived peptides containing γ-
NLRs play an important role in many infectious and inflammatory disorders. NOD1 and NOD2 expression was lower in otitis-prone than non-otitis subjects. 28 Studies in patients with chronic inflamed MEs found that NOD2 expression is up-regulated compared to normal. 29 Moreover, Woo et al. found that NOD2−/− mice showed reduced ME effusions and clearance 30 24 hr after NTHi inoculation of the ME, although no other time points were assessed. To further explore the role of NODs in OM we studied the roles of NOD1 and NOD2 over a complete course of acute OM induced by NTHi (Gram-negative bacteria) in mice, to determine if the NOD pathway plays a role in instigating the innate immune inflammatory mechanisms during OM. We surveyed the expression of NOD-related genes through an acute OM episode. We also evaluated OM in mice deficient in Nod1 or Nod2. We hypothesized that NOD pathway proteins are regulated during OM and that deletion of a NOD gene would alter the OM phenotype, thus revealing its role in ME infection. The ultimate goal was to increase our understanding of development of OM pathogenesis and healing, with a goal of developing new therapies for patients with this disease.
Materials and methods
Animals
Naïve 60–90 d old (25 g) NOD1−/−, NOD2−/− mice on a C57BL/6 background and age-matched C57BL/6 wild type (WT) controls were purchased from Jackson Laboratories (Bar Harbor, ME). Experiments were approved by the Institutional Animal Care and Use Committee of the Veteran Affairs Medical Center (San Diego, CA) and performed according to National Institutes of Health guidelines for the care and use of laboratory animals.
Bacteria
NTHi strain 3655 (biotype II), which was originally provided by Dr Asa Melhus (Lund University), had been isolated from the ME of a child with OM in St Louis, MO. A culture was streaked onto a chocolate agar plate and placed in a 37°C incubator overnight (18–24 hr). Two colonies were then selected and inoculated into 25 ml of brain heart infusion (BHI) media with 1 ml of Fildes enrichment (BD Diagnostic Systems). The next day, the bacterial culture was spun down at 8000 g for 10 min and the pellet re-suspended in fresh BHI media. A final concentration of 104–105 bacteria/ml was used to induce an inflammatory response in the ME. 31
Surgery
NOD1−/−, NOD2−/−, and WT control mice were deeply anesthetized with an i.p. injection of rodent cocktail (13.3 mg/ml ketamine hydrochloride, 1.3 mg/ml xylazine, 0.25 mg/ml acepromazine; at 0.1–0.2 ml per 25–30 g body mass of the mouse). A ventral midline incision was made in the neck and the ME bullae exposed. A hole was carefully drilled with a 25-gauge needle and 5 µL of NTHi inoculum were injected into the ME cavity. A sterile cotton swab was used to remove excess fluid and the wound was closed with surgical staples. The mice were given lactated Ringer’s solution and buprenorphine postoperatively through a subcutaneous injection. Mice were examined for fluid leakage into the external ear canal to ensure no penetration of the tympanic membrane had occurred. All animals were monitored after surgery until ambulatory and daily for health status until sacrifice. No adverse events occurred due to procedure. Uninoculated mice (time = 0 h) were used as an additional control.
Histology
The mice used were sacrificed under general anesthesia by intracardiac perfusion. PBS was first injected, followed by 4% paraformaldehyde (PFA). Time points were collected at 0, 6, and 12 h, and 1, 2, 3, 5, 7, 10, 14, and 21 d after NTHi inoculation. The MEs of untreated WT mice were used as baseline. The MEs were dissected and placed in 4% PFA overnight. The next day, the samples were transferred to 8% EDTA and 4% PFA and decalcified for 2 wk. The MEs were embedded in paraffin and 7 µm sections cut. Sections were stained with hematoxylin-eosin. Sections containing the largest area of the ME cavity were then digitally recorded. Mucosal thickness was analyzed by computer-averaging the thickness of the epithelium and stroma, measured at standardized locations in the ME.
From the same sections, the percent area of the ME lumen occupied by inflammatory cells was determined by image analysis by measuring the total area of the ME and area occupied by leukocyte influx. Finally, 400× images of the largest cellular infiltrates present in each ME were recorded, and the numbers of neutrophils and macrophages were counted in each image. This was performed independently by two experienced observers and the results averaged. 32
Bacterial clearance
In separate groups of mice, the MEs were opened and a sample of fluid, or mucosa scraping when the ME was dry, was obtained from the ME lumen using a 1 µm sterile inoculation loop. This was then streaked onto a chocolate agar plate. Each loop was streaked sequentially onto four quadrants for each plate. The plates were then incubated for 24 hr at 37°C. All colonies observed were consistent with NTHi morphology. The CFUs present on the plates were totaled.
A scoring system was used to categorize the degree of ME colonization. A score of 0 indicated no CFUs on the plate, 1 indicated CFUs in one quadrant, 2 indicated CFUs in two quadrants, 3 indicated CFUs in three quadrants, and 4 indicated CFUs in all four quadrants. 19 In addition, all colonies on the plate were manually counted and converted to CFUs/ml.
Macrophage phagocytosis and NTHi killing assay
For in vitro macrophage/NTHi phagocytosis and killing activity, macrophages were assessed using an established in vitro assay. 33 Primary peritoneal macrophages were obtained from six of each NOD1−/−, NOD2−/− mice and WT by i.p. injection of 3 ml 4% thioglycolate medium. Cells were harvested 3 d later by peritoneal lavage with cold RPMI 1640, containing 10% FBS, 50 U/ml penicillin, and 50 μg/ml streptomycin and β-mercaptoethanol, washed with media, enumerated, and seeded into 48-well plates at 5 × 10⁵ cells per well. NTHi were grown to mid-exponential phase then harvested and re-suspended in PBS then added at a titer of 5 × 10⁷ per well, a titer that does not saturate the cells. The tissue culture plates were centrifuged at 100 g for 5 min to enhance contact between the bacteria and macrophage cells then incubated for 1 h or 3 h at 37°C. Extracellular bacteria were then removed by washing with fresh DMEM, and then DMEM containing 10% FCS and macrophage-CSF. Gentamicin (50 µg/ml) was added to kill the remaining extracellular bacteria, and the cells were then rinsed and lysed using 0.5 ml pyrogen-free water followed by aspiration of the lysate five times through a 23-gauge syringe. Lysates were plated onto chocolate agar plates in serial dilution of 1:1 up to 1:105, and incubated overnight at 37°C. Six wells were used per time point and mouse strain condition. The recovery of intracellular bacteria after macrophage treatment with gentamicin for 1 h was used to represent phagocytosis. The ratio of bacteria recovered after gentamicin treatment of 3 h was compared to bacterial recovery at the 1 h of treatment to represent intracellular killing, as in other published assays. 19
DNA microarrays
Changes in gene expression in the ME during the course of OM in mice was evaluated using DNA microarrays, as described elsewhere. 34 Briefly, WT C57Bl/6:CB F1 hybrid mice (60–90 d old) were purchased from Jackson Laboratories (Bar Harbor, ME). Twenty mice per time point were inoculated bilaterally with NTHi strain 3655. The ME mucosae were harvested at different intervals: 0 (no treatment control), 3 h, 6 h, and 1, 2, 3, 5, and 7 d after NTHi infection. Sham-inoculated (saline) animals served as additional controls. Total RNA was extracted using TRIzol (Invitrogen, CA). The RNA quality was assessed using the RNA 6000 Labchip Kit on the Agilent 2100 Bioanalyzer to ensure the integrity of 18S and 28S ribosomal RNA. Reverse transcription of the mRNA was done using a T7-oligodT primer and T7 RNA polymerase to generate biotinylated cRNA probes that were hybridized onto two Affymetrix MU430 2.0 microarrays per time point sample. The procedures were then duplicated for each time point to obtain a second, independent replication. The raw data of gene expression levels were median normalized and statistical differences in gene transcript expression levels were evaluated using a variance-modeled posterior inference approach (VAMPIRE). 35 Individual transcript fold-level changes were visualized using Genespring (Agilent Technologies, Santa Clara, CA).
Statistical analysis
Using StatView software (version 5.0, JMP-SAS Institute), a two-tailed t-test was performed to compare WT mice with NOD1−/−, NOD2−/− mice. This was completed for each time point on mucosal thickness and ME inflammatory cells (neutrophils and macrophages). Differences between the two groups were considered to be significant at P < 0.05.
The two ears from each mouse were analyzed separately since they were found to be independent from each other. Descriptive statistics such as means were used to prepare the data obtained from the bacterial load. Semi-quantitative measures were used to evaluate this parameter.
Results
Many NOD-associated genes are regulated during acute OM
Changes in the expression of selected NOD-related genes, including both NOD signaling genes and autophagy genes, over the course of an episode of acute NTHi-induced OM in WT mice are illustrated in Figure 2. Data for all genes shown in Figure 1, as well as variability of expression, are provided in Supplemental table 1. Up-regulation of NOD signaling genes tended to peak within a few h of ME bacterial inoculation, and then decline. In contrast, autophagy gene expression peaked later during acute OM, at 1–3 d after inoculation.
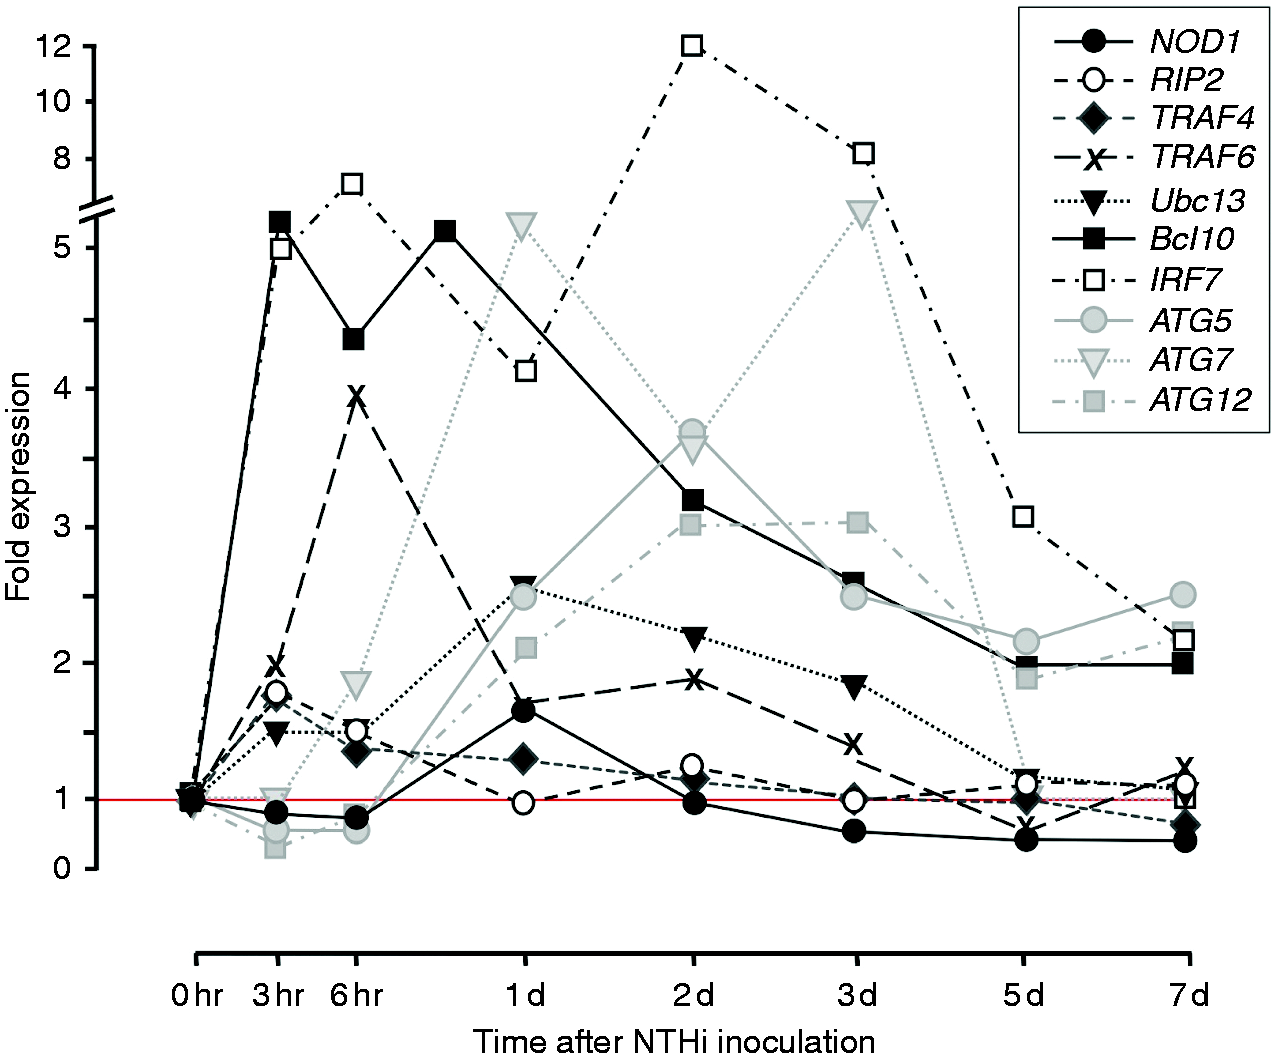
Changes in the expression of significantly regulated genes related to NOD signaling and autophagy during the course of an episode of acute OM in the mouse. Data on the range and P values, and the expression of genes encoding other proteins illustrated in Figure 1, are presented in Supplemental Table 1.
Mucosal hyperplasia during OM is enhanced in the absence of NOD1 or NOD2
Hyperplasia of the ME mucosa is illustrated in Figure 3a and b. When exposed to NTHi, WT mice exhibited characteristic, robust ME mucosal hyperplasia that reached a maximum on d 2 and 3 after inoculation and returned to normal thickness by d 10. Animals deficient in NOD1 initially showed mucosal growth similar to that of WTs, but exhibited substantially more hyperplasia at d 10. The MEs of Nod2−/− mice exhibited a more rapid increase in hyperplasia than WTs, peaking at d 1. Mucosal growth was then lower than WT at d 2 and 3, but higher at d 10.
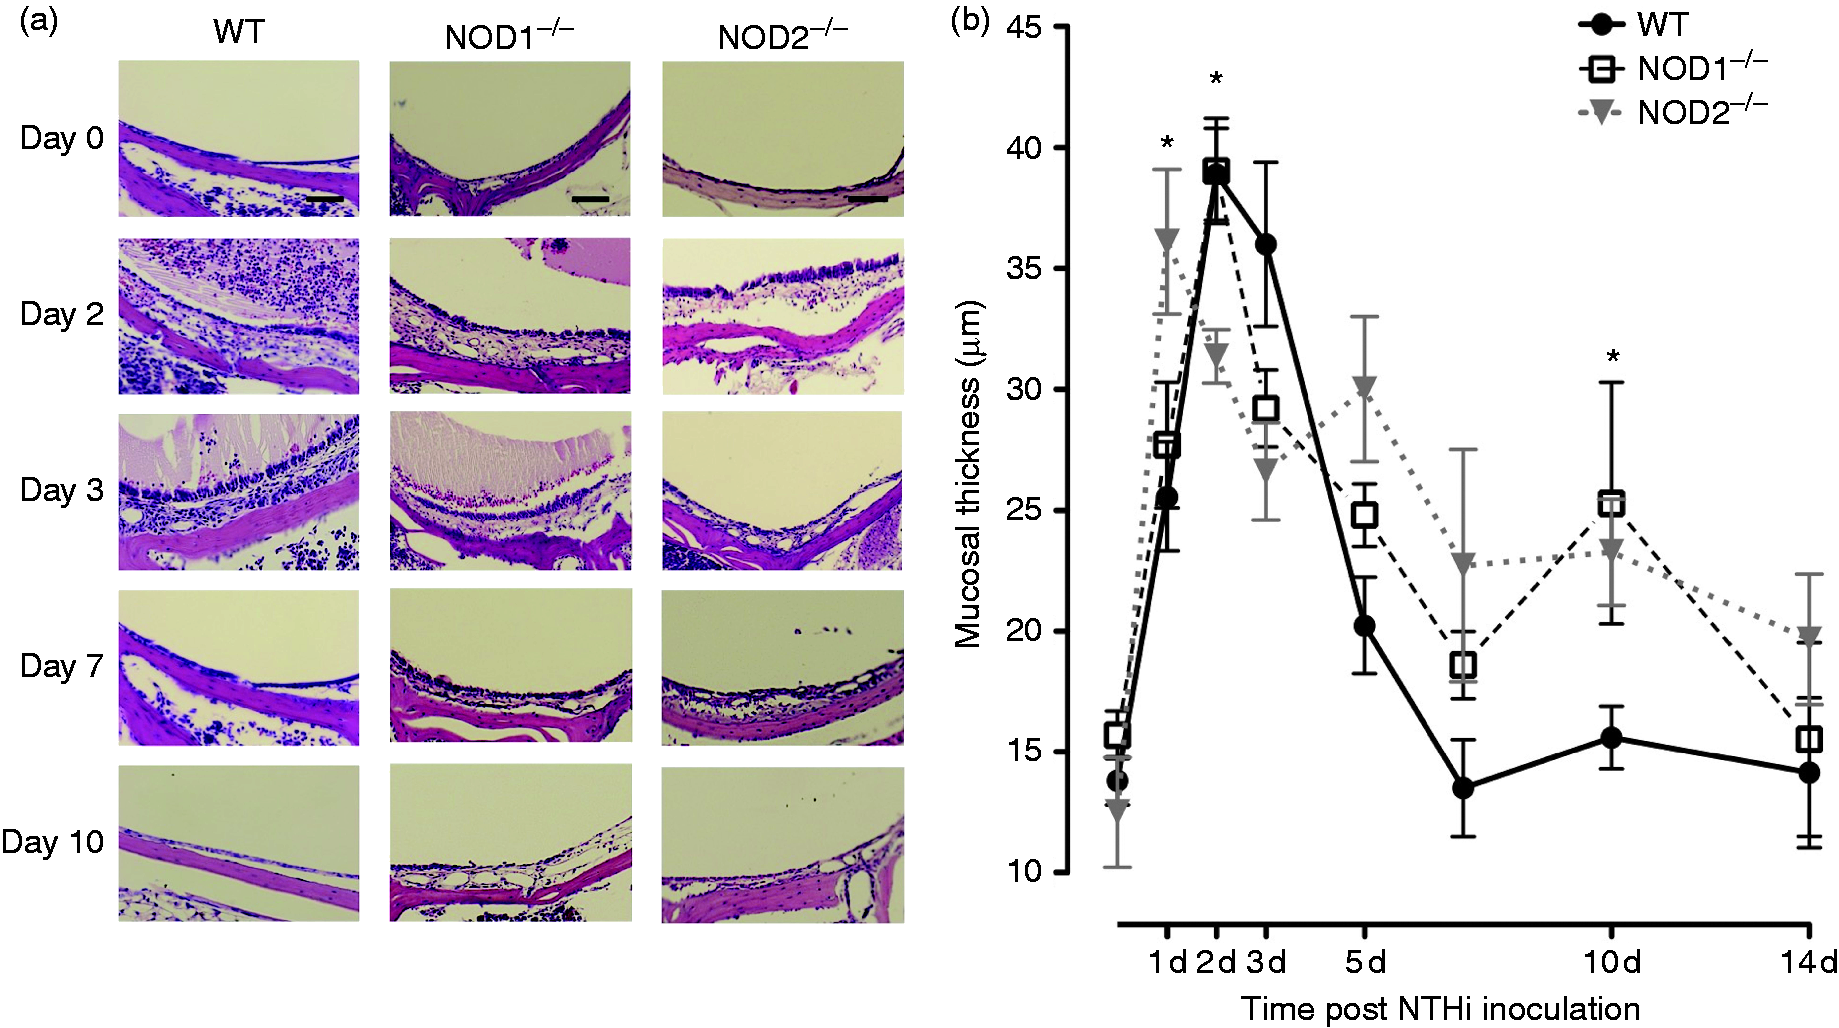
(a) Representative micrographs of the MEs mucosal responses of WT, NOD1−/−, and NOD2−/− mice during OM time course. The MEs of all three strains demonstrated a very thin mucosal layer and no cellular infiltrate in the ME cavity before NTHi inoculation. By d 2 and 3 after inoculation, the MEs of WT and NOD1−/− mice were infiltrated by inflammatory cells and effusion with squamous hyperplasia, while NOD2−/− mice showed fewer ME leukocytes and delayed mucosal hyperplasia. Scale bars represent 50 µm. (b) A quantitative evaluation of mucosal thickness of the ME cavity throughout the course of OM. The MEs of WT, NOD1−/−, NOD2−/− mice showed similar degrees of mucosal thickness on d 1 but a thinner mucosa was evident on d 2 for NOD2−/− mice. The mucosal layer of WT mice returned to basal thickness by d 7, meanwhile on d 10, the mucosa of NOD1−/− and NOD2−/− mice was still thicker than that of WT animals.
NOD deletion alters OM-associated leukocyte recruitment to the ME
In WT mice, the highest percentage of the ME lumen occupied by infiltrating leukocytes (Figure 4a) was observed on d 2 and 3 after NTHi inoculation, and cells persisted in the ME through d 5. In the absence of NOD1 the initial recruitment of leukocytes was delayed, with a peak at d 3. Lack of NOD2 resulted in an overall reduction in the influx of leukocytes with a peak at d 2.
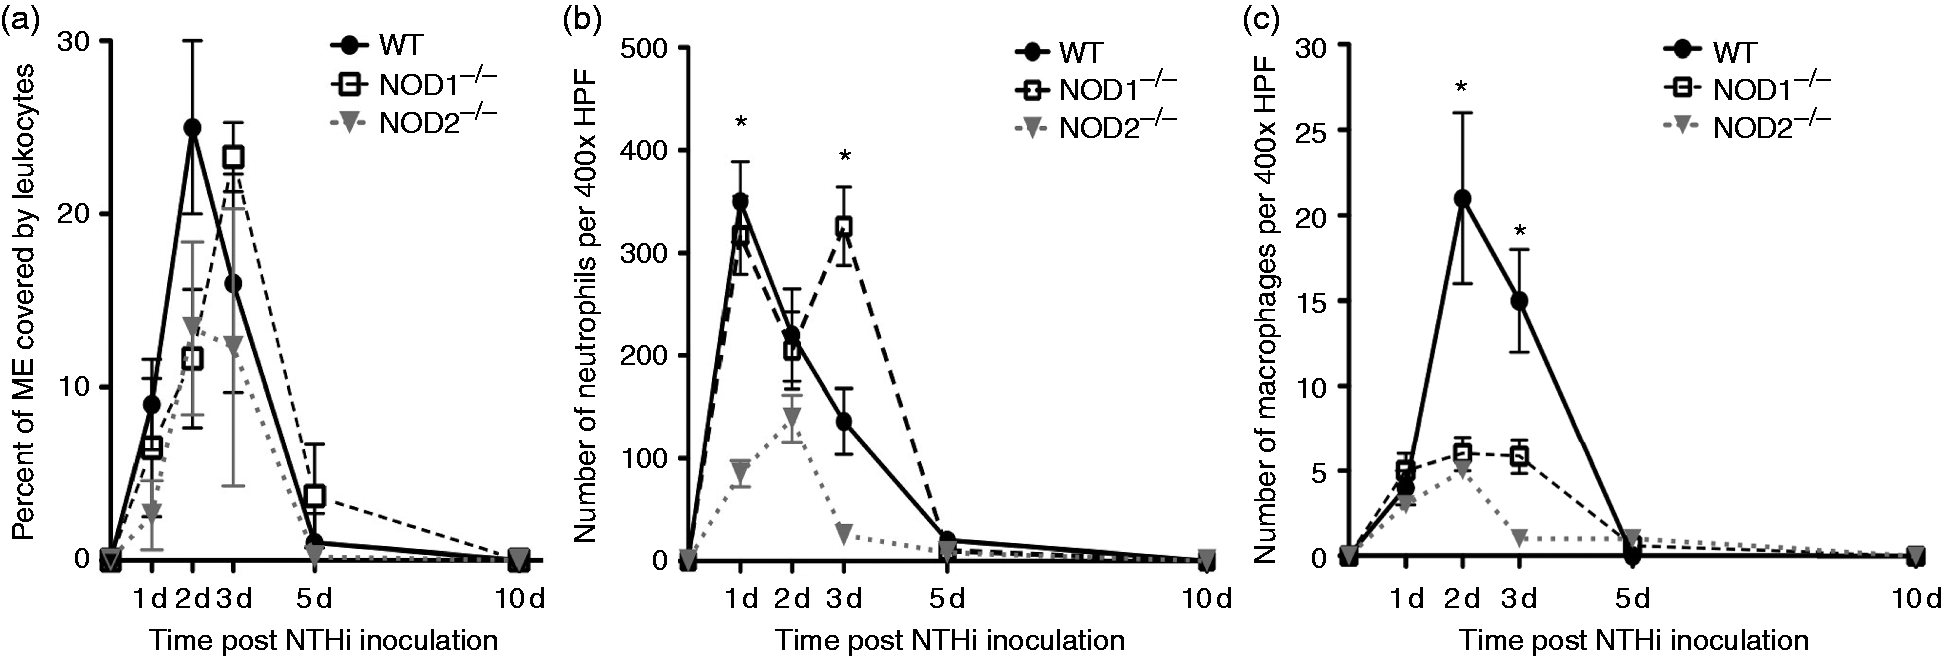
Infiltration of the ME cavity by leukocytes after non-typeable H. influenzae inoculation. (a) Percentage of the ME was occupied by inflammatory cells. Inflammatory cells occupied a greater percentage of the ME in WT mice compared to NOD2−/− mice during the experiment NTHi infection time course. Leukocyte infiltration was substantially delayed in NOD1−/− mice, peaking on d 3 after NTHi inoculation. (b) Leukocyte numbers for neutrophils measured in ME infiltrates in WT and NOD1−/− and NOD2−/− mice. WT mice showed peak neutrophil numbers by d 1 after infection with NTHi that declined by d 5. Neutrophils showed a striking, late influx on d 3 for the NOD1−/− mice. (c) Numbers for macrophages measured in ME infiltrates in WT and NOD1−/−, NOD2−/− mice. Macrophages were recruited to the ME on d 2 and 3 after NTHi infection in WT mice, with few or no macrophages noted on d 5 and 7. Both NOD1−/−, NOD2−/− mice showed significantly reduced numbers of ME macrophages overall (n = 6–8 MEs per time point; bars represent ± SEM; *P < 0.05).
Neutrophils (Figure 4b) appeared early in ME infiltrates of WT mice, peaking at d 1. The number of neutrophils observed in the cellular infiltrates of NOD1-deficient MEs at this time was similar to that of WTs, but was significantly higher (P < 0.05; Mann–Whitney U-test) on d 3. In contrast, NOD2−/− MEs showed substantially fewer neutrophils than WTs on d 1 and 3 (P < 0.05; Mann–Whitney U-test).
Macrophages (Figure 4c) occurred later in the ME infiltrates of WT MEs, peaking at d 2. Both NOD1- and NOD2-deficient MEs showed fewer macrophages on d 2 (P < 0.05; Mann–Whitney U-test).
Bacterial clearance is delayed in NOD−/− mice
Next, we assessed the in vivo ME bacterial clearance in WT and both NOD-deficient mice (Table 1). Unsurprisingly, neither NOD-deficient nor WT mice showed the presence of bacteria in the ME on d 0, prior to challenge with NTHi. For the first 2 d post NTHi-inoculation, MEs of WT mice showed robust culture positivity. However, by d 3 WT ME cultures had declined bacterial load to very low levels, and from d 7 onward no NTHi were detected.
Impaired bacterial clearance of NOD1−/−, NOD2−/− MEs. No CFUs were detected by d 5 after NTHi inoculation in WT C57BL/6 mice. Bacterial clearance was impaired in NOD1−/−, NOD2−/− mice until 10 d after inoculation. NTHi was isolated from more than half of the MEs by d 7 and all bacteria cleared by d 14. Mean bacterial colonization of the culture positive plates was evaluated using a semi-quantitative analysis of bacterial colonization: 0 indicates no CFUs, 1 indicates one quadrant with CFUs, 2 indicates two quadrants with CFUs, 3 indicates three quadrants with CFUs, and 4 indicates four quadrants with CFUs. Data represent culture positive plates out of six.
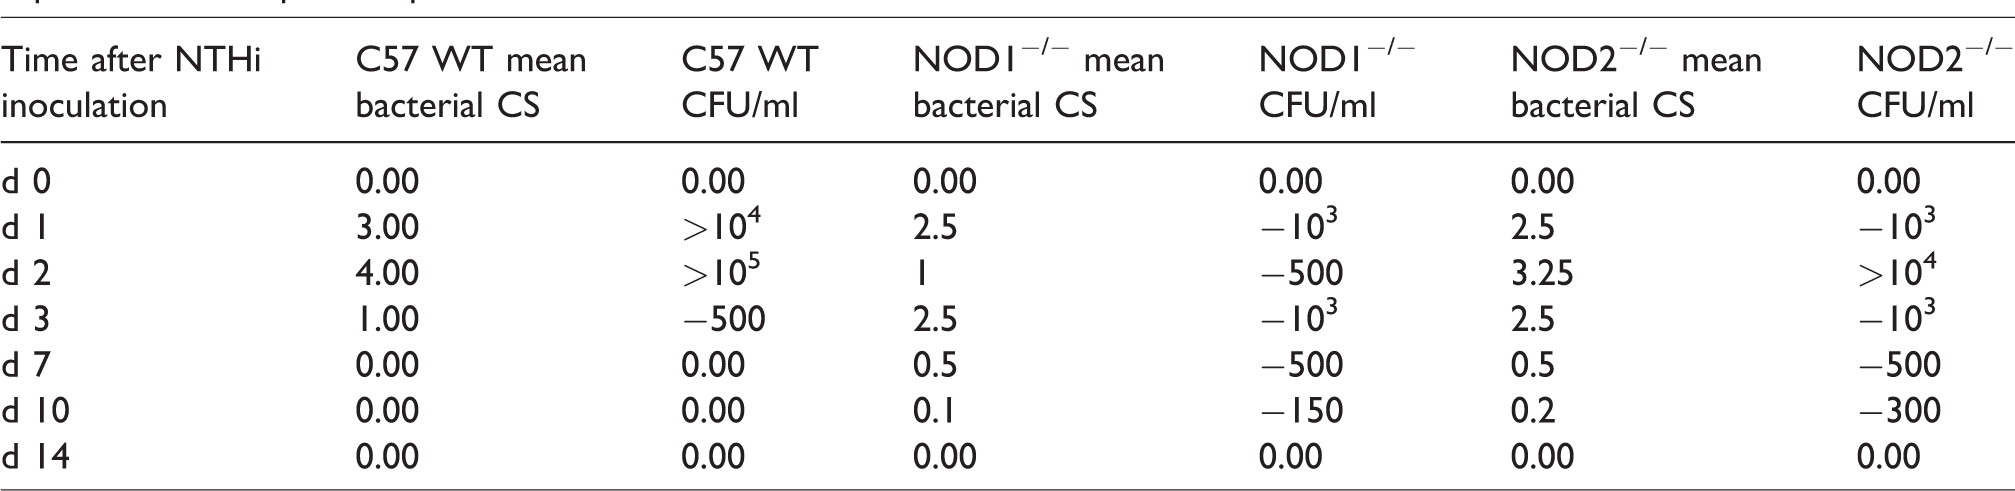
In contrast to WT, both NOD1 and NOD2 deficient MEs exhibited higher NTHi culture levels than seen in WT MEs on d 3, followed by levels declining yet remaining positive on d 7 and 10 (P < 0.05, Mann–Whitney U-test). Hence, the persistent inflammation seen in the MEs of these knockout (KO) mice, as evident by mucosal hyperplasia and leukocytes infiltration, was related with compromised capacity to clear NTHi in a timely manner like in the WTs. However, by d 14 the MEs of both KO strains had cleared.
Macrophages intracellular killing is enhanced by lack of NOD1
In the in vitro phagocytosis and killing assay, peritoneal macrophages derived from WT, NOD1−/−, and NOD2−/− mice were incubated with NTHi for 1 h to assess their phagocytic capacity. As shown in Figure 5, recovery of bacteria from NOD1−/− and NOD2−/− macrophages at 1 h was similar to that seen in WT mice; the increase in phagocytosis seen in NOD−/− was not statistically significant. However, compared to WTs, NTHi recovery at 3 h was significantly less than in WTs for macrophages lacking NOD1. This is consistent with enhanced intracellular killing.
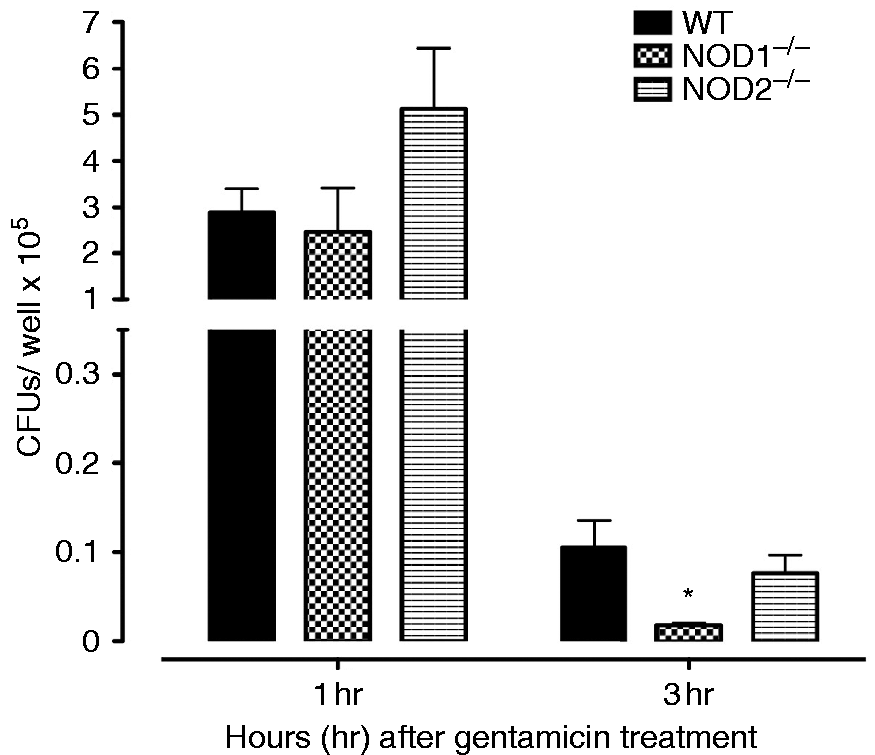
Phagocytosis and killing of NTHi bacteria was assessed in peritoneal macrophages from WT, NOD1−/−, and NOD2−/− mice by quantifying the colony counts remaining after loading with NTHi and then 1 h (phagocytosis) or 3 h (killing) incubation with gentamicin to destroy all extracellular bacteria. Bars represent bacteria recovered after lysis of the macrophages. Values at 1 h were comparable across strains. However, significantly fewer NTHi were observed after 3 h for NOD1−/− macrophages, suggesting enhanced intracellular killing. Experiments were performed in triplicate and expressed as mean ± SEM. *Significantly different than WT mice (P < 0.05).
Discussion
During NTHi-induced OM, we observed the regulation of many genes related to NOD signaling. Notably, NOD deficiency dysregulated and prolonged mucosal hyperplasia plus bacterial outgrowth from the ME. Lack of NOD1 prolonged the infiltration of the ME by neutrophils, while NOD2 deficiency reduced neutrophil infiltration. Deletion of either NOD reduced macrophage infiltration. These changes were associated with delayed clearance of bacteria from the ME. Interestingly, intracellular killing of NTHi by macrophages was enhanced by lack of NOD1.
The NODs act primarily intracellularly. While NTHi is generally thought of as an extracellular pathogen of the respiratory tract, intracellular bacteria have been observed in ME epithelial cells of patients during OM. 36 Woo et al. found that NTHi are internalized into a human ME epithelial cell line (HMEE). 30 Internalization of NTHi has also been observed experimentally in cultured human laryngeal epithelial cells (HEp-2), 37 and in animal ME mucosa in vivo. 38 In addition, it has been reported that the NOD2-activating ligand MDP can enter epithelial cells using an active transport mechanism via the hPepT peptide transporters (SLC15As), which are specific for MDP and do not have the capacity to transport the NOD1-activating ligand iE-DAP. 39 However, Gram-negative bacteria shed outer membrane vesicles, which have been shown to enter non-phagocytic epithelial cells and activate the NOD1 signaling pathway. 40 These observations support the access of bacteria and bacterial ligands to cytoplasmic NODs during OM.
While the NOD receptors have been less studied than the TLRs, their participation in bacterial infections at many sites has been well established. This includes in pneumonia, 41 nasal polyposis, 42 and chronic obstructive pulmonary disease. 43 It is therefore not surprising that they contribute to the innate immune defense of the ME. The effects of NOD deletion on the persistence of ME mucosal hyperplasia seem likely to reflect the decreased clearance and increased persistence of NTHi in these mice.
It should be noted that differences in NOD expression or polymorphisms in NOD genes have been associated with cancer of the lung, 44 breast, 45 and intestine, 46 and with the ME proliferative disorder cholesteatoma. 47 It has been hypothesized that such polymorphisms may tip the balance between the apoptosis and survival-promoting effects of NOD stimulation. 22 In the case of NOD1, which is expressed in many cell types, such an effect might contribute to enhanced mucosa hyperplasia.
Genes related to NOD signaling tended to peak quite early in OM and then decline, consistent with a role in the early detection of and response to NTHi. This undoubtedly contributes to the expression of cytokine, chemokine and antimicrobial protein genes that we 34 and many others have previously documented during OM. In contrast, expression of autophagy genes peaked later (Figure 2). Autophagy is known to play a critical role in macrophage bacterial phagocytosis, 48 and macrophages tend to enter the ME late during acute OM. 19 However, autophagy is also involved in limiting inflammation through a variety of mechanisms, 48 including the inhibition of NOD2 signaling (Figure 1). Late expression of autophagy genes is consistent with an active role in recovery from OM-induced inflammation.
Deletion of either NOD1 or NOD2 led to decreased recruitment of macrophages, and in the case of NOD2 PMNs, to the ME during OM. As chemokine genes are a major down-stream target of activated NODs (Figure 1), this result is not surprising. Perhaps the most unexpected finding of this study was the enhancement of macrophage intracellular bacterial killing by NOD1 deletion. When the peripheral monocytes enter the infected ME, they are continuously exposed to bacterial products. As an intracellular receptor, one might expect the NODs to play an important role in the recognition of bacteria within the cell, and the initiation of bactericidal action. Our data suggest that macrophage intracellular killing is mediated by other PRRs such as the TLRs. Interestingly, it has been found that under certain circumstances, activation of NODs can down-regulate TLR pathways. 49 In prior studies we have shown that TLR signaling via MyD88 is essential for efficient phagocytosis and killing by macrophages. 19 NOD1 down-regulation of TLRs during OM could explain why deletion of this NOD leads to enhanced killing of NTHi by macrophages.
Deletion of NOD1 or NOD2 had overlapping effects on OM induced by NTHi infection, which would be expected given that both receptors respond to Gram-negative bacteria. It is believed that NOD1 is a back-up of NOD2 in that bacteria that produce NOD2 agonists can also activate NOD1. 50 Our study shows that deletion of either receptor prolonged ME infection and pathology, reduced bacterial clearance from the tympanic cavity, reduced macrophage recruitment to the ME during OM, and enhanced intracellular killing of NTHi by macrophages in vitro. However, there were also differences between deletions of the two receptors. The variation observed between the effects of NOD1 versus NOD2 deletion may reflect, in part, on the differences in their cellular expression. NOD2 expression is predominantly limited to myeloid cells. 25 It is thus not surprising that we observed somewhat greater effects of its deletion on the recruitment of leukocytes, and upon bacterial phagocytosis by macrophages.
Conclusions
Given the strong expression of NOD-related genes and the effects of NOD deletion, our results indicate a significant involvement of these innate immune receptors in the resolution of OM. It also seems possible that altering the activity of NOD receptors in the ME might provide a means of increasing the immunogenicity of vaccines or, reducing the duration and possibly the incidence of OM. Modification of NOD ligands to increase or decrease receptor activity have shown promising results.51,52
Supplemental Material
Supplemental material for NOD1/NOD2-mediated recognition of non-typeable Haemophilus influenzae activates innate immunity during otitis media
Supplemental Material for NOD1/NOD2-mediated recognition of non-typeable Haemophilus influenzae activates innate immunity during otitis media by Jasmine Lee, Anke Leichtle, Emily Zuckerman, Kwang Pak, Meghan Spriggs, Stephen I Wasserman and Arwa Kurabi in Innate Immunity
Footnotes
Declaration of conflicting interests
The author(s) declared no potential conflicts of interest with respect to the research, authorship, and/or publication of this article.
Funding
The author(s) disclosed receipt of the following financial support for the research, authorship, and/or publication of this article: This research was supported by the NIH/NIDCD (Grant Nos. DC014801, DC000129, and DC006279) and by the Research Service of the VA.
Supplemental material
Supplemental material is available for this article online.
References
Supplementary Material
Please find the following supplemental material available below.
For Open Access articles published under a Creative Commons License, all supplemental material carries the same license as the article it is associated with.
For non-Open Access articles published, all supplemental material carries a non-exclusive license, and permission requests for re-use of supplemental material or any part of supplemental material shall be sent directly to the copyright owner as specified in the copyright notice associated with the article.