
Abstract
Mycobacterium tuberculosis (Mtb), is a highly infectious airborne bacterium. Previous studies have found vitamin D3 to be a key factor in the defense against Mtb infection, through its regulation of the production of immune-related cytokines, chemokines and effector molecules. Mycobacterium smegmatis was used in our study as a surrogate of Mtb. We hypothesized that the continuous presence of vitamin D3, as well as the level of severity of infection would differentially modulate host cell immune response in comparison with control and the vehicle, ethanol. We found that vitamin D3 conditioning promotes increased bacterial clearance during low-level infection, intracellular containment during high-level infection, and minimizes host cytotoxicity. In the presence of vitamin D3 host cell production of cytokines and effector molecules was infection-level dependent, most notably IL-12, which increased during high-level infection and decreased during low-level infection, and NO, which had a rate of change positively correlated to IL-12. Our study provides evidence that vitamin D3 modulation is context-dependent and time-variant, as well as highly correlated to level of infection. This study furthers our mechanistic understanding of the dual role of vitamin D3 as a regulator of bactericidal molecules and protective agent against host cell damage.
Keywords
Introduction
Tuberculosis (TB), caused by the bacterium Mycobacterium tuberculosis (Mtb), is a global health crisis affecting over nine million people worldwide and causing over one million deaths per year. 1 Mtb is a highly infectious airborne bacterium and is transmitted from person to person via droplets expelled from the throat and lungs of those with active respiratory disease. 1 Mtb has a myriad of pathogen-associated molecular patterns (PAMPs) that can be recognized by macrophage internal and external pattern recognition receptors (PRRs), resulting in the activation of an innate immune response. One of the first responders to Mtb respiratory infection are alveolar macrophages, which identify the bacterium as foreign through complement-mediated opsonization, mannose receptors, pulmonary surfactant proteins, phosphatidylinositol glycan-linked membrane protein CD14 and several other methods.2,3 Bacteria are then phagocytosed by alveolar macrophages or engaged by antimicrobial proteins such as cathelicidin (LL-37) and defensin-β-4 (DEFB4) as part of the innate immune response.4,5 Depending on the effectiveness of the host immune response, the bacterium may be cleared following the formation of the phagolysosome, production of antimicrobial proteins and the subsequent activation of an adaptive response to infection. The alternative outcome is that the bacteria resist elimination, replicate within host cells, eventually causing them to burst and allow for further spreading of the infection; ultimately, this outcome results in the bacterium’s transmission via cough or sneeze to the next host. 5 Current therapeutic regimens aim to control active disease through the use of antibiotics of which isoniazid and rifampin are the backbone.4,6,7 Additionally, for some cases supplemental therapies that may augment the host’s innate and adaptive immune responses are also integrated into treatment of patients with TB, such as direct micronutrient supplementation with vitamin D3 or indirect supplementation by increased exposure to sunlight. 4 Vitamin D3 has been found to have a profound effect on the production of several key immune-regulating cytokines, including, but not limited to, TNF-α, IL-68 and IL-10, 9 as well as IL-1β·5 Vitamin D3 is thought to reduce the production of pro-inflammatory cytokines such as TNF-α, IL-6 and IL-1β and increase the production of anti-inflammatory cytokines like IL-10. Vitamin D3 encourages activation of macrophage cells and the formation of multinucleated giant cells, commonly present in TB granulomas. 10 Previous studies, as well as our current study, have found that exposing host cells to vitamin D3 results in enhanced immune response to infection and greater host cell preservation.4,5,8–10
An effective innate immune response is critical to disease outcome upon infection. Macrophages, specifically alveolar macrophages, are an integral part of the innate response and are an important line of defense in Mycobacterium infection. Macrophages are known to express vitamin D3 receptors (VDR) and are able to produce the enzyme Cyp27B1 (1α-hydroxylase), which converts 25-hydroxyvitamin D3 to biologically active 1α,25-dihydroxyvitamin D3.11,12 The inactive form, 25-hydroxyvitamin D3, accounts for the majority of vitamin D3 circulating throughout the host body, though the active form incites a much more acute response. Classically, vitamin D3 is commonly associated with the absorption of calcium and phosphorous; however, interest in its non-classical role in immune regulation has become increasingly important, particularly given the high rates of vitamin D3 deficiency in the adult population.11,13–15 The modulation of the immune response by vitamin D3, leads to a more effective innate and adaptive response, equipping the host to deal with infection while preserving host cells. While it is known that vitamin D3 is able to modulate macrophage effector response and influence the production of several chemokines and cytokines, the mechanism through which this modulation occurs is not well understood. Some studies have concluded that vitamin D3 can act as a transcription factor, binding to vitamin D response elements (VDRE) on the promoter of the gene of interest; however, further immune mechanisms concomitant with VDRE activation have not been extensively investigated.
Vitamin D3 is a well-accepted immune modulator of several macrophage products and is commonly thought to down-regulate pro-inflammatory cytokines such as IL-1216 and TNF-α, 17 and up-regulate anti-inflammatory cytokines such as IL-10, 14 and antimicrobial peptides like LL-3718 and DEFB4. 12 Though LL-37 and DEFB4 production are heavily dependent on vitamin D3 in humans, in mice that is not the case; although mice do produce a murine cathelicidin called CRAMP it is not regulated by vitamin D3. 19 IL-12 plays an important part in the development of cell-mediated immune response to intracellular bacterial infections. It is released primarily by APCs and acts as a link between innate and acquired immunological responses by inducing the differentiation of antigen-specific T cells of Th1 phenotype and the release of IFN-γ from activated T cells and NK cells. 20 TNF-α is primarily produced by macrophages. TNF-α is induced in response to infection, and is involved in fever, apoptotic cell death, cachexia and inflammation. TNF-α is critical to the Th1 cell-mediated response and its dysregulation can cause serious harm to the host. 20 IL-12 and TNF-α are believed to be down-regulated in the presence of vitamin D3, as are most Th1 responses. 11 The primary function of IL-10 is to limit inflammatory response, skewing the host cell to a Th-2 anti-inflammatory response and thus aiding in the preservation of host cells. In addition, IL-10 is able to regulate growth and differentiation of immune cells, along with several other functions of immune maturation and regulation, and is thought to be up-regulated in the presences of vitamin D3.21–23
In addition to cytokine modulation, vitamin D3 is believed to modulate phagocytic products and effectors such as NO and H2O2, 24 which aid in the destruction of the pathogen. H2O2 and its metabolic precursor superoxide (O2–) are produced by the macrophage and mainly sequestered inside of the Mtb-containing phagosome. These reactive oxygen species are produced in response to phagocytic stimuli or certain soluble agents, such as lipoarabinomannan (LAM). LAM, a primary virulence factor for Mycobacterium, enables the bacteria to infect macrophage cells. It also plays a role in mycobacterium’s ability to evade host immune response by preventing apoptosis of host cell, and the fusion of the phago-lysosome. 25 H2O2, along with NO acts inside the phagocyte to break down the consumed intracellular bacteria. NO is a diffusible radical gas produced by the transcription of inducible nitric oxide synthase (iNOS; murine) or NOS2/NOS3 (human), and the subsequent activity of NOS. Reactive nitrogen species are generated by NOS, and these species act as antimicrobials protecting the host against a myriad of pathogens. Previous studies revealed that NO production is elevated in surgically resected tuberculosis infected human lungs, though the effects of this increased production remain unclear. 26 H2O2 and NO are believed to be up-regulated in the presence of vitamin D3.24,25
Previous studies on the role of vitamin D3 and its modulation of host response have shown increased anti-inflammatory cytokines and effector substrates during innate immune response; however, many of these studies investigated only single, often dissimilar, levels of infection.5,8,9,25,27–30 There is currently not a well-established in vitro model of macrophage immune modulation by vitamin D3 and the data regarding the kinetics of this process are scarce. Studies have provided a better understanding of the activation potential of vitamin D3 for host cell, as well as the cytokine response vitamin D3 is able to induce in the presence of Mycobacterium infection. However, there remains a need for more quantitative data on the dynamic impact of vitamin D3 on host response to infection.9,27 While the immunomodulatory effects of vitamin D3 and its production of cytokines through effector immune cells is generally accepted to be dependent on the presence of infection, prior studies overlooked the possible ramifications that severity of infection could have on vitamin D3’s ability to enact response. Additionally, the majority of studies collected samples and investigate the host response at a single, usually end-stage, time point vs. quantifying vitamin D3’s modulation of the host response throughout the study. Furthermore, minimal consideration has been given to the potential immune modulatory effects of the vehicle and biochemical process through which vitamin D3 is delivered.9,12
The current study addresses several of the limitations of current vitamin D3 studies and develops an in vitro Mycobacterium murine infection model to quantify the role of vitamin D3 in dynamic modulation of the macrophage response to infection and investigates the possible mechanisms through which immunomodulation occurs. We utilized Mycobacterium smegmatis, a less virulent surrogate of Mtb commonly used as a model organism for the study of Mtb, as the bacterium for our experimental protocol. 31 While M. smegmatis is typically non-pathogenic compared with M. tuberculosis or Mycobacterium bovis, it shares similar cell structure and metabolic characteristics, including a mycolic acid cell wall and relatively low response to antibiotics.32–34 Although typically the virulence of M. smegmatis is minimal compared with Mtb or M. bovis BCG, the infection level used in this study compounded with the use of the J774 cell line resulted in a pathogenic model of infection, with uncontrolled bacterial growth and cell death in our in vitro model. As such, we were able to use this model to investigate the role of vitamin D3 in modulating host response to mycobacterial infection. Results of the study demonstrate that modulation of immune cell behavior by vitamin D3 correlated directly to level of infection. We found that the generally accepted supposition of down-regulation of IL-12 and up-regulation of IL-10 in the presence of vitamin D3 may be an over simplification of the effects of vitamin D3, rather we observed a modulatory pattern dependent on the level of bacterial infection and vitamin D3 availability. In prior studies vitamin D3 was thought to bias immune response towards Th2 and hinder Th1 response. 11 We have found in our studies that this is not always the case, and that vitamin D3’s modulation of the immune system is much more complex and protean than originally accepted, notably observing that variations in TNF-α production was in response to the level of infection only, irrespective of conditioning with ethanol or vitamin D3. Overall, our observations support the hypothesis that vitamin D3 modulates the production of immunologically relevant cytokines and effector molecules in response to level of Mycobacterium infection in a manner that consistently results in increased clearance of bacterial load in cells conditioned with vitamin D3, as well as decreased host cell cytotoxicity. Our study allows for a broader view of the interconnected effects of vitamin D3 on immune response. Elucidating the mechanism through which vitamin D3 is able to dynamically modulate the immune response of host cells will provide insight into the ramifications of host vitamin deficiency during infection, and aid in the identification of vitamin D-associated therapies to enhance host immune response to TB.
Materials and methods
Host cell adherence, vitamin D3 conditioning and infection
Murine J774A.1 cell line (TIB-67 ATCC) was maintained at 37°C and 5% CO2 in Dulbecco's Modified Eagle Medium (DMEM) containing 10% FBS, 1% penicillin-streptomycin (pen/strep) and 1%
Bacterial culture
M. smegmatis (gifted from Graviss Lab, Houston Methodist Research Institute, TX, USA) was grown from frozen stock in Middlebrook 7H9 media using Hardy Diagnostics 7H9 dehydrated culture media (C6301), containing 0.2% glycerol, 10% OADC and 0.05% Tween-80. After undergoing one subculture bacteria was grown to late growth phase and used to infect host cells.
Host cell infection and vitamin D3 conditioning
DMEM complete without pen/strep was prepared containing either (i) 4 ng/ml 1,25-dihydroxyvitamin D3, (ii) an equivalent amount of 1,25-dihydroxyvitamin D3 solvent, ethanol, or (iii) unconditioned media (Figure 1). Molecular biology grade ethanol was used as a control for the vitamin D3 solvent, to determine any effect ethanol might inadvertently have on the system. J774A.1 murine were infected at an MOI of 1:10 and 1:100 host cells to bacteria, respectively, achieving the pre-requisite high and low infection condition states. Both high and low infections were performed in duplicate, creating biological replicates. M. smegmatis was centrifuged at 250 g for 10 min and then re-suspended to a desired concentration in the DMEM complete media without pen/strep conditioned and non-conditioned media. The supernatant was removed from six-well and 24-well plates and replaced with conditioned and non-conditioned media containing bacteria. Cells were then incubated at 37°C and 5% CO2 for 1 h. After infection was complete supernatant was removed and host cells were washed twice with PBS, then conditioned and unconditioned media containing 50 µg/ml of gentamicin was added to wells followed by 1 h of incubation. After incubation with gentamicin plates were washed with PBS twice and fresh conditioned and non-conditioned DMEM complete was added to appropriate cells. Cells were then incubated for 74 hours (h), with samples collected at hour 0, 8, 16, 24, 34, 44, 54, 64 and 74 post-infection.
Experimental set-up. Chart displaying experimental setup and layout of cell conditioning and infection.
Sample collection and preparation
At hour 0, 8, 16, 24, 34, 44, 54, 64 and 74 post-infection, supernatant from 24-well plate was collected and serially diluted 10-fold. Dilutions were then plated on 7H11 agar plates (C6292; Hardy Diagnostics, Santa Maria, CA, USA) to quantify the extracellular bacterial load. After 72 h incubation, countable CFU were enumerated to determine extracellular and intracellular bacterial load. It should be noted that at hour 0 extracellular counts were present; this is caused by a delay between incubation of cells with gentamicin, wash steps and hour 0 sample collection. This delay is due to the time required to process all wells, which permits the infection to progress prior to hour 0 sample collection time. Hence, the hour 0 time point is relative, and represents the first time point sampled and evaluated. Wells were washed once with PBS then incubated with 1% Triton X-100 for 10 min, to allow cells to lyse. The lysate was then collected, serially diluted 10-fold and plated on 7H11 agar plates to quantify intracellular bacterial load. 7H11 plates were counted 3 days after plating the sample to quantify intracellular and extracellular loads. From the six-well plates we collected supernatant, which was stored at –80°C and later used for cytokine and reactive species quantification.
Assays
Using supernatant collected from the six-well plates, ELISA assays for TNF-α, IL-10 and IL-12(p70) (EK0527, EK0417, EK0422; BOSTER, Pleasanton, CA, USA) were performed in accordance with manufacturers’ instructions with a sensitivity of less than 15 pg/ml. Griess reagent (G2930; Promega, Madison, WI, USA) was utilized to quantify NO levels by measuring nitrite, NO2–, concentrations. LDH cytotoxicity assay (88954; Pierce, Rockford, IL, USA), performed in accordance with manufacturers’ instructions, was used to quantify cell death; known concentrations of host cells were lysed and subsequent linear regression applied to assay readings to determine amount of cell death. A Hydrogen Peroxide Assay Kit (ab102500; Abcam, Cambridge, UK) was utilized to quantify H2O2 concentrations. All assay concentrations values were obtained by averaging duplicate wells.
Statistical analysis
Statistical analysis chart. Explanation of the statistical analysis performed on data and which figures utilize that data.

Results
Comparing the temporally changing ratios of vitamin D3-conditioned cells to control cells suggests vitamin D3 not only modulates bioavailability, but also the potential rate of cytokine and effector molecule production. This variation in the availability and dynamics of immune mediators results in lower cytotoxicity and higher clearance of intracellular and extracellular bacterial load for vitamin D3-conditioned cells.
Vitamin D3 conditioning promotes increased bacterial clearance during low-level infection, intracellular containment during high-level infection and minimizes host cytotoxicity
We found that in low-level infection extracellular load and cytotoxicity for vitamin D3 cells was less than that of control and ethanol conditioned cells (Figures 2a,b, and 3a). Vitamin D3 extracellular load ranged from 0.7% to 90% of the control cells, and 0.19–78% of ethanol-conditioned cells, except at 0–16 and 34–54 h during which vitamin D3 loads were greater than that of ethanol. Intracellularly, vitamin D3-conditioned cells carried a smaller load than control (1.8–53% that of control cells) for all intervals except 0–16 h (110% of control cells) but carried a higher bacterial load than ethanol-conditioned cells (105–313% of ethanol cells) for all time intervals except 44–64 h (17% of ethanol cells). Cytotoxicity for vitamin D3-conditioned cells was less than the control cells and the ethanol-conditioned cells throughout, with vitamin D3 having only 23–56% of the cell death level of control and 73–93% that of ethanol cells. Vitamin D3 cell cytotoxicity was statistically significantly different from control at several intervals, 0–16, 8–24, 24–44, 34–54 and 44–64 h (Table 2), and maintained a positive rate of change 0.7× that of control consistently over time (Table S1). Though vitamin D3 cells maintained a much larger intracellular load than control and ethanol cells they were able to clear that load more effectively, evidenced by the lower extracellular load, while still keeping a lowered amount of cell death.
Extracellular and intracellular CFU counts over a time span of 74 h at infection levels of (a, b) 1:10 and (c, d) 1:100. (c) Extracellular bacterial load was significantly different between control (Inf-Ctrl) and vitamin D3 (Inf-VitD) cells at 16–34 h (P = 0.026) and 44–64 h (P = 0.039); this was true at the same time intervals for control and ethanol-conditioned (Inf-Etoh) cells (P = 0.009 and P = 0.031, respectively). (d) Vitamin D3 and ethanol cells were significantly different at 24–44 h (P = 0.041). Welch’s t-test. Sliding windows of time for intervals 0–16, 8–24, 16–34, 34–54, 44–64 and 54–74 h. Two-sample t-tests were used to compare within the level of infection (l: low-level infection; h: high-level infection) the production of cytokines (il10, il12, tnfa), reactive species (no, h2o2), cytotoxicity (ldh) and bacterial load (extra: extracellular load, intra: intracellular bacterial load) between vitamin D3 (.id), ethanol (.ie) and control (.ic) cells. Concentration ratios shown in the table are generated by dividing the concentration of the first column by the concentration of the second. Only statistically significant ratios are shown; those that were not found to be statistically significant are blank. (*P ≤ 0.05; **P ≤ 0.01; ***P ≤ 0.001).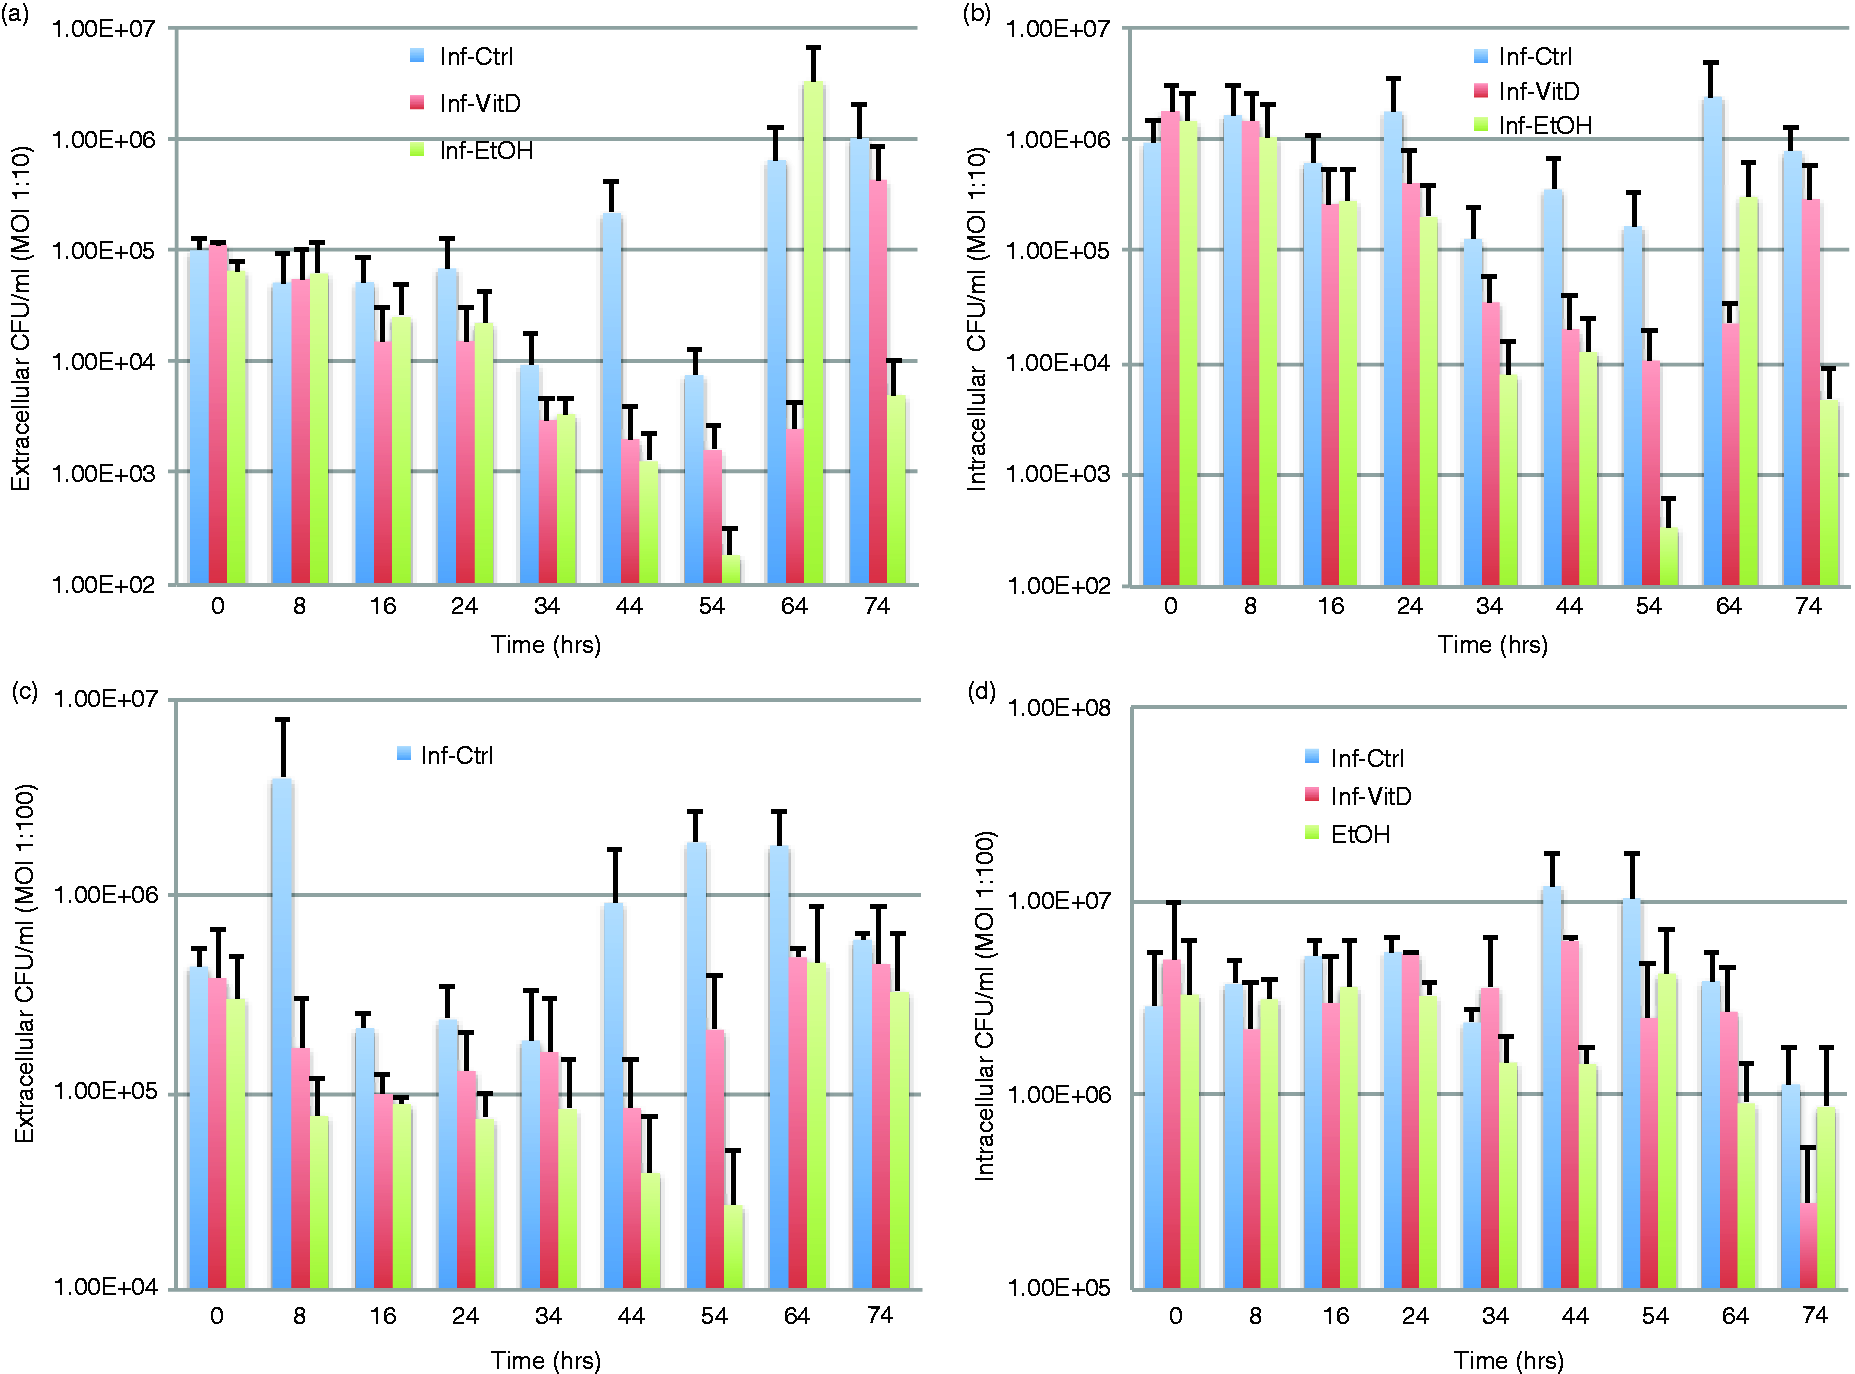

In high-level infection, we found that vitamin D3 cells maintained lower extracellular and intracellular bacterial load than the control but had higher bacterial loads than ethanol-conditioned cells (Figure 2c, d). Extracellular load of vitamin D3 cells ranged from 9% to 61% that of control but were 140% to 340% that of ethanol. Extracellular loads of vitamin D3 cells were significantly different from controls at 16–34 and 44–64 h (Table 2). A similar pattern was seen in the intracellular load carried, in which vitamin D3 cells were 36–91% that of control but 91–246% that of ethanol cells. Vitamin D3 cells had a bacterial load that consistently fell between that of control and ethanol. Vitamin D3 cell cytotoxicity ranged from 41% to 150% that of control, with only the first two intervals of 0–16 and 8–24 h falling below 100% (Figure 3b). Given that our studies used cell lines, we expected that host cells replicated under all conditions during the 74-h experiment. However, the significant amount of host cell death experienced early on by control cells during high-level infection would likely result in a significantly reduced quantity of replicating cells and lower cell numbers at later time points in comparison with non-control conditions. The discrepancy in cell numbers may account for cell death in vitamin D3 and ethanol-conditioned cells appearing higher at later time points in comparison with control conditions. This possibility is further supported by the significant number of viable host cells observed in non-control samples using bright-field microscopy (Figure 3c). Owing to the high amounts of cytotoxicity experienced by control cells at earlier time points (0–16 h) there was a resulting decrease in host cells leading to decreased measurement of LDH throughout the rest of the time period (24–74 h) for the control condition, in comparison with other conditions, which had a higher quantity of cells. This effect can also be seen when comparing hour 64 with hour 74 in high level infection, in which high amounts of cytotoxicity at hour 64 resulted in the death of the majority of host cells, leading to lower amounts of LDH produced at hour 74. Vitamin D3 cells ranged from 79% to 112% that of ethanol, with vitamin D3 cells having less cytotoxicity than ethanol at the majority of time intervals, except 24–44 and 34–54 h (Figure 3b). This shift resulted owing to the large variances in the amount of living host cells present at the given time periods within each condition, evidenced by the significant difference observed between vitamin D3-conditioned cells and control, as well as control and ethanol-conditioned cells at the initial rate of change (Table S2).
Cytotoxicity determined by LDH production. (a) Vitamin D3 cell cytotoxicity was statistically significantly different from control at 0–64 h (P < 0.03–0.001). (b) At 0–16 h vitamin D3 and ethanol-conditioned cells were significantly different (P = 0.049) and at the same time interval H2O2 concentrations were significantly different as well (P = 0.004). (c) From these bright-field microscopic images we observed a large difference in cell count between vitamin D3 and control cells, as well as ethanol and control cells, under both low and high levels of infection.
When comparing low- and high-level infections we observed a distinct shift in behavior of all cells, most assuredly in vitamin D3-conditioned cells. During low-level infection vitamin D3 cells had a much lower extracellular load than both control and ethanol cells, but at high level of infection vitamin D3 maintained a lower load than control but a much higher load than ethanol-conditioned cells (Figure 2a, c). Intracellularly, at low- and high-level infection vitamin D3 cells carried a lower load than control but a higher load than ethanol (Figure 2b, d). For all intervals in low-level infection and most intervals during high-level of infection vitamin D3 cells’ cytotoxicity was lower than that of control and ethanol, with the exception of the massive cell death experienced during high infection in control, which resulted in skewed cell death at later intervals. Vitamin D3 was able to modify host cell behavior in such a way that host cell death was minimized and bacterial containment intracellularly and subsequent bacterial death was maximized. In the case of low-level infection vitamin D3 is able to perform this task with minimal host cell death, while still clearing the most bacteria extracellularly of all conditions, yet carrying an intracellular load that exceeds that of ethanol and is cleared more quickly than that of control. During high-level infection this was not the case and, we postulate, to minimize host cell damage and minimize cytotoxicity, infection was allowed to persist at a slightly higher level than that of ethanol-conditioned cells but a lower level than that of control for both extracellular and intracellular load.
Vitamin D3 differentially modulates host effector molecules based on level of infection
VDREs have been found on several genes involved in the production of NO and H2O2, though few studies have been conducted quantifying the effect of vitamin D3 availability on the production of these phagocytic effector molecules.
We found vitamin D3 cells at a low level of infection had initially high concentrations of NO and low concentrations of H2O2 (Figure 4a, b). Vitamin D3 cells’ NO concentrations ranged from 61% to 101% that of control, with concentrations consistently decreasing over time; this was statistically significant different at time intervals 24–44 and 34–54 h (Table 2). When comparing vitamin D3 cells to ethanol, we observed that vitamin D3-conditioned cells produced less NO throughout, with vitamin D3 cell production ranging from 89% to 97% that of ethanol-conditioned cells. The H2O2 concentrations of vitamin D3 cells were comparable with control, ranging from 100% to 103% that of control during low-level infection. However, compared with the H2O2 concentration of ethanol-exposed cells, we found that vitamin D3 cells produced 89–95% that of ethanol cells, significantly differing at intervals 8–24, 34–54 and 54–74 h (Table 2). Vitamin D3 independent of ethanol produced a decreased amount of H2O2 than ethanol-conditioned cells; the amount produced was most similar to that of control.
H2O2 and NO production. (a) Vitamin D3 and ethanol cells significantly differed in H2O2 production at intervals 8–24, 34–54 and 54–74 h (P = 0.04, P = 0.046 and P = 0.032, respectively). (b) NO production was statistically significantly different between control and vitamin D3 at time intervals 24–44 and 34–54 h (P = 0.04 and P = 0.03, respectively). (c) During high-level infection H2O2 concentrations between control and vitamin D3 cells (P = 0.002), as well as ethanol and vitamin D3 (P = 0.004) differed significantly at the first time interval, 0–16 h. (d) NO production between vitamin D3 and control significantly differed at several intervals, 0–16, 8–24, 16–34, 24–44, 34–54 and 44–64 (P = 0.01, P = 0.005, P = 0.006, P = 0.007, P = 0.002 and P = 0.01, respectively). Vitamin D3 and ethanol cells significantly differed during two intervals, 34–54 and 44–64 h (P = 0.018 and P = 0.006).
During high-level infection vitamin D3-conditioned cells maintained higher concentrations of NO than control (Figure 4d), producing between 106% and 114% that of control, significantly differing at several intervals: 0–16, 8–24, 16–34, 24–44, 34–54 and 44–64 (Table 2). When comparing vitamin D3 with ethanol-conditioned cells we observed that similar to low-level infection, vitamin D3 cells produce 91–98% the amount of NO produced by ethanol-conditioned cells, with the percentage decreasing over time and significantly differing during two intervals, 34–54 and 44–64 h (Table 2). H2O2 production was slightly elevated compared with control, with vitamin D3 initially producing 107% the concentration of control and decreasing to 100% over time, significantly different for the interval 0–16 h (Table 2). Throughout all time intervals the H2O2 concentration of vitamin D3 cells was lower than that of ethanol-exposed cells, ranging between 85% and 95% that of ethanol.
When comparing high- and low-vitamin D3-conditioned cells both levels of infection produced their maximum percentage of NO relative to control during the initial time interval following infection (0–16 h; Figure 4b, d), after which the concentration decreased over time. In low-level infection vitamin D3-conditioned cells’ NO concentrations never exceeded that of control, but in high-level infection vitamin D3 initially did exceed control but reduced to a concentration lower than control cells at a later interval (Figure 3b). Ethanol-conditioned cells consistently produced more NO than vitamin D3 and control cells, regardless of level of infection (Figure 4b, d). In both low and high levels of Mycobacterium infection, the concentration of H2O2 in vitamin D3-conditioned cells was nearly equivalent to that of control for most time intervals, exceeding that of control only during a few time periods (Figure 4a, c). During low-level infection vitamin D3 exceeded control by 3% for one interval (44–64 h) and in high-level infection it exceeded control from 1% to 7% for all intervals except 34–54 and 54–74 h. In low- and high-level infections, vitamin D3 cells consistently produced 10% ± 5% less H2O2 than that of ethanol-conditioned cells. In the case of NO and H2O2 production ethanol consistently produced a higher concentration of both when compared with vitamin D3 and control cells, with vitamin D3 producing concentrations at times more similar to control cells than that of ethanol cells. Considering the higher levels of reactive species observed for ethanol-conditioned cells, conditioning with vitamin D3 actively reduced the production of NO and H2O2 during high levels of infection. We see this modulation best displayed when vitamin D3 cells produced greater concentrations of NO than control during high-level infections but much lower concentrations during lower level infection. Our observations suggest that vitamin D3 differentially modulates H2O2 and NO based on bacterial load, by reducing the production of reactive species during low-level infection, irrespective of the ethanol vector, to a level comparable with that of control in the case of H2O2 or lower than control in the case of NO. However, during high levels of infection, the presence of vitamin D3 lead to concentrations of H2O2 and NO higher than that of control cells but still lower than that of ethanol cells, potentially modulating the level of reactive species to circumvent host cell damage during increased bacterial load.
Vitamin D3 modulates pro- and anti-inflammatory cytokines depending on infection level
Prior studies have demonstrated that vitamin D3 has been able to modulate the production of several cytokines important in host cell defense against intracellular infectious agents. We explored IL-10, IL-12 and TNF-α (Figure 5) owing to previously reported observations of vitamin D3’s modulatory control over their production.14,17,24,37,38
Cytokine ELISA assays. At low level of infection vitamin D3 cells concentration of (a) IL-12 and (b) IL-10 was significantly different from control cells between the hour of 8–54 (P < 0.05). (c, f) TNF-α graphs have an inlaid graph depicting TNF-α without time 0, allowing for a clearer view of the differences between conditions production of TNF-α over time. (d) During high-level of infection IL-12 concentration in vitamin D3 cells was different from control cells at 0–16 h (P = 0.045). (e) Vitamin D3 and control cells concentration of IL-10 were also different at hour 8–34 (P > 0.05) during high-level of infection.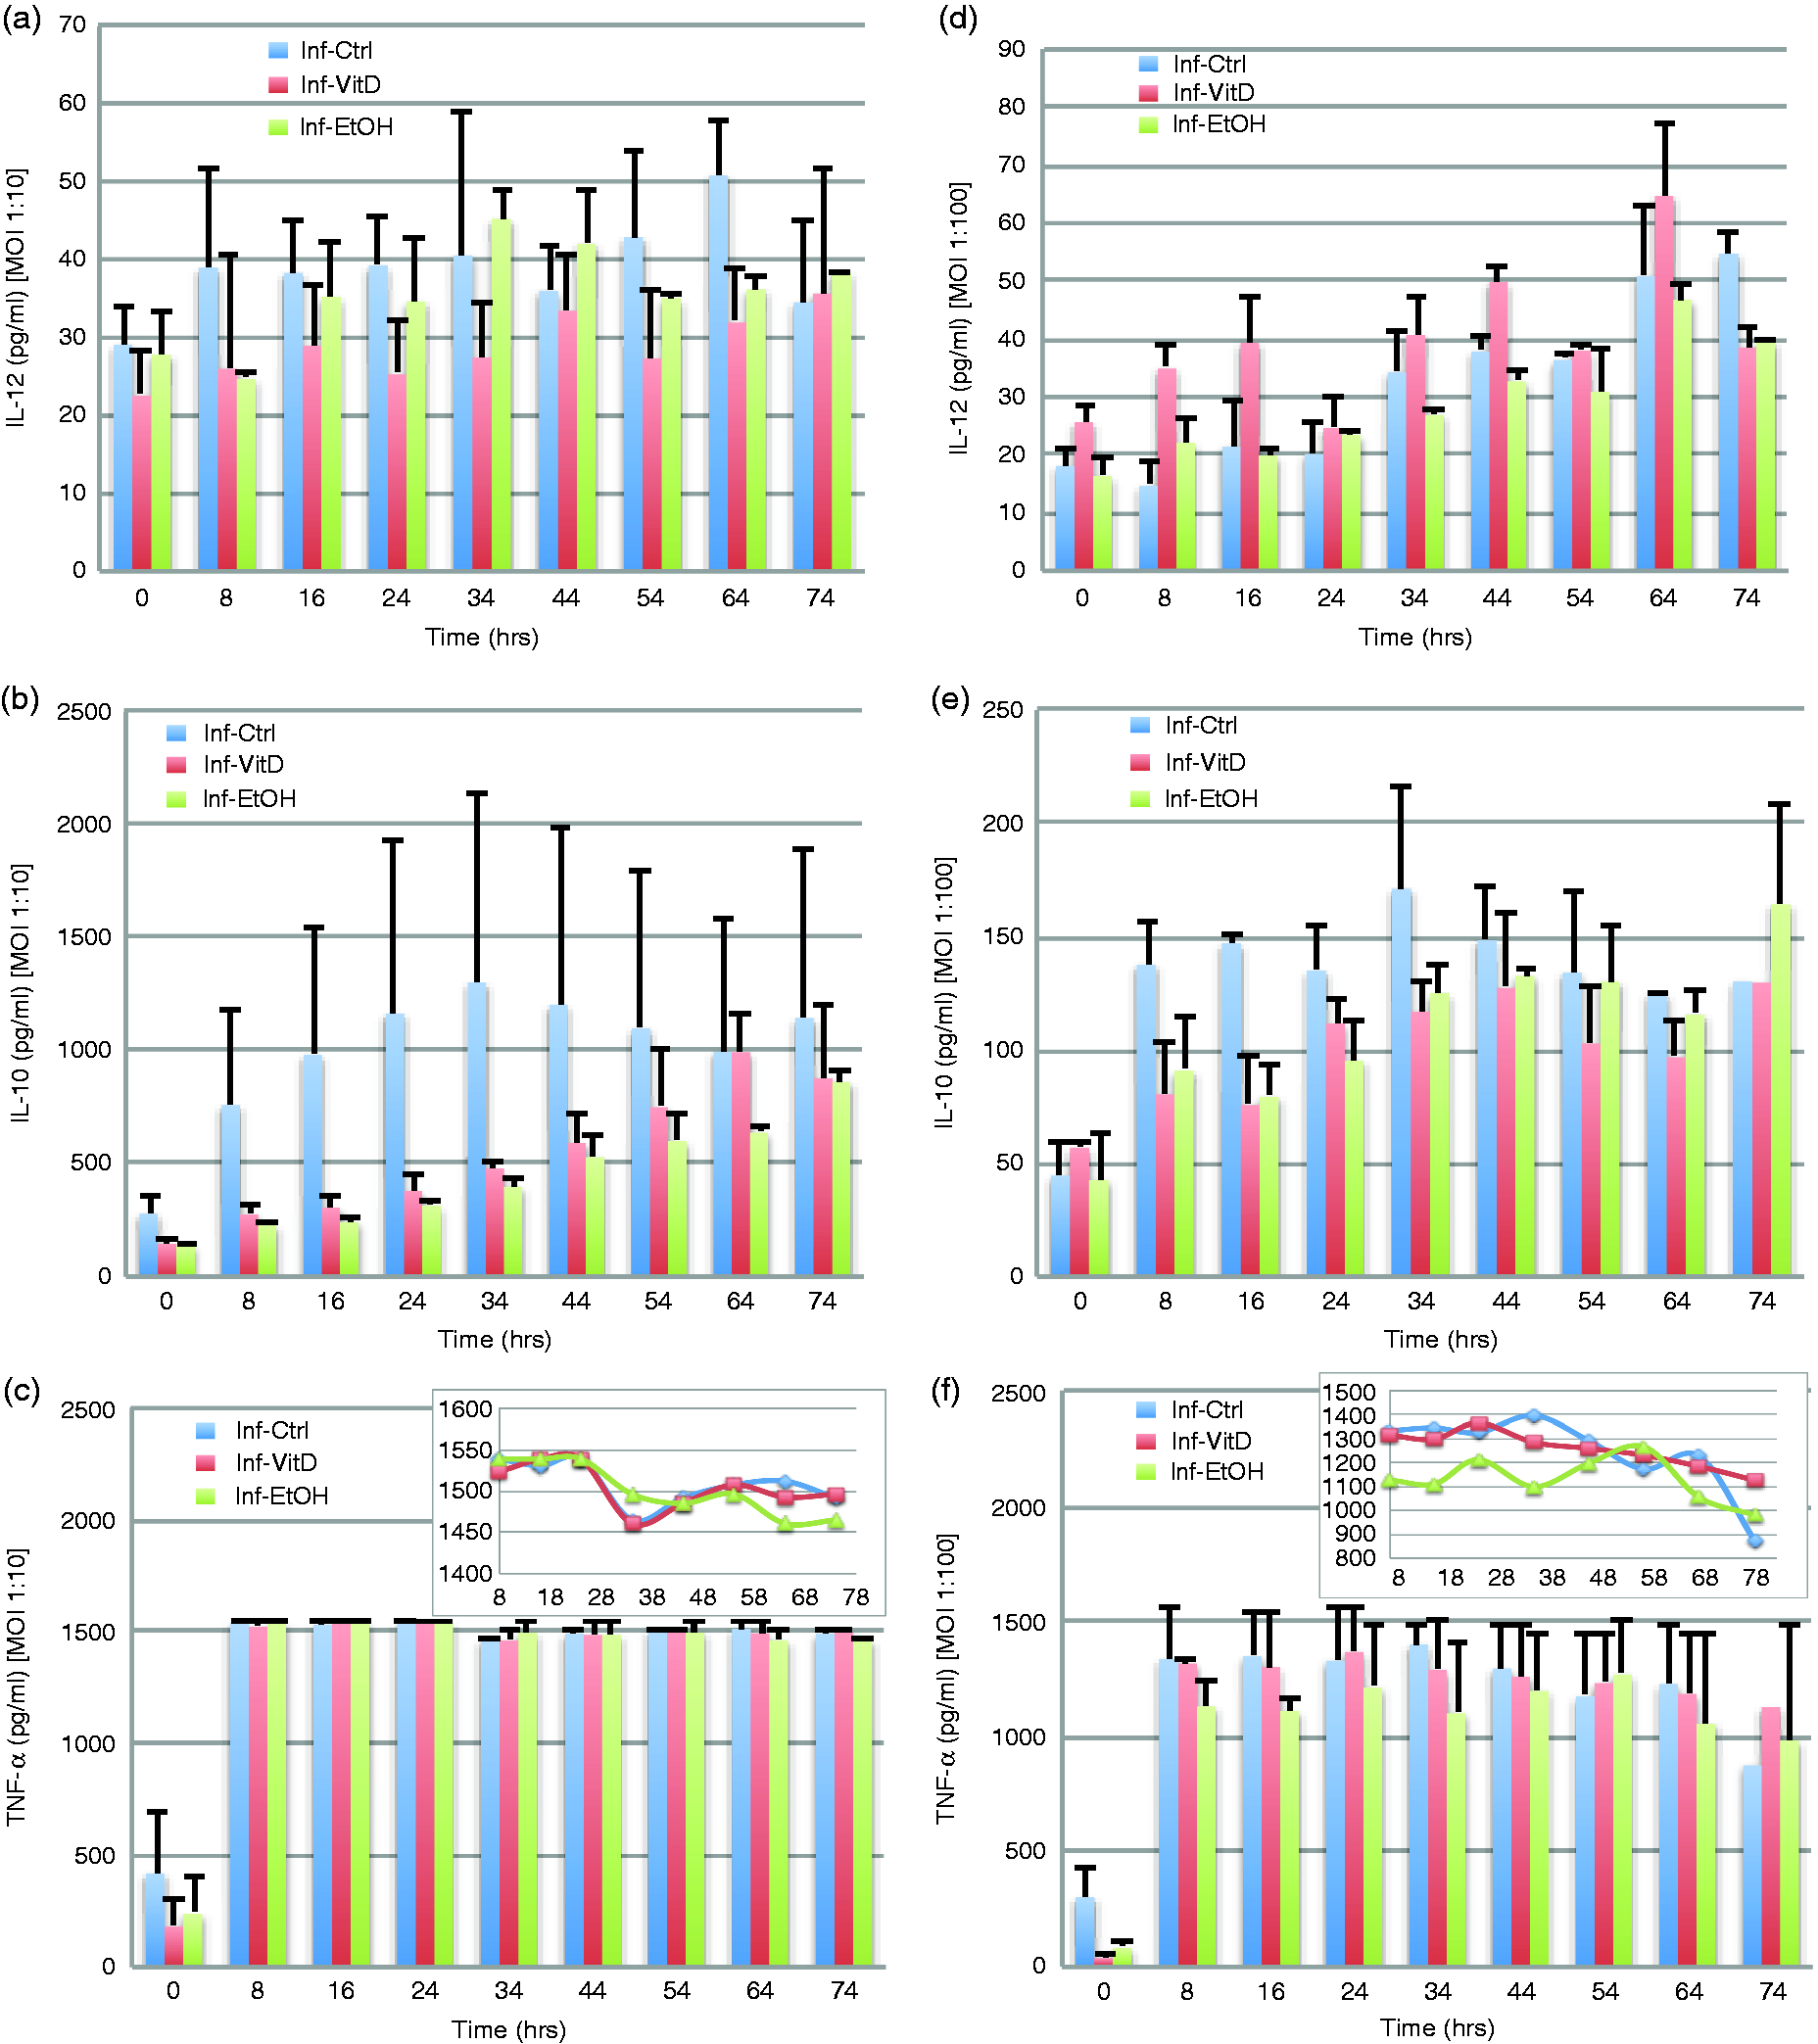
We found that during a low level of infection, compared with control cells, vitamin D3-conditioned cells maintained 33–81% of the concentration of IL-10, with vitamin D3 increasing consistently over time (Figure 5b). Non-conditioned control cells peaked quickly and then maintained relatively the same or minimally increasing IL-10 concentrations. Vitamin D3 cells and control cells were significantly different at most time intervals: 8–24, 16–34, 24–44 and 34–54 h (Table 2). Vitamin D3-conditioned cells produced consistently higher concentrations of IL-10 than ethanol-conditioned cells, with vitamin D3 cells ranging from 119% to 132% that of ethanol and significantly differing at every interval, except the first. The rate of change of IL-10 production was positive in both control and vitamin D3 cells for time intervals 0–16, 8–24 and 16–34 h, but in later time intervals the direction of the rate of change for the control cells was negative, differing from vitamin D3 cells, which continued to maintain positive change, indicating increasing levels of IL-10 (Table S1). Vitamin D3 cells produced the least amount of IL-12 throughout, in comparison with control (69–74% that of control) and ethanol (71–88% that of ethanol; Figure 5a). Vitamin D3 and control cells were significantly different at intervals 0–24 to 34–54 h (Table 2), whereas vitamin D3 and ethanol cells were significantly different at intervals 24–44 and 34–54 h. Vitamin D3 cells maintained a positive rate of change for IL-12 production throughout, dissimilar from control, which contained two time intervals with a negative rate of change ranging from 0.15× to 1.46× (24–44 and 54–74 h; Figure 5a; Table S1). TNF-α concentrations for vitamin D3-conditioned cells and control were the same (100%) at all intervals except 0–16 h in which vitamin D3 was only 93% that of control, during low-level infection. A similar pattern with TNF-α production was seen when comparing vitamin D3 and ethanol cells, with the concentration of vitamin D3 ranging between 98% and 102% that of ethanol. We observed a slight increased concentration of TNF-α (102%) when comparing vitamin D3 and ethanol cells during the last two time intervals (Figure 5c).
During high levels of infection vitamin D3 cells produced higher concentrations of IL-10, but this was still comparatively lower than the control cells, with vitamin D3 cells maintaining 64–84% IL-10 concentration than that of control cells and significantly different from control cells at two intervals: 8–24 and 16–34 h (Figure 5e). In comparison with ethanol cells, vitamin D3 cells produced comparable levels of IL-10 for the intervals 0–16, 8–24, 16–34 and 24–44 h (Figure 5e). However, following the 24–44 h interval IL-10 levels were consistently reduced over time in vitamin D3-conditioned cells down to 80% the level in ethanol-conditioned cells. Vitamin D3 cells maintained a positive rate of change during a majority of time intervals, differing from control cells, which was positive only during the first two intervals (Table S1). The magnitude of the rate of change in IL-10 concentration for vitamin D3 ranged from 0.13× up to 36× the rate of change of control (Table S1). Converse to what was observed during low infection levels, vitamin D3 produced the highest concentration of IL-12 over all time intervals and across all conditions (Figure 5d). Vitamin D3 cells had an initial value 185% that of control cells, with its minimum value equivalent to control cells during the last time interval, 54–74 h. Vitamin D3-conditioned cells showed a consistently decreasing IL-12 concentration over time while concurrently increasing IL-10, a known inhibitor of IL-12 (Figure 5d, e). Vitamin D3-conditioned cells IL-12 concentration was significantly different from control cells at 0–16 h interval (Table 2) during high-level infection. The response of vitamin D3 cells compared with ethanol indicates the cells produced 172–121% the level of IL-12 observed in ethanol-conditioned cells. Ethanol conditioning initially resulted in higher concentrations of IL-12 than in control and this immunologic behavior reversed at later intervals, but always produced less than vitamin D3-conditioned cells. During high-level infection TNF-α production in vitamin D3-conditioned cells ranged from 89% to 108% vs. control cells, with vitamin D3 exceeding that of control during the final interval, 54–74 h (Figure 5f). Compared with ethanol cells, vitamin D3 cells produced higher concentrations of TNF-α, ranging from 104% to 115% that of ethanol cells. Vitamin D3 cells reduced their TNF-α concentration over time except at time intervals 8–24 and 54–74 h. Vitamin D3 TNF-α concentrations were significantly different from ethanol at intervals 8–24, 16–34 and 24–44 h (Table 2).
Vitamin D3 availability, as well as the level of infection, greatly affected cytokine production. Comparing low and high levels of infection we observed that IL-10 production in vitamin D3-conditioned cells was at a concentration level more comparable with control cells during high levels of infection. In low levels of infection vitamin D3 conditioning resulted in concentrations of IL-10 consistently higher than that of ethanol-conditioned cells (Figure 5b). However, for high-level infection the cells produced IL-10 at equivalent concentrations to that of ethanol-conditioned cells during the early post-infection time frames, lowering IL-10 production to below that of ethanol-conditioned cells at later time intervals (Figure 5e). The modulation of IL-10 during low-level infection and the temporal variation during high-level infection, indicates a vitamin D3- and infection level-dependent IL-10 response that was not observed for either control or ethanol-conditioned cells. This variation in IL-10 production results in significantly different rates of change between high- and low-level infected cells conditioned with vitamin D3 between 24 and 64 h (Table S2). IL-12 concentration was lowest in vitamin D3-conditioned cells during low-level infection, but was highest in vitamin D3-conditioned cells during high-level infection (Figure 5a, d). In low- and high-level infection vitamin D3 cells consistently increased their concentration of IL-12 over time. In comparison to the immunologic responses of control and ethanol-conditioned cells, it appears that vitamin D3 at low-level infection maintains a lower concentration of IL-12 throughout; while comparably coming closer to the concentration of control and ethanol as time progresses in the high-level infection. Vitamin D3 cells’ production of TNF-α in low-level infection is very similar to that of control and ethanol cells, but in high-level infection we observed a marked difference (Figure 5c, f). At all intervals during high-level infection, with the exception of the last two time periods, vitamin D3-conditioned cells produced less TNF-α than control cells; vitamin D3-conditioned cells produced 4–15% more TNF-α than ethanol-conditioned cells during all time intervals. From these results, we concluded that vitamin D3 is able to variably modulate the cytokines IL-10, IL-12 and TNF-α in an infection-dependent manner, increasing IL-10 and reducing IL-12 during low-level infection, and during high-level infection greatly increasing IL-12 and decreasing IL-10 levels while maintaining an intermediate TNF-α level distinct from control and ethanol conditions.
Correlations between host responses differ based on conditioning and level of infection
Pearson correlation.

We performed correlation analysis on cytokine, effector molecule and bacterial load concentration variations over time; comparing correlations between high and low level of infection and across vitamin D3 and ethanol-conditioned cells, as well as control. A positive correlation is indicated by (+) and a negative correlation is indicated by (–). Only statistically significant correlations are shown, those that were not found to be statistically significant are blank (P ≤ 0.05).
To determine how vitamin D3 may impact the relative dynamics of host response to Mycobacterium infection, we evaluated the correlation between the rate of change of bacterial load, effectors and cytokines given conditioning and infection level (Table S1 contains rate of change ratios and Table S2 displays statistically significant correlations). We found more correlations between the rates of change during high level of infection when compared with low; this may be due to the cells enacting a more synergistic response during more severe infections. Vitamin D3 (correlation coefficient –0.786; Table S3) and ethanol-conditioned (correlation coefficient –0.783; Table S3) cells had a shared rate of change negative correlation in common between the extracellular bacterial load and IL-10 during low-level infection, which may be indicative of an ethanol and infection level-dependent correlation. The rate of change for H2O2 and LDH (correlation coefficient 0.92; Table S3) and IL-12 and NO (correlation coefficient 0.712; Table S3), were positively correlated and occurred only for vitamin D3-conditioned cells under high-level infection. The vitamin D3 cells and control cells under high-level infection both exhibited positively correlated rate of change values for H2O2/NO (correlation coefficients 0.946–0.892, respectively; Table S3) and NO/LDH (correlation coefficients 0.816 and 0.785, respectively; Table S3), but not ethanol-conditioned cells.
We used a heat map for time-point based comparison of condition-specific system-wide response during low- and high-level infection (Figure 6a, b). Results of the system-wide heat map analysis indicated that TNF-α was comparatively high across all conditions and levels of infection, with vitamin D3-conditioned cells consistently having the lowest amount of TNF-α at time 0 and control cells having the highest (Figure 6a, b). When comparing high infection with low infection IL-10 concentrations, using the heat map we observed that low-level infection produced much higher concentrations of IL-10 than high-level infection across all conditions. During low-level infections control cells produced the highest amounts of IL-10 and ethanol cells produced the lowest. IL-12 concentrations in low-level infection are decreased when compared with high-level infection. Additionally, vitamin D3 cells during high-level infection produced large amounts of IL-12 in comparison with the production of other cytokines or effectors in general. H2O2 and NO production during both high and low infection levels achieved their relative maximum at time 0 for all conditions and steadily decreased over time. This pattern held for all conditions and, in general, for both levels of infection, although comparatively the high-level of infection resulted in relatively higher amounts of H2O2 and NO. LDH production during high-level infection is lower than in low-level infection; however, this may be due to initial host cell death.
System-wide heat map analysis. Heat maps of normalized assay concentrations were generated using MATLAB for both (a) low and (b) high level of infection. We compared within the level of infection (.l: low-level infection; .h: high-level infection) the production of cytokines (il10, il12, tnfa), reactive species (h2o2, no), cytotoxicity (ldh) and bacterial load (extra: extracellular load; intra: intracellular bacterial load) between vitamin D3 (.id), ethanol (.ie) and control (.ic) cells. For each time period represented in the heat maps, the relative magnitudes of the assays shown were compared with the average value of all assays for that specific time period and the degree of variation from the average was captured graphically by the heat map (vertical comparison). The heat maps depict higher-than-average concentrations as red and lower-than-average values as green, with values falling within the average shaded in black.
Discussion
In this study we have presented, to our knowledge, the first large-scale dynamic profile of J774 macrophage to M. smegmatis infection during vitamin D3 exposure. Though we are unable to account for the full activation of the complement system, as this study was performed with macrophages only, or the presence of other contributors to innate immunity such as pulmonary surfactant proteins, we are able to evaluate vitamin D3’s role in modulating the production of cytokines and effector molecules immunologically relevant to Mycobacterium infection. Data from our study demonstrated that level of infection greatly alters host cell response, indicating that the observed effects of vitamin D3 are likely contextual. Results also illuminated differences in immune responses modulated by the addition of vitamin D3 vs. the vehicle, ethanol. We identified a unique set of vitamin D3-associated responses to infection that are distinct from vehicle and some that are differentially modulated by level of infection. By evaluating the host innate immunological response across multiple time points we provide a dynamic view of the contribution of vitamin D3 to the host–Mycobacterium interaction. 5
Vitamin D3-conditioned host cells display reduced bacterial load and decreased cytotoxicity due to vitamin D3-specific variations in dynamics of immune response
Vitamin D3-conditioned J774 cells exhibited reduced intracellular and extracellular bacterial load compared with control, a finding corroborated by previous studies, which to varying degrees utilized 1,25-dihydroxyvitamin D3, 25-OH2 D3 and retinoic acid.5,9,30,39 We found that while ethanol does appear to have a stimulatory effect on host cells, reducing bacterial load below that of vitamin D3 cells, it presents with a unique and divergent response from vitamin D3, including higher cytotoxicity for both high and low infection conditions. The significant amount of host cell death experienced early on by control cells during high-level infection resulted in a significantly reduced quantity of replicating cells and lower cell numbers at later time points in comparison to non-control conditions. Owing to the lower cell numbers, we saw decreased concentrations of LDH. Previous work with ethanol found it to be a stimulator of host apoptosis, though it was found to have no direct effect on Mycobacteria.40,41 We found the intracellular bacterial load of vitamin D3 cells to be greater than ethanol-conditioned cells but less than control for both low and high-level infections. The extracellular bacterial load mirrored this pattern during high levels of infection; however, during low levels of infection this pattern was reversed. Although both ethanol and vitamin D3 promote bacterial clearance, vitamin D3 varies the relative magnitude and temporal dynamics of immune response, resulting in the lowest cytotoxicity levels vs. ethanol and control, even at the expense of higher intracellular load.
The production of H2O2 and NO in the presence of vitamin D3 is dependent on severity of infection
Several inflammatory factors can lead to reduced bacterial load. We explored reactive oxygen and nitrogen species to determine possible vitamin D3-related mechanisms through which bactericidal activity occurred. H2O2 and NO bioavailability, both produced in the phagosome following host cell phagocytosis, are differentially modulated by vitamin D3. Our results showed that vitamin D3 production of H2O2 differed from ethanol-only exposed cells. Vitamin D3 enabled cells to maintain sufficient levels to facilitate greater bactericidal activity than control, but lower than ethanol during both low and high infection. This presumably resulted in reduced host cell death. 42 Even more pronounced was the effect of vitamin D3 and level of infection on NO production, with vitamin D3 cells producing the lowest NO levels during low-level infections and intermediate levels of NO during high-level infections; again modulating NO levels to less than that of ethanol-only cells. At high level of infection NO and H2O2 production had a significantly positive correlation in cells, across all conditions (P ≤ 0.05; Table 3). Previous studies have found H2O2 to be critical in NO production owing to H2O2 production of metabolic precursor involved in NO metabolism.43,44 The correlation between both species may be indicative of a temporal relationship between H2O2 and NO, though why it is detectable in high-level infections and not low may be due to the failure of H2O2 to clear high-level infection. For low-level infections, H2O2 production may be sufficient to clear or control infection, as we observed statistically significant distinctions (Table 2) between control, vitamin D3 and ethanol cells over several dispersed time intervals. However, during high mycobacterial infection the most significant differences between vitamin D3 cells and the non-vitamin D3-conditioned cells occurred mainly during the first 16 h of infection. Distinctions in vitamin D3 NO response occurred later in low infection and throughout for higher-level infection, suggesting a greater reliance on vitamin D3-associated regulation of NO during later stages of uncleared low-level infection and higher levels of infection. Our results indicate that the modulation of both reactive species by vitamin D3 differs based on level of infection. Furthermore, during low and high infection, the vitamin D3 response significantly differed from the vehicle, with the difference more pronounced for H2O2 during low infection and more evident in NO levels after 34 h post-infection. Vitamin D3-conditioned cells were able to optimize the production of H2O2 and NO, so that the least amount of cytotoxicity occurred as a result of aggressive host production of oxidative species. This occurred concurrently with vitamin D3 host cell clearance of a higher concentration of bacteria, thus allowing for a healthier host cell and a higher clearance of bacterial load. Vitamin D3 conditioning prevents the detrimental overproduction of oxidative species in lower-level infections and encourages increased production in high-level infections, resulting in a much more balanced and controlled immune response.
Vitamin D3 regulates cytotoxicity and reactive nitrogen species in an IL-12-dependent manner
Vitamin D3 modulation of effectors reduced the inflammatory effects of the vehicle, maintaining LDH levels below those of ethanol-only cells during high and low infection load. The NO and LDH variations observed associated directly with vitamin D3, with correlations to IL-12 bioavailability (LDH, Table 3) or the rate of change of IL-12 (NO, Table S2). While several IL-12 mechanistic studies have observed the effect of IL-12 on lymphocytes and production of NO, some studies have investigated IL-12’s effect on macrophages and have shown connections between IL-12 or its components (IL-12p40) and increased NO production.42,45–47 At low and high levels of infection, we found that production of LDH and production of IL-12 had significant (P ≤ 0.05, Table 3) positive correlations for vitamin D3-conditioned cells; this correlation was also present and significant during high-level infection in ethanol-conditioned cells. While IL-12 and NO concentrations did not emerge as significantly correlated, the rate of change of their concentrations were positively correlated during high levels of infection (Table S2). Additionally, similar to NO concentrations during low-level infection, IL-12 concentrations for vitamin D3 cells were the lowest among the three conditions; vitamin D3, ethanol and control. IL-12 modulation in vitamin D3-exposed cells is clearly a characteristic of the presence of the nutraceutical and the level of infection, with IL-12 lowest in vitamin D3 during low-level infection and the highest during high-level infection. The statistically significant negative correlation between IL-12 and intracellular bacterial load observed during high- and low-level infection in ethanol cells was not present in vitamin D3-conditioned cells, although appearing as nearing significance for low-level infections (data not shown). Given the lack of significant IL-12/intracellular bacterial load correlation for vitamin D3 cells, we questioned whether vitamin D3 differentially modulates IL-12 or components of IL-12, in a manner that down-regulates the pro-inflammatory responses associated with the cytokine.37,48 Studies have linked IL-12p40 down-regulation to vitamin D3, proposing that vitamin D3 down-regulates NF-κB activation, which, in turn negatively affects IL-12p40 production. During low-level infection, such an inhibitory mechanism may contribute to the low levels of IL-12 in vitamin D3 cells. Vitamin D3 also self-regulates, inactivating itself by up-regulating the production of vitamin D-24-hydroxylase (CYP24A1).49,50 Feedback inhibition of active vitamin D3 in combination with increased activation of pro-inflammatory pathways may contribute to the increased IL-12 concentrations observed during later time intervals of low-level infection and during high-level infection (Figure 5a, d). Studies have shown that IL-12 modulates NO production in macrophage monocultures in an IFN-γ-dependent manner, with IL-12 promoting endogenous production of IFN-γ by macrophages.20,51 As we observed for IL-12, the NO concentrations in higher infection conditions are higher than in low infection conditions during the earlier time intervals (Figure 4b, d).
Vitamin D3 conditioning leads to differential modulation of and interaction between cytokines IL-10, IL-12 and TNF-α, resulting in novel behavior
A possible explanation for the modulation of the cytokines IL-10, IL-12 and TNF-α is the presence of VDREs located in the promoter area of the genes.11,14,38,43 Through this element vitamin D3 bound to its receptor can act as a transcription factor up-regulating and down-regulating the transcription of the gene. TNF-α is negatively correlated with intracellular bacteria concentrations during low-level infection for both vitamin D3 and ethanol-conditioned cells; we found there to be a highly positive correlation between TNF-α and IL-10 production in all conditions and at all levels of infection. Previous in vitro studies had indicated IL-10 as a down-regulator of TNF-α;22,52–54 however, some clinical studies found that TNF-α and IL-10 concentrations often rose and fell contemporaneously when the immune system was challenged by infection or vaccination.55–57 Our results suggest a much more complex relationship between TNF-α and IL-10 with respect to inflammation and the minimization of cellular damage. Level of infection triggers a specific response in both vitamin D3 and ethanol. We found that in vitamin D3 and ethanol-conditioned cells during low-level infection the production of TNF-α and IL-10 both have a negative correlation to intracellular bacterial load (P ≤ 0.05,Table 3). This response is expected in terms of the production of IL-10, which has a suppression effect on the inflammatory aspects of the immune system; ideally, the host cell would endeavor to decrease inflammatory response through IL-10, if bacterial load was reducing, in order to circumvent any damage a vigorous response would cause.21,22 TNF-α in this case may be the cause of the reduced intracellular load, as previous studies have shown that the presence of TNF-α corresponds with decreased intracellular bacterial load. 58 This negative correlation between intracellular bacterial load and IL-10 is seen only in vitamin D3 and ethanol-exposed cells, with IL-10 levels in control cells higher than in either condition. Vitamin D3 cells consistently had higher IL-10 levels than ethanol-only cells, irrespective of infection level. These interactions, along with the findings that ethanol-conditioned cells had a negative correlation between intracellular bacteria and IL-12 at all levels of infection, indicate a possible dysregulation caused by the vehicle, as the expected outcome would be IL-12 concentrations increasing as bacterial load also increases in an effort to clear infection. During low-level infection, we observed significant differences in the level of TNF-α produced by vitamin D3 cells when compared with the vehicle; ethanol cells maintained higher TNF-α levels than vitamin D3 cells. The converse of this pattern was seen in high-level infection, with control having maintained the highest concentration of TNF-α regardless of infection level. During high-level infection, we observed that high amounts of host cell death at 64 and 74 h resulted in a slight decrease in concentration, which we consider to be a death-related incident.
1,25-Dihydroxyvitamin D3 is pivotal in the modulation of host immune response to infection. Vitamin D3 has been identified as a dynamic modulatory co-factor, able to alter macrophage cell behavior in response to level of infection and environmental pressure. This unique modulatory capability led to increased host survivorship, decreased bacterial load and overall increased capability to fight off infection. While there is still much to be understood with regard to the mechanism by which vitamin D3 modulates the innate immune system, our study provides evidence that vitamin D3 modulation is context-dependent and time-variant, as well as highly correlated to level of infection. Our results also provide support towards disambiguating vitamin D3 immunomodulatory effects from the vehicle, most notably in IL-12/NO modulation. Overall this study furthers our understanding of how vitamin D3 mechanistically fulfills the dual role of regulator of bactericidal effector molecules and protector against host cell damage and cytotoxicity.
Footnotes
Acknowledgement
The authors would like to thank Dr. Komal Rasaputra for providing technical assistance with experimental methods.
Declaration of Conflicting Interests
The author(s) declared no potential conflicts of interest with respect to the research, authorship, and/or publication of this article.
Funding
The author(s) disclosed receipt of the following financial support for the research, authorship, and/or publication of this article: Research supported, in part, by Defense Threat Reduction Agency grant #FA8650-10-2-6062 subaward #2381, National Science Foundation/BIO-MCB award #1445470, and UH-HMRI Fellowship. The funders had no role in study design, data collection and interpretation, or the decision to submit the work for publication.