
Abstract
Macrophages are ubiquitous innate immune cells that play a central role in health and disease by adopting distinct phenotypes, which are broadly divided into classical inflammatory responses and alternative responses that promote immune suppression and wound healing. Although macrophages are attractive therapeutic targets, incomplete understanding of this functional choice limits clinical manipulation. While individual stimuli, pathways, and genes involved in macrophage functional responses have been identified, how macrophages evaluate complex in vivo milieus comprising multiple divergent stimuli remains poorly understood. Here, we used combinations of “incoherent” stimuli—those that individually promote distinct macrophage phenotypes—to elucidate how the immunosuppressive, IL-10-driven macrophage phenotype is induced, maintained, and modulated under such combinatorial stimuli. The IL-10-induced immunosuppressive phenotype was largely insensitive to co-administered IL-12, which has been reported to modulate macrophage phenotype, but maintaining the immunosuppressive phenotype required sustained exposure to IL-10. Our data implicate the intracellular protein, BCL3, as a key mediator of the IL-10-driven phenotype. Notably, co-administration of IFN-γ disrupted an IL-10-mediated positive feedback loop that may reinforce the immunosuppressive phenotype. This novel combinatorial perturbation approach thus generated new insights into macrophage decision making and local immune network function.
Introduction
Macrophages are ubiquitous cells of the innate immune system that play central roles both in host defense and disease. A central feature of macrophage biology is the capacity to functionally “polarize” to various phenotypes in response to diverse environmental stimuli.1–5 Although these phenotypes span a continuum of states, macrophage heterogeneity may be broadly divided into classic inflammatory responses (collectively referred to as M1), such as those mounted to combat microbial infections, and alternative responses (collectively referred to as M2), with the latter type mediating killing of parasites, activation of T-helper 2 (Th2) cells, and immuno-suppression and tissue remodeling during wound healing. 6 In many chronic diseases, macrophage-mediated responses become dysfunctional and promote disease, as is perhaps best illustrated in cancer.
Many types of cancer involve dysfunctional macrophage responses, which drive tissue remodeling, tumor proliferation, invasion, and metastasis.3,7–9 However, macrophages may also limit cancer growth and promote clearance of established tumors. Tumor infiltrating macrophages (TIM), tumor-associated macrophages (TAM, which are also present at sites away from the tumor bed, such as the peritoneum), and related myeloid-derived suppressor cells (MDSCs) help to establish and propagate the dysfunctional immunological microenvironment at tumor sites and proximal sites of peripheral immune function including lymph nodes,10–13 where other immune cell types such as T cells and dendritic cells are converted to phenotypes that promote tumor survival. Dysfunctional local immune networks are generally considered to be one of the most significant barriers to immunotherapies for cancer, including both adoptive T-cell-based therapies (such as those in which T cells are engineered to express chimeric antigen receptors)14,15 and induced immunity through cancer vaccines. 16 For these reasons, macrophages are attractive targets for therapeutic intervention.17–19 The promise of such a strategy was highlighted by a recent report that shifting macrophage phenotype was sufficient to provide benefits in a pre-clinical model of cancer treatment. 20 However, despite the importance of macrophage polarization to a broad range of diseases, a mechanistic and systems-level understanding of these phenomena is generally lacking.4,21,22
To date, investigations into macrophage functional polarization generally involve stimulating cells with one or more microenvironmental stimuli known to promote a particular functional phenotype.1,3,23–27 Such cues are predominantly cytokines or chemokines but may also be metabolites or physical conditions such as hypoxia. 3 An important limitation of these approaches is that nearly all natural microenvironments in vivo are characterized by multiple stimuli that, taken individually, would promote polarization into distinct macrophage phenotypes. Therefore, in this study, we investigated how macrophages resolve physiologically and therapeutically relevant combinations of “incoherent” stimuli—those that individually promote divergent phenotypes—at both phenomenological and mechanistic levels. In particular, we investigated how the IL-10-driven macrophage phenotype is modulated by co-exposure to stimuli that may be considered “incoherent” with IL-10. IL-10 directs macrophage polarization to an immunosuppressive phenotype that has been likened to that observed in TAM.1,21,23,28,29 Moreover, IL-10 is prevalent both in tumors and other immunosuppressive environments established by MDSCs and regulatory T cells (Treg).30,31 Since stimuli such as IL-4 or IL-13 drive macrophage polarization to a distinct M2 phenotype; 1 here we will refer to the IL-10-induced macrophage phenotype, which is the focus of this study, as a subset of “alternatively activated” macrophages. We identified key molecular mechanisms by which the IL-10-driven macrophage phenotype is induced, maintained, and modulated under incoherent stimuli. Together, these findings provide new insights into macrophage decision making and interactions within local immune networks.
Materials and methods
Cell culture
RAW264.7 cells (RAW cells) were a gift from David Segal, Experimental Immunology Branch, National Institutes of Health (NIH) (Bethesda, MD). RAW cells were cultured in complete DMEM (DMEM + 10% heat-inactivated FBS + 4 mM
Real-time quantitative PCR (qPCR)
RNA was isolated from cells (Omega Bio-Tek) and reverse transcribed into complementary DNA (cDNA) (Quanta Bioscience). Real-time qPCR was conducted using SYBR green super mix (Bio-Rad). Approximately 10 ng of messenger RNA (mRNA) template were loaded per run. Primer concentrations were 200 nM both for forward and reverse primers, and primer sequences are presented in Table S1. All primers/amplicons were designed to specifically detect the mature form of each mRNA target. Cycling conditions were as follows: 95℃ 5 min, 40 cycles (95℃ for 30s, 55℃ for 30s). qPCR data were analyzed using normalized ΔΔCt analysis, 34 for which GAPDH was selected as an internal reference “housekeeping” gene. Experiments were conducted in biological triplicate and, unless otherwise stated, were normalized to samples from cells treated with LPS only. Error bars represent one standard deviation. Statistical analyses were conducted using two-tailed Student’s t-tests.
Western blots and densitometry
Western blots were performed on whole cell lysates. Radioimmunoprecipitation (RIPA) buffer was used for protein extraction followed by centrifugation at 4℃ for 20 min to pellet cell debris. Protein lysate was boiled at 95℃ for 5 min in Laemmli buffer. Protein concentration was quantified by Bradford assay (Thermo Scientific), and 30 µg per sample was loaded and run in pre-cast gels (Bio-Rad). Samples were transferred to polyvinylidene difluoride (PVDF) membranes overnight (approximately 14h) at 50 V. Abs used for Western blot analyses were: anti-suppressor of cytokine signaling 1 (SOCS1) (Abcam), anti-SOCS3 (Abcam), anti-phosphorylated signal transducer and transcription activator (STAT3) (Abcam), anti-pSTAT4 (Y693) (Abcam) anti-STAT3 (Cell Signaling), anti-STAT4 (Cell Signaling), anti-GAPDH (Abcam), anti-phosphorylated cAMP-responsive element-binding protein (CREB) Ser133 (Cell Signaling 87G3), anti-p glycogen synthase kinase (GSK)α/β Ser21/9 (Cell Signaling 9331), anti-B-cell chronic lymphocytic leukemia (CLL)/lymphoma 3 (Bcl3) (Novus NBP2-29946), and anti-rabbit HRP-conjugated secondary Ab (Invitrogen). Transferred membranes were blocked using 5% BSA in TBST for 2h followed by primary Ab labeling in 5% BSA in TBST overnight. Membranes that were incubated with primary Abs overnight were washed with TBST three times followed by secondary Ab staining in 5% BSA in TBST for 1h. Membranes were treated with enhanced chemiluminescence (ECL) solution (Bio-Rad) for 5 min and then exposed on films (GE). Western blot images were analyzed by densitometry using the ImageJ software package, according to the NIH user guide instructions. Bcl-3 band intensity was normalized to GAPDH band intensity, and this ratio was normalized to the “no treatment case” and averaged over two independent experiments.
Flow cytometry
Surface staining
Cells were incubated in PBS-EDTA followed by gentle scraping to suspend, pelleted, and re-suspended in flow buffer (0.1% BSA + PBS). Cells were re-pelleted, suspended in 50 µl of flow buffer, and incubated in fixing buffer (1% paraformaldehyde in PBS) for 30 min at 4℃ before washing two times in flow buffer. Normal mouse serum (Thermo Scientific) was used to block non-specific binding. Primary Abs were added to the mouse serum-containing cell samples and incubated for 1h at 4℃. Cells were washed with flow buffer three times and stained with secondary Abs for 30 min at 4℃ before washing two times with flow buffer and collecting for flow analysis. Positive signals were determined using isotype control samples to determine negative gating.
Intracellular staining
Cells were harvested, washed, and fixed as for surface staining. Cells were then suspended in permeabilization wash buffer (0.5% saponin and 0.2% BSA in PBS). Normal mouse serum was used to block both surface and intracellular non-specific binding. Primary conjugated Abs were added to mouse serum-containing cell samples and incubated for 1h at 4℃ before washing two times with flow buffer and collecting for flow analysis. Abs used for flow cytometry analyses were: surface antigens F4/80 (BD Bioscience) and CD11b (BD Bioscience) and intracellular antigen TNF-α (BD Bioscience). Samples were analyzed on an LSR II (BD), and mean fluorescent intensity (MFI) was calculated using FlowJo software (Treestar) and used to quantify relative protein expression levels. Statistical analyses were conducted using two-tailed Student’s t-tests.
Results
Resolution of incoherent stimulation by IL-10 and IL-12
To begin investigating how IL-10 drives macrophage phenotype in the presence of incoherent stimuli, we first examined a “competition” between the cytokines IL-10 and IL-12. IL-12 is one of the few cues that has been reported to drive phenotypic conversion of TAM, TIM, and MDSCs in vivo, promoting expression of M1-associated genes and suppressing M2-associated genes.35–37 Some of these effects may be driven indirectly, since IL-12 induces IFN-γ production in multiple cell types that may appear at the tumor site or in proximal lymph nodes, including NK cells, Th1 cells and dendritic cells,38,39 and IFN-γ promotes expression of pro-inflammatory genes.1,21,40 Nonetheless, IL-12 may also act on macrophages directly and has been reported to drive phenotypic conversion of TAM and TIM in vitro (Figure S2).35,41 However, the specific mechanisms by which IL-12 might induce phenotypic conversion, especially in the presence of immunosuppressive signals such as IL-10, are not known.
The downstream pathways through which the IL-10 and IL-12 receptors signal exhibit several potential modalities for cross-talk and competition, via the SOCS1 and SOCS3 (Figure S3a). IL-10 induces signaling via the transcription factor STAT3, which drives the production of SOCS1 and SOCS3.42,43 IL-12 induces signaling via STAT4, which promotes the production of SOCS1. 44 SOCS1 inhibits signaling downstream of both IL-10 and IL-12 receptors, 45 while SOCS3 inhibits signaling downstream from IL-12 but not IL-10. 43 Therefore, SOCS1 and SOCS3 may mediate asymmetric feedback regulation of signaling pathways that regulate macrophage phenotype determination. This network has also been reported to exhibit positive feedback in response to IL-10 or IL-12, via increased IL-10 secretion 46 and increased expression of the IL-12 receptor, 47 respectively. Notably, this qualitative conceptual model (Figure S3a) cannot predict the outcome of a competition between incoherent stimuli IL-10 and IL-12.
To experimentally investigate how macrophages resolve an IL-10/IL-12 competition, murine RAW264.7 (RAW) macrophages were pre-treated with IL-10, IL-12, or both at biologically relevant doses35,39,41 for 12h, and then cells were “activated” with LPS. LPS-induced TLR4 signaling generally promotes macrophage inflammatory responses and can also be induced via endogenous signals, for example in necrotic tissue.48,49 However, in the presence of IL-10, TLR4 signaling enhances expression of alternative activation-associated genes that are not induced by LPS or IL-10 alone.
50
In this experiment, gene expression was profiled three hours post-LPS activation to focus on early-phase responses (Figures 1a and S4). In general, pre-treatment with IL-10 suppressed expression of some genes associated with the classically activated M1 phenotype while enhancing expression of IL-10 (which is associated with the alternatively activated phenotype).6,51 However, in general, IL-12 did not significantly modulate expression of genes associated with either classical or alternative macrophage activation. To investigate whether this minimal transcriptional response to IL-12 treatment was unique to the RAW cell line, we compared responses of RAW cells to those of primary BMDM following IL-10/IL-12 pre-treatment, focusing on the most dynamically regulated genes (TNF-α and IL-10). Both cell types exhibited similar patterns of TNF-α gene and protein expression, which varied with IL-10 dose and was irrespective of IL-12 co-treatment (Figures 1(b) and S5). In BMDM, pre-treatment with IL-12 moderately suppressed expression of IL-10, although this effect was not observed in RAW cells. Because TNF-α expression is regulated post-transcriptionally by mRNA stabilization,52,53 we also investigated whether TNF-α protein levels correlated with mRNA levels. TNF-α protein expression was assessed by intracellular flow cytometry in order to capture patterns evident at this early time point (3h post-LPS activation), at which time secreted protein levels are expected to be low.54,55 Intracellular TNF-α protein levels largely mirrored the pattern observed at the mRNA level. Controls in which cells were treated with IL-10/IL-12 without LPS activation exhibited similar patterns (Figures 1(c) and S4(b)). To investigate whether this apparent dominance of IL-10 was limited to the early response, an additional IL-10/IL-12 competition was conducted in which gene expression was profiled at 3, 6, and 12h after LPS activation (Figure S6). Overall, macrophages exposed to IL-10 and IL-12 simultaneously again exhibited gene expression patterns similar to those induced by IL-10 alone. Moreover, these data indicate that extracellular IL-10 exerts robust control of macrophage phenotype along the TNF-α–IL-10 axis, and therefore, we subsequently focused our investigation on elucidating this particularly important functional tradeoff.
Macrophage responses to incoherent stimuli: IL-10 and IL-12. (a) RAW cells were treated with combinations of IL-10 and/or IL-12 for 12h, activated with LPS for 3h, and profiled by qPCR. Red text: genes typically annotated as M1, blue text: genes typically annotated as M2. Heat map colors indicate up-regulation or down-regulation vs. the LPS-only control as per the scale bar. All data, including non-responsive genes not shown here, are shown with error bars in Figure S4. (b) Comparative gene expression responses of RAW cells and BMDM to IL-10/IL-12 competition. Error bars represent ± 1 standard deviation, from biological triplicates. (c) Comparative intracellular TNF-α protein expression by RAW cells and BMDM following IL-10/IL-12 competition, quantified by flow cytometry. Error bars represent ± 1 standard deviation, from three independent experiments. (d) RAW cells (black) and BMDM (gray) were exposed to the various sequential treatment conditions described in the schematic at left. Cells were harvested 3h after LPS activation for qPCR analysis. Error bars represent ± 1 standard deviation, from biological triplicates (MC: media change, *P ≤ 0.05, **P ≤ 0.01, ***P ≤ 0.001). For additional statistical analysis of panels (b) and (c), see Figure S5. RAW cells: RAW264.7 cells; BMDM: bone marrow-derived macrophage; qPCR: quantitative polymerase chain reaction.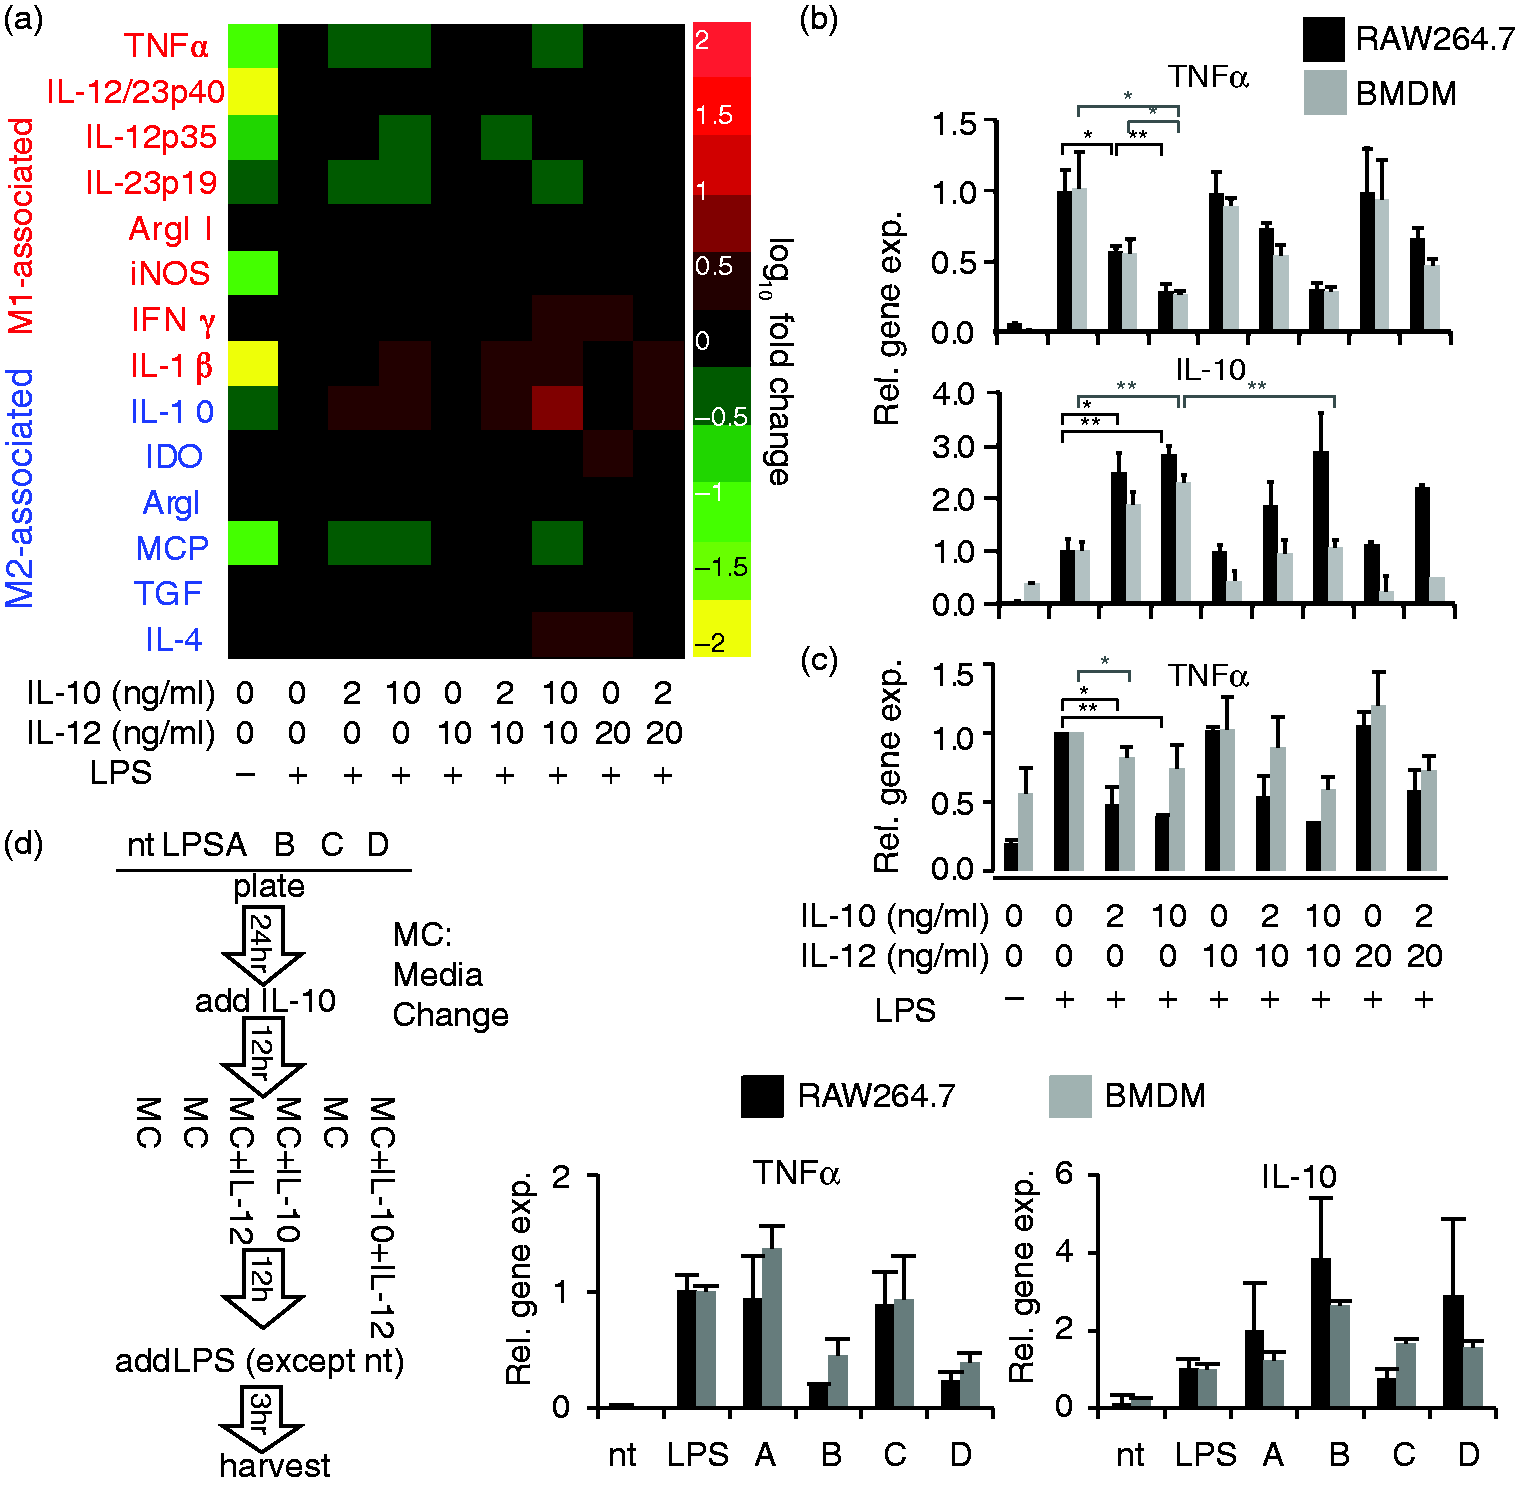
We next investigated how the IL-10-driven macrophage phenotype may be sustained or altered following initial functional commitment. In prior work, when TIM or TAM were removed from tumor-bearing mice and cultured in vitro, addition of IL-12 to the in vitro culture suppressed IL-10 secretion by TAM and enhanced TNF-α secretion by both TIM and TAM. 35 In such experiments, removal of macrophages from an animal may reduce the concentration of cytokines to which these cells are exposed, potentially rendering them more directly responsive to IL-12. By analogy, we next investigated whether removing extracellular IL-10 from macrophages pretreated with IL-10 would alter phenotype and responsiveness to IL-12. RAW cells and BMDM were exposed to IL-10 for 12h, then exogenous IL-10 was removed from the system by replacement with fresh medium (± IL-12), and 12h later, cells were activated with LPS (Figures 1(d), S3(b), and S7). Notably, removal of IL-10 was generally sufficient to drive reversion of both BMDM and RAW cells toward an inflammatory phenotype. Addition of IL-12 induced no significant changes in RAW cell phenotype, and with the exception of IL-12/IL-23p40, IL-1β and IL-23p19, BMDM gene expression was also largely unaltered by IL-12 addition. Interestingly, IL-12 treatment resulted in a modest decrease in IL-23p19 gene expression in BMDM, via unknown mechanisms. Thus, sustaining the IL-10-induced immunosuppressive phenotype required sustained IL-10-induced signaling, reversion to a pro-inflammatory phenotype (i.e. in response to LPS) was spontaneous upon IL-10 removal, and neither of these processes was directly affected by IL-12.
BCL3 as a potential regulator of IL-10-mediated control of macrophage phenotype
We next investigated potential molecular mechanisms underlying the role of IL-10 in determining macrophage phenotype. We hypothesized that IL-10 may exert its effect via either “upstream” or “downstream” mechanisms, or both. An “upstream” mechanism would block the effects of IL-12 by blocking signaling via its receptor (e.g. induction of SOCS3 expression) (Figure S3(a)). A “downstream” mechanism would comprise IL-10 signaling-induced expression of a regulator of transcription or translation that suppresses the expression of inflammatory genes (independent of exposure to IL-12).
To first investigate upstream mechanisms, we examined the involvement of SOCS proteins (Figure S3(a)). SOCS1, which blocks both STAT3 and STAT4 phosphorylation,18,56 was expressed at a basal level that did not vary substantially (at either protein or mRNA levels) following treatment with various combinations of IL-10, IL-12, and LPS (Figure S3(c) and (d)). In contrast, SOCS3 mRNA and protein expression increased proportionally with IL-10 treatment, and elevated SOCS3 expression did not require activation by LPS (Figure S3(d) and (e)). However, treatment of cells with IL-12 alone (10 ng/ml) conferred no significant changes in STAT4 phosphorylation over three hours (Figure S3(f) and (g)). Since these macrophages were generally insensitive to IL-12 treatment, we hypothesized that a downstream mechanism is more likely responsible for the IL-10-mediated regulation of macrophage phenotype.
We considered several potential downstream regulators of the IL-10-induced phenotype, based on prior observations. Note that such regulators need not necessarily promote the expression of IL-10, since IL-10-induced STAT3 phosphorylation already drives expression of IL-10 and other genes associated with alternative activation. 57 One candidate regulator is CREB, which indirectly induces alternative activation-associated genes and suppresses M1-associated genes. CREB induces the expression CEBPβ, which drives expression of IL-10. CREB also drives the expression of a negative regulator of inflammatory gene expression termed dual-specificity protein phosphatase 1 (DUSP1).4,58,59 An additional candidate regulator is BCL3, since expression of this protein is induced by STAT3 phosphorylation, and BCL3 blocks NF-κB (p50/p65)-mediated induction of TNF-α gene expression.60,61 A final candidate examined is interferon regulatory factor (IRF5), which promotes the transcription of multiple inflammatory cytokines (including TNF-α, IL-12, and IFN-γ) and suppresses transcription of anti-inflammatory cytokines including IL-10.4,62
We first investigated whether the expression of these candidate genes fit the pattern predicted for a downstream regulator: dose-dependence on IL-10 (since IL-10 induced a dose-dependent suppression of TNF-α and induction of IL-10 (Figure S3)) and independence of IL-12 treatment. Of all candidates examined, only BCL3 and DUSP1 expression fit this pattern (Figures 2(a) and S8). However, DUSP1 induction was dependent on activation of cells with LPS, while BCL3 induction did not require LPS activation, suggesting that only BCL3 might mediate the dominant effects of IL-10 prior to activation by LPS. While BCL3 gene expression was enhanced about four-fold by LPS activation, the pattern of dose-responsiveness to IL-10 was unaltered by LPS activation (Figures 2(a) and S8(a)). Thus, BCL3 expression correlated with the induction of the IL-10-driven macrophage phenotype both before and after these cells become activated.
Downstream mediators of the IL-10-driven macrophage phenotype. (a) BCL3 (top) and DUSP1 (bottom) gene expression was measured in response to treatment with varying doses of IL-10 and IL-12, ± LPS stimulation. (b) BCL3 gene expression was measured at various time points after IL-10 removal. Data were normalized to a no treatment control, shown by a gray bar spanning ±1 standard deviation, from biological triplicates. (c) BCL3 protein expression was measured at various time points after IL-10 removal. BCL3/GAPDH protein ratio was calculated via densitometry analysis of BCL3 and GAPDH protein bands (associated Western blots are shown in Figure S8(c)). Data were normalized to a no treatment control, error bars represent one standard deviation, and two independent experiments were analyzed. (*P ≤ 0.05, **P ≤ 0.01, ***P ≤ 0.001). BCL3: B-cell chronic lymphocytic leukemia (CLL)/lymphoma 3; DUSP1: dual-specificity protein phosphatase 1.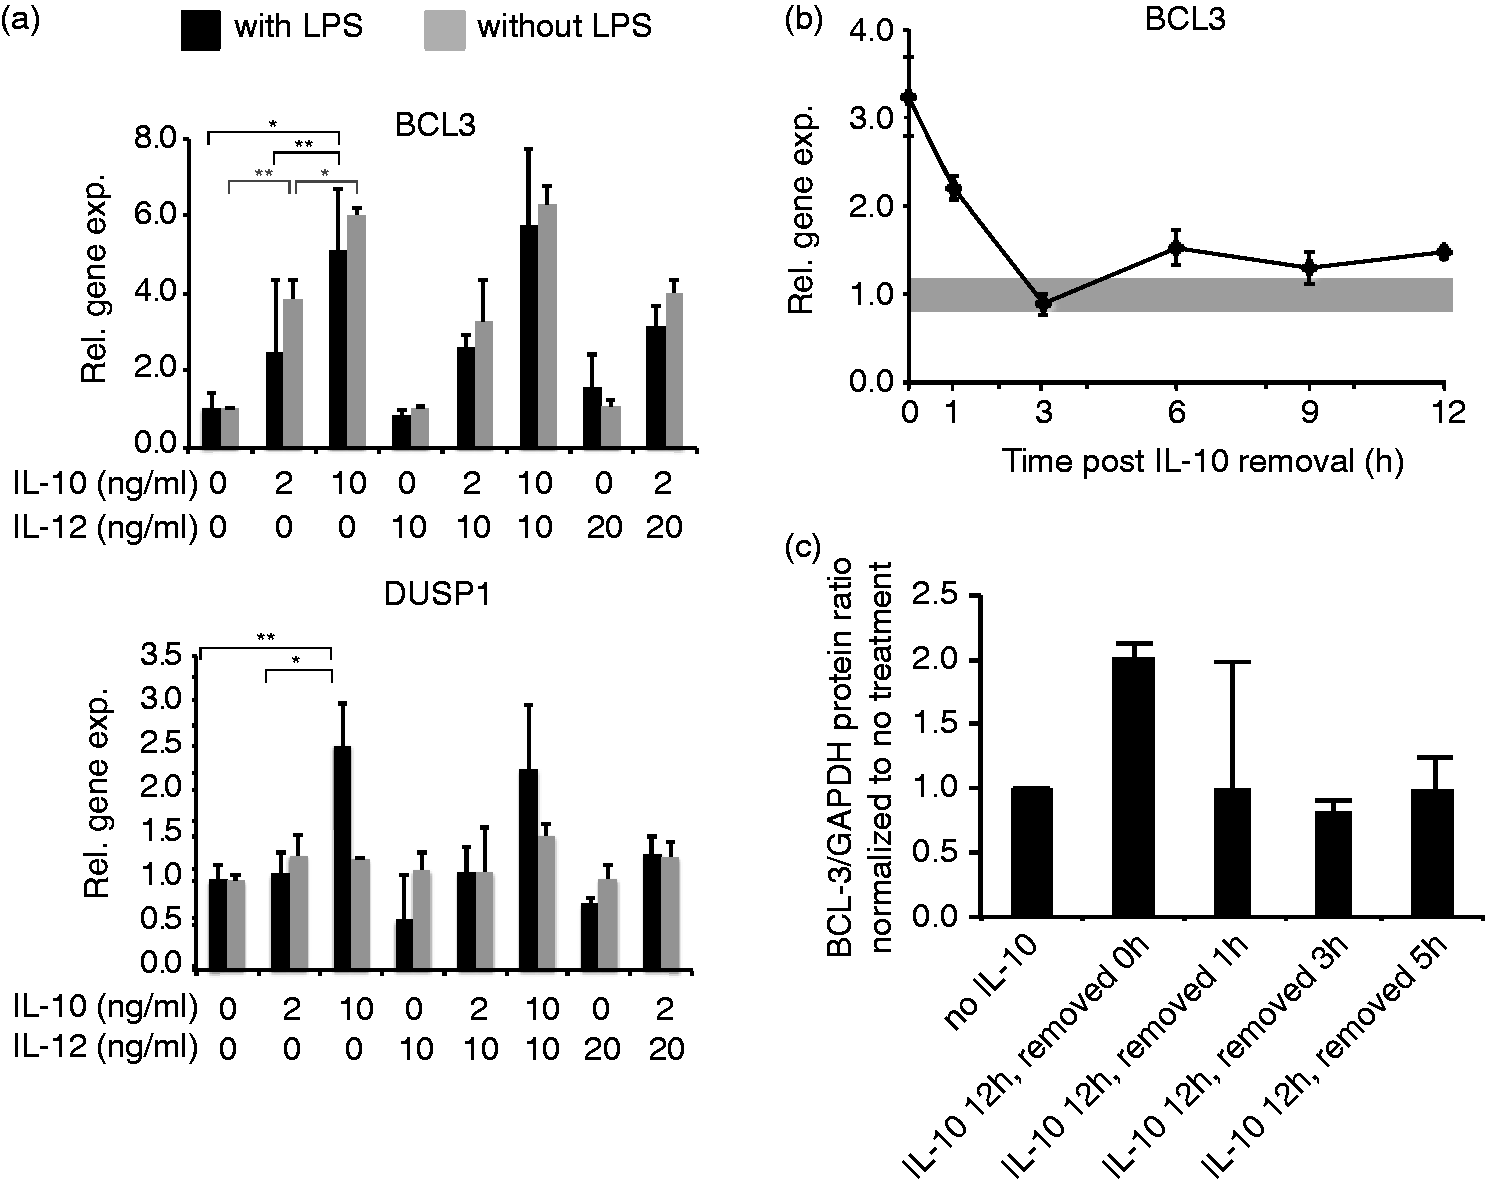
We next investigated whether spontaneous phenotypic reversion upon the removal of IL-10 was reflected in the expression of BCL3. We hypothesized that if BCL3 is a key regulator of the observed IL-10-induced phenotype, then since removal of IL-10 was sufficient to restore a classically activated response to LPS (Figure 1d), BCL3 expression would be expected to decrease following removal of IL-10 from the environment. As predicted, when macrophages were pre-treated with IL-10 for 12h, and then IL-10 was removed from the culture medium, BCL3 gene expression and protein levels dropped to baseline within 3h (Figures 2(b), (c), and S8(c)). Moreover, it has previously been observed that knockdown or knockout of BCL3 in macrophages enhances LPS-induced production of TNF-α.60,63 Altogether, all of these observations are consistent with the proposed model in which BCL3 plays a central role in mediating the dose-dependent and reversible effects of IL-10-induced suppression of M1-associated gene expression.
Resolution of incoherent stimulation by IL-10 and IFN-γ
We next investigated a competition between IL-10 and the potent pro-inflammatory stimulus IFN-γ. As noted above, IL-12-induced production of IFN-γ by neighboring immune cells may mediate indirect effects of IL-12 on macrophages in vivo.38,39 Previously, the primary insight into this interaction was that when macrophages were pre-polarized to an inflammatory phenotype via exposure to IFN-γ during differentiation from primary monocytes, subsequent exposure to IL-10 + LPS did not result in induction of genes associated with immunosuppression.
64
Furthermore, this IFN-γ-induced pre-polarization prevented IL-10-mediated inhibition of the expression of inflammatory genes and proteins. How macrophages would resolve simultaneous exposure to this set of incoherent stimuli, however, was not clear. To investigate, RAW cells and BMDM were treated with combinations of IL-10 and IFN-γ, followed by activation with LPS (Figures 3, S9, S10, and S11). Interestingly, co-stimulation with IFN-γ did not block IL-10-mediated suppression of TNF-α gene expression, although treatment with IFN-γ did suppress IL-10-induced expression of IL-10. These effects were similar in RAW cells and BMDM (Figures 3(b) and S10). In addition, IFN-γ induced the expression of inducible NO synthase (iNOS) and IL-12/IL-23p40 even in the presence of IL-10 (Figures 3(a) and S9), indicating that IFN-γ promoted some M1-associated gene expression even in IL-10-rich environments.
Macrophage responses to incoherent stimuli: IL-10 and IFN-γ. (a) RAW cells were treated with combinations of IL-10 and/or IFN-γ for 12h, activated with LPS for 3h, and profiled by qPCR. Heat map is formatted as in Figure 1, and all data, including non-responsive genes not shown here, are reported with error bars in Figure S9. (b) Comparative gene expression for RAW cells and BMDM treated as in (a). For additional statistical analyses, see Figure S10. (c) SOCS1 gene expression after 12h’ treatment with IL-10 and IFN-γ followed by 3h of activation with LPS. Experiments were conducted in biological triplicate in RAW cells and normalized to the LPS only control. (d) SOCS1 protein expression and STAT3 phosphorylation following treatment with IL-10 alone (left) or IL-10 + IFN-γ (right), all without LPS activation. (e) Dynamics of phospho-CREB and phospho-GSK3 in cells pre-treated with IL-10 alone (left) or IL-10 + IFN-γ (right) for 12h, followed by activation with LPS. An independent repeat of this experiment is shown in Figure S11(b). Error bars represent ±1 standard deviation, from biological triplicates. (*P ≤ 0.05, **P ≤ 0.01, ***P ≤ 0.001). RAW cells: RAW264.7 cells; qPCR: quantitative polymerase chain reaction; SOCS1: suppressor of cytokine signaling 1; STAT3: signal transducer and transcription activator; CREB: cAMP-responsive element-binding protein; GSK3: glycogen synthase kinase 3.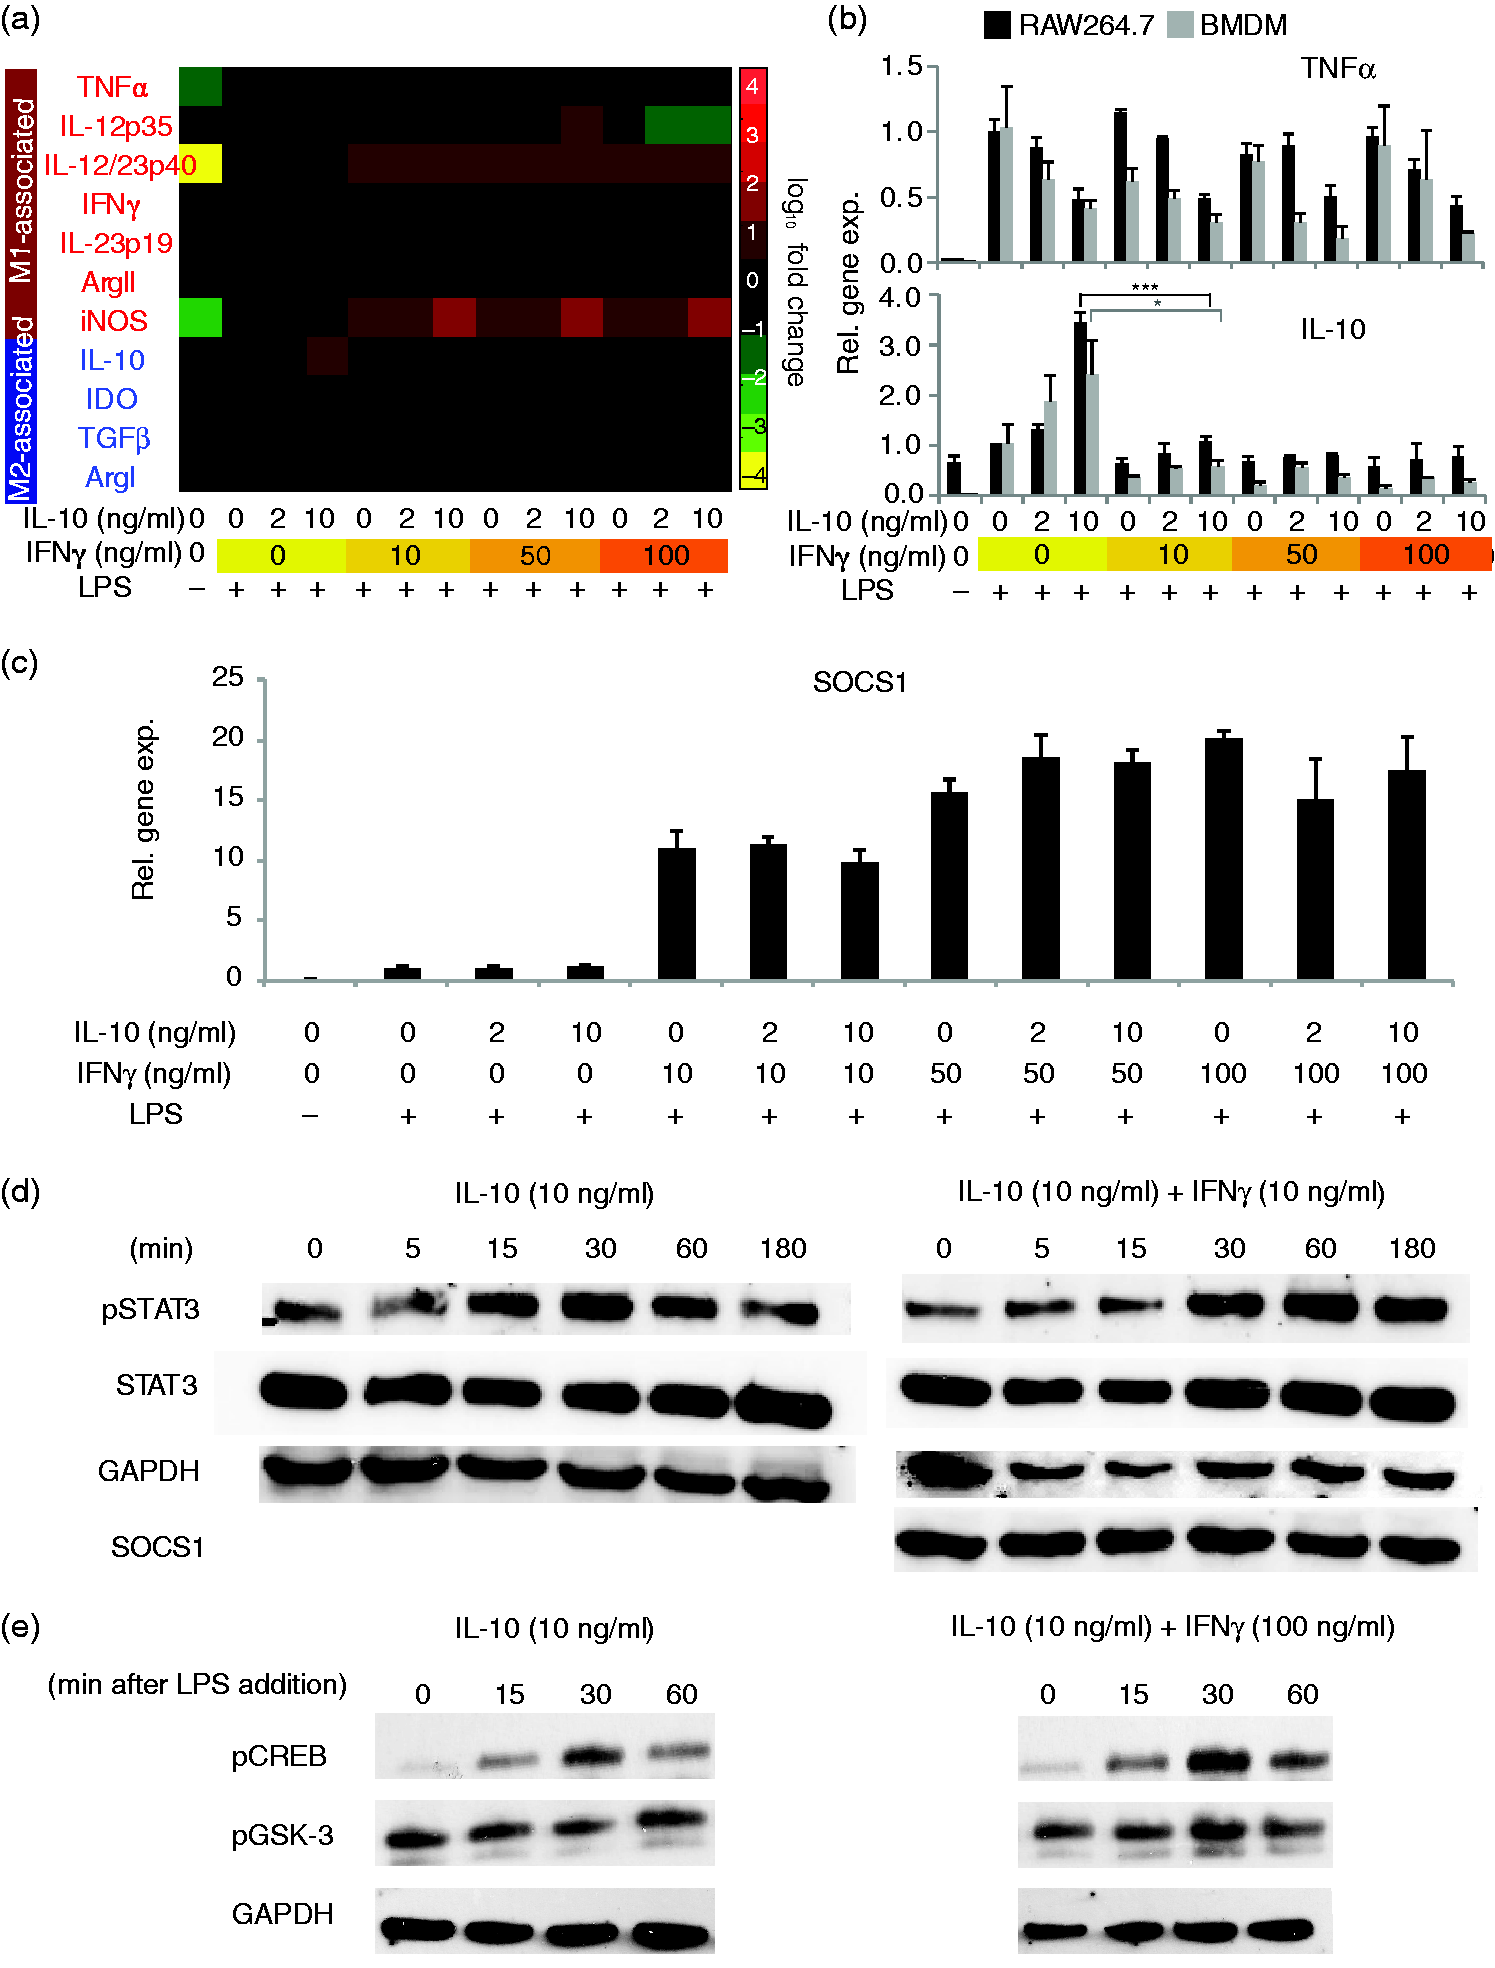
We next investigated potential mechanisms by which macrophages may resolve incoherent stimulation by IL-10 and IFN-γ. Because IFN-γ failed to reverse IL-10-mediated suppression of TNF-α expression following activation with LPS, we hypothesized the absence of any “upstream” mechanism (e.g. induction of SOCS1 expression) that would block signaling downstream of the IL-10 receptor. To investigate, we examined SOCS1 expression and STAT3 phosphorylation following treatment with IL-10 and/or IFN-γ. IFN-γ treatment enhanced expression of SOCS1 mRNA after LPS-mediated activation, irrespective of whether IL-10 was co-administered (Figure 3d). However, co-administration of IFN-γ and IL-10 in the absence of LPS did not drive increased production of SOCS1 protein, nor did IFN-γ treatment substantially impair IL-10-mediated phosphorylation of STAT3 (Figure 3d). These observations support the lack of an upstream mechanism in the absence of LPS, and thus downstream regulator(s) may mediate the resolution of incoherent stimulation by IL-10 and IFN-γ. One potential downstream regulator that could confer the effects observed is GSK3, which is activated by dephosphorylation in response to IFN-γ treatment.65,66 GSK3 is reported to block LPS-induced expression of IL-10 by impairing the mitogen-activated protein kinases (MAPK)-mediated phosphorylation of CREB downstream from TLR4 (Figure S11(a)).59,66,67 Since GSK3 is not expected to block TLR4-mediated activation of NF-κB, this mechanism would also explain why IFN-γ does not render cells non-responsive to LPS. 40 To investigate whether IFN-γ treatment resulted in GSK3 dephosphorylation or impaired phosphorylation of CREB, cells were treated with IL-10 ± IFN-γ, and levels of phospho-GSK3 and phospho-CREB were measured by Western blot (Figures 3(e) and S11(b)). No significant difference in levels of either phosphoprotein was observed between cells treated with or without IFN-γ. Thus, the observed resolution of incoherent IL-10/IFN-γ stimuli likely occurs via another downstream pathway, which remains to be elucidated.
Discussion
This investigation revealed several important features of macrophage responses to complex stimuli. First, direct competition between IL-12 and IL-10 yielded a general dominance of the IL-10-driven phenotype (Figures 1 and S2–S7). Moreover, removal of IL-10 was sufficient to drive reversion of cells to an inflammatory phenotype after activation with LPS (Figure 1d). We also present evidence that BCL3 is a likely “downstream” mediator of this reversible IL-10-induced suppression of the pro-inflammatory phenotype, 60 since BCL3 expression increased upon exposure to IL-10 and decreased upon IL-10 removal (Figures 2 and S8). Together, these results suggest that BCL3 may be an attractive therapeutic target for disrupting at least some features of the dominant IL-10-induced immunosuppressive phenotype. These results also suggest that comparing our observations with a direct IL-10/IL-12 competition in TIM and TAM, which are directly responsive to IL-12 in vitro,35,41 may elucidate whether IL-10 exerts a similarly dominant influence in these macrophages.
In a distinct pairing of incoherent stimuli, IFN-γ suppressed IL-10-induced expression of IL-10 (Figures 3, S9, and S10), which could disrupt an important positive feedback loop within immunosuppressive networks.
46
Since IFN-γ production is induced by IL-12 in vivo,38,39 it may thereby mediate a key indirect effect of IL-12 on macrophage phenotype, even in the presence of IL-10 (Figure 4). In the presence of IL-10, IFN-γ drove the expression of pro-inflammatory genes iNOS and IL-12/IL-23p40, although some inflammatory genes (including TNF-α) were suppressed by IL-10 (Figures 3 and S9). Therefore, co-exposure to this pairing of incoherent stimuli partially mutes both IFN-γ-induced and IL-10-induced macrophage phenotypes. Our data did not support the existence of an upstream mechanism by which IFN-γ induces expression of SOCS1 to inhibit IL-10-mediated signaling (Figure 3). Our data also did not support a downstream mechanism by which IFN-γ-induced regulation of GSK3/CREB mediates the observed suppression of IL-10 expression (Figures 3 and S11). Thus, it is likely that other downstream regulator(s) may mediate the resolution of co-stimulation by IL-10 and IFN-γ. Further investigation is required to identify the molecular mechanisms that govern IFN-γ-induced partial rescue of macrophage inflammatory function in the presence of IL-10. Ultimately, models of core regulatory networks can also motivate the investigation of clinically relevant strategies. For example, if we speculate (or determine) that the core IFN-γ/IL-10 regulatory network proposed here (Figure 4) applies to TAM and TIM in vivo, it would be informative to investigate whether IL-10 receptor blockade can boost the efficacy of macrophage-targeted drugs. For example, in a model of glioblastoma multiforme (GBM), BLZ945 (a colony-stimulating factor-1 receptor inhibitor) drove suppression of M2-associated genes but not expression of M1-associated genes, despite elevated IFN-γ at the tumor.
68
Our model suggests that sustained IL-10 signaling could explain this effect, and perhaps blockade of this pathway could promote enhanced M1-associated phenotypes.
Resolution of incoherent stimuli by multiscale networks. Proposed multicellular network model by which IL-12 may indirectly affect macrophage phenotype. In this model, IL-12 induces various immune cells to produce IFN-γ, which then acts on macrophages to disrupt a positive feedback loop by blocking the production of IL-10, which is required to maintain the immunosuppressive macrophage phenotype.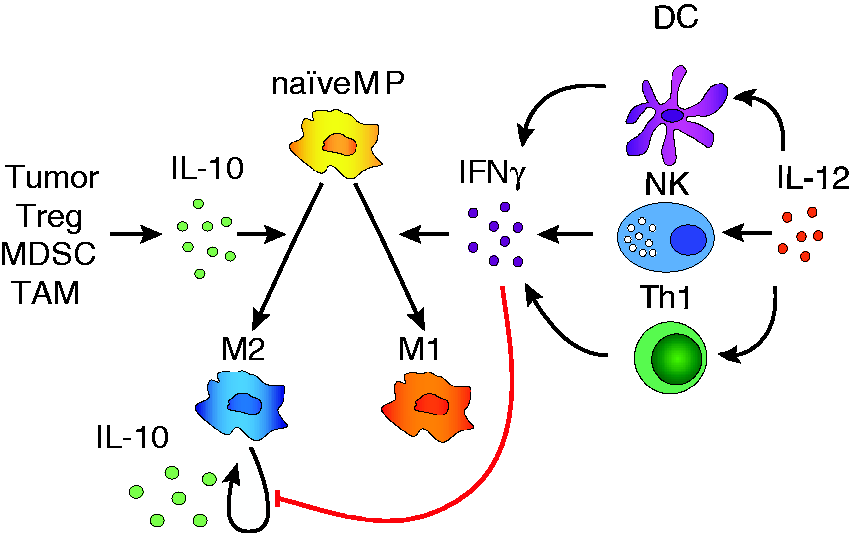
This investigation employed a novel approach to studying macrophage decision making by applying “incoherent” stimuli to illuminate dominant features of cellular regulation. This strategy has previously proven informative for elucidating networks regulating processes such as apoptosis/survival, 69 stem cell differentiation, 70 T-cell lineage commitment, 71 and B-cell fate outcome. 72 An important feature of these investigations, including ours, is that qualitative descriptions of cellular networks are insufficient to predict the outcomes of such inherently quantitative experimental investigations. Indeed, many related cell types including macrophages of different types, MDSCs, monocytes, and dendritic cells likely share similar intracellular signaling topologies. Thus, experimental interrogation by incoherent stimuli could reveal whether similar patterns of dominance are present in related cells, perhaps most importantly in TIM, TAM, and the distinct IL-4/IL-13 induced M2 phenotypes. 1 It could also be informative to investigate the degree to which incoherent stimuli interact at the level of epigenetic regulation. For example, some downstream targets of TLR4 signaling are predetermined by positioning of the master regulator Pu.1 at macrophage-specific enhancers, yet other latent enhancers are epigenetically activated upon the induction of TLR4 signaling. 73 Competition between incoherent cytokine stimuli at the epigenetic level could contribute to the mechanisms by which macrophages resolve complex stimuli. In general, the degree to which conclusions reached using pairwise combinatorial stimuli in vitro hold as environmental complexity increases toward scenarios encountered in tissues and in living organisms must also be evaluated. Ultimately, such an approach may identify additional experimentally testable hypotheses and help to bridge the divide between in vitro experiments and complex environments in vivo.
Footnotes
Acknowledgments
RAW264.7 cells were a generous gift from David Segal (NIH). Traditional sequencing services were performed at the Northwestern University Genomics Core Facility. The funders had no role in study design, data collection and analysis, decision to publish, or preparation of the manuscript.
Declaration of Conflicting Interests
The author(s) declared no potential conflicts of interest with respect to the research, authorship, and/or publication of this article.
Funding
The author(s) disclosed receipt of the following financial support for the research, authorship, and/or publication of this article: This work was supported by the Northwestern University Physical Sciences-Oncology Center (http://www.psoc.northwestern.edu) through NIH award U54 CA143869-05 (![]() ) and startup funds from Northwestern University (JNL). This work was supported by the Northwestern University Flow Cytometry Facility and a Cancer Center Support Grant (grant number NCI CA060553).
) and startup funds from Northwestern University (JNL). This work was supported by the Northwestern University Flow Cytometry Facility and a Cancer Center Support Grant (grant number NCI CA060553).
References
Supplementary Material
Please find the following supplemental material available below.
For Open Access articles published under a Creative Commons License, all supplemental material carries the same license as the article it is associated with.
For non-Open Access articles published, all supplemental material carries a non-exclusive license, and permission requests for re-use of supplemental material or any part of supplemental material shall be sent directly to the copyright owner as specified in the copyright notice associated with the article.