
Abstract
IL-15 is a pleiotropic cytokine related to IL-2 which acts at a broader level than its counterpart. It is presented through its specific high-affinity receptor, IL-15Rα. Both cytokine and receptor are tightly regulated at multiple levels and are widely distributed. Thus, deregulation of their expression leads to an inflammatory immune response. Variants of splicing of IL-15Rα have been described in immune and barrier cells; however, their presence has not been focused on intestinal epithelial cells. In this study, we describe five new alternative variants of splicing of IL-15Rα in Caco-2 cells. Four of them were expressed into proteins inside Caco-2 cells, but these were unable to bind IL-15 or to follow the secretory pathway. However, the expression of mRNA itself might be relevant to diseases such as celiac disease, inflammatory bowel disease or colorectal cancer.
Introduction
IL-15 is a pleiotropic cytokine with multiple effects in both innate and adaptive immune cells. 1 It was discovered in 1994 as a result of its ability to stimulate proliferation of T cells in a similar way to IL-2.2,3 Altogether, IL-2, IL-7, IL-15, IL-21 and other growth factors of cytokine family type I share a common receptor, IL-R2γc (CD132). IL-2 and IL-15 also share the IL-2Rβ subunit (CD122), but differ in their specific receptor, IL-2Rα (CD25) or IL-15Rα (CD215), respectively. 1 It is the expression pattern of IL-15 and IL-15Rα and its affinity that make IL-15 act at a broader level than IL-2 in the organism.
The expression of IL-15 is deeply regulated at five different levels: (1) the IL-15 promoter, which contains transcription factor binding sites for IFN and IL-6 (2) the 5’ UTR region, with 12 translation initiation sites (AUG), (3) its signal peptide and (4) its carboxyl terminal sequences, that limit its translation and secretion.1,7 These checkpoints can limit IL-15 production up to 250 times. 1 Although IL-15 mRNA is constitutively expressed by many cells and tissues, the protein is detected only on monocytes, dendritic cells, epithelial cells and fibroblasts. 1 The expression pattern of this cytokine could be affected by the expression of IL-15Rα, as both proteins interact in the endoplasmic reticulum and are secreted together. 4 This mechanism is not shared by other cytokines and allows IL-15 to remain attached to the membrane of IL-15-expressing cells. 4 As a consequence, IL-15 can be trans-presented to nearby cells expressing the moderate affinity receptor, IL-2Rβ/γc, or the high-affinity trimeric receptor formed by IL-2Rβ/γc and the specific IL-15Rα subunit. 5 While signaling to nearby cells, a signal can be also processed within the IL-15-presenting cell, which is identified as reverse presentation.6–8 Other minor action forms are the intracrine presentation, which takes place in the nucleus when IL-15 is expressed as an alternative isoform containing a short-signal peptide, then acting as suppressor, 9 and the paracrine presentation, which takes place when the membrane IL-15/IL-15Rα complex is processed by proteolysis and released to the extracellular medium. 4
However, the gene encoding IL-15Rα, IL15RA, is located on chromosome 10p15.1 and includes seven exons. Each exon encodes for different protein domains: (1) signal peptide, (2) sushi domain, (3) linker, (4-5) proline and threonine-rich domains, (6) transmembrane domain and (7) a small cytoplasmic domain with no kinase activity. 10 The latter domain, although not essential for trans-presentation, 11 plays a regulatory role in the development of IL-17-producing γδT cells, 12 as well as acting as a T-cell activation adjuvant for HIV-1 DNA vaccination. 13 The isoforms which do not contain the sushi domain (exon 2) are unable to bind IL-15 and unable to localize in the cellular nucleus. 10
As both IL-15 and IL-15Rα are widely distributed, the deregulation of their mRNA and protein expression leads to an inflammatory immune response. 14 Besides, epigenetics could participate in inducing this deregulation as it has already been shown that IL-15Rα expression can be regulated through DNA methylation, and thus differently expressed in a tissue-specific way. 15 Some pathologies where the IL-15/IL-15Rα system is deregulated include celiac disease, inflammatory bowel disease (IBD) or colorectal cancer. 16
The present work is focused on the intestinal epithelial cells as they are at the front line, with contact with dietary components and microbiota within the gut, and they are also capable of signaling to immune cells. 17 In addition, the regulation of IL-15Rα was studied, particularly on the description of the IL-15Rα splice variants as they specifically vary depending on the tissue. 18
The aim of this work was to describe variants of splicing of IL-15Rα expressed in human intestinal epithelial cells, using Caco-2 cells as a model, and to identify those variants with the ability of binding IL-15 and following the secretory pathway, as well as to determine if any of these variants were regulated by methylation of DNA.
Material and methods
The Caco-2 cell line
The Caco-2 cell line, passages 22–28, collection number 86010202 (p44; Health Protection Agency, London, UK) was grown in DMEM medium (Thermo Fisher Scientific, Waltham, MA, USA) supplemented with 15% of FBS (Gibco, Carlsbad, CA, USA), 1% of 2-[4-(2-hydroxyethyl)piperazin-1-yl]ethanesulfonic acid, HEPES (Gibco), 1% non-essential amino acids (Thermo Fisher Scientific) and 1% penicillin-streptomycin (Sigma-Aldrich, St. Louis, MO, USA) in 10 mm plates (BD, Franklin Lakes, NJ, USA) at 37℃ and 5% CO2. The medium was replaced every other day; after 80% confluency, cells were detached with TrypLE™ Express (Life Technologies, Carlsbad, CA, USA) and seeded in a new culture dish. Unstimulated Caco-2 cells were harvested for RNA extraction.
For inhibition of de novo DNA methylation, Caco-2 cells were grown as previously described in presence of 0.1, 1 and 10 µM of 5-aza-2’-deoxycytidine (AZA; Sigma-Aldrich) for 24 or 48 h. The experiments were performed in triplicate.
Patient samples and isolation of epithelial cells
Biopsy specimens from healthy individuals were obtained from the Servicio de Aparato Digestivo (n = 7), Hospital Clínico Universitario of Valladolid (Spain); five of them were derived from colon (C) and the remaining from duodenum (D). Written informed consent was obtained from all subjects and the study was approved by the ethics committee.
Biopsy samples were submerged in physiological solution and immediately processed. A first isolation of the epithelial layer was performed by incubating samples in RPMI 1640 medium (Lonza, Basel, Switzerland) supplemented with 10% FBS (Gibco), 1% penicillin-streptomycin (Sigma-Aldrich), 1% l-glutamine (Sigma-Aldrich), 1 mM EDTA (Sigma-Aldrich) and 1 mM DTT (Sigma-Aldrich) for 1 h with moderate rotation at 37℃. Afterwards, the epithelial layer was obtained (centrifugation at 700 g, 10 min) and cells were labeled with EpCAM-FITC and CD45-PE-Cy7 for 30 min at 4℃ (both from BD). Epithelial cells were isolated in a FACS Aria Sorter (BD), selecting the EpCAM+ CD45– cells.
Cloning
Total RNA was extracted from unstimulated Caco-2 cells with an RNeasy mini kit following the manufacturer’s instructions (QIAGEN, Hilden, Germany). Quantification was carried out in a NanoDrop ND-1000 (Thermo Fischer Scientific) and retrotranscription was performed with a High Capacity cDNA Reverse Transcription Kit (Thermo Fisher Scientific). cDNA was amplified with GoTaq Green Master Mix (Promega, Fitchburg, WI, USA), using primers targeting the start and stop codons—when possible—of the coding full-length IL-15Rα sequences described in NCBI database (variant 1, NM_002189.3; variant 2, NM_172200.2; variant 3, NM_001243539.1 and variant 4, NM_001256765.1). Forward primer for variants 1 and 2: 5’–AGTCCAGCGGTGTCCTGTG –3’; forward primer for variant 3: 5’–ATGTCCGTGGAACACGCAGA–3’; forward primer for variant 4: 5’–AAGCGAAAGCGAATGCGACTGG–3’; common reverse primer for all four variants: 5’–TCATAGGTGGTGAGAGCAGTTTTC–3’. The PCR products were obtained after electrophoresis and the DNA was extracted with QIAquick Gel Extraction Kit (QIAGEN). Each product was cloned into the pCR2.1-TOPO vector following the manufacturer’s instructions (Invitrogen, Carlsbad, CA, USA), and generated in chemically competent Escherichia coli DH5α cells cultured in presence of 100 µg/µl of ampicillin (Sigma-Aldrich). The positive colonies were tested by PCR and digested with restriction enzymes BamHI and XhoI following the manufacturer’s instructions (both from New England BioLabs, Ipswich, MA, USA). DNA from positive colonies was extracted with QIAprep Spin Miniprep kit (QIAGEN), sequenced and analyzed. The sequences were subcloned into the pEGFP-N1 vector (Clontech Laboratories, Mountain View, CA, USA) for transfection of Caco-2 cells. New primers were designed to ensure the elimination of undesired sequences of pCR2.1-TOPO, to facilitate a subsequent enzymatic digestion and to improve their expression: Forward primer V1-2: 5’- ATTCTCGAGCACCATGGCCCCGCGGCGG- 3’; forward primer V3-1: 5’- ATTCTCGAGCACCATGCTACCTCAAGTCAAGGC - 3’; forward primer V3-2: 5’- ATTCTCGAGCACCATGCCTTCAAAATCACCTTCC - 3’; forward primer V3-3: 5’- ATTCTCGAGCACCATGTCCGTGGAACACGCAG - 3’; common reverse for all the variants: 5’- ATTCCTAGGGCATCCACCACTCTCGTCAAAAG - 3’.
Transfection of Caco-2 cells
Caco-2 cells were transfected with the IL-15Rα splicing variants by using Lipofectamine LTX and Plus Reagent (Life Technologies). Briefly, 1 µg pEGFP-N1 vector was incubated for 15 min at room temperature (25℃) with 200 µl of medium without serum or antibiotics and 1 µl Plus Reagent. Lipofectamine LTX reagent was added (3 µl) and incubated for 25 min at room temperature. Finally, the transfection mix was added to 100,000 Caco-2 cells in suspension. Cells were cultured in 24-well plates (BD) and, after incubation for 18 h; FBS was added to a final concentration of 15%. Geneticin (1 mg/ml; Sigma-Aldrich) was added after 40 h. Cells were harvested after evaluation under an inverted fluorescence microscope (48–72 h after transfection). The transfection efficiency was 40–44% (Figure S1) as measured by flow cytometry on transfected cells by using the empty pEGFP-N1 vector. Empty pEGFP-N1 vector was used as a control.
Immunofluorescence
Transfected Caco-2 cells were directly cultured in slides in four-well plates (Thermo Fisher Scientific). Afterwards, cells were washed twice with PBS and fixed with 4% paraformaldehyde for 30 min at room temperature. Autofluorescence was eliminated with 0.1 mM ammonium chloride for 10 min (all from Sigma-Aldrich). Blockage and permeabilization were performed with 3% FBS and 0.25% Triton X-100 (BioRad, Hercules, CA, USA) for 30 min. The primary Ab was incubated overnight at 4℃, and the secondary Ab was incubated for 1 h together with (DAPI) (Sigma-Aldrich). The following primary Abs were used: polyclonal rabbit anti-human calnexin, monoclonal mouse anti-human coatomer protein B (COPB) and polyclonal rabbit anti-human lysosomal membrane-associated protein 1 (LAMP-1) (all of them from Santa Cruz Biotechnology, Santa Cruz, CA, USA). The corresponding secondary Abs were labeled with Alexa Fluor 594 (Life Technologies). The samples were analyzed in a Leica sp5 confocal microscope (Leica Microsystems GmbH, Wetzlar, Germany). Assays were performed in duplicate.
Western blot
Proteins from transfected Caco-2 cells were obtained with RIPA buffer following the manufacturer’s instructions (Sigma-Aldrich). Electrophoresis was performed in a 15% acrylamide/bis-acrylamide gel (BioRad) and proteins were transferred to a PVDF membrane in wet conditions. Blockage was performed with 4% FBS in 0.1% Tween20 Tris-borate–EDTA, TBE solution (all from Thermo Fisher Scientific). The primary Ab used was a polyclonal rabbit anti-EGFP (Thermo Fisher Scientific). The corresponding secondary Ab was labeled with HRP (Dako, Santa Clara, CA, USA). Supersignal Western Blot Substrate (Thermo Fisher Scientific) and VersaDoc equipment (BioRad) were used to obtain the results. The assay was performed in duplicate.
Quantitative and semi-quantitative PCR
Total RNA was extracted from Caco-2 cells or isolated epithelial cells from healthy intestinal biopsies with an RNeasy mini kit following the manufacturer’s instructions (QIAGEN). Quantification was carried out in a NanoDrop ND-1000 (Thermo Fischer Scientific) and retrotranscription was performed with a High Capacity cDNA Reverse Transcription Kit (Thermo Fisher Scientific).
Sequence of the primers used for quantitative PCR.
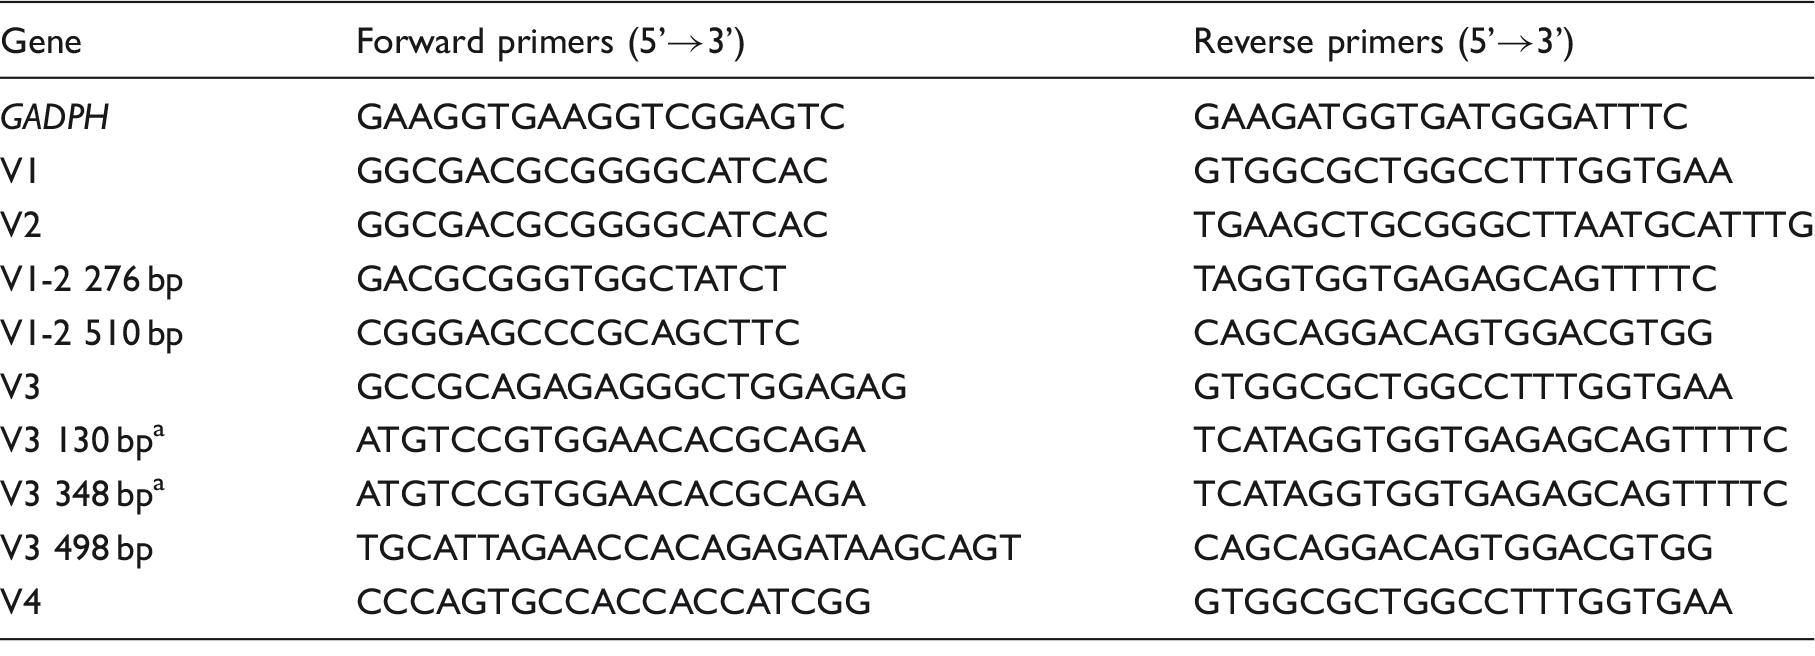
Primers were designed by using Primer Express 3.0 (Applied Biosystems). V: variant.
Non-specific primers: these amplify all IL-15Rα isoforms of variant 3 and were analyzed semi-quantitatively (densitometry of bands in agarose gel was analyzed instead of using quatitative PCR).
Quantitative analysis was carried out in a LightCycler 480 (Roche, Rotkreuz, Switzerland) using the relative quantification 2 -ΔΔCt method. 19 Isoforms whose sequence was embedded in the sequence of longer isoforms were quantified using a semi-quantitative method: the density of the bands in an agarose gel was calculated with Quantity One v4.6.6 (BioRad). In both cases, GADPH was used as a reference (Table 1). Each sample was analyzed in duplicate.
cDNA from isolated epithelial cells was amplified by using GoTaq Green Master Mix (Promega) for qualitative PCR. The specific primers for the different variants of IL-15Rα are described in Table 1.
Statistical analysis
Quantitative and semi-quantitative PCR data were analyzed with the non-parametric Mann–Whitney test, considering P < 0.05 as statistically significant. Analysis was performed in the SPSS software v15.0 (IBM, Armonk, NY, USA).
Results
Identification of IL-15Rα variants
The coding DNA sequence of human IL-15Rα was amplified with a set of primers targeting the start and stop codons, when possible. From the four different coding variants described in the NCBI database, amplification was obtained for variants 1, 2 and 3 (NM_002189.3, NM_172200.2 and NM_001243539.1, respectively), but not for variant 4 (NM_001256765.1) (Figure 1).
Products of amplification of the coding transcripts of IL-15Rα from Caco-2 RNA. The lane on the left corresponds to the molecular mass marker. Products of amplification were obtained for variants 1, 2 and 3, in a range from approximately 300 to 650 bp. V: variant.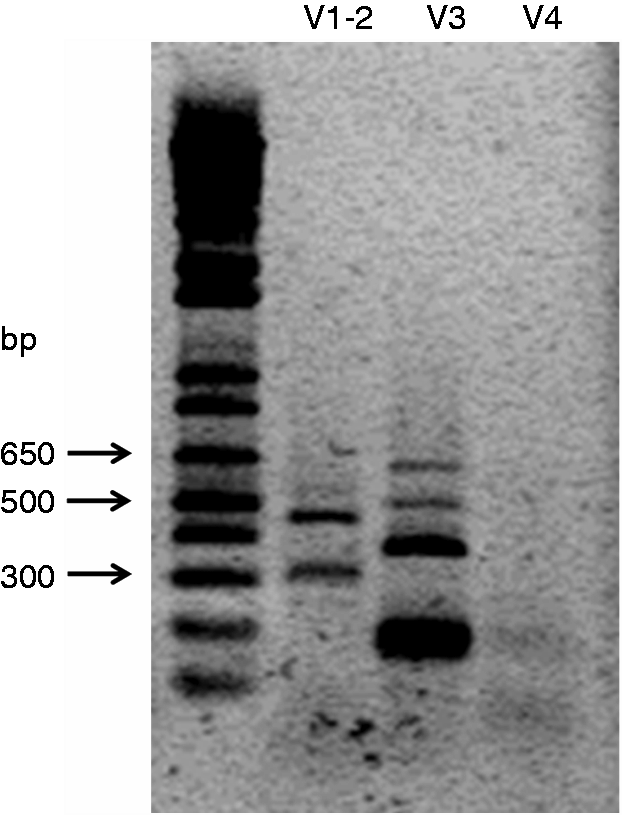
The shortest amplification product obtained in the amplification of variant 3 corresponded to a non-specific amplification. The remaining products corresponded to IL-15Rα isoforms (Figure 1). Identification of the isoforms was denoted by the amplification reaction and the number of bp of the coding sequence: V1-2, 276 bp, and V1-2, 510 bp, for the isoforms derived from the amplification reaction of variants 1 and 2; V3, 130 bp, 348 bp and 498 bp for the isoforms derived from the amplification reaction of variant 3 (Figure 2, Table 2).
Scheme of the variants of splicing of IL-15Rα from Caco-2 cells. Five variants were obtained, two of them belong to sequences of variants 1 and 2, while the remaining three sequences belong to the sequence of variant 3. The variant of 276 bp isolated from variant 1 and 2, lacks exons 2 to 5; the variant of 510 bp lacks exons 2 and 3. From the products derived from the third variant (whose coding sequence initiated in the second exon), the shortest one is only composed by a partial zone of exon 6 and exon 7. The product of 348 bp lacks exons 2 and 3; and, finally, the longest of the products, 498 bp, contains exon 2, although it lacks exon 3 and, partially, exon 4. Main features of predicted proteins. IP: isoelectric point; MM: molecular mass; V: variant. aPredicted protein from the first ATG that appears in the sequence. bPredicted protein from the second ATG that appears in the sequence.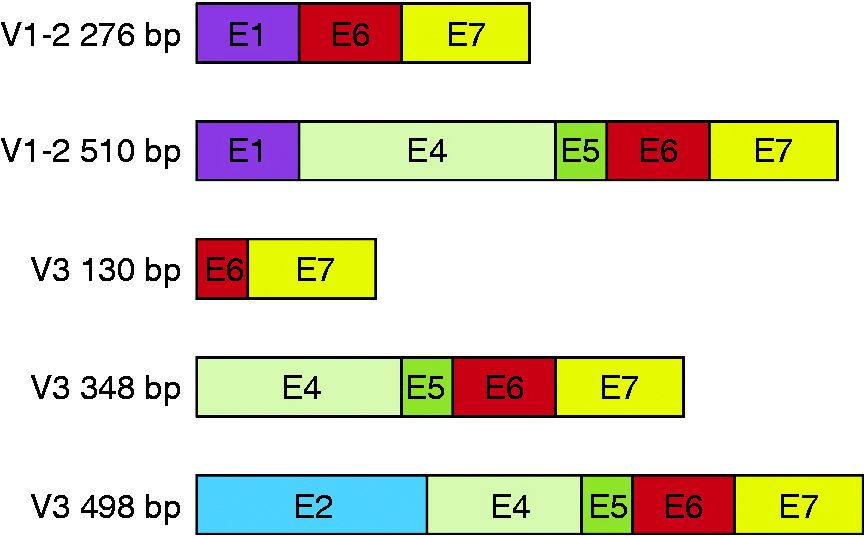
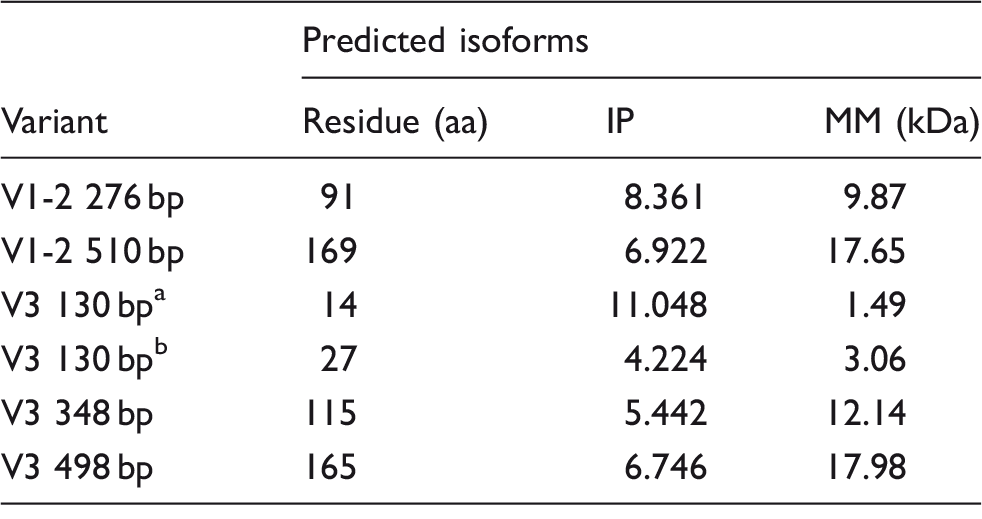
The isoforms derived from sequences 1 and 2 are composed of exons 1, 6 and 7 (276 bp) and exons 1, 4, 5, 6 and 7 (510 bp). The isoforms derived from sequence 3 are composed by exon 6 and 7 (130 bp); exons 4 to 7 (348 bp) and exon 2, part of exon 4 and exons 5 to 7 (498 bp) (Figure 2). The predicted proteins of these isoforms have different characteristics; they vary from alkalinic to acidic proteins, and their molecular mass ranges from 3.06 to 17.98 kDa (Table 2).
It is known that exon 2 codifies for the sushi domain, which is responsible for binding to IL-15. Of the identified isoforms, there is only one with the ability of competing for IL-15, this is the isoform containing 498 bp derived from variant 3 (Figures 2 and 3). Although this isoform does not contain the whole sushi domain, as it does not have the first amino acid sequence of exon 2, it contains the two amino acids involved in IL-15 binding (Figure 3).
Alignment of the sequence of predicted protein of isoform containing 498 bp with the full sequence of IL-15Rα. The sequence of each domain includes the following residues: the signal peptide 1–30, the sushi domain 31–95, the linker domain 96–127, the proline-threonine rich domains 127–205, the transmembrane domain 206–229 and the cytoplasmic domain 230–267. The amino acids that participate in IL-15 binding are marked with an arrow (glutamic acid and asparagine).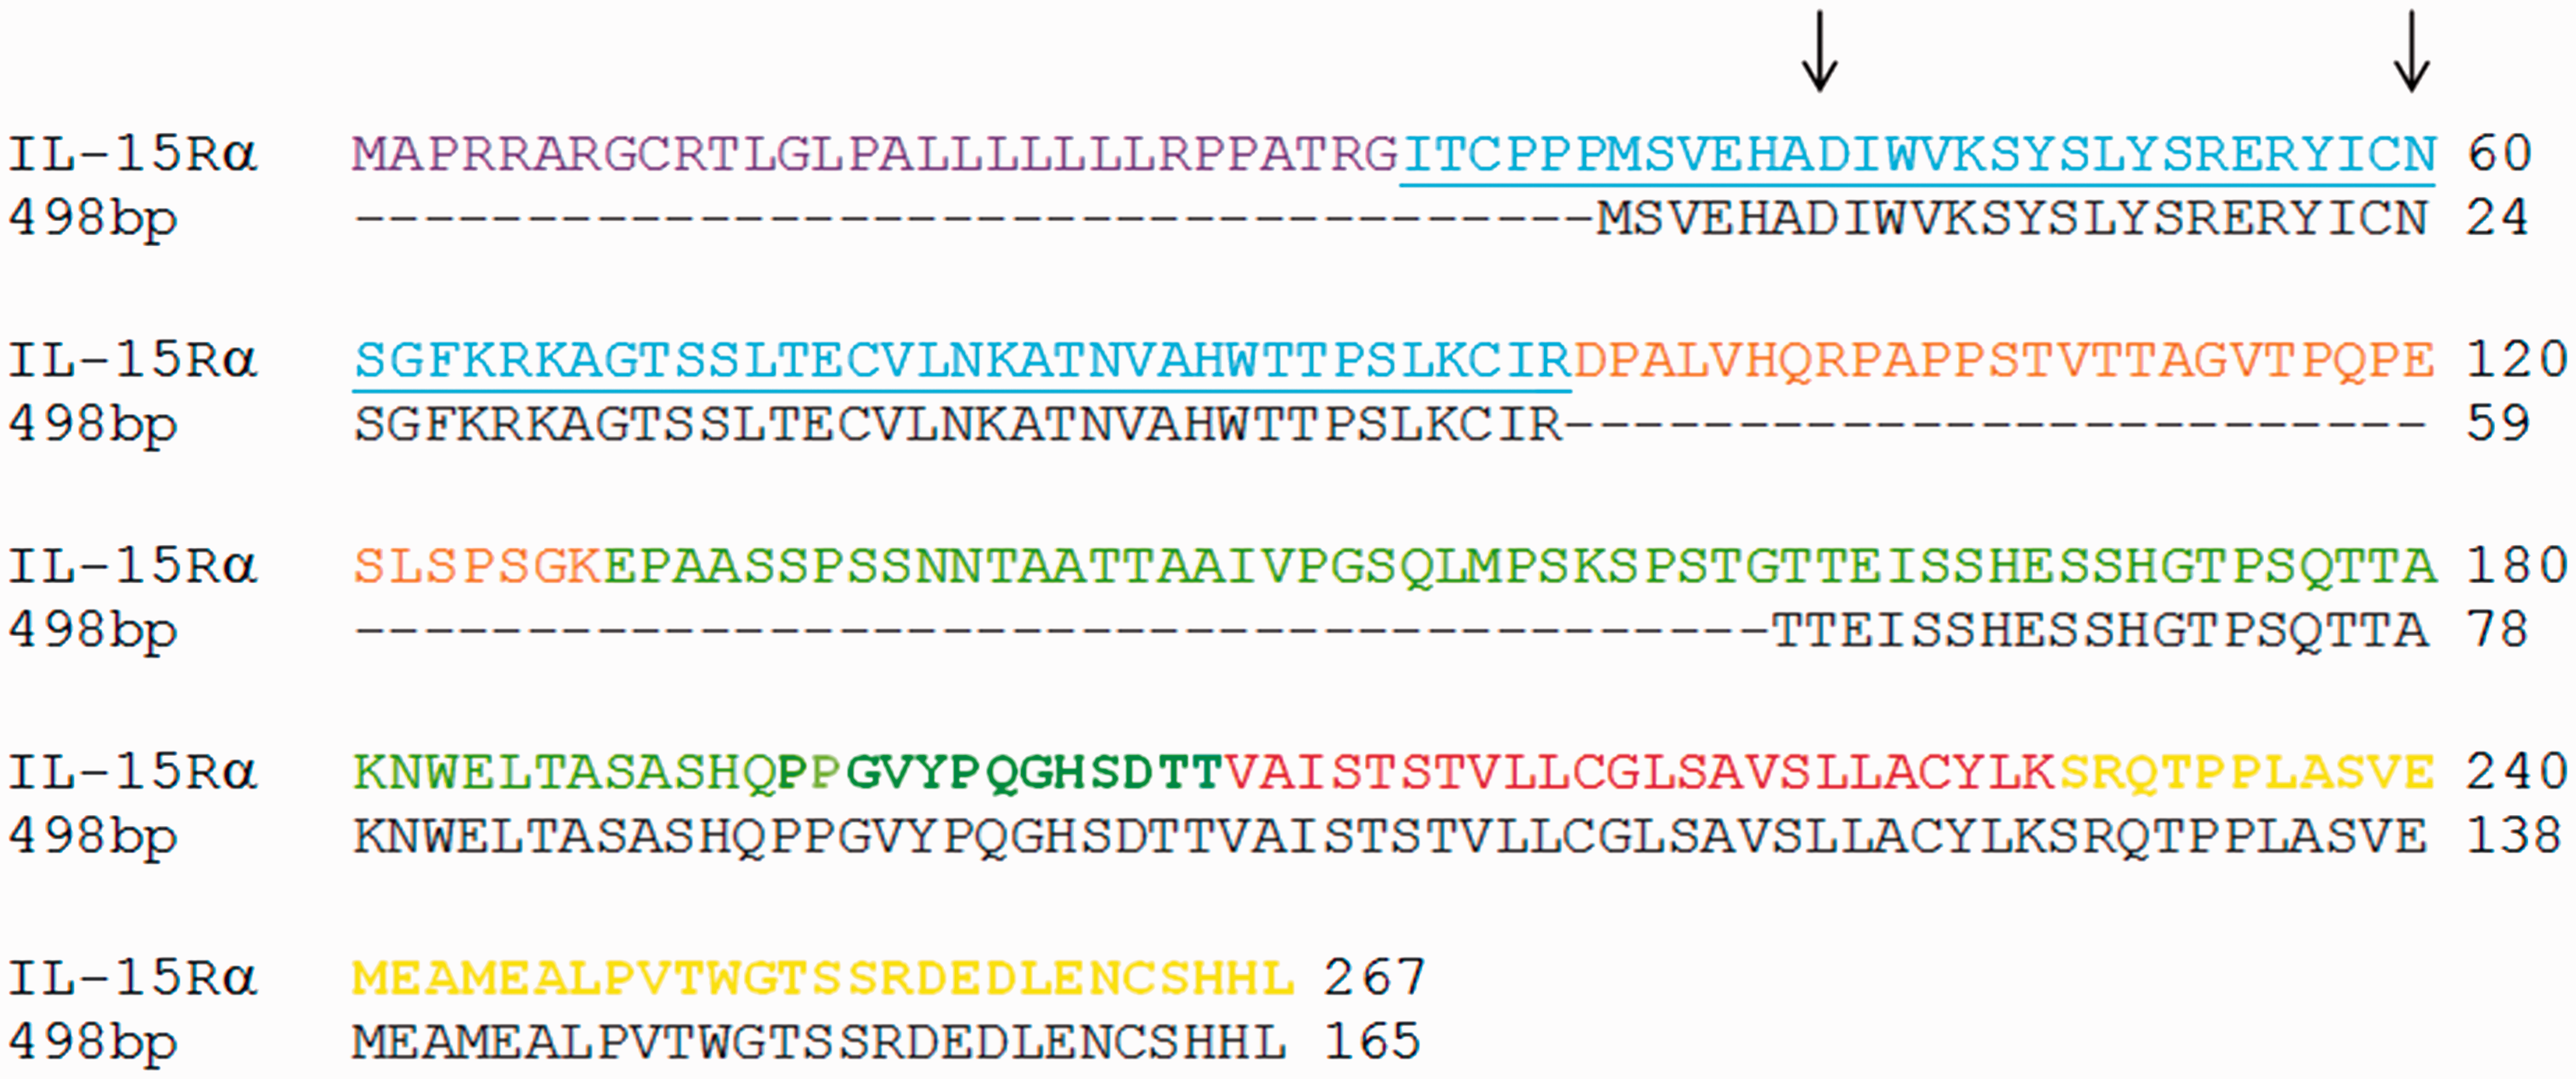
Protein expression of IL-15Rα isoforms and subcellular localization
To determine if variants of IL-15Rα were capable of being translated into proteins, a sub-cloning step was performed. Fused isoforms of IL-15Rα with the enhanced green fluorescent protein (EGFP) were easily detected in an inverted fluorescence microscope after Caco-2 cell transfection (48–72 h). Western blot analysis was then performed against EGFP. The only isoform that was not translated into protein was V3 498 bp (Figure 4), meaning that none of the expressed isoforms will be able to bind IL-15.
EGFP Western blot detection of transfected Caco-2 proteins. The approximate molecular mass is shown on the left and it is expressed in kDa. pEGFP: transfected cells with the empty vector; V: variant.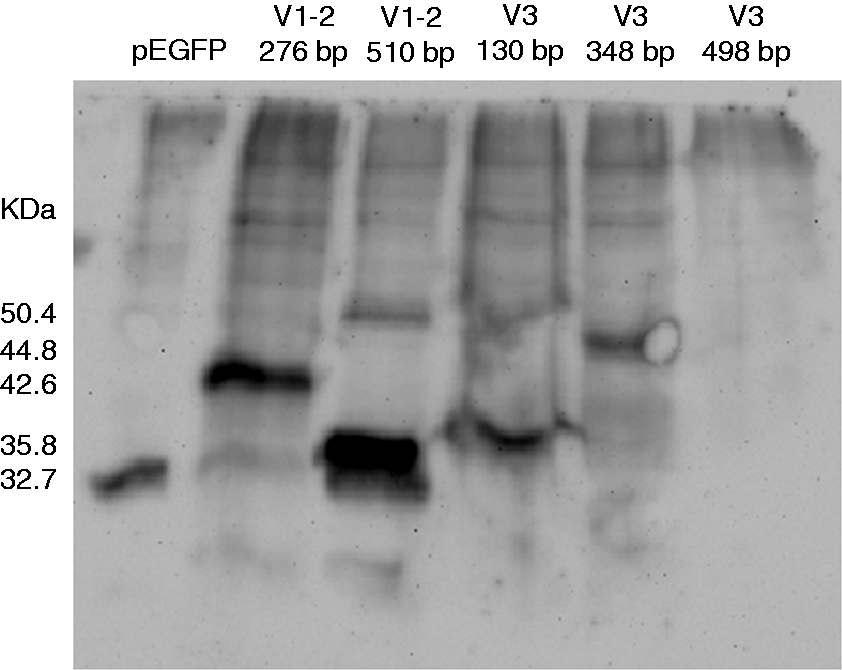
As observed in Figure 4, the remaining samples were detected in the corresponding molecular mass for the EGFP protein alone and, besides, an extra band which corresponds to the molecular mass of the transfected isoform together with EGFP: for the isoform containing 276 bp, a band of 42.6 kDa was detected; for the isoform containing 510 bp, a band of 50.4 kDa; and for the isoform containing 348 bp, a band of 44.8 kDa (Figure 4). Moreover, the detection of the isoform containing 130 bp resulted in a band of 35.8 kDa; that is, the predicted protein which starts in its second initiation codon (Figure 4 and Table 2). The subcellular localization of the different isoforms was also studied by immunofluorescence. All the isoforms showed a general cytoplasmic distribution, besides granular accumulation (Figure 5).
Immunofluorescence of transfected Caco-2 cells with pEGFP (control); isoforms containing 276 and 510 bp derived from variants (V) 1 and 2; and isoforms containing 130 and 348 bp derived from variant 3. Cell nucleus are shown in blue, EGFP fused proteins are shown in green and specific cell-compartment dyeing is shown in red. Calnexin was used to detect the endoplasmic reticulum; COPB was used to detect the Golgi apparatus; and lysosomal membrane-associated protein 1 (LAMP-1) was used to detect the lysosomes. Images were taken in a confocal Leica microscope (63 × objective). The bars indicate a size of 10 µm.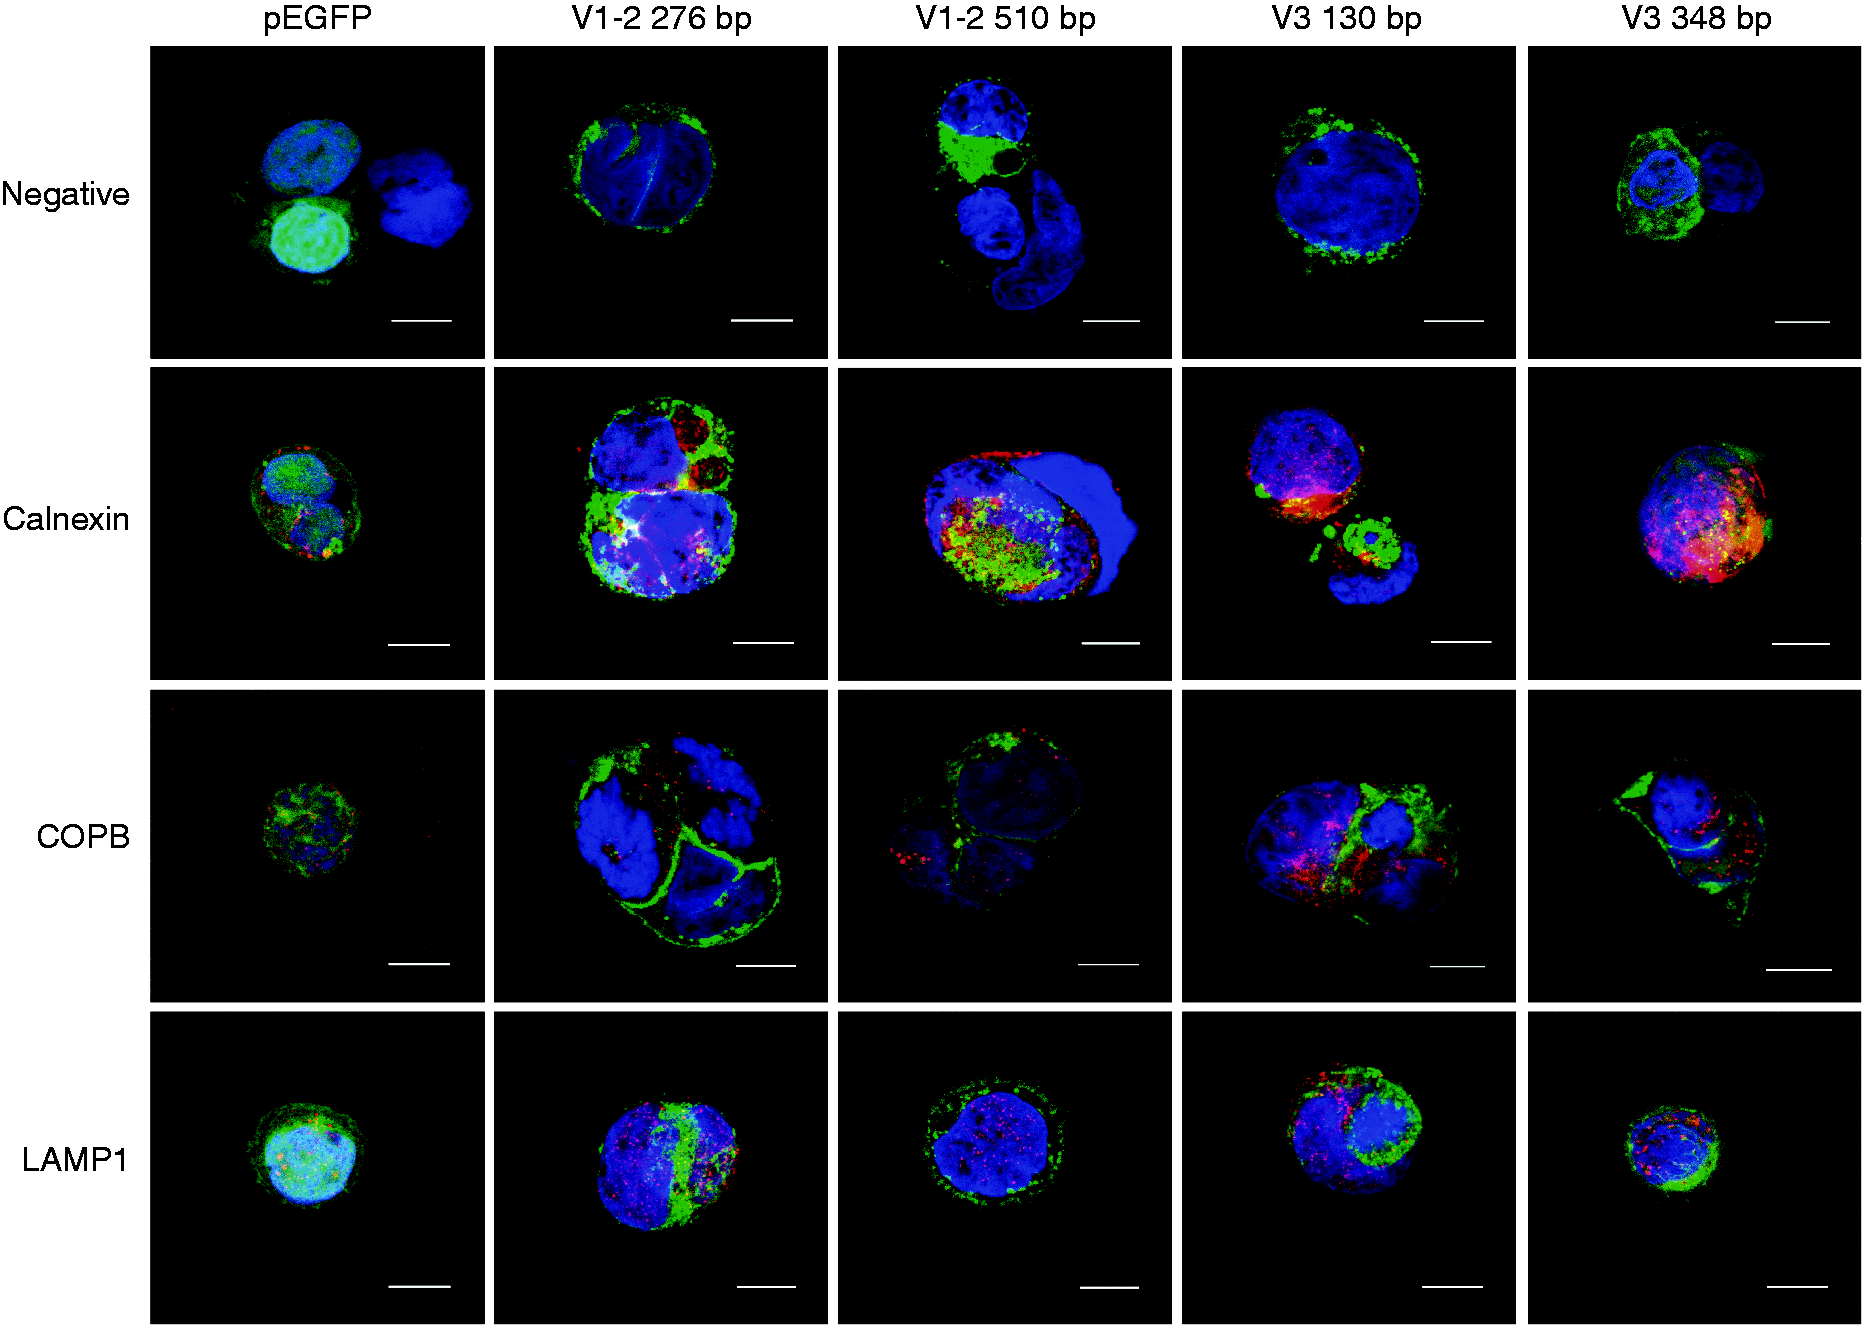
When the localization in different organelles was considered, all the isoforms partially co-localize within the endoplasmic reticulum. This observation is clearer for the isoforms containing 276 and the 348 bp, although a slight co-localization is also appreciated in transfected cells with pEGFP alone (Figure 5, calnexin panels). However, no co-localization was observed with Golgi apparatus (COPB) or lysosomal proteins (LAMP-1) (Figure 5).
Regulation of IL-15Rα isoforms by methylation of DNA
As expression of IL-15Rα can be specifically regulated through methylation of DNA in different tissues, 15 its expression was assessed in presence of an inhibitor of DNA methyltransferase. To that end, Caco-2 cells were cultured with 0.1, 1 and 10 µM AZA to inhibit the de novo methylation of DNA. Afterwards, specific quantitative PCR was performed for each isoform (Table 1). Isoforms whose sequence was embedded in the sequence of longer isoforms were quantified from the density of the agarose gel bands (Figure 1). As results after 24 h in the presence of AZA did not last long enough to have a consistent effect on cells (data not shown), stimulation was performed after 48 h.
The absence of DNA methylation significantly increased the expression of all the IL-15Rα splicing variants in the presence of AZA (Figure 6). The two isoforms derived from variant 3, which were evaluated semi-quantitatively, did not show the same variation; and even their expression was significantly decreased (Figure 6).
Expression of each isoform of IL-15Rα in cultured Caco-2 cells in presence of AZA for 48 h (n = 6). On the left side, the relative quantification of IL-15Rα variants and isoforms is shown; on the right side, the semi-quantitative expression of shorter IL-15Rα isoforms is shown. Median and interquartile range are represented. *P < 0.05, **P < 0.01. V: variant.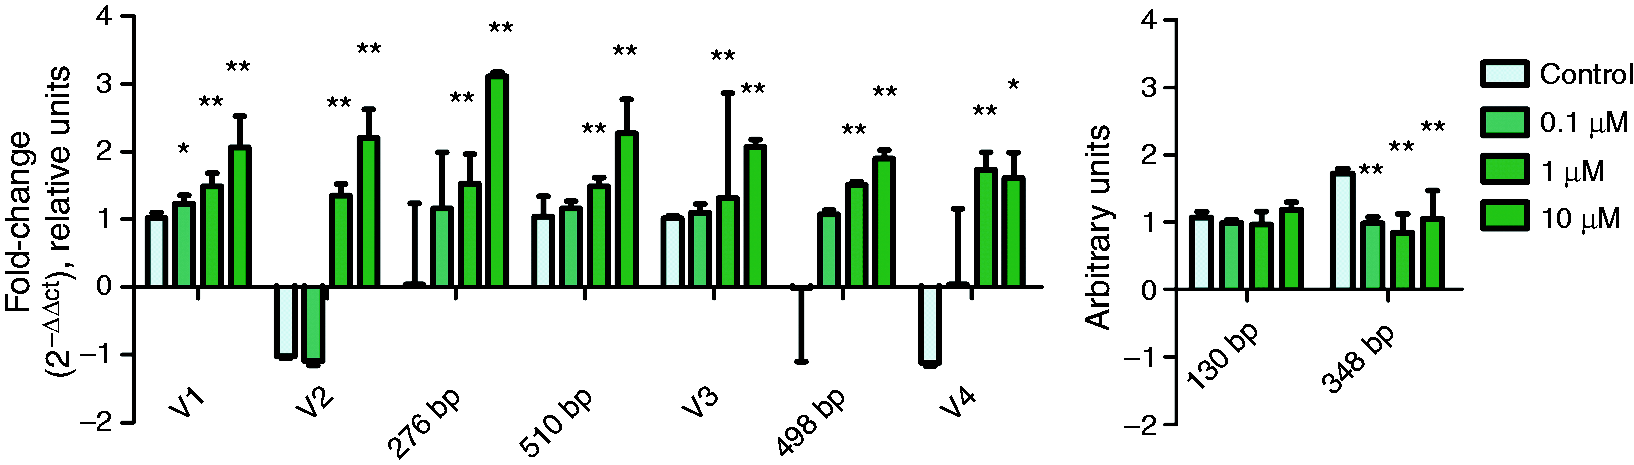
IL-15Rα isoforms in human epithelial cells
As IL-15Rα isoforms were described in Caco-2 cells, epithelial cells from healthy individuals were obtained by epithelial cell isolation and sorting to assess for IL-15Rα isoforms in vivo (n = 7, five of which were from colon and the remaining from duodenum). After specific PCR was performed for each of the IL-15Rα variants and isoforms, 348 and 130 bp isoforms (both of them derived from variant 3) were present in almost all epithelial samples (Figure 7). Other IL-15Rα isoforms were also present in epithelial cells from some of the donors as the 510-bp isoform was present in three of the samples; the 276-bp isoform was present in one of the samples; and the 498-bp isoform was present in two of the samples (Figure 7).
Expression of IL-15Rα isoforms in biopsy samples from healthy donors quantified by PCR. C: colon samples; D: duodenal samples; V: variant.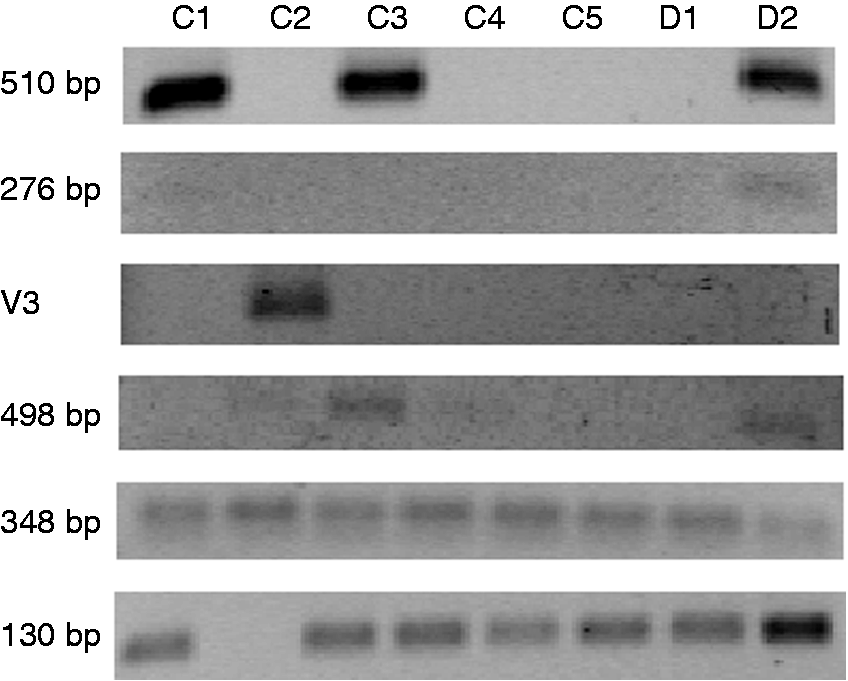
Discussion
Gene expression can be modulated differently in each tissue according to the methylation of the DNA chain, the modification of histone or the level of packing, among other factors. 20 All these epigenetic modifications are related to gene expression, as well as to the presence of different variants of splicing. 21 This work is focused on the intestinal epithelium as an essential physical barrier and an immunological regulator in the intestine. 17 Deregulation of the physiological environment around this layer may contribute to the development of autoimmune diseases such as celiac disease or IBD.16,17,22
We have identified five new IL-15Rα isoforms, not previously known, that co-exist in the intestinal epithelial cells. Two of them were derived from variants 1 and 2; the remaining isoforms were derived from variant 3. Although protein expression was confirmed for most of the IL-15Rα isoforms, none of them would be able to bind IL-15 as they lack the sushi domain (exon 2). Furthermore, none of the isoforms would follow the secretory pathway, as they did not co-localize with Golgi apparatus or lysosomal proteins, or showed a variation on the predicted molecular mass that may indicate a glycosylation process. As a result, their protein function is unclear. If these isoforms could be translated in vivo, the resulting proteins may have other signaling functions rather than being present in the cell membrane and participating in an IL-15-dependent signaling mechanism. Instead, these proteins might signal in alternative ways as all of them would have the cytoplasmic domain (codified by exon 7), which has been shown to participate in IL-15-independent signaling in different models.12,13
However, IL-15Rα isoform RNA could act by interfering in the normal process of translation of full-length IL-15Rα mRNA variants. In recent years, the comprehension of how genes are regulated is increasing as more players have been identified, such as microRNA, 23 long non-coding RNA or circular RNA.24,25 Indeed, processing of full-length IL-15Rα mRNA into smaller isoforms could act as a regulatory mechanism, as the availability of the full-length copy is limited, therefore decreasing the amount of IL-15Rα protein capable of binding IL-15 and signal through trans-presentation. Besides, these novel IL-15Rα isoforms may play a role on IL-15Rα mRNA stability, on nuclear–cytoplasm traffic, or as microRNA precursors.
It has been previously described that the IL-15Rα isoform lacking exon 2 is located in the endoplasmic reticulum, the Golgi apparatus or the cytoplasmic vesicles; 10 while isoforms lacking exon 3, exons 3 and 4, or exons 3 to 5 are located in the endoplasmic reticulum and/or the Golgi apparatus.26,27 The results described in this paper are in agreement with these studies as the five isoforms lack exon 2, 3 and, in some cases, exons 4 and 5, and they seem to be located in the cytoplasm and, partially, in the endoplasmic reticulum.
Furthermore, the results showed that IL-15Rα is regulated through methylation of DNA in Caco-2 cells as isoforms derived from variants 1 and 2 increased their expression in presence of AZA. Apparently, variant 3 is differently affected by the methylation of DNA as not all the isoforms derived from this variant increased their expression under the same conditions, and it may indicate that variant 3 and the 498-bp isoform are benefited by the lack of DNA methylation in comparison with other derived isoforms. In general, these results are in agreement with previous reports,15,28,29 suggesting that DNA methylation could underlie an isoform switch in IL-15RA. Whether the effect of DNA methylation on IL-15Rα gene is due to cis or trans methylation is not known as AZA acts as a general inhibitor of de novo methylation; however, Diniz et al. found evidence of regulation on a CpG island located on the regulatory 5’ upstream region and on the exon 1 of the IL-15Rα gene. 15 Furthermore, differences in the regulation through DNA methylation found between variant 3 and the remaining isoforms agree with the differences on IL-15Rα transcript sequences, as variant 3 sequence contains an alternative exon 1. Finally, the presence of the described isoforms was confirmed in epithelial cells from duodenal or colon biopsies from healthy individuals, proving their expression in vivo.
The role of the IL-15/IL-15Rα signaling pathway is crucial in autoimmune intestinal diseases, as well as in colorectal cancer. In autoimmune conditions, such as celiac disease and IBD, both IL-15 and IL-15Rα are up-regulated in the intestinal mucosa of patients suffering from these diseases, and this is maintained in patients with clinical remission.16,30 As a result, the proportion of CD8+ T cells or intraepithelial lymphocytes is increased and a chronic inflammation of the mucosa is developed. In colorectal cancer, IL-15 can play a dual role as a protective factor with anti-tumor effects, 31 and a contributor to mucosal hyperplasia and angiogenesis, resulting in tumor progression and metastasis. 32 Interestingly, other alternative splicing variants from cytokine receptors have already been associated to IBD,33,34 and with human colon cancer IL-8 expression. 35 Moreover, gene expression and alternative splicing are not only dependent on the tissue, but also on epigenetic factors, 21 and changes in the expression of intestinal genes have been found to be related to the inhibition of histone deacetylation 36 and an increased DNA methylation, 37 Several epigenetic mechanisms have been found to be differently regulated in the intestinal mucosa of patients with celiac disease, IBD and colorectal cancer.38–40 Interestingly, the IL-15 gene is hypomethylated in IBD. 41
In summary, five novel isoforms of IL-15Rα have been identified in human intestinal epithelial cells, which are commonly distributed through the cytoplasmic and endoplasmic reticulum compartments. These isoforms cannot bind IL-15 and their biological activity is unknown. Moreover, IL-15Rα mRNA was confirmed to be regulated by methylation of DNA. Further studies may be useful to clarify the pathogenesis of some intestinal diseases, bearing in mind that factors such as diet, gender or microbiota may affect the epigenetics of the intestine.
Footnotes
Acknowledgements
We thank Dr. Miguel Ángel de la Fuente for his technical help and helpful discussions, and Dr. Weihong Pan and Dr. Suidong Ouyang for their technical help. We also thank Dr. Luis Fernández Salazar for providing the human samples.
Declaration of Conflicting Interests
The author(s) declared no potential conflicts of interest with respect to the research, authorship, and/or publication of this article.
Funding
The author(s) disclosed receipt of the following financial support for the research, authorship, and/or publication of this article: This study was performed thanks to grants from the Junta de Castilla y León (VA016A10-2), Instituto de Salud Carlos III-FEDER (PI10/01647) and FPI-University of Valladolid. Junta de Castilla y León and Instituto de Salud Carlos III had no role in study design, data collection and analysis, decision to publish or preparation of the manuscript.