
Abstract
Sepsis is a major healthcare problem and a leading cause of death worldwide. There is no dependable diagnosis, and treatment for this condition remains mainly supportive. The etiology of sepsis is related to an overwhelming inflammatory response. In this regard, the antimicrobial protein lipocalin-2 (Lcn2) has been associated with several inflammatory conditions, but its contribution to polymicrobial sepsis is unclear. Polymicrobial sepsis was induced by cecal ligation and puncture (CLP), and Lcn2 mRNA levels and protein expression were measured in liver and lung tissues. We observed that Lcn2 expression was robustly induced in liver and lung of C57BL/6 J (B6) mice, and remained elevated during the stage of innate immune dysfunction observed in sepsis. This response was different in A/J mice, suggesting a contribution of the genetic background, probably due to differences in IL-10 expression between these two mouse strains. Indeed, IL-10 was found to regulate Lcn2 expression in both primary and J774A.1 macrophages. Thus, Lcn2 expression is highly regulated during CLP-induced sepsis, suggesting that this antimicrobial protein could have a role as a potential biomarker for the diagnosis of sepsis.
Introduction
Sepsis is one of the leading causes of death worldwide. Epidemiological studies have indicated that the incidence of sepsis is >750,000 cases per year in the USA with an unacceptably high mortality rate ranging from 30% to 50% depending on the severity of the disease. 1 In addition, the incidence of sepsis is expected to rise concurrently with the growing number of geriatric and immunocompromised patients and the increase in antibiotic resistance. 1 Currently, there is no treatment for sepsis, and the only available alternatives are supportive therapies such as antibiotic administration, fluid resuscitation and mechanical ventilation. Unfortunately, these measures have limited efficacy, and sepsis often progresses to severe sepsis and septic shock, multiple organ failure and death.1,2 Attempts to develop effective therapies or dependable early diagnostic and prognostic markers have not been very successful.
Sepsis is characterized by a rapid and acute inflammatory response elicited by the interaction of microbial products with pattern recognition receptors expressed on tissue macrophages, dendritic cells and various non-immune cells. 3 This initial hyper-inflammatory stage is accompanied by a massive infiltration of neutrophils into tissues where they generate reactive oxygen species (ROS) and release a plethora of serine proteases and antimicrobial proteins to eliminate invading pathogens. 4 However, excessive release of microbicidal factors and ROS by neutrophils is also detrimental for the host and has been associated with tissue damage, contributing to multiple organ failure. 5 An important process to control infection is the release of antibacterial peptides, which also need to be regulated in an effective manner to restore homoeostasis.
Lipocalin-2 (Lcn2) is an abundant 23 kDa antimicrobial polypeptide originally identified in the secondary granules of human neutrophils in association with the 92 kDa gelatinase matrix metalloproteinase 9 (MMP-9). 6 Lcn2 was initially coined neutrophil gelatinase-associated lipocalin. Since this initial discovery, expression of Lcn2 has been detected both in normal tissues 7 and in many other cell types such as epithelial cells, hepatocytes and macrophages.8–12 In addition, numerous studies have shown that tissue and circulating levels of Lcn2 are significantly increased in malignancies, as well as several acute and chronic inflammatory diseases.7,12,13 Furthermore, Lcn2 has been shown to be protective against Gram-negative infection.14–16 Lcn2 exerts bacteriostatic properties by binding and sequestering iron-scavenging siderophores secreted by invading bacteria, thereby limiting bacterial iron uptake and, thus, growth. 15 In addition to its beneficial role in controlling bacterial growth, several studies have suggested that Lcn2 may also induce apoptosis, although these pro-apoptotic properties have been somewhat controversial. 17
Little is known about the regulation of Lcn2 in the context of polymicrobial infection. Therefore, the present study was aimed at investigating how Lcn2 is regulated during the development of sepsis induced by cecal ligation and puncture (CLP), the gold standard animal model to study polymicrobial sepsis. We found that Lcn2 expression in C57BL/6 J (B6) mice was rapidly and robustly induced in both liver and lungs following CLP. We demonstrate that Lcn2 expression is sustained throughout the entire survival period of the experimental animal.
Materials and methods
Animals
C57BL/6 J and A/J mice were obtained from The Jackson Laboratory (Bar Harbor, ME, USA) and maintained under specific pathogen-free conditions at the University of California, San Diego (UCSD) Animal Facility (La Jolla, CA, USA). Experiments were carried out with 8–9-wk-old male animals. All procedures were approved by the UCSD Institutional Animal Care and Use Committee.
CLP
Male C57BL/6 J (B6) and A/J mice were fasted for 16 h before the procedure. Animals were anesthetized with isoflurane, and, under sterile conditions, a 2-cm incision was made in the lower abdominal region and the cecum exposed. The distal portion of the cecum was ligated 1.5 cm from the end with a 4-0 silk suture and punctured once with a 16-gauge needle. The cecum was mobilized back into the peritoneal cavity and squeezed to place a small portion of its contents (bacteria and feces) into the peritoneum. Then, the peritoneal wall and skin were closed in two layers with silk sutures. Mice were resuscitated with a 1-ml subcutaneous injection of sterile saline (0.9%). After the procedure, mice had access to water and food at libitum. As a control, mice were sham operated as described above except that the cecum was neither ligated nor perforated. Non-operated (NO) mice were also used as a second control. Liver, lung and spleen tissues were perfused to minimize polymorphonuclear leukocyte contamination and harvested at different time points after sham or CLP procedures, flash frozen in liquid nitrogen, and then stored at –80℃ for subsequent processing.
RNA extraction, cDNA production and quantitative real-time PCR
Levels of mRNA were measured by quantitative real-time PCR (qPCR). Liver, lung and spleen tissues were homogenized in TRIzol reagent (Invitrogen, Carlsbad, CA, USA) using an Ultra-turrax T25 (IKA, Wilmington, NC, USA). RNA was purified according to the manufacturer’s protocol and treated with DNase I (DNA-free kit, Ambion, Austin, TX, USA) to remove any DNA contamination. DNA-free RNA was then reverse transcribed to cDNA using the High Capacity Reverse Transcription Kit (Applied Biosystems, Foster City, CA, USA). Newly synthesized cDNA was further diluted and stored at –20℃. The cDNA levels were measured by qPCR using the QuantiTect SYBR Green PCR kit (Qiagen, Valencia, CA, USA) with QuantiTect-validated primer sets [TNF-α: QT00104006; IL-6: QT00098875; IL-10: QT00106169; IFN-γ: QT01038821;Lcn2: QT00113407; CRAMP: QT00241003 (all from Qiagen)]. All PCR reactions were performed using the 7500 Fast Real-Time PCR System (Applied Biosystems). Melting curve analysis was performed for each primer set to ensure amplification specificity. Corresponding standard curves were added in each PCR reaction. The housekeeping gene GAPDH (QT01658692; Qiagen) was used to normalize data to cDNA inputs. Results are expressed either as copy numbers of target gene per copy numbers of GAPDH or fold increase over control animals.
Peritoneal macrophage isolation and LPS treatment
Naïve peritoneal macrophages (PMφs) were obtained as previously described. 18 The peritoneal cavities of B6 and A/J mice were washed with 5 ml of ice-cold RPMI1640 containing antibiotics. Cells were centrifuged for 10 min at 300 g and re-suspended in RPMI1640 supplemented with 10% FBS and antibiotics. Cells were then plated for 1 h at 37℃, washed twice and incubated for an additional 16 h. Analysis by flow cytometry showed that over 90% of the cells were Mφs (F4/80-positive). PMφ were treated with 10 ng/ml LPS (Escherichia coli 026:B6; Sigma-Aldrich, St. Louis, MO, USA), 10 ng/ml recombinant mouse IL-10 (Cell Signaling Technology, Danvers, MA, USA) or 10 ng/ml of both LPS + IL-10 for 4 h at 37℃. Control cells were incubated with PBS alone. Cells were harvested, and RNA was prepared using RNeasy Mini Kit (Qiagen) according to the manufacturer’s protocol. After DNAse I treatment and reverse transcription using a High Capacity Reverse Transcription Kit (Applied Biosystems), cDNA levels were quantified by qPCR as described above for liver and lung tissues.
Macrophage J774A.1 cell line treatment
J774A.1 cells were treated with 10 ng/ml LPS (E. coli 026:B6), 10 ng/ml recombinant mouse IL-10 (Cell Signaling Technology) or 10 ng/ml of both LPS + IL-10 for different periods of time. For IFN-γ treatment, J774A.1 cells were pre-treated with 10 ng/ml of recombinant mouse IFN-γ (Biolegend, San Diego, CA, USA) for 30 min and incubated for an additional 4 h with or without 10 ng/ml LPS. Control cells received only PBS. For endotoxin tolerance experiments, J774A.1 cells were treated as previously decribed. 19 Briefly, cells were pre-incubated for 20 h with medium (M) or 10 ng/ml LPS, washed and stimulated with medium only or 10 ng/ml LPS for 4 h. The four conditions of stimulation are designated M/M, M/LPS, LPS/M and LPS/LPS corresponding to pre-treatment/stimulation. At the end of the incubation time, cells were harvested, and total RNA was isolated using RNeasy Mini Kit (Qiagen) according to the manufacturer’s protocol. After DNAse I treatment and reverse transcription, cDNA levels were measured by qPCR as described above.
Immunoblot analysis
Liver samples were lysed and homogenized for 30 s in lysis buffer (50 mM Tris-HCl, pH 7.5, 150 mM NaCl, 1% Triton X-100, 2 mM EDTA containing protease inhibitor mixture; Roche, Indianapolis, IN, USA) using a tissue homogenizer. Sample homogenates were incubated for 30 min at 4℃ and then centrifuged at 10,000 g for 8 min at 4℃. The supernatant was collected, and a 10 -µl aliquot was used to determine protein concentration using a BCA protein assay (Pierce Biotechnology, Rockford, IL, USA). Tissue homogenates were mixed with NuPAGE LDS sample buffer (Life Technologies, Carlsbad, CA, USA) and 50 µg of total protein resolved by SDS-PAGE using NuPAGE 4–12% Bis-Tris gels (Life Technologies). Proteins were then transferred to nitrocellulose membranes and blocked with 5% BSA (Sigma, St. Louis, MO, USA) diluted in Tris-buffered saline (TBS) for 1 h at room temperature (23℃). Blots were probed with goat anti-mouse Lcn2 polyclonal Abs (1:1000; R&D Systems, Minneapolis, MN, USA) in 5% BSA–TBS and incubated overnight at 4℃ followed by three 15-min washes with TBS supplemented with 0.1% Tween 20 (TBST) at room temperature. Blots were then incubated with HRP-conjugated donkey anti-goat IgG Abs (1:4000; Santa Cruz Biotechnology, Dallas, TX, USA) in 5% BSA–TBS for 1 h at room temperature. After three 15-min washes in TBST, bands were detected by chemiluminescence using SuperSignal reagents (Pierce Biotechnology). As a loading control, blots were probed with mouse anti-mouse β-actin monoclonal Abs (1:3000; Thermo Scientific, Waltham, MA, USA) in 5% BSA–TBS overnight (16 h) at 4℃. Goat anti-mouse HRP-conjugated IgG secondary Ab (1:3000; Thermo Scientific) was used for 1 h at room temperature, followed by chemiluminescence detection. Chemiluminescence data were acquired using the ChemiDoc MP system (Bio-Rad, Hercules, CA, USA), and densitometry analyses were performed using Image Lab software (Bio-Rad).
Statistical analysis
All data were analyzed using GraphPad Prism (GraphPad Prism Software, San Diego, CA, USA). Significance was analyzed using a one-way Student’s t-test, followed by Newman–Keuls multiple comparison test or two-way ANOVA followed by Bonferroni multiple comparison test. A P-Value of <0.05 was considered statistically significant.
Results
Robust and sustained expression of Lcn2 in the liver and lung of B6 mice following polymicrobial sepsis
To determine the expression of Lcn2 mRNA in the context of polymicrobial sepsis, B6 mice were subjected to CLP or sham operation (SO), and tissues were perfused and collected at different time points after surgery. Non-operated (NO) animals were used as controls. Levels of Lcn2 mRNA in liver were then determined by qPCR and normalized by GAPDH levels. Following CLP, Lcn2 mRNA levels were rapidly and robustly amplified in the liver of B6 mice to values that greatly exceeded those of the GAPDH housekeeping gene (Figure 1A). Lcn2 expression significantly increased 3 h after CLP compared with SO animals and reached maximal expression at 6 h. Further analysis showed that Lcn2 mRNA levels remained elevated 30 h after CLP, which correlated very closely to the time of death after CLP in our experimental conditions (Figure 1A). Increased and sustained mRNA expression of Lcn2 in septic animals was also confirmed at the protein level, with significant Lcn2 expression as early as 3 h after CLP compared with SO animals (Figure 1B).
Sustained expression of Lcn2 in liver of B6 animals following CLP-induced sepsis. Male B6 mice (n = 4–5) were subjected to SO or CLP procedure and livers were harvested at different time points. The NO group was used as control and as time 0 for the kinetic experiment. (A) Lcn2 gene expression was determined by qPCR at each time point as indicated in the Materials and methods. Data are expressed as the mean ± SEM. Statistical analysis for the time course of CLP was performed by one-way ANOVA, and comparison between CLP and sham operation was measured by two-way ANOVA. *P < 0.05 CLP vs. SO at each time point. (B) Western blot analysis of Lcn2 expression at 3 h, 20 h and 30 h after sham or CLP procedure. A blot representative of three separate experiments is shown. Anti-β actin Abs were used to ensure that equivalent protein concentrations were loaded in each lane. Densitometry analysis was performed using Image Lab software.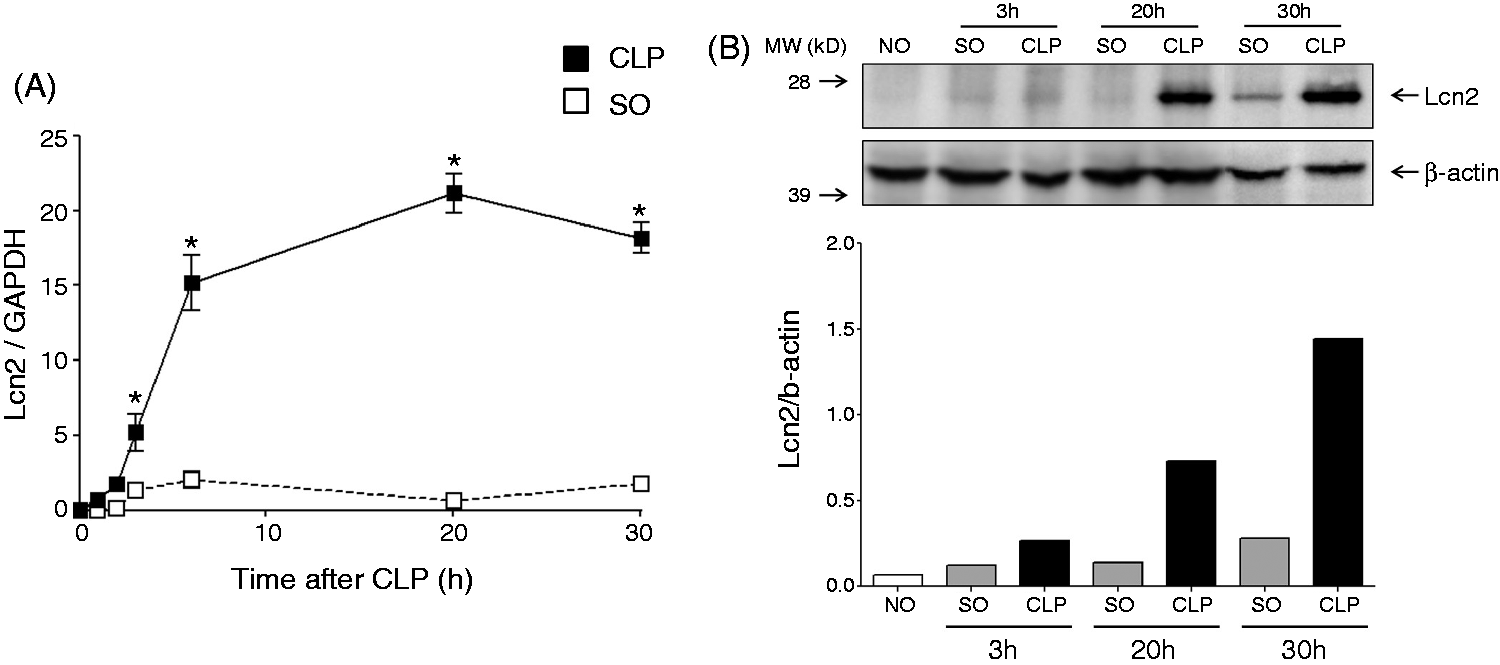
We also investigated the expression of Lcn2 in lung after CLP as this organ is the first to fail during septic shock and is rapidly affected after CLP in experimental animal models.20,21 In control animals, basal levels of Lcn2 mRNA were significantly more elevated in the lung than in the liver (Figure 2A). The variation in basal Lcn2 mRNA and protein expression between these two tissues is likely explained by the fact that lungs are constantly exposed to airborne pathogenic microorganisms and, therefore, high basal Lcn2 expression may be a natural host defense mechanism to prevent pulmonary infections. Similar to what was observed in the liver, pulmonary Lcn2 mRNA levels were rapidly increased, plateaued at 3 h and remained elevated for 30 h after CLP procedure (Figure 2B). Altogether, these data indicate that Lcn2 was rapidly and robustly induced in the liver and lungs of B6 animals following CLP.
Kinetic expression of Lcn2 in the lung of B6 animals following CLP-induced sepsis. Male B6 mice (n = 4–5) were subjected to SO or CLP procedure and lungs were harvested at different time points. The NO group was used to determine basal levels of Lcn2 in liver and lung tissues and as time 0 for the kinetic experiment. (A) Basal expression of Lcn2 mRNA in liver and lung tissues. (B) Lcn2 gene expression was determined by qPCR at each time point as described in Materials and methods. Data are expressed as the mean ± SEM. Statistical analysis for the time course of CLP was performed by one-way ANOVA, and comparison between CLP and sham operation was measured by two-way ANOVA. *P < 0.05 CLP vs. sham-operated at each time point.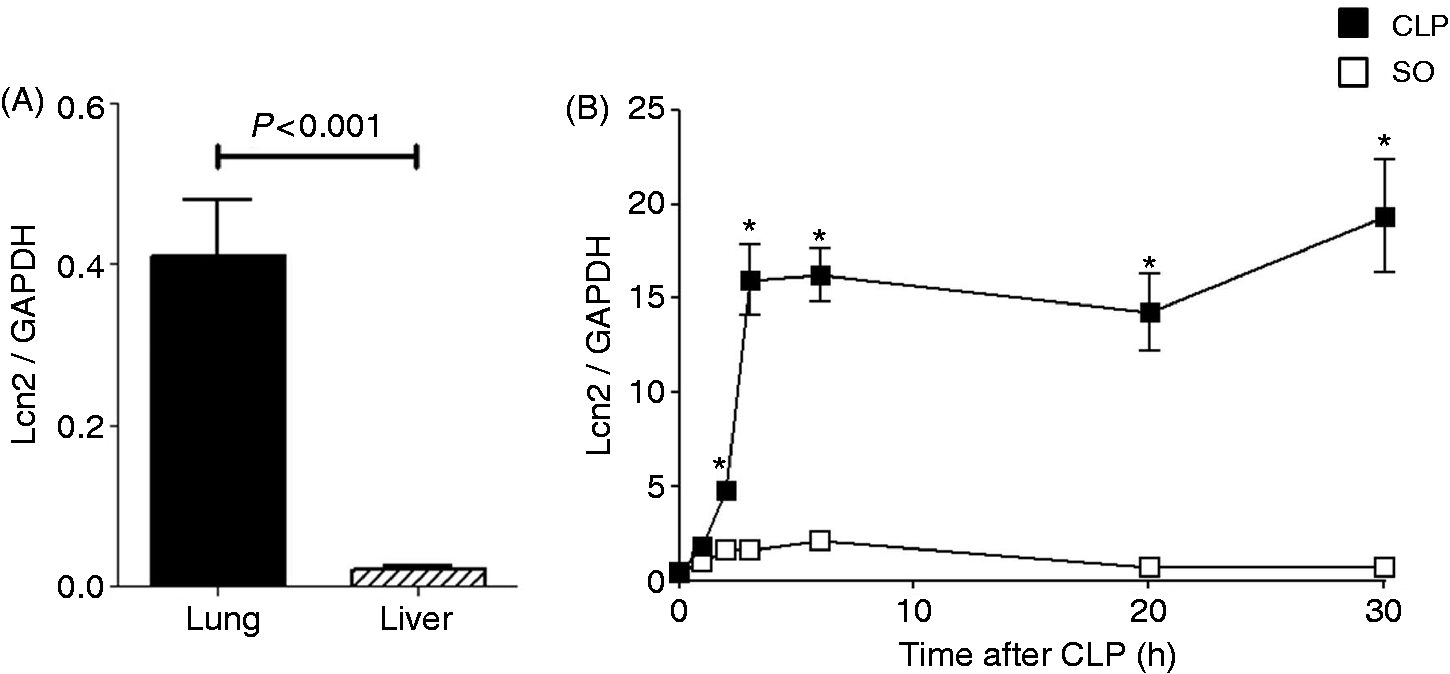
CRAMP was also strongly induced in the liver and lung after CLP, but its kinetic of expression differs from Lcn2
To test whether gene expression of other antimicrobial peptides, also present in secondary granules of neutrophils, was up-regulated after CLP, mRNA levels of cathelicidin-related antimicrobial peptide (CRAMP), the murine counterpart of the human cathelicidin (LL-37), was also determined by qPCR. Similarly to Lcn2, basal levels of CRAMP mRNA in control animals were higher in lung than in liver (Figure 3A). Kinetic analysis showed that a significant increase of CRAMP mRNA was observed as early as 2 h after CLP when compared with SO animals in both liver and lung (Figure 3B). Thereafter, the maximum levels of CRAMP mRNA were reached at 6 h in the liver and at 3 h in the lung post-CLP. However, CRAMP mRNA levels dramatically decreased in both tissues in contrast to our observations with Lcn2 (Figure 3B). These data show that CRAMP was also strongly induced in both liver and lung in CLP-induced sepsis but with a different kinetic of expression to that observed for Lcn2.
Kinetic expression of CRAMP mRNA in CLP-induced sepsis. Male B6 mice (n = 4–5) were subjected to SO or CLP procedure and tissues were harvested at different time points. The NO group was used to determine basal levels of CRAMP in liver and lung tissues and as time 0 for the kinetic experiment. (A) Basal expression of CRAMP mRNA in liver and lung tissues. (B) CRAMP gene expression was determined in liver (upper panel) and lungs (lower panel) at each time point by qPCR by comparison with a standard curve and expressed as copy numbers. The values were normalized to GADPH mRNA levels. Data are expressed as the mean ± SEM. Statistical analysis for the time course of CLP was performed by one-way ANOVA, and comparison between CLP and sham operation was measured by two-way ANOVA. *P < 0.05 CLP vs. sham-operated at each time point.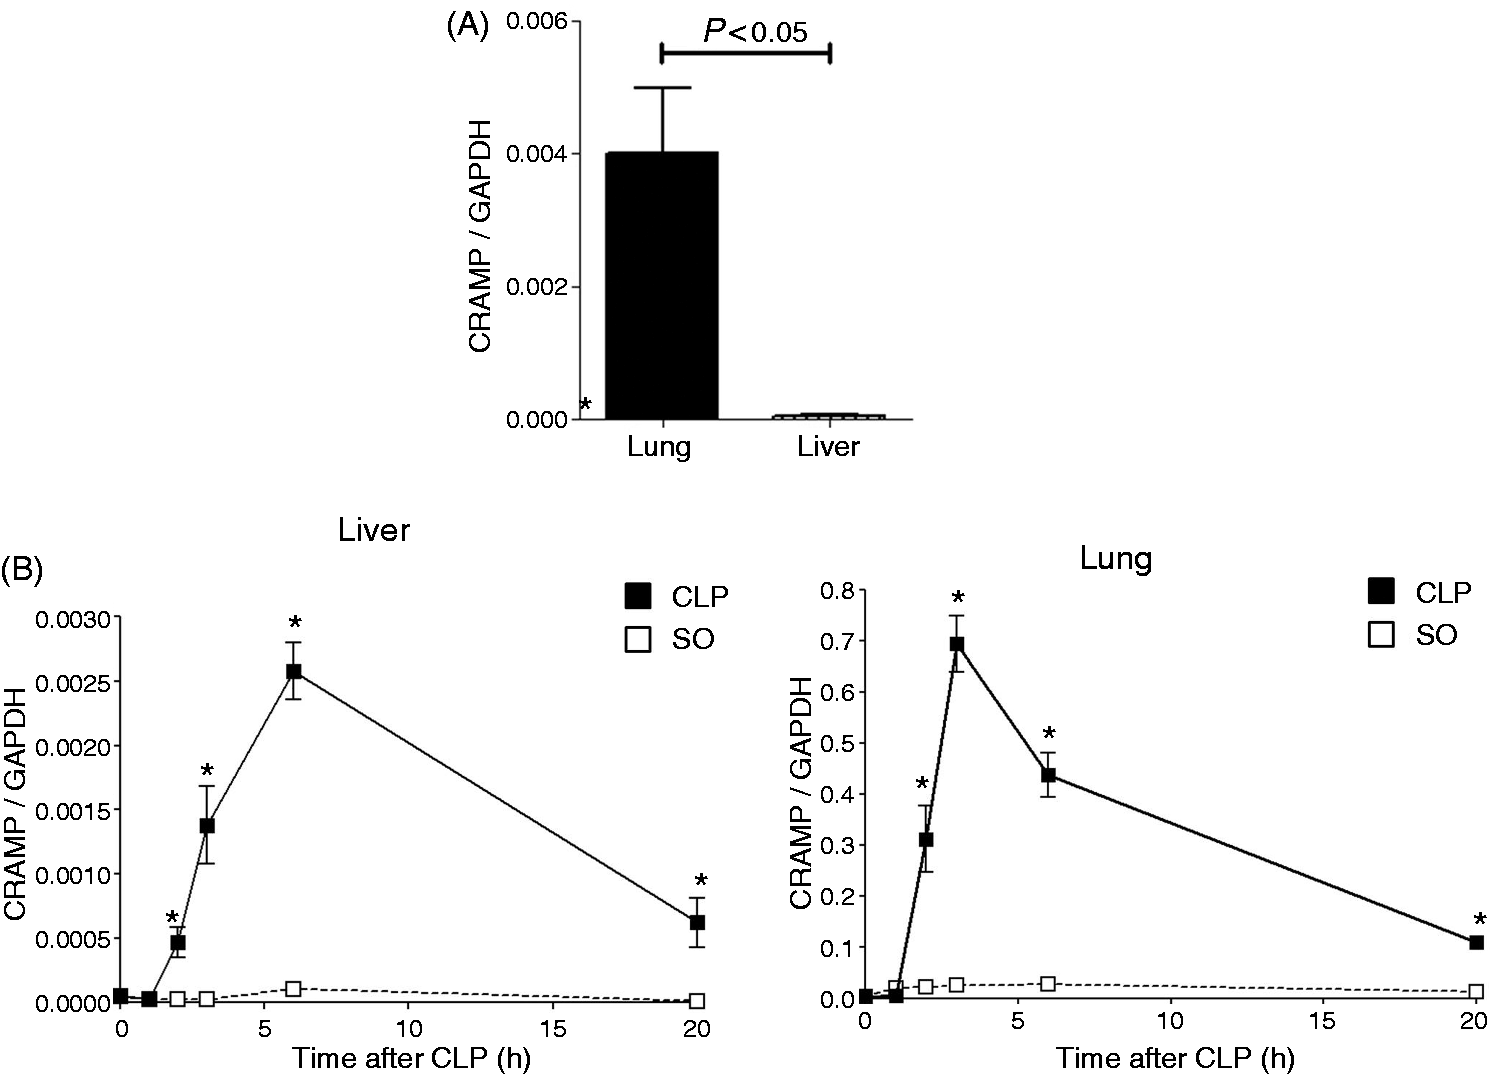
Elevated expression of Lcn2 in the period of innate immune dysfunction following CLP-induced sepsis
We have previously demonstrated that the early hyper-inflammatory phase observed following CLP-induced sepsis is followed by a period of innate immune dysfunction characterized by a severe decreased expression of most inflammatory mediators.
21
In this dysfunctional stage, LPS injection of CLP-treated animals resulted in a diminished expression of TNF-α and IFN-β in both liver and lung when compared with LPS-injected SO animals.
21
To investigate how Lcn2 is affected during this period of innate immune dysfunction, we used the same two-hit model (CLP + LPS). B6 animals were subjected to CLP, SO or left untreated (NO), and were challenged with LPS (15 mg/kg) at 20 h after the initial procedure. After 2 h of LPS treatment, Lcn2 mRNA levels were measured in both liver and lung. As a negative control, a group of mice that were neither subjected to CLP nor treated with LPS was included. Lcn2 mRNA levels following SO + LPS treatment were statistically increased in both tissues in comparison with the NO + LPS group, indicating that sham procedure has an effect on Lcn2 expression (Figure 4A). More importantly, Lcn2 mRNA levels were further increased in the CLP + LPS group compared with the SO + LPS group (Figure 4A). Similar results were obtained in spleen (Figure 4B), which also showed decreased expression of TNF-α in the CLP + LPS group compared with the SO + LPS group following LPS treatment (Supplementary Figure 1A). Taken together, these data suggest that the capacity for these tissues to produce Lcn2 remains unaffected during the innate immune dysfunction stage observed in sepsis.
Elevated expression of Lcn2 during the period of innate immune dysfunction following CLP-induced sepsis. Male B6 mice (n = 6–7) were subjected to CLP, SO or NO. At 20 h after the initial operative procedure, the mice were injected with LPS (15 mg/kg, i.p.) and sacrificed after 2 h. (A) Liver (left panel) and lung (right panel), and (B) spleen samples were harvested, and total RNA was isolated. Lcn2 mRNA levels were measured by qPCR. Statistical analysis for the comparison between groups was performed by one-way ANOVA. *P < 0.05.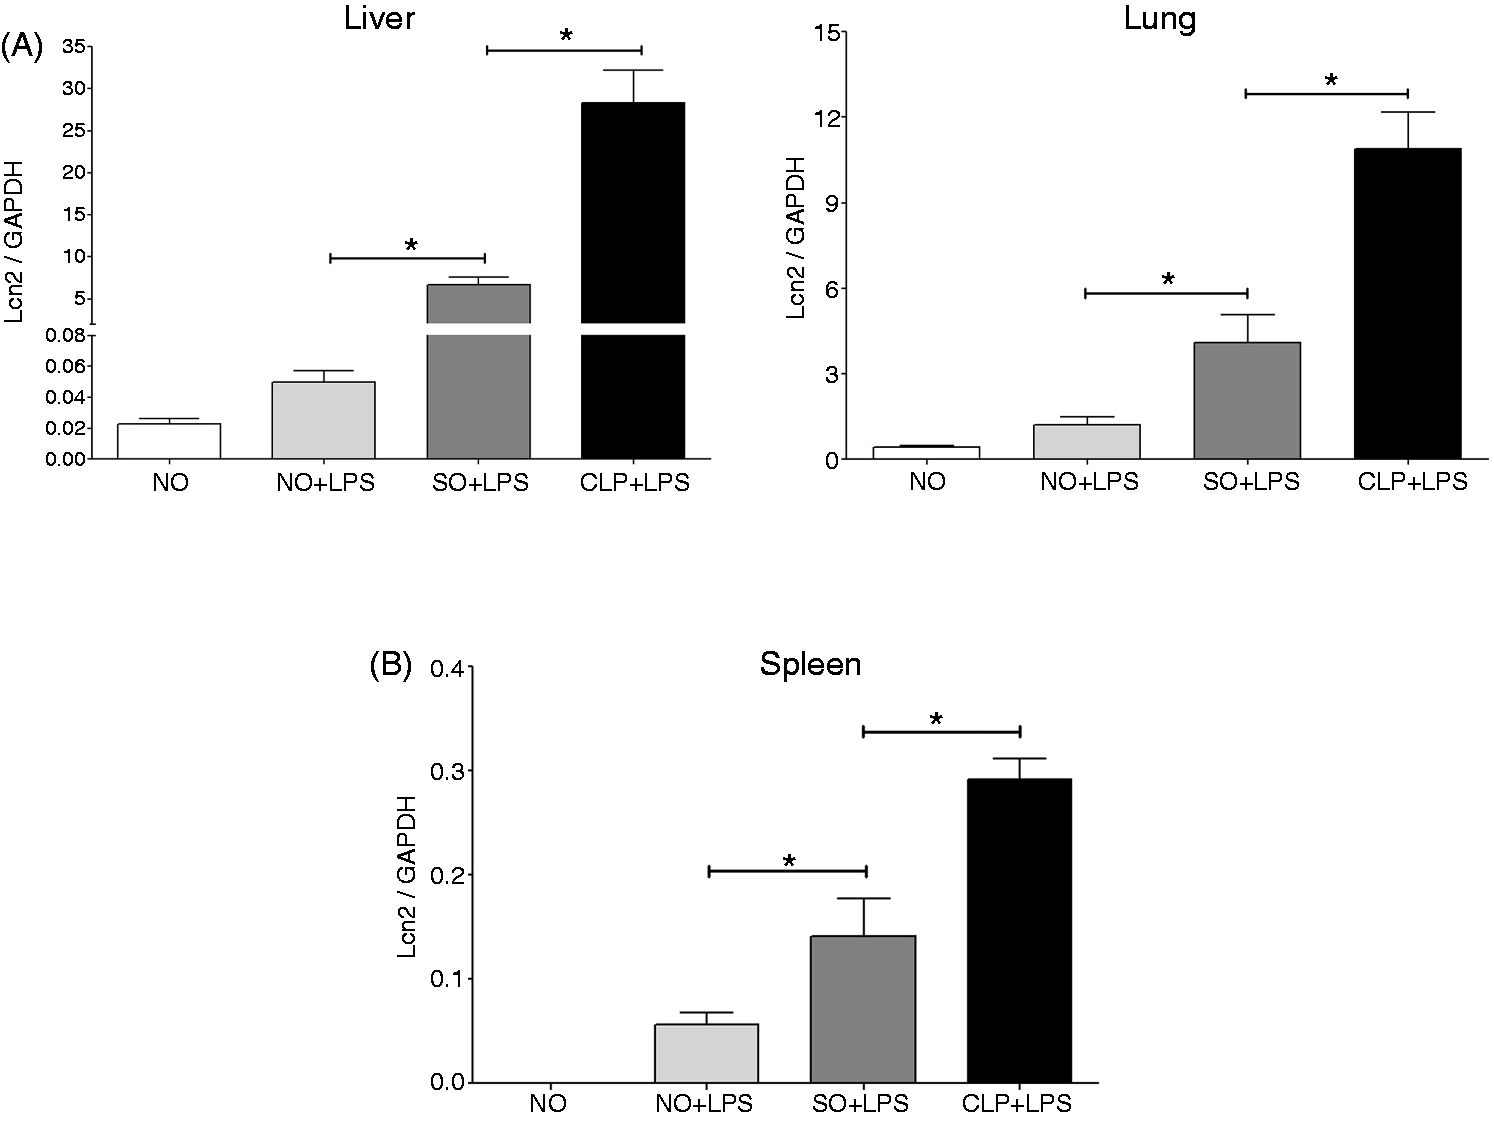
IL-10 potentiates LPS-mediated Lcn2 gene and protein expression
IL-10 is a potent anti-inflammatory cytokine that inhibits the production of several pro-inflammatory cytokines such as TNF-α and IL-6.
22
In contrast, recent studies have shown that expression of Lcn2 is up-regulated by IL-10 treatment.23,24 Our previous studies have shown that IL-10 expression remained elevated in the liver and even significantly increased in the lung of LPS-injected CLP-treated animals compared with LPS-treated SO mice.
21
Elevated expression of IL-10 was also found in the spleen of LPS-treated septic animals (CLP + LPS) compared with LPS-treated SO mice (Supplementary Figure 1B). We therefore tested whether or not IL-10 controls Lcn2 expression in the context of an inflammatory response. To test this hypothesis at the cellular level, J774A.1 cells were treated with IL-10 (10 ng/ml), LPS (10 ng/ml) or LPS + IL-10 (both at 10 ng/ml) for different periods of time, and gene expression for Lcn2 was determined by qPCR. Control macrophages (CTL) were left untreated. The amount of secreted Lcn2 in the supernatants of control and treated J774A.1 cells was determined after 24 h of treatment by Western blotting. Treatment of J774A.1 cells with IL-10 alone resulted in a significant increase of Lcn2 mRNA expression at 4 h (Figure 5A, insert, left panel). Following LPS challenge, Lcn2 mRNA expression increased in a time-dependent manner, and this LPS effect was further enhanced by the addition of IL-10 (Figure 5A, left panel). This effect of IL-10 on LPS-mediated Lcn2 expression was also observed at the protein level (Figure 5A, right panel). In contrast, LPS-induced expression of TNF-α and IL-6 was strongly inhibited by co-stimulation with IL-10 (Figure 5B). Similar experiments were carried out in isolated naïve Pmφ from B6 mice stimulated for 4 h with IL-10, LPS, or LPS + IL-10. As observed for J774A.1 cells, IL-10 alone faintly, but significantly, increased Lcn2 mRNA expression (Figure 5C). In addition, co-treatment of Pmφ with LPS and IL-10 amplified Lcn2 mRNA levels compared with LPS-stimulated Pmφ (Figure 5B). These data clearly indicate that IL-10 potentiates LPS-mediated Lcn2 expression.
IL-10 potentiates LPS-mediated Lcn2 gene expression. (A) J774A.1 cells were treated with 10 ng/ml LPS, 10 ng/ml recombinant mouse IL-10, or 10 ng/ml of both LPS and IL-10 for 1, 2 and 4 h for mRNA levels or for 24 h for protein determination. Control cells were treated with PBS alone. Total RNA was isolated, reversed transcribed to cDNA and the levels of Lcn2 (left panel) were measured by qPCR as described in the Materials and methods. For detection of Lcn2 secretion, supernatants from treated and control cells incubated for 24 h were harvested and subjected to Western blotting using anti-Lcn2 Abs. Western blot is representative of three independent experiments. (B) J774A.1 cells were treated with 10 ng/ml LPS, 10 ng/ml recombinant mouse IL-10, or 10 ng/ml of both LPS and IL-10 for 1, 2 and 4 h for mRNA levels. Control cells were treated with PBS alone. Total RNA was isolated, reversed transcribed to cDNA, and the levels of TNF-α and IL-6 were measured by qPCR as described in the Materials and methods. (C) Naïve PMφ were isolated from male B6 mice (n = 5). PMφ were treated with 10 ng/ml LPS, 10 ng/ml recombinant mouse IL-10 or 10 ng/ml of both LPS + IL-10 for 4 h at 37℃. Control cells were incubated with PBS alone. Cells were harvested, and RNA was prepared and reverse-transcribed to cDNA. Levels of Lcn2 (left panel), TNF-α (middle panel) and IL-6 (right panel) were measured by qPCR. All qPCR data are expressed as the mean ± SEM from three experiments. Statistical analysis for the comparison between groups was performed by one-way ANOVA. *P < 0.05 compared with control cells; #P < 0.05 compared to LPS-treated cells.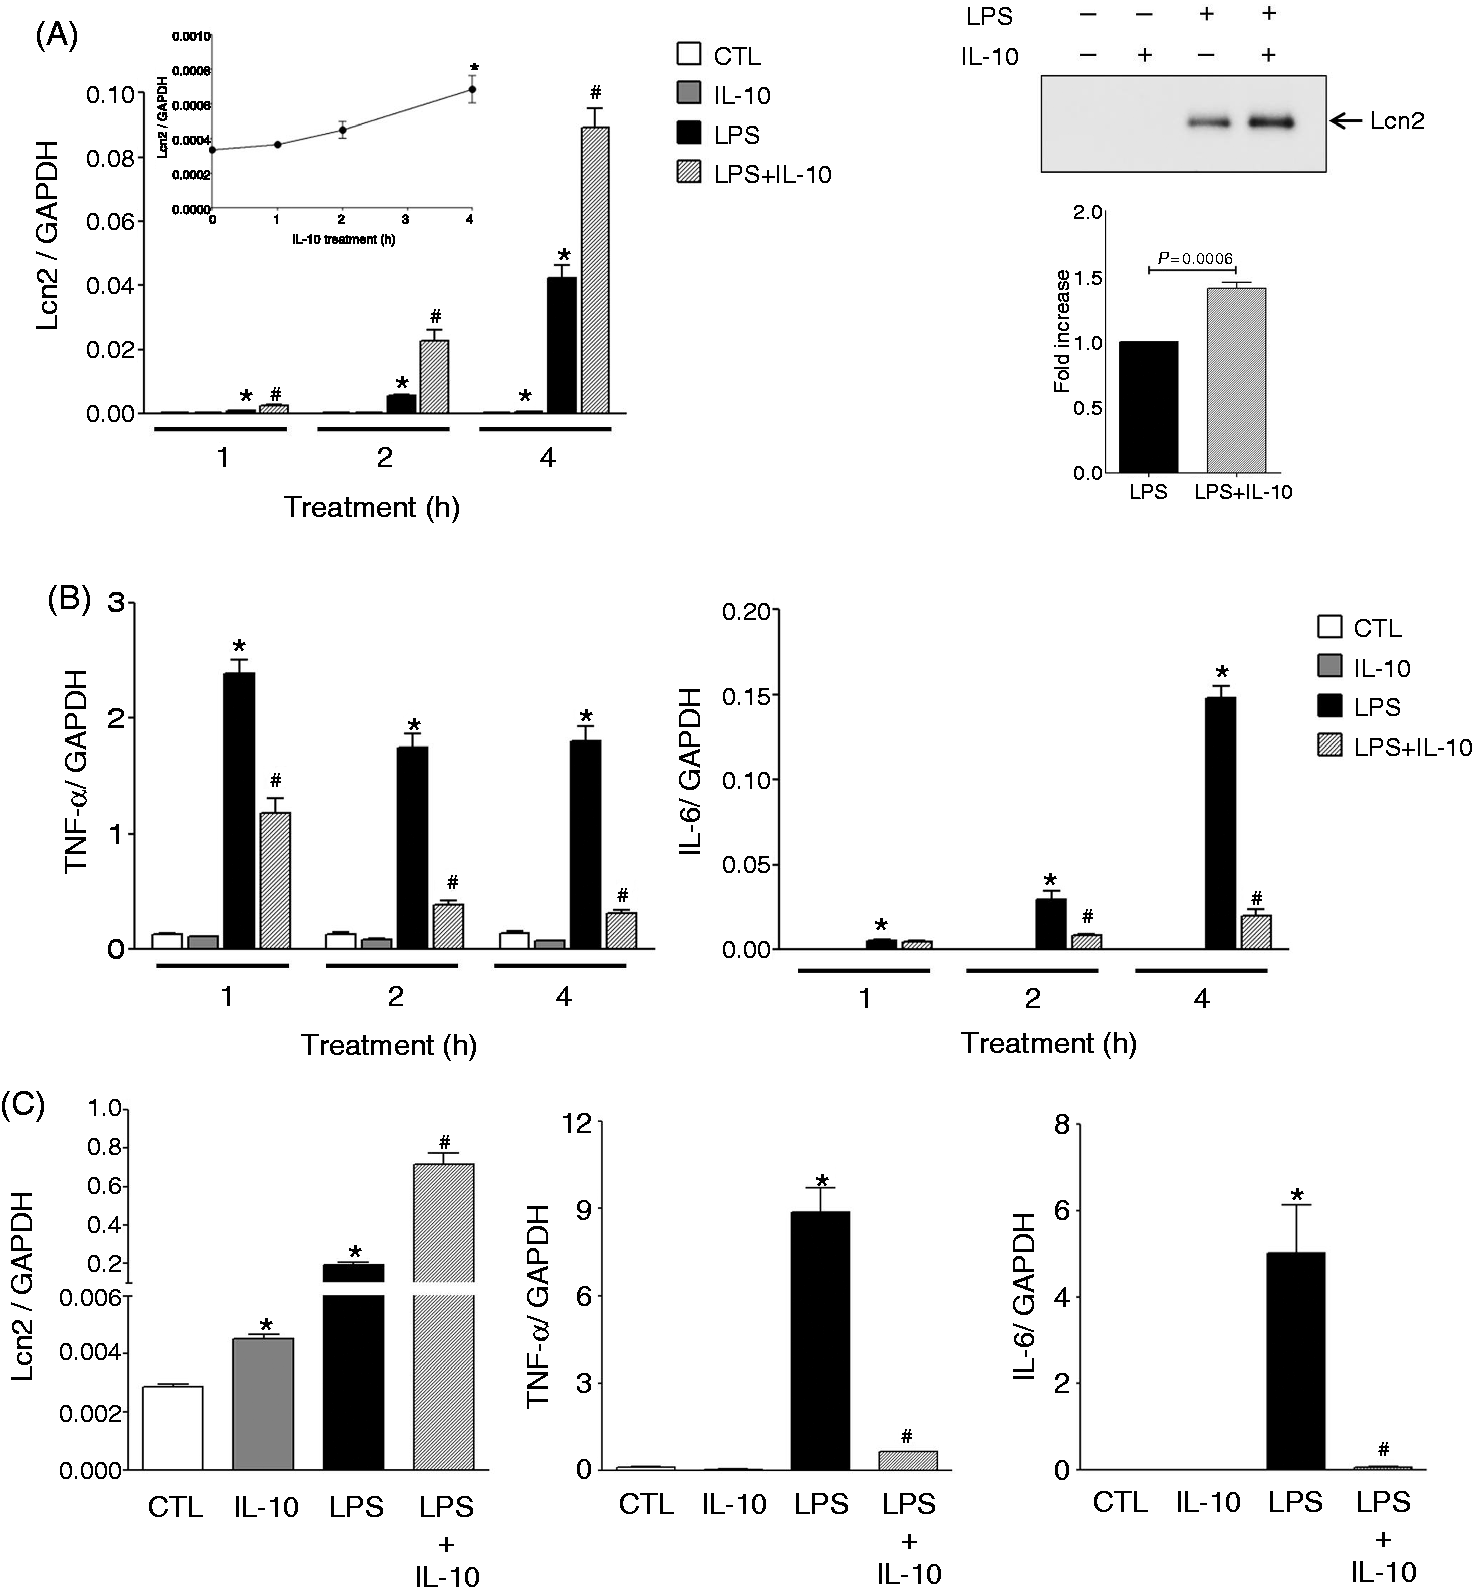
IFN-γ reduces Lcn2 expression triggered by LPS
Previous studies have demonstrated that IFN-γ increases the monocyte/macrophage production of inflammatory cytokines such as TNF-α and IL-6 in response to TLR ligands by inhibiting the expression of IL-10.25,26 If Lcn2 is, indeed, controlled by IL-10, its expression should be reduced in the presence of IFN-γ. To test this hypothesis, J774A.1 macrophages were primed for 30 min with IFN-γ (10 ng/ml) and then treated or not with LPS (10 ng/ml) for an additional 4 h. CTL cells were left untreated (no IFN-γ and no LPS). After the 4-h incubation period, Lcn2 mRNA expression was measured by qPCR. LPS induced Lcn2 mRNA expression, and this effect was reduced by the addition of IFN-γ (Figure 6A). We further confirmed that IFN-γ exerted its effect through inhibition of the production of IL-10 (Figure 6B). Finally, we showed that IFN-γ priming resulted in an increase of the inflammatory cytokine IL-6 (Figure 6C). Taken together, these results demonstrate that IFN-γ reduces LPS-mediated expression of Lcn2 via its inhibitory effect on IL-10 production.
IFN-γ reduces LPS-mediated Lcn-2 expression. J774A.1 cells were treated with 10 ng/ml LPS, 10 ng/ml recombinant mouse IFN-γ, or 10 ng/ml of both LPS and IFN- γ for 4 h. Control cells were treated with PBS alone. Total RNA was isolated, reversed transcribed to cDNA and mRNA levels were measured by qPCR for (A) Lcn2, (B) IL-10 and (C) IL-6 (C). Data are expressed as the mean ± SEM from three experiments. Statistical analysis for the comparison between groups was performed by one-way ANOVA. *P < 0.05 compared with control cells; #P < 0.05 compared with LPS-treated cells.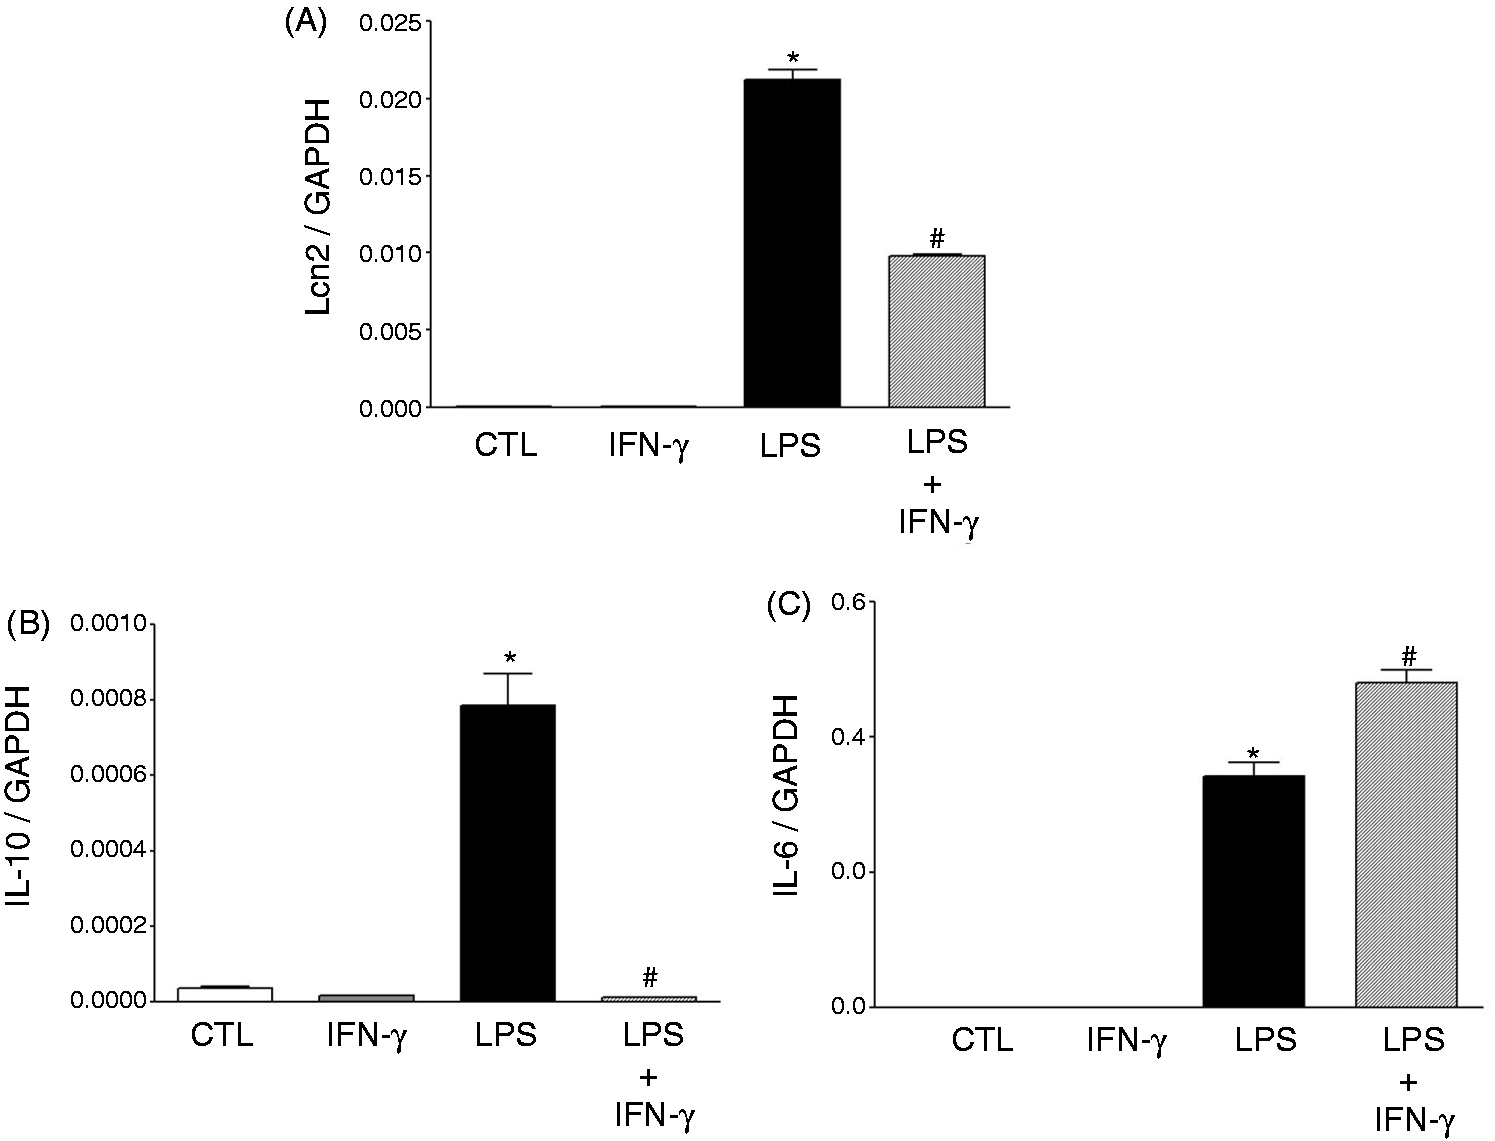
LPS increases expression of Lcn2 in tolerized macrophages
IL-10 is one of the mediators involved in endotoxin tolerance.
27
While the production of many pro-inflammatory cytokines, including TNF-α, is suppressed in tolerized macrophages stimulated with LPS, expression of anti-inflammatory mediators such as IL-10 is maintained or even increased.
28
We therefore postulated that Lcn2 expression may also be preserved or up-regulated in tolerized macrophages. J774A.1 macrophages were first incubated for 20 h with either medium or LPS (10 ng/ml) and then re-stimulated with medium or LPS (10 ng/ml) for 4 h. The mRNA expression of Lcn2, TNF-α and IL-10 was measured by qPCR. LPS re-stimulation increased Lcn2 expression in LPS-tolerized compared with medium pre-treated macrophages (Figure 7A). In contrast, TNF-α expression was abolished by LPS tolerization (Figure 7B). Finally, LPS re-stimulation significantly induced IL-10 expression in tolerized macrophages, albeit to lower levels than cells pre-treated with medium (Figure 7C). Interestingly, Lcn2 expression remained elevated after 20 h of LPS treatment (Figure 7A).
Lcn2 expression is increased after LPS stimulation of tolerized macrophages. J774A.1 cells were pre-incubated for 20 h with medium (M) or 10 ng/ml LPS, washed and stimulated with M only or 10 ng/ml LPS for 4 h. The four conditions of stimulation are designated M/M, M/LPS, LPS/M, and LPS/LPS corresponding to pre-treatment/stimulation. Total RNA was isolated, reversed transcribed to cDNA and mRNA levels were measured by qPCR for (A) Lcn2, (B) TNF-α and (C) IL-10. Data are expressed as the mean ± SEM from three experiments. Statistical analysis for the comparison between groups was performed by one-way ANOVA; * P < 0.05.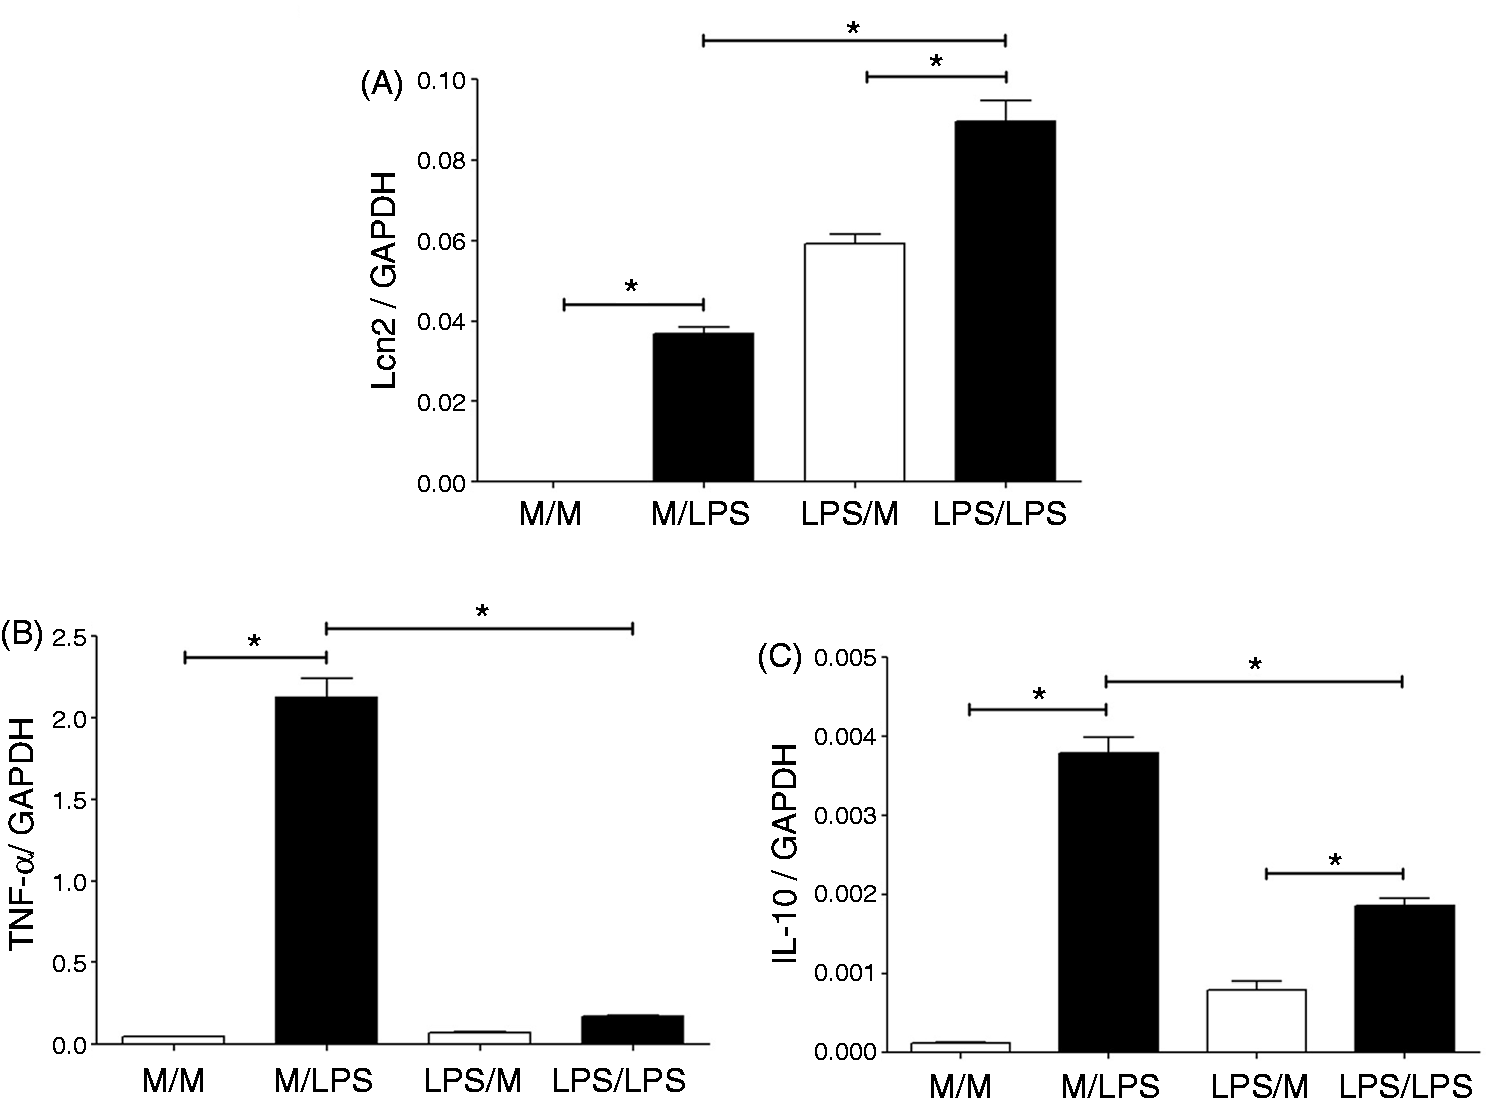
Lcn2 expression during sepsis is modulated by the genetic background of the experimental animal
Several previous studies have shown differences in mortality between B6 and A/J mice after endotoxic and septic shock with A/J animals displaying lower mortality rate.29,30 To assess whether Lcn2 expression was also modulated by the genetic background of the experimental animal during CLP, B6 and A/J mice were subjected to CLP or SO. NO mice were also included as a second control group. Quantitative RT-PCR analysis showed that the expression of Lcn2 mRNA was significantly more induced in the liver of A/J mice compared with B6 animals (Figure 8A). The peak level of Lcn2 mRNA expression was reached at 6 h after CLP in both mouse strains. At this time point, IL-10 was also found to be more elevated in the liver of A/J animals compared with B6 mice (Figure 8A). On the contrary, Lcn2 mRNA expression was more elevated in the lungs of B6 mice than in A/J animals and, as in the liver, reached a maximum expression at 6 h post-CLP (Figure 8B). Levels of IL-10 mRNA at this time point were not statistically different between the two mouse strains (data not shown). However, levels of IFN-γ were significantly higher in A/J than in B6 animals (Figure 8B). Thus, the higher expression of Lcn2 observed in the lungs of B6 mice may be the result of the lower levels of IFN-γ expressed in this tissue.
Lcn2 expression is controlled by the genetic background of the experimental animal. Male B6 and A/J mice (n = 4–5) were subjected to SO or CLP procedure, and tissues were harvested at different time points. The NO group was used as time 0 for the kinetic experiment. Lcn2 gene expression in liver (A, left panel) and lung (B, left panel) of B6 and A/J was determined at each time point by qPCR as indicated int he Materials and methods. Data are expressed as fold increase relative to the values observed with NO group ± SEM. Comparison of Lcn2 gene expression between B6 and A/J after CLP was measured by two-way ANOVA. *P < 0.05 B6 CLP vs. A/J CLP at each time point. IL-10 gene expression in the liver (A, right panel) in B6 and A/J animals measured 6 h after SO or CLP procedures by qPCR. NO represents the non-operated control group. Data are expressed as the mean ± SEM from five animals in each group. Statistical analysis for the comparison between groups was performed by one-way ANOVA; #P < 0.05. IFN-γ gene expression in the lung (B, right panel) in B6 and A/J animals measured 6 h after SO or CLP procedures by qPCR. NO represents the non-operated control group. Data are expressed as the mean ± SEM from five animals in each group. #P < 0.05 as determined by one-way ANOVA. (C) PMφ were isolated from male B6 and A/J mice (n = 5) and were treated with 10 ng/ml LPS for 4 h at 37℃. Control cells were incubated with PBS alone. Levels of Lcn2 (left panel) and IL-10 (right panel) were measured by qPCR. Data are expressed as the mean ± SEM. #P < 0.05 as determined by one-way ANOVA.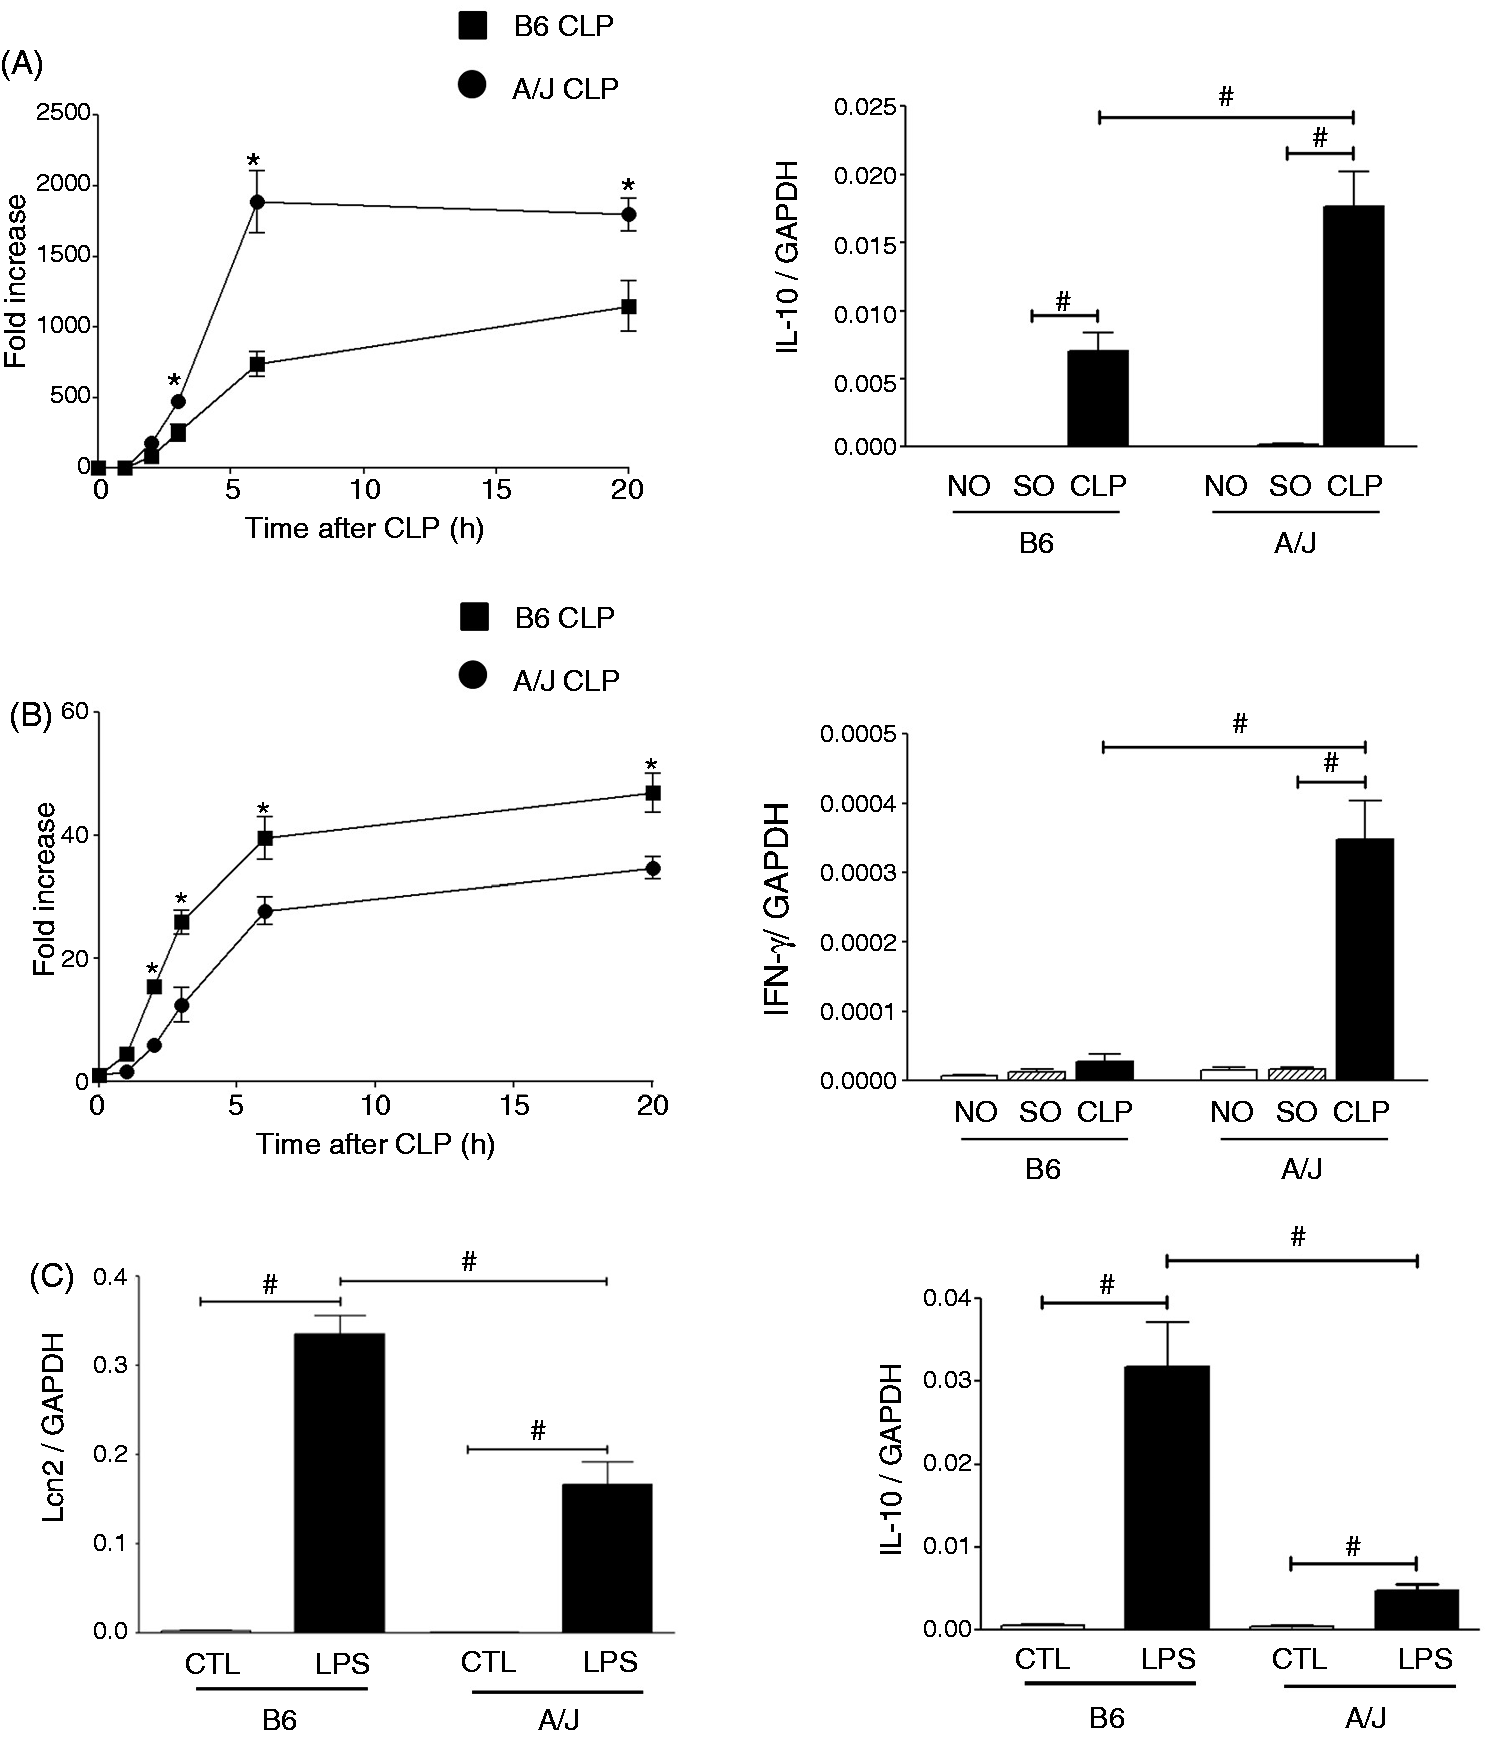
To further investigate whether the differences in Lcn2 expression between B6 and A/J could be reproduced in an ex vivo system, naïve PMφ were isolated from B6 and A/J mice. PMφ were then stimulated for 4 h with LPS (10 ng/ml) and Lcn2 mRNA expression was determined by qPCR and normalized by GAPDH mRNA levels. LPS treatment induced Lcn2 in both B6 and A/J PMφ. However, LPS-stimulated PMφ isolated from B6 mice showed higher Lcn2 mRNA expression than LPS-stimulated PMφ from A/J mice (Figure 8C). As LPS-mediated Lcn2 expression is potentiated by the presence of IL-10 (Figure 6B), levels of IL-10 mRNA were also measured after LPS stimulation in PMφ from B6 and A/J animals. As shown in Figure 8C (right panel), LPS-stimulated PMφ from B6 mice produced significantly more IL-10 mRNA than LPS-stimulated PMφ from A/J animals.
These results indicate that the expression of Lcn2 following septic shock varies between mice of different genetic backgrounds and further suggest that Lcn2 may be an important factor participating in the discrepancy observed in mortality between these two mouse strains after CLP-induced sepsis. Furthermore, in inflammatory environments, differential expression of IL-10/IFN-γ in tissues or at the cellular level may explain the divergence in Lcn2 expression.
Discussion
Severe sepsis, septic shock and multiple organ dysfunction syndrome are major healthcare problems and are leading causes of death in intensive care units worldwide.2,31 Although sepsis has often been viewed as the result of a poorly controlled inflammatory response, the mechanisms associated with the clinical complications leading to the high mortality rate are not fully understood. As a consequence, many attempts to develop new treatments have failed and current therapies remain mainly supportive. In addition, there are still no current predictors that can accurately anticipate the development of sepsis and septic shock.
Our current understanding of the cellular and molecular basis of sepsis has been derived mainly from studies using experimental animal models. In this regard, CLP is the most widely used animal model to study sepsis as it shares many important clinical features observed in septic patients. 32 The goal of this study was to find new potential markers that can predict the development of the disease. We found that Lcn2, an antimicrobial polypeptide, was robustly up-regulated during the development of sepsis, even in conditions of innate immune dysfunction.
Although several reports previously showed that Lcn2 expression was increased following bacterial and endotoxemic challenges,12–14,16,33 little is known about the regulation of Lcn2 in the context of polymicrobial sepsis. We found that Lcn2 expression was strongly up-regulated in the liver and lung of B6 mice within the first 3 h after the CLP procedure. In accordance, we have previously demonstrated that CLP triggers a rapid and robust expression of several inflammatory mediators such as TNF-α, IL-1β, IL-6 and IL-10 in both liver and lung of B6 animals. 21 However, as opposed to these inflammatory cytokines whose expression declines rapidly to levels resembling sham-operated animals at 20 h post-CLP, Lcn2 expression remained elevated throughout the survival time of the experimental animal both at the mRNA and protein level. These data indicate that the regulation of Lcn2 expression in liver and lung post-CLP drastically diverges from most of the inflammatory mediators. Similar persistent induction of Lcn2 has also been observed in tissues of bacteria-infected animals. 14 Furthermore, Lcn2 expression was detected by Western blot analysis after 4 h of pulmonary infection with Klebsiella pneumoniae and persisted for up to 16 h post infection. 30 Lcn2 expression was also highly detected in the lung of mice 48 h after intra-tracheal instillation of E. coli. 16 In contrast, data from LPS-challenged animals provided mixed results. While some reports showed that Lcn2 expression displayed a biphasic pattern characterized by a rapid increase followed by a strong decrease of Lcn2 levels,12,13 other studies showed sustained expression of Lcn2 following LPS challenge. 34 Interestingly, the biphasic pattern of Lcn2 expression has also been reported in blood of E. coli-infected mice. 14 Given that Lcn2 exerts its primary function (i.e. bacteriostasis) by binding to catecholate-type siderophores, such as the E. coli enterobactin, 14 endotoxemic models of sepsis (absence of bacteria), although suitable to study LPS-mediated effects on Lcn2 expression, may not recapitulate the biology of Lcn2 in septic patients.
Lcn2 has been originally identified in the specific secondary granules of neutrophils. 6 These specific neutrophil granules also contain a mixture of several other cytotoxic molecules and are the most abundant source of antimicrobial peptides such as the cathelicidin hCAP18/LL-37 [or the murine counterpart cathelicidin-related antimicrobial peptide (CRAMP)]. 35 We have previously observed that the initial recruitment of neutrophils within the first 6 h of CLP was followed by a rapid decline in the number of these granulocytes in both liver and lung. 21 We showed in this report that Lcn2 expression rapidly increased and reached a plateau expression a few hours after CLP (6 and 3 h for liver and lung, respectively). These results indicate that the kinetic of Lcn2 expression is not likely explained by the presence of neutrophils in these two tissues, but rather by other types of stimulated cells. Indeed, Flo et al. previously showed that E. coli infection induced a robust expression of Lcn2 in hepatocytes, 14 and Wu et al. reported that both bronchial epithelial cells and type II pneumocytes produced significant amounts of Lcn2 following pulmonary infection. 16 Conversely, we found that the kinetic expression of CRAMP in liver and lung followed an expression pattern similar to that observed for most of the inflammatory cytokines and neutrophil infiltration, 21 indicating that neutrophils may represent the main source of CRAMP in hepatic and pulmonary tissues following CLP-induced sepsis. Although CRAMP has also been detected in several other cell types such as monocytes and respiratory epithelial cells, 36 we cannot discard the possibility that other cells may contribute to some extent to CRAMP expression in these two tissues. It is clear that these two antimicrobial effectors, Lcn2 and CRAMP, although originally described in the same neutrophil granules, are regulated differently during the course of polymicrobial sepsis.
We have previously demonstrated that during the course of CLP-induced sepsis the initial hyper-inflammatory response was immediately followed by a period of innate immune dysfunction characterized by low expression of inflammatory cytokines and the incapacity of the immune system to respond to additional pathogenic stimuli. 21 For example, expression of TNF-α and IFN-β were severely reduced following LPS injection of CLP-treated animals compared with SO-treated or NO mice. 21 Using the same two-hit model (CLP + LPS), we showed here that Lcn2 expression was highly increased compared with SO + LPS-treated animals and therefore demonstrating that the capacity of the liver and lung to produce Lcn2 during the period of immune dysfunction was not affected. We further extended these observations by showing that Lcn2 expression was increased rather than abolished in tolerized macrophages. In our previous study, we showed that the anti-inflammatory cytokine IL-10 was not hampered by LPS injection in CLP-treated animals. 21 We therefore postulated that a reduction of LPS-induced TNF-α and IFN-β expression after CLP may be the result of an excess production of IL-10 during the immunosuppressive stage. Interestingly, recent studies have reported that IL-10 was capable of inducing the production of Lcn2 in macrophages.23,24 In accordance with these previous findings, we demonstrated that Lcn2 expression was slightly but significantly elicited by IL-10 treatment of both Pmφ and J774A.1 macrophages. However, little was known about the effect of IL-10 on Lcn2 production in the context of pathogen-mediated inflammatory response. We showed that expression of Lcn2 in macrophages was highly induced by LPS treatment. These data are consistent with past studies showing that LPS is capable of inducing Lcn2 expression in these cells.11,12,37 Most importantly, we demonstrated that IL-10 synergistically enhances LPS-mediated Lcn2 production. These results indicate that the increased expression of Lcn2 in LPS-stimulated macrophages results from a combination of two effects: a direct effect of LPS on Lcn2 gene transcription and an indirect effect derived from the autocrine activity of IL-10. To investigate the autocrine effect of IL-10 on Lcn2 production, we pre-treated macrophages with IFN-γ rather than using IL-10 receptor-blocking Abs, which we consider to be a more physiological strategy to inhibit IL-10 autocrine regulation. Indeed, previous studies have shown that IFN-γ improves LPS-mediated production of several pro-inflammatory cytokines such as IL-6 and TNF-α by inhibiting the expression of IL-10.25,26 We found that IFN-γ treatment strongly inhibited LPS-induced IL-10 expression and, as a consequence, reduced Lcn2 production, thus confirming that IL-10 displays an autocrine feedback loop that promotes Lcn2 expression. Furthermore, we showed that the elevated expression of Lcn2 after LPS re-stimulation of tolerized macrophages correlated with an increase in IL-10 expression.
Our laboratory has previously shown that the severity of the outcome after endotoxic and septic shock was dictated by the genetic background of the experimental animal. Indeed, we have observed differences in mortality between B6 and A/J mice with A/J animals displaying lower mortality rates following these inflammatory insults.26,27 In the present study, we found that levels of Lcn2 mRNA were significantly higher in the liver of A/J animals compared with B6 mice during the course of CLP-induced sepsis. Interestingly, this elevated level of Lcn2 in the hepatic tissue of A/J mice correlated with higher levels of IL-10. Torres and De Maio reported that IL-10 plasma levels were also significantly higher in A/J animals compared with B6 mice. 38 In contrast, levels of Lcn2 in the lungs of A/J animals were lower than in B6 mice. No difference in IL-10 expression was detected between the two strains, but IFN-γ levels were more elevated in the lung of A/J mice. Our data demonstrated that Lcn2 expression is robustly induced in the liver of septic animals, which is in agreement with the fact that Lcn2 is considered a positive acute phase protein. 9 It is then conceivable that serum levels of Lcn2 will be governed by the amount of Lcn2 produced in the hepatic tissue during the inflammatory response as previously demonstrated in the acute phase response triggered by turpentine injection. 9 Several studies have reported that Lcn2-deficient mice exhibit a higher mortality rate than their wild type counterpart.14–16 The decreased expression of Lcn2 in the liver of B6 animals compared with A/J mice may therefore explain the difference in mortality between these two strains.
In conclusion, we demonstrated that Lcn2 is robustly induced in the liver and lung of animals in the context of polymicrobial sepsis. As opposed to many inflammatory mediators, its expression persisted at late stages of the disease that correlates with a stage of innate immune dysfunction that we have previously described. 21 These results support that idea that the anti-inflammatory cytokine IL-10 is a master regulator of Lcn2 expression during sepsis. Finally, Lcn2 expression was associated with susceptibility to sepsis in inbred mouse strains suggesting a potential contribution to determine the outcome form sepsis. As Lcn2 is placed in circulation, its level in blood may result in a predictor of the development of sepsis. The validity of Lcn2 as a biomarker for sepsis needs to be documented in the future.
Footnotes
Funding
This work was supported, in whole or in part, by National Institutes of Health grant number GM090681.
Conflicts of interest
The authors do not have any potential conflicts of interest to declare.
Acknowledgements
We thank the members of the De Maio Laboratory for their constructive comments, and Molly Wofford for her impeccable editorial assistance in preparing this manuscript.
References
Supplementary Material
Please find the following supplemental material available below.
For Open Access articles published under a Creative Commons License, all supplemental material carries the same license as the article it is associated with.
For non-Open Access articles published, all supplemental material carries a non-exclusive license, and permission requests for re-use of supplemental material or any part of supplemental material shall be sent directly to the copyright owner as specified in the copyright notice associated with the article.