
Abstract
Appendicitis represents a common and severe gastrointestinal illness in younger individuals worldwide. The disease is characterized by an excessive inflammatory response and it is believed that bacterial overgrowth due to blockage of the appendix lumen might be involved. Despite the high incidence, only limited data on the pathophysiological changes exist; in particular, the innate immune responses involved are largely unknown. Real-time PCR analysis of tissue samples from inflamed and normal appendices demonstrated differentially regulated expression patterns of epithelial-derived antimicrobial peptides (AMP). The α-defensins human neutrophil peptides 1–3, HD5 and HD6, as well as the two β-defensins, human β-defensins (hBD)-2 and hBD-3, were up-regulated, whereas hBD-1 was down-regulated in acute appendicitis. Expression of upstream regulators of AMP expression, NOD-2 and TLRs 1, 2, 4, 5, 7, 8 and 10 was significantly increased as detected by real-time PCR. Finally, we confirmed the involvement of the pro-inflammatory cytokines IL-1β and IL-8, and detected characteristic changes in microbial community composition in appendicitis tissue specimens by 16S rDNA based detection techniques. In this study, we demonstrate a differential regulation of the innate immune system along with an altered bacterial diversity in acute appendicitis.
Introduction
Acute appendicitis is a frequent cause of acute abdominal pain in emergency departments in the Western world. 1 The treatment of choice is the removal of the inflamed appendix, but recently antibiotic treatment of uncomplicated cases has also been advocated. 2 The disease is characterized by inflammation of the appendix and it is believed that bacterial infection due to congestion of the appendiceal lumen might play a role; 3 however, the pathophysiological causes are still mainly unknown. This blockage may result from thick mucus within the appendix or from stool that enters the appendix from the cecum. Subsequently, lymphatic tissue in the appendix may swell and block the appendix. It is a matter of debate whether appendicitis ensues from a lymphoid tissue reaction to enteric pathogens. Histological sections in appendicitis show neutrophilic, monocytic and lymphocytic infiltrates, which are not present in the normal appendix. The time course of the development of these infiltrates is unknown, although a rapid progression of cellular infiltration is recognized. 3 Thus, IL-1β and IL-8 cytokine production is elevated in acute appendicitis. 4 Recently, it has been suggested that bacterial LPS may play a central role in the development of appendicitis, resulting in a generalized systemic anti-inflammatory response. 5 Several microbial species have been identified to cause appendicitis, and recent studies have described a mixed bacterial infiltrate in the inflamed appendices, but the exact microbial composition remains largely unknown. Interestingly, the relative frequency of Clostridium spp., Enterococcus sp., Enterobacter cloacae, Lactobacillus sp., Eubacterium spp., Bacteroides vulgatus and Bacteroides distasonis is lower compared with that in the normal colon. Very recently, a critical role for Fusobacterium nucleatum/necrophorum was postulated. 6
The immunologic reactions to preclude bacterial translocation and systemic complications like sepsis are mainly unclear. Under normal conditions, epithelial defense mechanisms prevent intestinal infection and/or translocation against the multitude of different bacteria and fungi colonizing the gastrointestinal tract. Besides the physical barrier, these epithelial lines of defense against microbial insults comprise co-ordinated actions of both the innate and the acquired immune responses. Thus, defects of these mechanisms might result in an overgrowth of the normal colonic flora with higher numbers of aerobic bacteria in addition to the appearance of atypical bacteria and fungi. 7 Finally, local invasion of microbes and induction of inflammatory responses causes self-destructive injury. Once the physical barrier is penetrated, recognition of the invading microbiota is the first step in the initiation of a fast immune response, which involves the activation of PRR by microbial pathogens and their products.8,9 In turn, the activation of these receptors leads to the transcription and secretion of pro-inflammatory cytokines and antimicrobial peptides (AMP). AMPs (arbitrarily defined as <100 Aa in size) represent important components of the innate host defense; α-and β-defensins, which are major components of the epithelial mammalian innate immune system, belong to the AMPs. 10 Defensins are small cationic peptides with high activity against a variety of microbes. Some of the defensins are regulated in response to challenges with bacterial Ag. Gastrointestinal α-defensins (HD5 and HD6) are almost exclusively expressed in and secreted from Paneth cells of the small intestine, while β-defensins [human β-defensins (hBD)1, hBD2, hBD3] are secreted by virtually all gastrointestinal epithelial cells to a varying extent.11,12 Defensins are envisaged to play significant roles in intestinal microbial homeostasis and in the primary defense against enteral and systemic infections.11–15 In this study, we investigated the mRNA expression of AMPs, their potential upstream regulators and changes in bacterial diversity in acute appendicitis.
Materials and methods
Materials
Study group
Appendix specimens were obtained after removal by surgery in case of suspected appendicitis. A pathologist diagnosed phlegmonous/suppurative appendicitis. Healthy appendix control tissues were derived from surgery for right-sided non-occlusion colon cancer, while samples from ileum or colon were obtained by lower intestinal endoscopy for colon cancer prophylaxis. Tissue samples were once washed in ice-cold NaCl, immediately snap frozen in liquid nitrogen and stored at –80℃. Histology confirmed phlegmonous appendicitis or healthy appendices, ileum and colon for the controls. Twenty-nine patients with appendicitis were included. Mean age was 38 yrs (range: 18–63 yrs) and the male to female ratio was 1:1. The control group of 18 patients was age- and sex-matched.
The ethics committees of the University of Kiel, Germany, and Kuopio University Hospital, Finland, approved the study (AZ158/01). All patients gave their written informed consent prior to the investigation
RNA isolation and cDNA synthesis
After mechanical separation of the epithelium with a scalpel, RNA was isolated using the RNeasy Kit from Qiagen (Hilden, Germany) and reverse-transcribed into single-stranded cDNA, as described previously. 16 The quality of RNA and cDNA was checked by analysis of expression of three housekeeping genes (ACTB, GAPDH and 18S). Five of the initial 29 samples were excluded from further analysis owing to very low expression of these genes compared with the other 24 samples.
Primer
The oligonucleotide sequence and product size for each primer pair used have been described previously. 17
Quantification of gene expression by real-time PCR
Real-time PCR analyses were performed as previously described. 16 For each mRNA, standard curves were constructed by cloning the purified PCR products containing the target sequence into pCR-Blunt II-TOPO vector (Life Technologies GmbH; Darmstadt, Germany). Concentration of the reference plasmid was measured spectrophotometrically and transformed into number of copies/µl by calculation. The absolute mRNA transcript number in each sample was calculated by use of calibration curves.
In addition, PCRs for housekeeping genes (β-actin, GAPDH and 18S RNA) were performed, and showed no significant changes in the four investigated groups (Figure S1).
TaqMan low-density arrays
The mRNA expression levels of 49 selected target transcripts and three housekeeping genes (ACTB, GAPDH and 18S) were analyzed in duplicate and quantified by TaqMan low-density array real-time PCR (Life Technologies GmbH; Darmstadt, Germany) as described. 18 A complete list of the genes analyzed and respective real-time PCR assays used in this study are provided in Supplementary Table S1.
DNA extraction, amplification and 16S rRNA gene pyrosequencing
DNA extraction, amplification and 16S rRNA pyrosequencing was performed as previously described.19,20 In brief, extraction was performed with the Fast DNA spin kit after homogenisation of tissue samples in 200 μl tissue lysis buffer (200 mM HEPES, pH 7.5, 1 M KCl, 100 mM MgCl2, 1 mM EDTA, 0.2% NaN3). Twenty-five μl of proteinase K was added before incubating at 55℃ for 2 h (PeqLab, Erlangen, Germany) and mechanical force was applied to maximize bacterial cell wall lysis. The 16S rRNA gene variable region V1eV2 was amplified using the forward and revers primers 5′ CTATGCGCCTTGCCAGCCCGCTCAGTCAGAGTTTGATCCTGGCTCAG3′ and 5′ GTATCGCCTCCCTCGCGCCATCAGXXXXXXXXXXCATGCTGCCTCCCGTAGGAGT 3′, respectively. A10-base multiplex identifier (XXXXXXXXXX) was added to the reverse primer to tag each PCR product. Replicate PCRs were performed for each sample in addition to negative controls. After agarose gel electrophoresis of the amplified products, specific bands were excised and purified using the QIA quick gel extraction Kit (Qiagen). Measurement of the concentration of the purified amplicons was performed using the Quant-iT PicoGreen dsDNA Assay Kit (Life Technologies GmbH; Darmstadt, Germany), and equal amounts of PCR products were mixed in a single tube and subsequently sequenced on a 454GS-FLX using the Titanium Sequencing Kit (Roche; Grenzach-Wyhlen, Germany).
16s rDNA analysis
An in-house computational pipeline was utilized for processing the sequencing data. First, the multiplex identifiers and primer sequences were removed from raw sequence data. Following this, the sequences were refined on the criterion of mean quality score of ≥ 25, maximum homopolymer count of six and zero ambiguities. The trimmed sequences thus obtained were aligned to the SILVA reference alignment. 21 At this stage, the program mothur v1.23 22 was used to remove sequences resulting from pyrosequencing errors. This was done using the ‘pre.cluster’ command. The chimeras were eliminated using MOTHUR's UCHIME 23 application. Furthermore, cyanobacterial sequences were deposed for their obvious origin from chloroplasts in the diet. This was followed by creation of random subset of 1046 sequences/sample to eliminate sampling bias and uneven depth of coverage. Finally, the aligned and sub-sampled dataset was used to compute a distance matrix for assigning sequences into operational taxonomic units (OTU) by a 97% similarity cut-off. An OTU represents a terminal node in phylogenetic analysis that defines a distinct ‘species’ in sequence-based microbiological analysis. Typically, an OTU is assigned using rDNA sequences, where a percent similarity threshold is set for classifying microbes within the same, or different, OTUs. 24
Following this, a sample/OTU table stating the number of sequences belonging to a certain OTU for each sample was created. This sample/OTU table was further utilized for comparative analysis of microbial diversity in the samples.
Further α-and β-diversity analyses were performed using R v2.14.1. Differences between community composition of sample individuals belonging to the ‘inflamed appendices’ and ‘non-inflamed appendices’ were judged by distance-based redundancy analysis (db-RDA) with the R package vegan v2.0-3 (http://cran.r-project.org/web/packages/vegan/index.html). Initially, the sample/OTU table was log-transformed followed by Hellinger transformation. Based on the rank correlations between dissimilarity indices of distance measures, the Bray–Curtis (BC) distance method was chosen as the best inter-sample distances method. Principle coordinate analysis was done followed by db-RDA using capscale function. The ordination plot with significant RDA axes was made and tested with ANOVA using the R package vrmlgen v1.4.7.
Statistics
Data are presented as mean ± SEM and analyzed by Student's t-test. A P-value < 0.05 was considered to be statistically significant. Analysis of the TaqMan low-density array real-time PCR including cluster analysis was performed as described recently. 18
Results
Differential mRNA abundance of antimicrobial peptides and innate immune genes
As the immune responses involved in appendicitis are largely unknown, we first performed a systematic assessment of 49 transcripts with potential pathophysiological relevance by a quantitative real-time PCR array with RNA from eight specimens of patients with acute appendicitis and eight matched controls (Figure 1).
Cluster analysis of candidate transcripts in acute appendicitis. The cluster is based on the expression values for nine transcripts in specimen from appendices from patients with acute appendicitis or from individuals without appendicitis. Each row represents a transcript, whereas each column represents a patient. The heat map is colored according to the relative mRNA expression (green for low mRNA expression, black for moderate mRNA expression, and red for high mRNA expression). Fold changes listed are based on the ratios of the medians, P-values were calculated using the Mann–Whitney U-test and subsequently corrected for multiple testing using the Benjamini–Hochberg correction.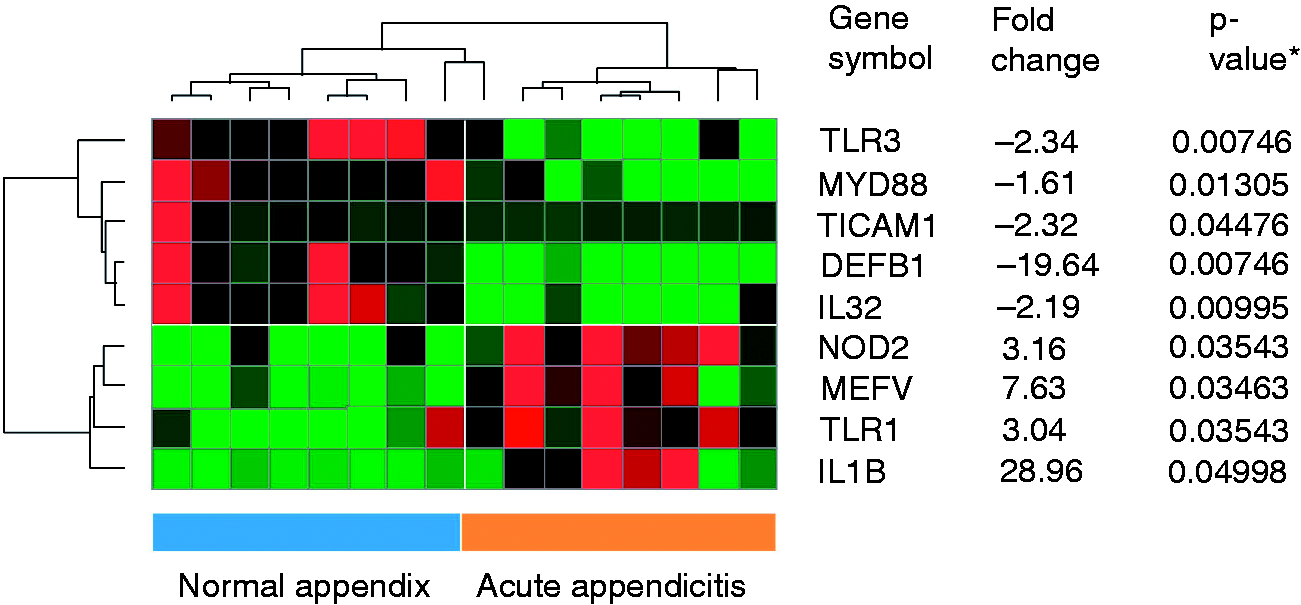
We found that crucial PRR like NOD2 and TLR1 were significantly up-regulated. The abundance of NOD2 (P ≤ 0.035) and TLR1 (P ≤ 0.035) was 3.16- and 3.04-fold increased, respectively, compared to non-inflamed appendices. Furthermore, the abundance of the pro-inflammatory cytokine IL-1β was 28.96-fold induced (P ≤ 0.05). Interestingly, the abundance of other critical components of the immune system like TLR3 (–2.34-fold; P ≤ 0.008) and MYD88 (–1.16-fold; P ≤ 0.013) were reduced. Surprisingly, the abundance of hBD-1/DEFB1, which is generally not altered in diseases, was down-regulated in the inflamed appendices (–19.64-fold; P ≤ 0.008).
In order to verify and further analyze the observed alterations in this initial screening array, we performed real-time PCR analysis of all TLRs, crucial cytokines and AMP abundance in a larger number of appendicitis patients, and compared the results with the abundance of these genes in non-inflamed appendices, colon and ileum samples.
TLR mRNA abundance in acute appendicitis
All TLRs were expressed in the analyzed tissues (Figure 2). TLR3, TLR6 and TLR9 abundance was almost unaltered in inflamed appendices compared with control appendices. The changes in TLR3 expression, observed in the initial screening of eight matched specimen pairs in the array analysis, were not confirmed in the real-time PCR analysis using a higher sample number. In contrast, TLR2 abundance increased from 302 ± 84 copies/20 ng mRNA in normal appendices to 1447 ± 367 copies/20 ng mRNA, and TLR10 abundance was twofold increased from 2483 ± 875 to 7297 ± 2342 copies/20 ng mRNA. Owing to the high SEM, these alterations were not significant. However, significant increases (P-values < 0.05) in the abundance of TLR1, TLR4 and TLR8 in appendicitis were observed (Figure 2). TLR1 abundance increased from 2484 ± 391 to 5300 ± 545 copies/20 ng mRNA (P ≤ 0.005), TLR4 abundance from 2486 ± 381 to 4694 ± 963 copies/20 ng mRNA (P ≤ 0.01) and TLR8 abundance from 472 ± 133 to 1354 ± 318 copies/20 ng mRNA (P ≤ 0.02).
mRNA abundance of TLRs in acute appendicitis. mRNA from specimens of acute appendicitis (n = 24), normal appendices (n = 14), normal ileum (n = 23) and normal colon (n = 23) were extracted and abundance of TLRs 1–10 analyzed by real-time PCR. Results expressed as mean transcript number ± SEM per 20 ng mRNA. *P < 0.05.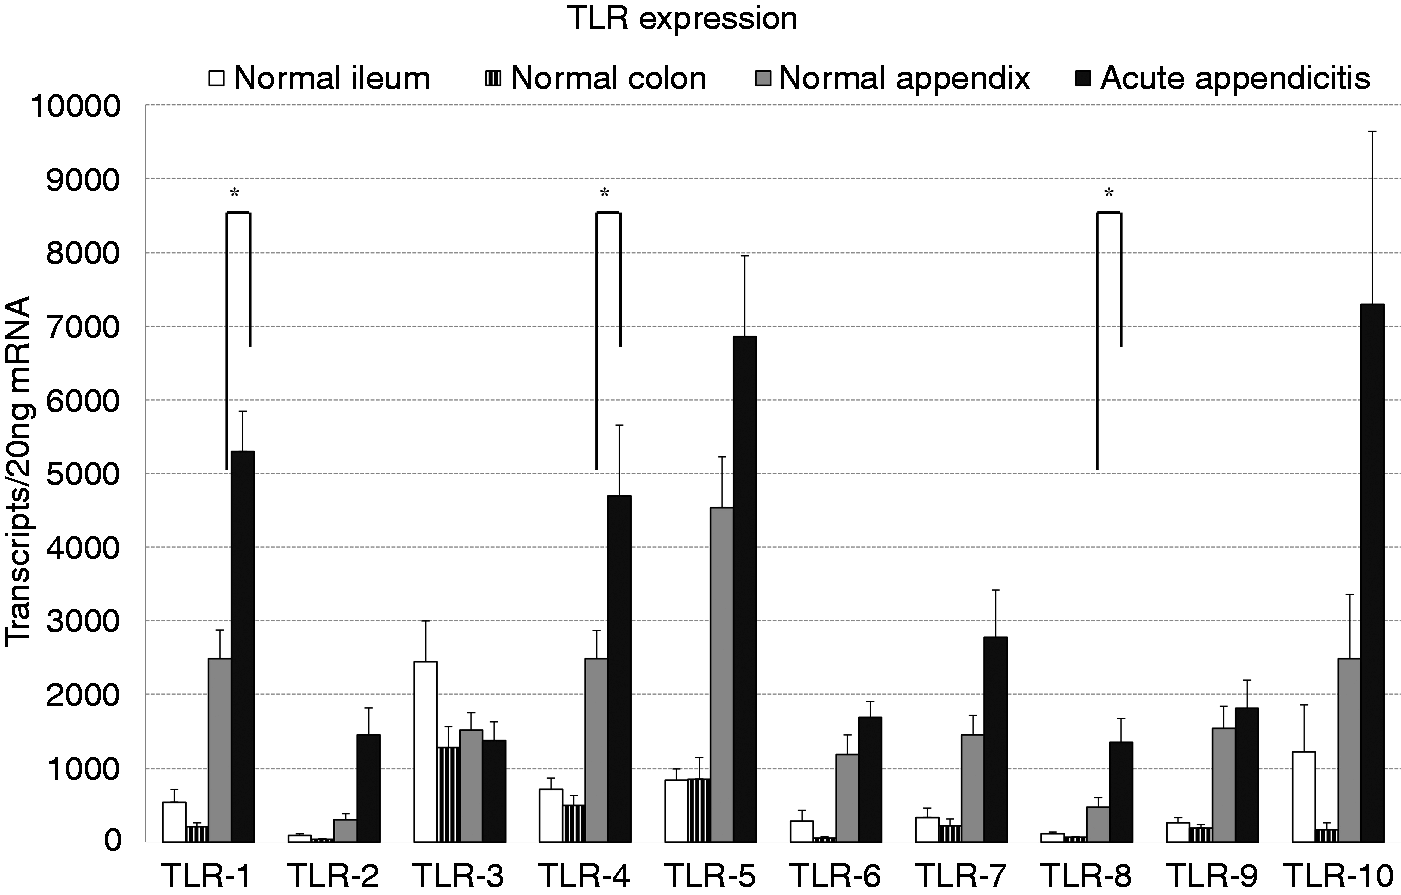
mRNA abundance of pro-inflammatory cytokines in acute appendicitis
The analysis of five of the most abundant pro-inflammatory cytokines in other gastrointestinal diseases—TNF-α, IL-1β, IL-6, IL-8 and IL-10—confirmed the observed strong up-regulation of IL-1β abundance in appendicitis. We were able to show that IL-1β was already higher expressed in the normal appendices (8746 ± 4584 copies/20 ng mRNA) compared with colon and ileum (Figure 3). In appendicitis IL-1β abundance was eightfold induced (73,312 ± 27,787 copies/20 ng mRNA; P ≤ 0.04). IL-6, IL-8 and IL-10 were only detectable at very low abundance levels in the normal colon and ileum. In the healthy appendices, the abundance of these cytokines was 10-fold higher than in the other analyzed parts of the intestine (Figure 3). In appendicitis, IL-6 abundance increased from 378 ± 124 to 4259 ± 1431 copies/20 ng mRNA (P ≤ 0.02), IL-8 abundance increased from 1582 ± 431 to 28,595 ± 12,090 copies/20 ng mRNA (P ≤ 0.04) and IL-10 abundance increased from 71 ± 63 to 510 ± 99 copies/20 ng mRNA (P ≤ 0.001).
mRNA abundance of cytokines in acute appendicitis. mRNA from specimens of acute appendicitis (n = 24), normal appendices (n = 14), normal ileum (n = 23) and normal colon (n = 23) were extracted and abundances of TNF-α,IL-1β, IL-6, IL-8 and IL-10 analyzed by real time PCR. Results expressed as mean transcript number ± SEM per 20 ng mRNA. *P < 0.05.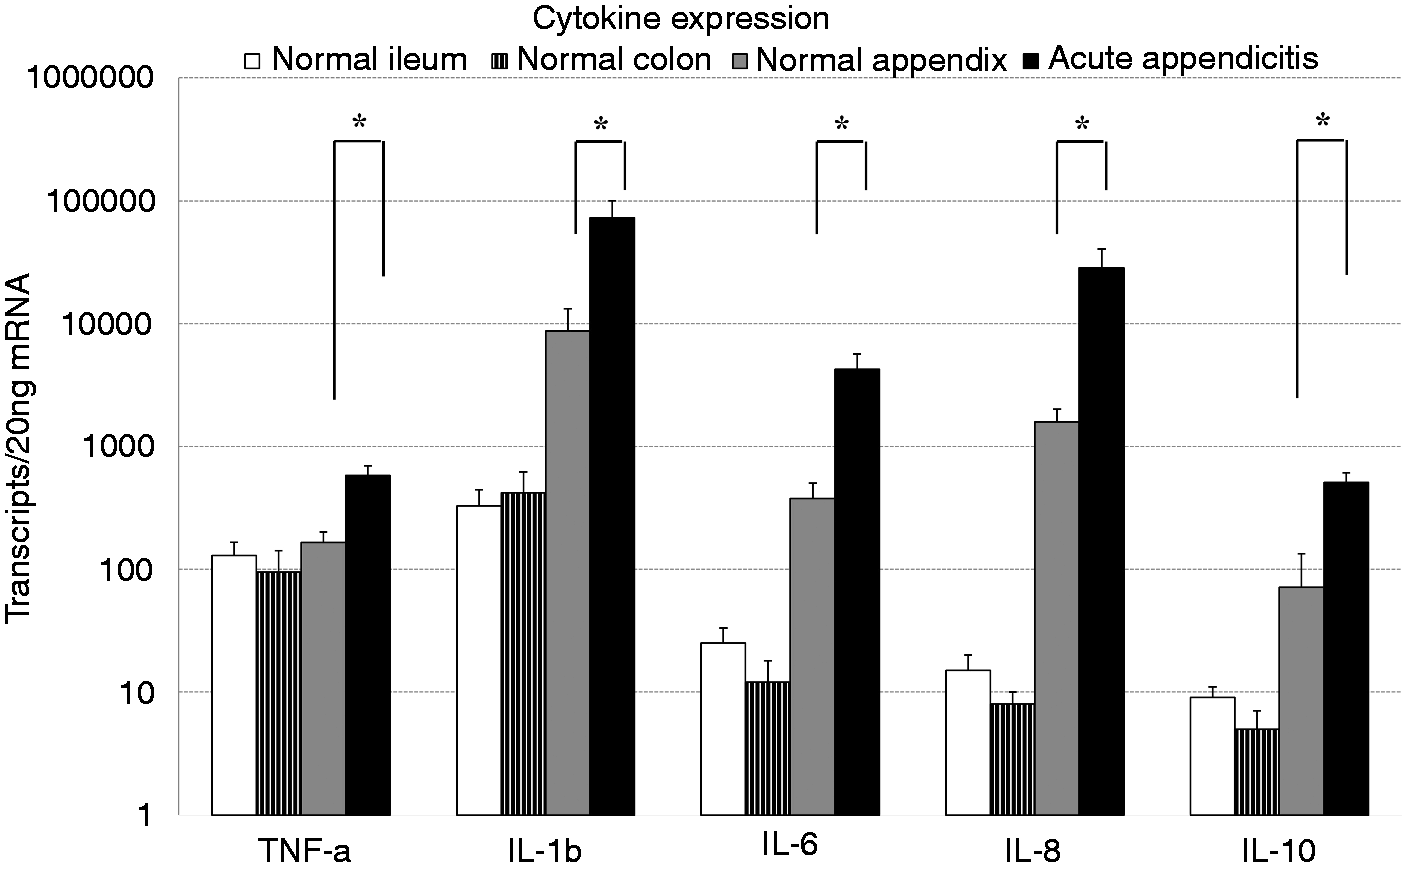
TNF-α was expressed at comparable levels in the normal appendices, the colon and the ileum. This basal abundance of 165 ± 36 copies/20 ng mRNA was strongly induced to 582 ± 114 copies/20 ng mRNA (P ≤ 0.004) in the course of appendicitis.
α-Defensin mRNA abundance in acute appendicitis
The α-defensins human neutrophil peptides (HNP)1–3 were detected at only low transcript levels in the normal colon and ileum (Figure 4). In the healthy appendices, this low abundance was already 30-fold higher with to 273 ± 63 copies/20 ng mRNA compared with the normal colon and ileal mucosa. In appendicitis this abundance was strongly induced to 1297 ± 441 copies/20 ng mRNA (P ≤ 0.03). For the other two α-defensins, HD5 and HD6, a high transcript number was detectable in all specimens, with the highest abundance in the ileum and the lowest abundance in the colon, yet the observed increase in appendicitis was not significant.
mRNA abundance of α-defensins in acute appendicitis. mRNA from specimens of acute appendicitis (n = 24), normal appendices (n = 14), normal ileum (n = 23) and normal colon (n = 23) were extracted and abundance of the α-defensins analyzed by real-time PCR. Results expressed as mean transcript number ± SEM per 20 ng mRNA. *P < 0.05.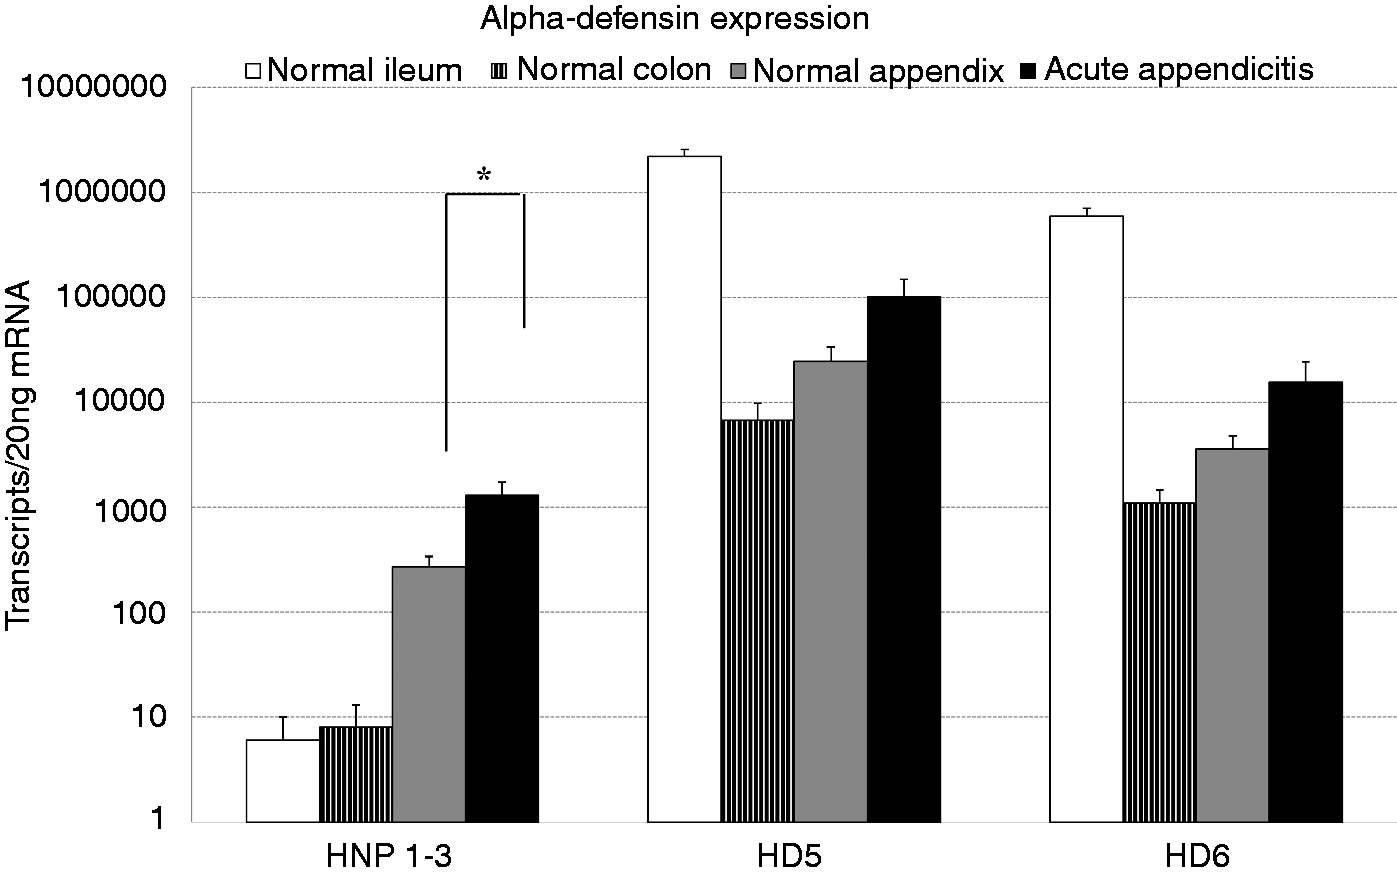
β-Defensin mRNA abundance in acute appendicitis
hBD-1 abundance in non-inflamed colon, ileum and appendices was comparably high (Figure 5). Interestingly, as already observed in the quantitative real-time PCR array (Figure 1), this hBD1 abundance of 5371 ± 1539 copies/20 ng mRNA was significantly lower in appendicitis (1215 ± 347 copies/20 ng mRNA; P ≤ 0.025). In contrast, the abundance of the other two most abundant β-defensins, hBD-2 and hBD-3, was higher in the normal appendices than in the normal ileum and colon mucosa (Figure 5), with 450 ± 146 copies/20 ng mRNA of hBD-2 and 56 ± 9 copies/20 ng mRNA of hBD-3. In specimens from appendicitis patients, hBD-2 abundance was increased seven-fold (3278 ± 1020 copies/20 ng mRNA; P ≤ 0.01) and hBD-3 abundance was 10-fold higher than in the normal appendices with 541 ± 171 copies/20 ng (P ≤ 0.01).
mRNA abundance of β-defensin in acute appendicitis. mRNA from specimens of acute appendicitis (n = 24), normal appendices (n = 14), normal ileum (n = 23) and normal colon (n = 23) were extracted and the abundance of β-defensins analyzed by real-time PCR. Results expressed as mean transcript number ± SEM per 20 ng mRNA. *P < 0.05.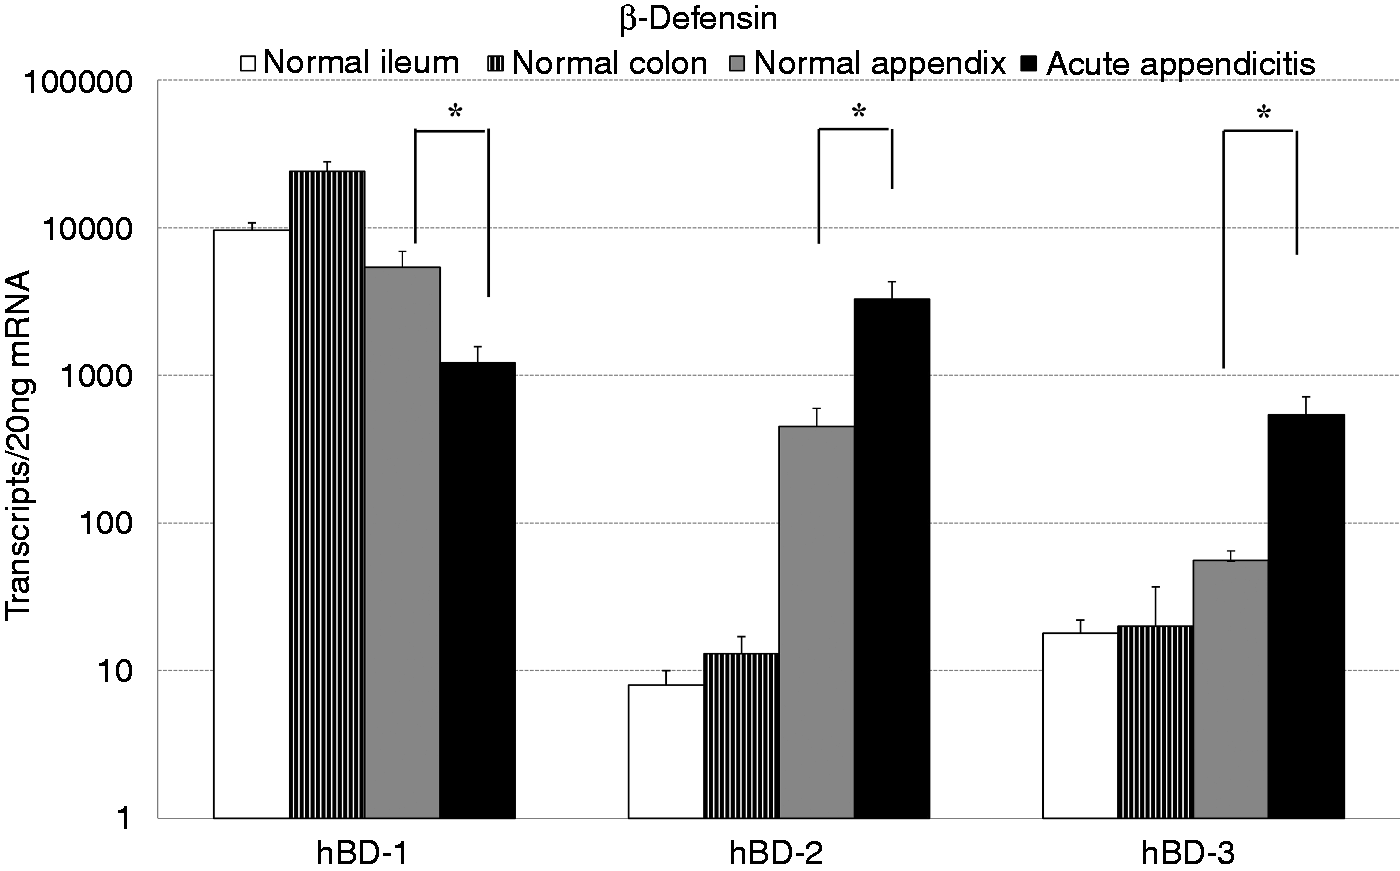
Bacterial taxonomic classification and diversity estimation
The abundance analysis showed a differential regulation of PRR like NOD2 or TLRs, and as effectors against bacterial infections of several AMPs. As the composition of the microbiota of the intestine is thought to be involved in the pathogenesis of gastrointestinal and extraintestinal diseases, 25 we investigated microbiota alterations in the course of appendicitis.
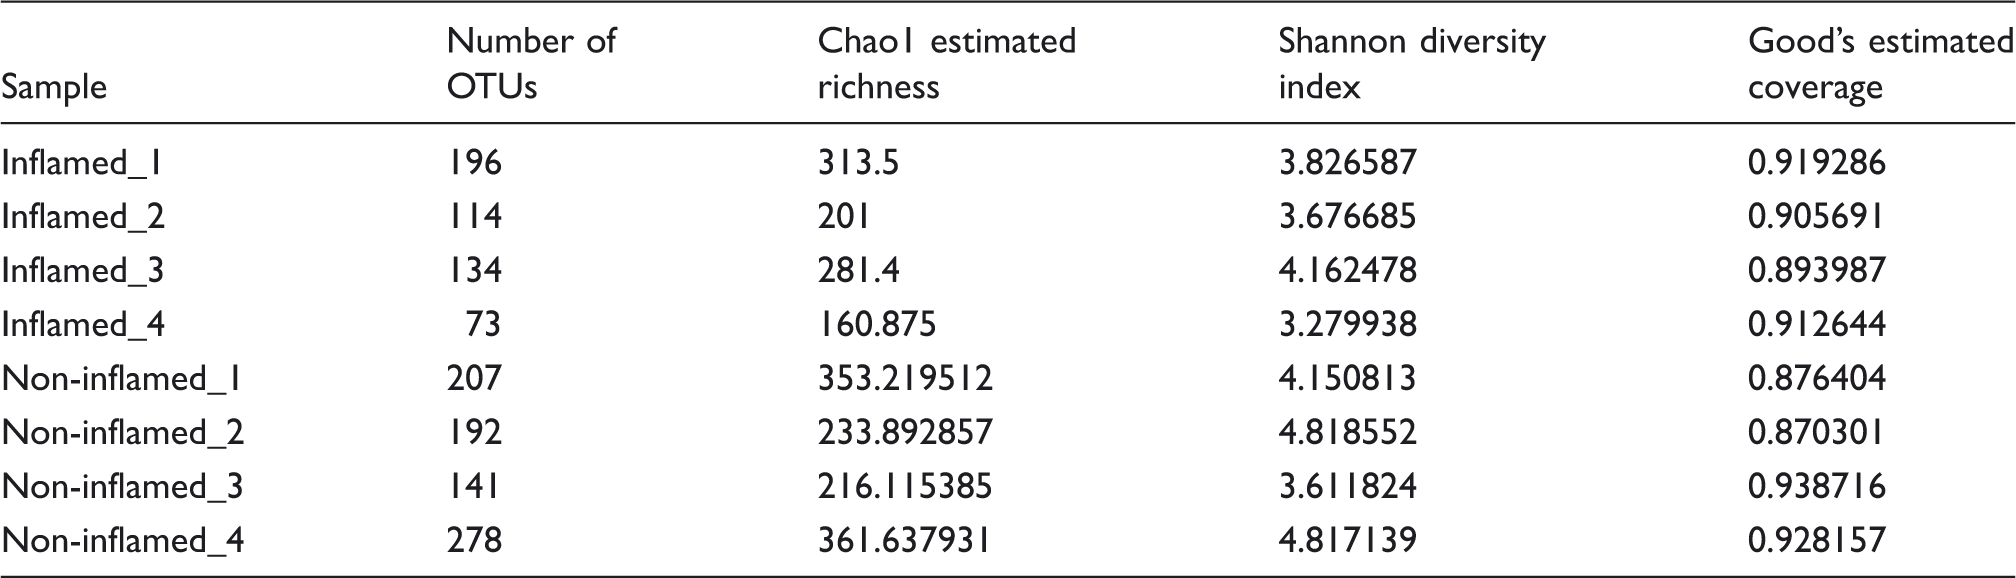
A total of 20,556 and 26,664 raw sequence reads resulted from the four inflamed and four non-inflamed appendix samples, respectively. These sequences were further processed to obtain 6836 unique sequences that were finally clustered at 3% genetic distance threshold with the Silva reference database to produce 789 OTUs.
Depiction of sample wise diversity estimation at 97% similarity level along with OTUs, and coverage.
Phylotype analysis
The comparative phylum level distribution of the appendix samples is depicted in Figure 6, both as high abundance taxa (mean relative abundance > 1%) and low abundance taxa (mean relative abundance < 1%). The plot depicts the phylum level variation of microbial composition between non-inflamed and inflamed appendix samples.
Comparative phylum level distribution in acute appendicitis. High abundance taxa include phyla with mean relative abundance > 1% and low abundance taxa include phyla with mean relative abundance <1%.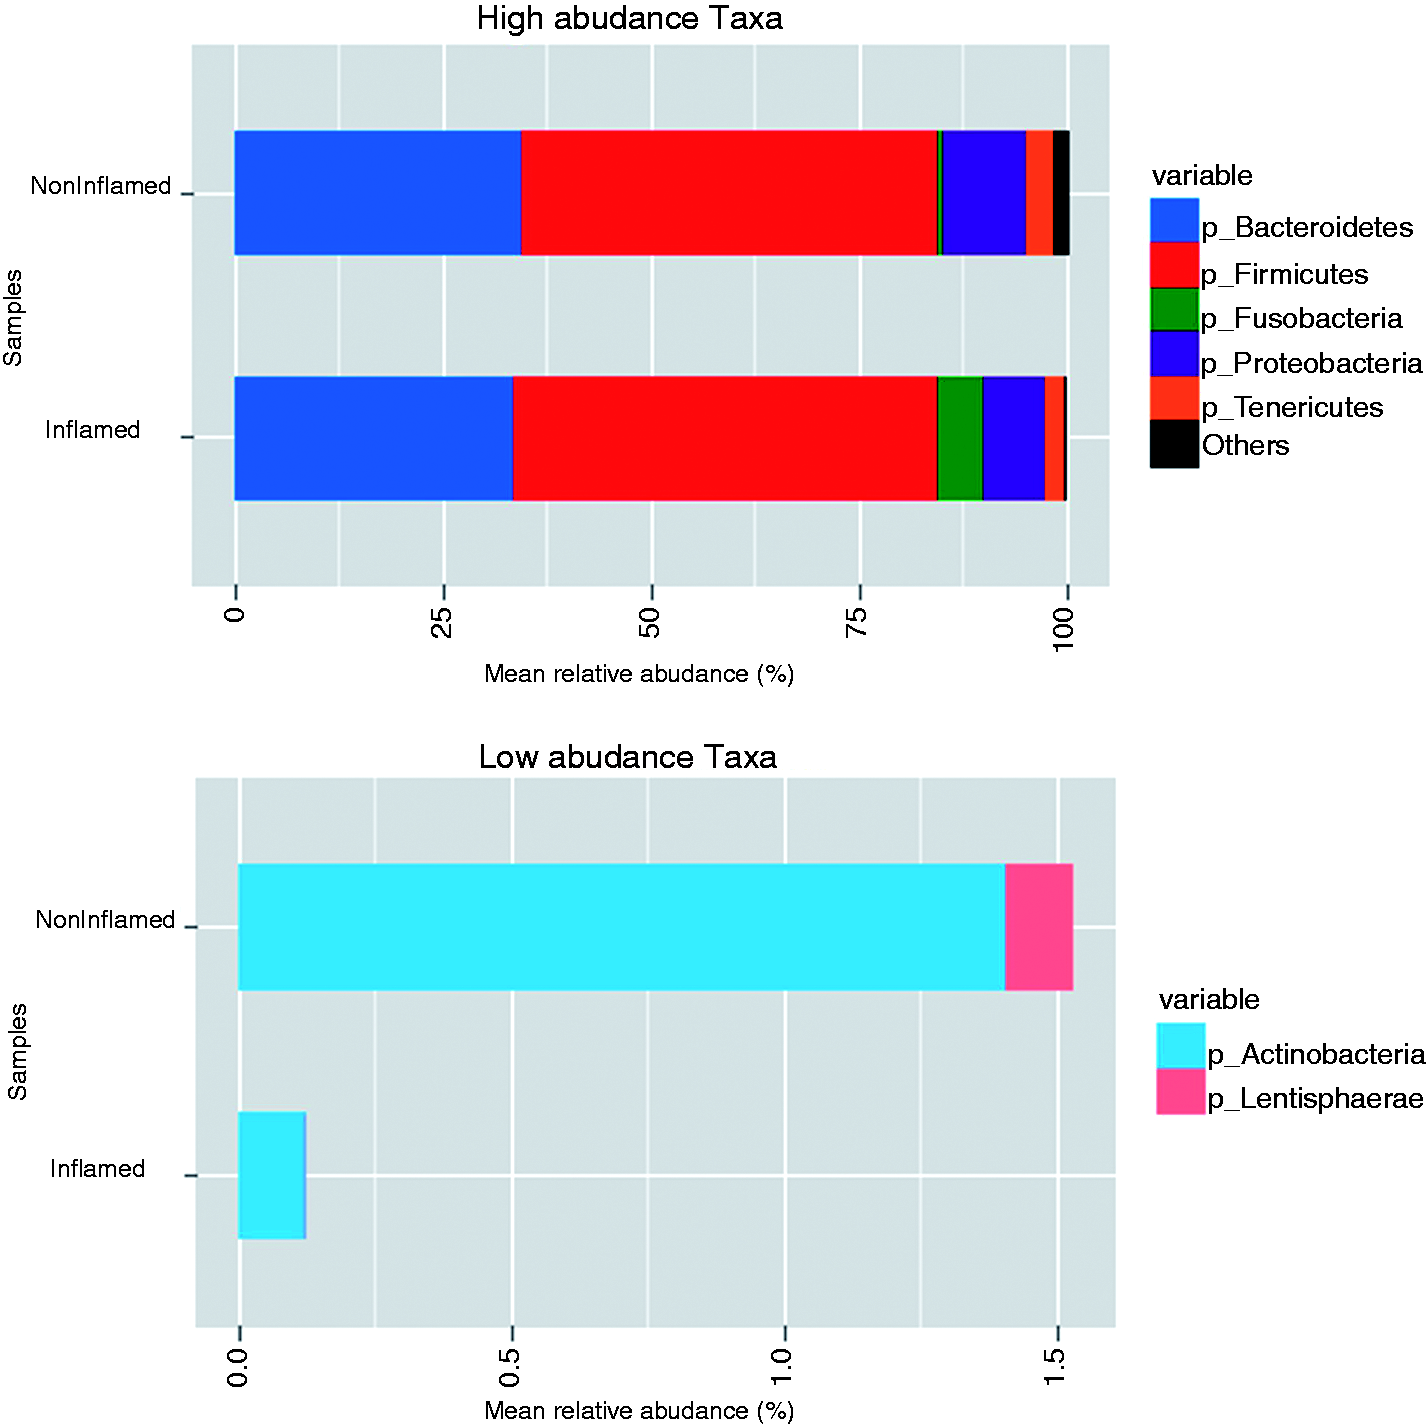
There were five major phyla namely Bacteroidetes, Firmicutes, Fusobacteria, Proteobacteria and Tenericutes, dominating the microbial composition of appendices in all eight samples. However, the low abundance phyla were mainly composed of Actinobacteria and Lentisphaerae. In general, Firmicutes formed the most abundant phylum with an average of over 50% assigned sequences followed by Bacteroidetes with an average distribution of 34% in all eight samples. Among the other three major phyla, the levels of phylum Fusobacteria varied significantly and was found increased in the inflamed appendix samples.
Moreover, the low abundance phyla showed drastic reduction of Actinobacteria and total depletion of Lentisphaerae in the inflamed samples. Similarly, the comparative class level distribution of the appendix samples (Figure 7) showed seven major classes viz. Bacilli, Bacteroidia, β-proteobacteria, Clostridia, Erysipelotrichi, Fusobacteria and γ-proteobacteria. At class level, Clostridia and Bacteroidia formed the major phylotypes, with an average of 48% and 34% assigned sequences, respectively. The inflamed samples showed a reduction in γ-proteobacteria and a significant increase in Fusobacteria. However, the remaining classes did not show any significant variation between non-inflamed and inflamed appendix samples.
Comparative class level distribution in acute appendicitis. High abundance taxa include classes with mean relative abundance > 1% and low abundance taxa include classes with mean relative abundance < 1%.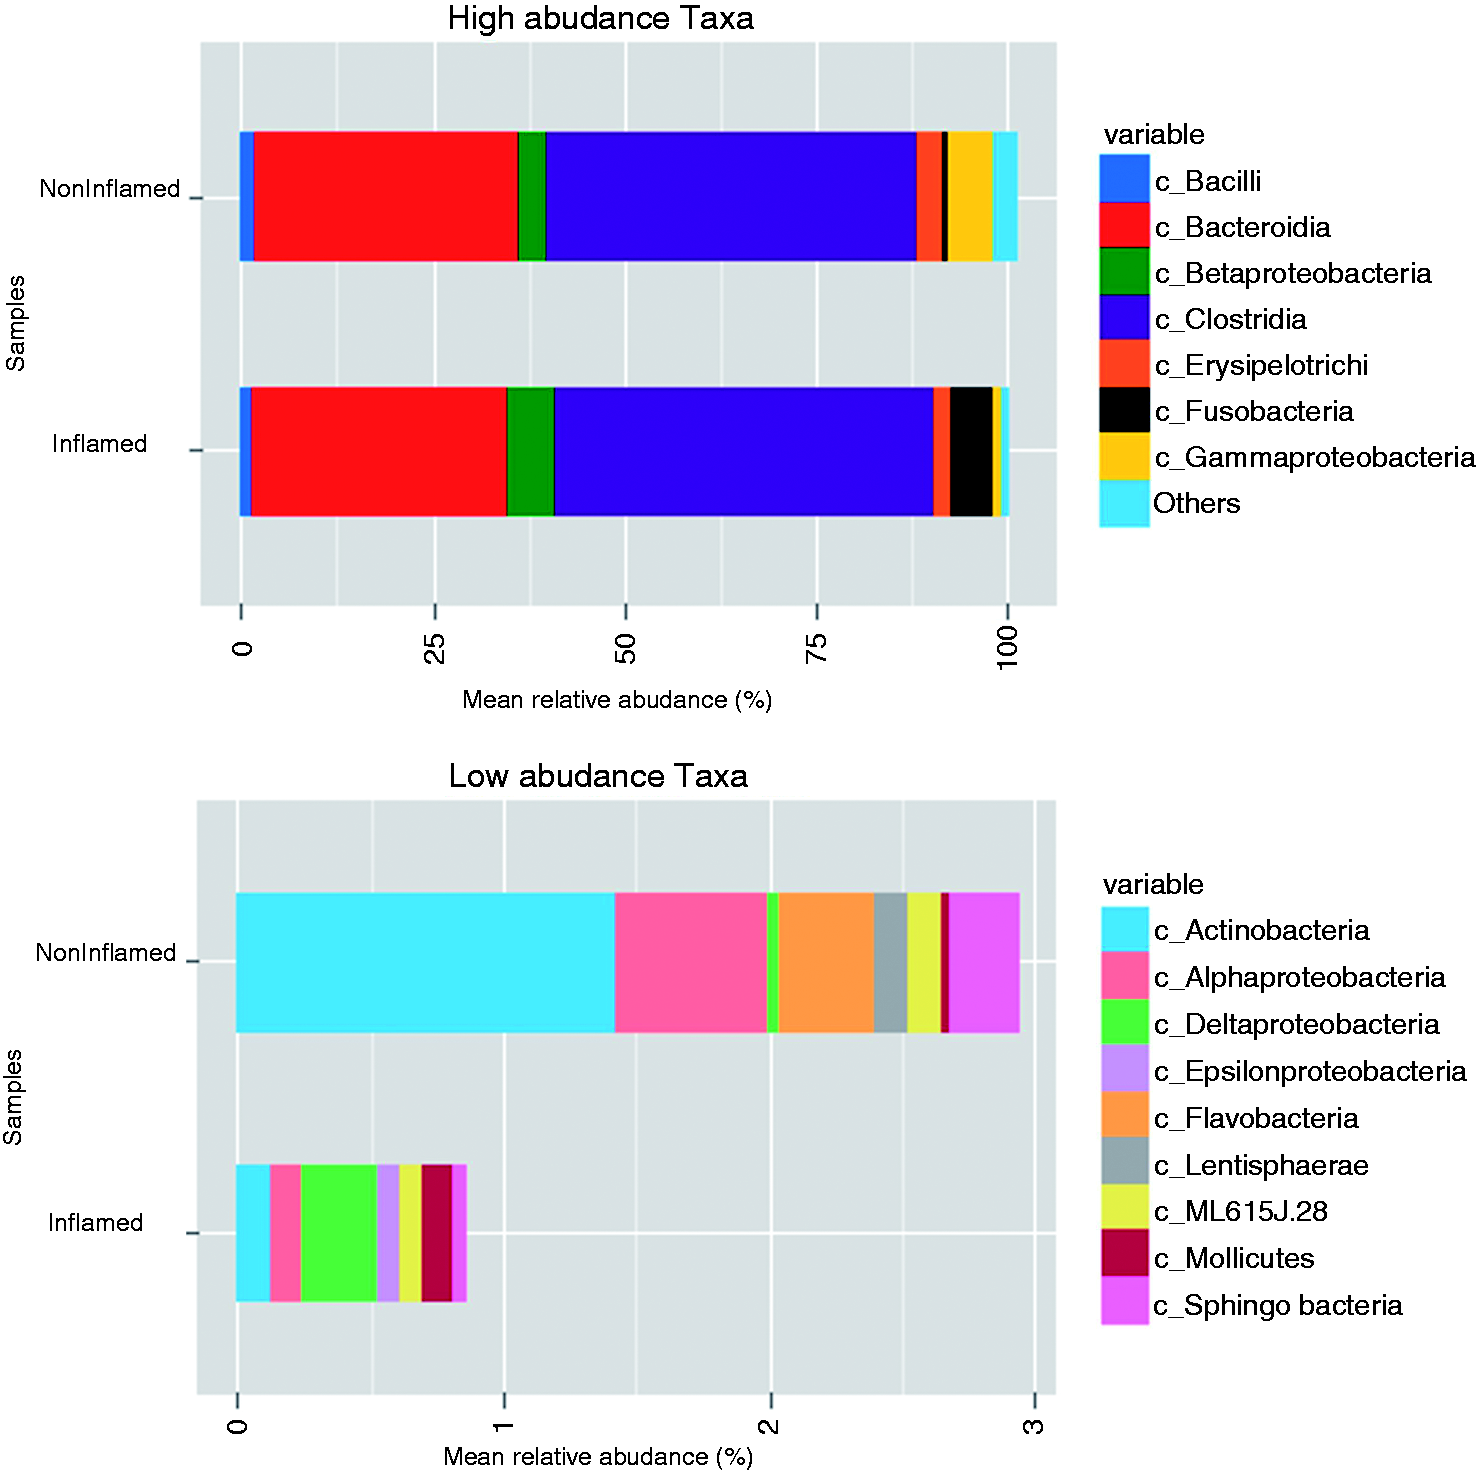
Interestingly, the majority of variation at class level was shown by the low abundance taxa. The Actinobacteria, Alphaproteobacteria, Flavobacteria, Sphingobacteria and Lentisphaerae showed a sharp decline in the inflamed samples, while Deltaproteobacteria, ɛ-proteobacteria and Mollicutes were significant increased in the inflamed appendix samples.
Variation in community composition
The overlap of OTU clusters between the inflamed and non-inflamed samples was done to identify variation in community composition. The Venn diagrams (Figure 8A) represent a significant overlap between the species in both the groups. There are 275 and 278 unique OTUs in the inflamed and non-inflamed samples, respectively. The number of OTUs shared between both groups was 137, that is, approximately 21% of the total OTUs in all samples.
Variations of community compositionin acute appendicitis. (A) Venn diagrams representing 97% OTU cluster overlap between the total inflamed and non-inflamed samples. The depicted numbers correspond to unique OTU clusters within a sub-category of comparison. (B) The community comparison of inflamed and non-inflamed samples using clustering of data from BC similarity matrices. The branching structure in inflamed samples and non-inflamed samples suggests higher and lower clustering distance between the communities, respectively. (C) Distance-based redundancy analysis of BC distances derived from log2-transformed abundance data amongst inflamed and non-inflamed appendix samples.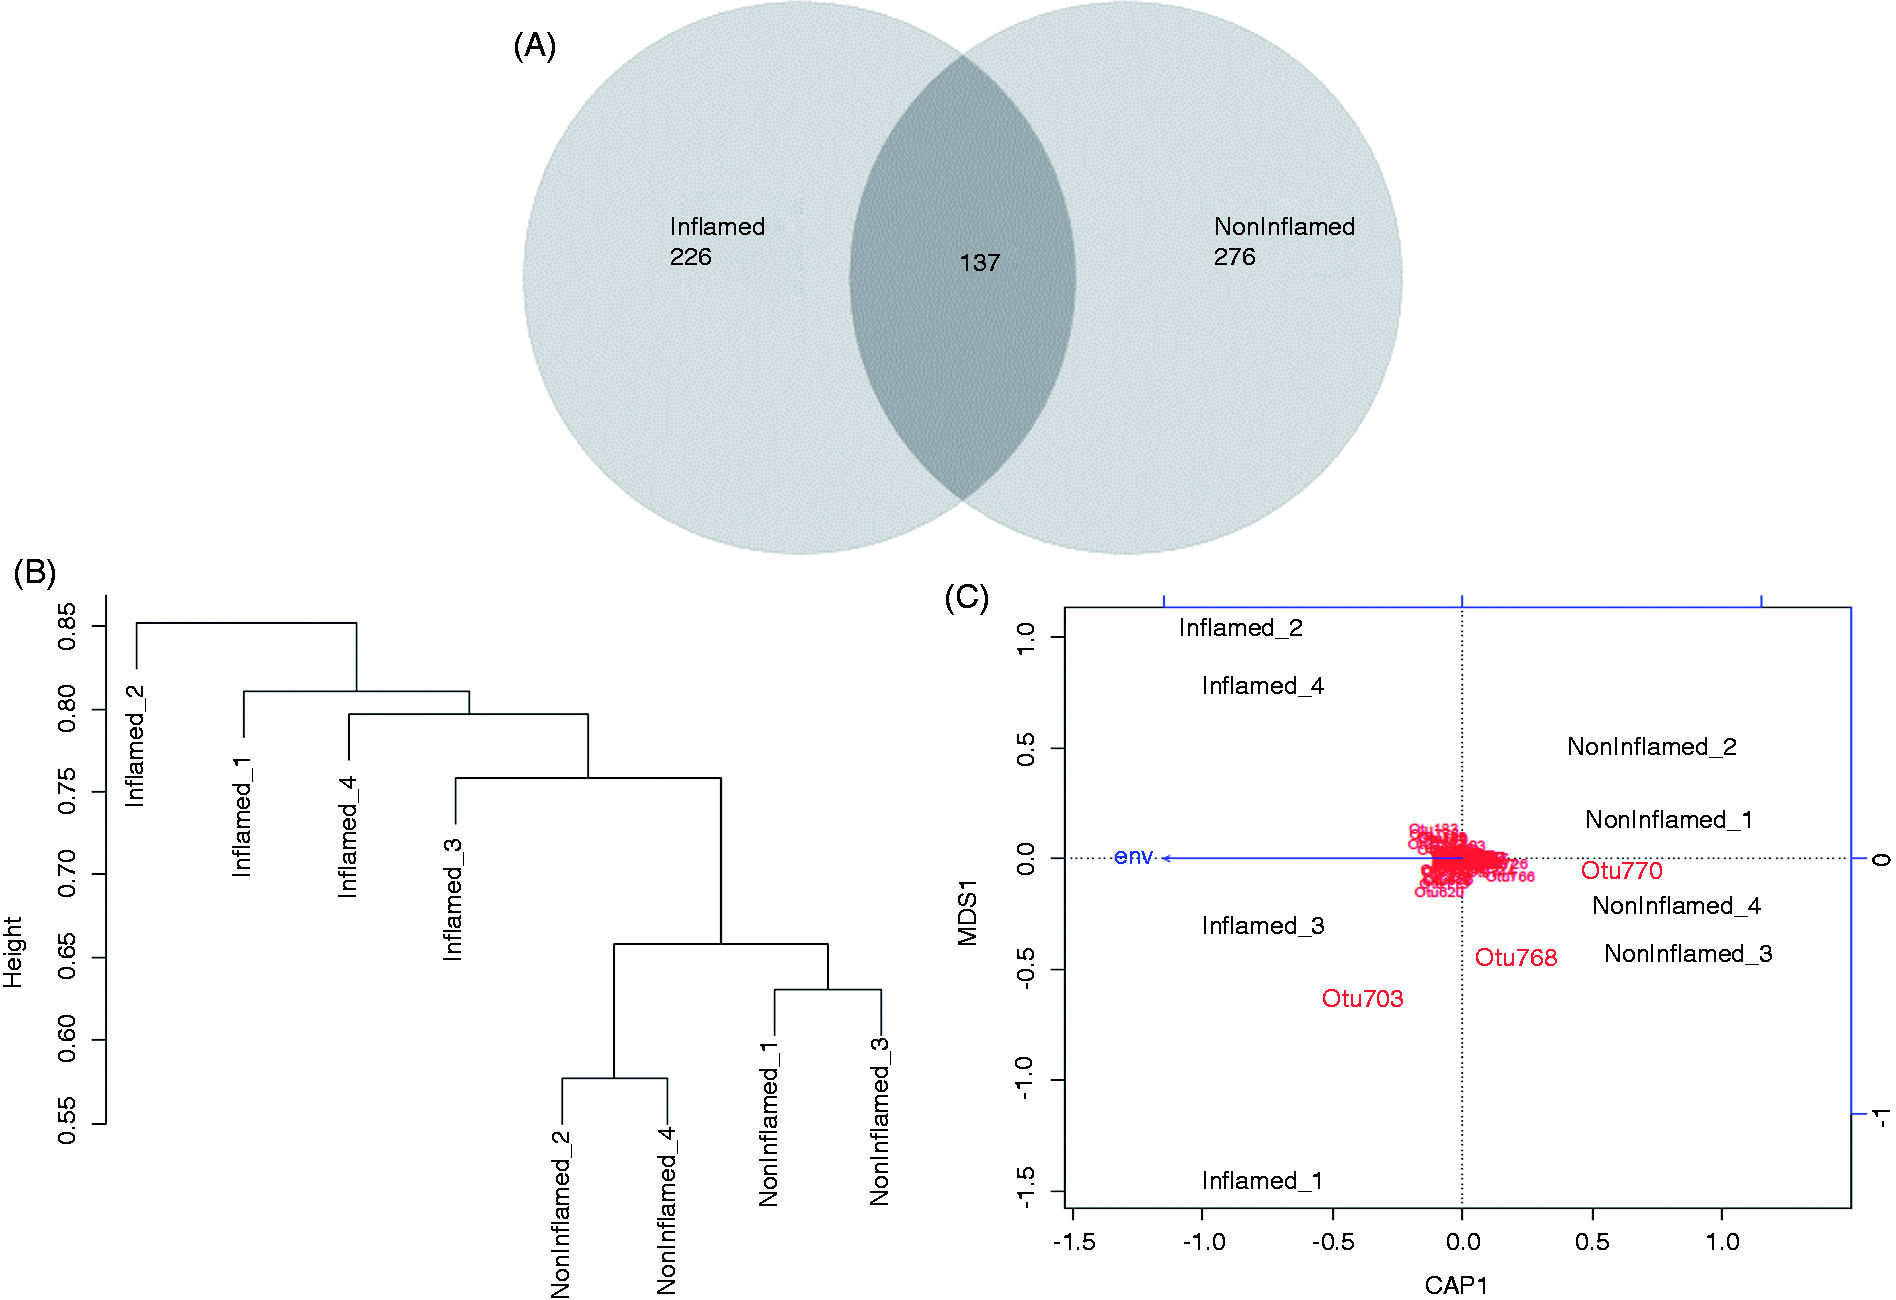
The variation in community composition between the two sampling groups was assessed by using db-RDA of BC (Figure 8B). The ordination bi-plot (Figure 8C) represents relative similarity in the OTU composition of the samples based on BC distances. The resulting P-value (< 0.03) suggested that the inflamed samples do not share the same number of OTUs, unlike the non-inflamed samples. The community composition of non-inflamed samples resembled each other. However, the inflamed samples showed significant differences forming separate clusters. These differences were also evident from the analysis of sample-wise comparative Venn diagrams (Supplementary Figure S2A–C). A significantly higher number of OTUs shared between non-inflamed samples 1 and 2 (59) and non-inflamed samples 3 and 4 (84) was suggestive of closer similarity. Similarly, a significantly lower number of OTUs shared between inflamed samples 1 and 2 (17) and inflamed samples 3 and 4 (22) was suggestive of higher differences in community composition.
Discussion
In acute appendicitis a massive infiltration of neutrophils, monocytes and lymphocytes is most often observed. 26 Very little information on the role of the innate immune system, PRR and cytokines in appendicitis is available. In this study, we showed a differential mRNA abundance of AMP with a down-regulation of the β-defensin hBD-1, while hBD-2, hBD-3 and the abundance of the α-defensins were strongly up-regulated. Interestingly, we observed an increase in the mRNA abundance of NOD2, TLR-1, TLR-4 and TLR-8. In addition, we showed a strong increase in the mRNA abundance of the pro-inflammatory cytokines TNF-α, IL-1β, IL-6, IL-8 and IL-10. Furthermore, we found significant changes in microbial community composition.
The observed increased mRNA abundance of the α-defensins HNP1–3 and of the investigated pro-inflammatory cytokines in the healthy appendices compared with the colon or ileum is in line with the assumption that the appendix is an immune organ with a high number of lymphocytes, even if no inflammation is present. As the mucosa of the appendix resembles the colon mucosa the higher basal abundance of HD5 and HD6 in the normal appendices compared with the normal colon was, in part, surprising. This could be explained by the presence of Paneth cells in the mucosa of the appendices as HD5 and HD6 are highly expressed in the healthy ileum owing to Paneth cells. 27 In line with this, the mRNA abundance of HD5 and HD6 in the appendicitis course was significantly induced. There is only very limited data on the role of the ‘Paneth cell defensins’ in diseases other than chronic inflammatory bowel disease. 27 However, recently, it was shown that HD5 and HD6 participated in the regulation of the composition of the microbiota, 28 which also changed in the course of the appendicitis, as shown in the present work. The strong increase of HNP1-3 correlates with the early invasion of these immune cells in the inflamed appendices. By facilitating phagocytosis of bacteria 29 and amplifying the production of TNF-α and INF, HNP1–3 could be part of the mechanisms against bacterial invasion in appendicitis. The functional relevance and competence against bacterial species has been studied for the β-defensins in greater detail. hBD-1 is thought to be constantly expressed in nearly every epithelium, and does not change under inflammatory conditions. However, in appendicitis hBD-1 mRNA abundance is significantly decreased. A comparable down-regulation of hBD-1 was reported for infections with enterotoxin-producing gut bacteria. 30 As the richness and diversity of the bacteria in appendicitis is altered, it is tempting to speculate that enterotoxin-producing bacteria are involved in appendicitis. For infections with Cryptosporidium parvum such a suppressive effect on hBD-1 abundance was also reported. 31 The mechanisms involved in this regulatory process are mediated by cholera-toxin and Escherichia coli enterotoxin-activated cAMP pathways. 30 Under normal conditions the bactericidal function of hBD-1 is only weak, but, as elegantly shown recently under reductive conditions, hBD-1 is highly competent in killing Gram-positive bacteria. 32 Thus, the observed down-regulation of hBD-1 might contribute to the infiltration with these groups of bacteria in appendicitis. Interestingly, in Crohn's disease a similar down-regulation of hBD-1 depending on the activity of peroxisome proliferator-activated receptor-γ was reported. 33 As appendicitis is thought to be involved in the pathophysiology of Crohn's disease, 34 further functional studies are necessary to investigate this interesting aspect.
In contrast to hBD-1, hBD-2 and hBD-3 were expressed at low levels in the healthy appendices and other intestinal areas. It is well known that in a plethora of inflammatory conditions these two most abundant β-defensins are rapidly and strongly induced. 12 As expected, the abundance of hBD-2 and hBD-3 was significantly induced in the inflamed appendices. Known inducers of these β-defensins, like IL-1β 14 and TNF-α, 35 were found to be up-regulated in appendicitis and might be responsible for this regulation of hBD-2 and hBD-3. TLRs 1, 4 and 8 are also strongly induced in appendicitis, and these receptors are reported to be inducers, as well as targets of both β-defensins.36,37
Abundance of AMPs is regulated by a plethora of factors, but cytokines and PRR are known to be involved in the regulation of most of AMP. In line with this, we demonstrated that mRNA abundance of IL-1β paralleled the changes in the up-regulated AMPs in the inflamed appendices. IL-1β is known to be crucial for induction of hBD-2 abundance, 14 especially in the course of fungal infections. 38 Besides IL-1β, TNF-α and IL-6, IL-8 and IL-10 were induced. Especially for IL-6, these data are in agreement with published studies.39,40 Interestingly, the basal abundance of the ILs in the normal appendices was already higher than in the small and large intestine, indicating that the appendix functions as an immune organ. In addition to the up-regulation of the ligands we described up-regulation of PRR. Lipoproteins are part of the cell wall of nearly all life forms and strong activators of TLR1. 41 Therefore, the up-regulated TLR1 could be a sensor of bacterial invasion in the course of appendicitis. The role of TLR1 as an activator and/or target of AMPs, as reported recently, 42 remains elusive, but TLR1 activation can lead to up-regulation of hBD-2. 43 Similarly, TLR4 is activated through LPS and can regulate hBD-2 and hBD-3 abundance. 43 TLR8, the abundance of which is also increased in appendicitis, is a receptor of ssRNA, 44 leading to the speculation that this TLR is involved in the recognition and immune response against viral infections. As a viral role in appendicitis is not clear it is more evident that TLR8 could be interacting with other TLRs and augmenting the immune response as recently reported for infections with Borrelia burgdorferi. 45 However, at the present time, we cannot rule out that viral infection might also be involved in the course of appendicitis and that the observed regulation of TLR8 is part of a virus-induced pathway. In addition to the three TLRs, we found a strong increase in the abundance of NOD2. These important receptors for the Gram-positive and Gram-negative cell membrane compound muramyl dipeptide are extensively described in the pathogenesis of chronic inflammatory bowel disease. 46 One of its crucial functions is the defense against intracellular bacteria and invasion. For the regulation of hBD-2 a role of NOD2 has been reported, 47 but for other AMPs only few data exist. 48
The observed regulation of the mRNA of AMPs, cytokines and PRR suggested the involvement of bacteria in the pathogenesis of appendicitis. To assess these microbial communities associated with appendicitis we applied phylogenetic taxonomy based on 16S rDNA sequencing and observed an overall decrease in richness and diversity of the microbial flora in the inflamed appendices that was especially visible in low abundance bacterial taxa. Our study further confirms the increase in Fusobacteria spp. in the inflamed appendices, 49 strengthening the pathophysiological importance of this group of bacteria. Besides invasion of the epithelia in infectious diseases, the interaction of microbiota with epithelial cells is thought to be involved in non-infectious diseases, including inflammatory bowel disease.7,50,51 Even if the mechanisms involved in this interaction are poorly understood, it is tempting to speculate that alteration of the bacterial flora can lead to diseases of the whole organism. The observed decreased bacterial diversity and richness could trigger initial inflammation responses in the appendix, which, in turn, lead to the swelling and blockade of the appendix opening. These aspects clearly warrant further functional exploration through metagenomic sequencing efforts and experiments investigating signaling events triggered by Fusobacteria-derived metabolites that are beyond the scope of the present study.
In conclusion, we have demonstrated a differential regulation of AMPs, their potential upstream regulators and changes in bacterial diversity in acute appendicitis.
Footnotes
Funding
This study was supported by grants of the German Research Society (DFG) SFB 617 to K. H. H., P. R. and A. A., P.R. by DGF SFB877-B9, EMED SysINFLAME CP3/4 and the Excellence Clusters Inflammation at Interfaces and Future Ocean. R. B. was supported by the Bruhn Foundation.
Acknowledgements
We would like to thank Lorin Aloji and Dr. Karlheinz Kiehne for fruitful discussion, technical support and advice. We thank Sven Neulinger for helpful discussion on statistical methods for 16s rDNA data analysis, and Silvia Voss, Manuela Kramp, Gunda Dechow and Frauke Grohmann for excellent technical support.
Conflict of interest
The authors do not have any potential conflicts of interest to declare.
References
Supplementary Material
Please find the following supplemental material available below.
For Open Access articles published under a Creative Commons License, all supplemental material carries the same license as the article it is associated with.
For non-Open Access articles published, all supplemental material carries a non-exclusive license, and permission requests for re-use of supplemental material or any part of supplemental material shall be sent directly to the copyright owner as specified in the copyright notice associated with the article.