
Abstract
The effect of LPS on the production of prostaglandin E2 (PGE2) in mouse HEI-OC1 auditory cells was examined. HEI-OC1 auditory cells constitutively produce a small amount of PGE2. LPS augmented the PGE2 production via enhanced cyclooxygenase 2 (COX2) expression. LPS-induced augmentation of COX2 expression was dependent on up-regulation of COX2 mRNA expression. LPS induced the production of TNF-α, but not IL-1β· An anti-TNF-α neutralizing Ab significantly inhibited PGE2 production and COX2 mRNA expression in response to LPS. LPS-induced PGE2 production was prevented by a series of pharmacological signaling inhibitors to NF-κB and MAPKs. Pam3CSK4 as a TLR2 ligand, as well as LPS as a TLR4 ligand, augmented the PGE2 production. However, poly I:C as a TLR3 ligand, imiquimod as a TLR7 ligand and CpG DNA as a TLR9 ligand did not augment it. HEI-OC1 cells expressed TLR2, TLR4 and TLR9, but not TLR3 or TLR7. The putative role of LPS-induced PGE2 production in auditory cells is discussed.
Introduction
Prostaglandin E2 (PGE2) is the most abundant prostanoid and a very potent lipid mediator, and is produced predominantly from arachidonic acid by its tightly regulated cyclooxygenases (COXs) and prostaglandin E synthases. 1 PGE2 is involved in regulating many different fundamental biological functions, including immune responses.1,2 Secreted PGE2 acts in an autocrine or paracrine manner through its four cognate G protein coupled E-prostanoid receptors (EP) 1 to EP4.2,3 Recently, EP signaling has been discovered to play a critical role in the pathogenesis of neuronal diseases depending on the context of neuronal injury. 4 Four distinct EPs are expressed in the stria vascularis, spiral ligament, spiral ganglion and the organ of Corti, indicating an involvement of EP signaling in the cochlear function.2,5,6 In fact, activation of EP4 in cochleae significantly attenuates noise-induced damage in cochleae, and activation of EP2 or EP4 induces the formation of vascular endothelial growth factor in cochleae. 2 Thus, EP signaling may be involved in the maintenance of the cochlear sensory system and further in regulation of immune responses, protection of sensory cells and blood flow in cochleae. 2 Although PGE2 synthesis and COX expression in the organ of Corti and cochleae is reported,2,7–9 there is no report on PGE2 synthesis in auditory cells.
Recently, we have demonstrated that bacterial LPS induces NO production in auditory cells via an inducible NO synthase expression. 10 The LPS-induced production of an excessive NO amount is suggested to cause injury of auditory cells, followed by ototoxicity. 10
Auditory cells injured by such an inflammatory response must be accompanied by tissue repair and remodeling. In order to clarify the production of PGE2 in auditory cells for regulation of inflammatory response or tissue repair, we studied it in response to LPS using a conditionally immortalized murine auditory cell line HEI-OC1. We report that LPS augments PGE2 synthesis in HEI-OC1 auditory cells via TNF-α production.
Materials and methods
Reagents
LPS from Escherichia coli O55:B5 was purchased from Sigma Chemicals (St. Louis, MO, USA). Rabbit anti-COX2 Ab and HRP-conjugated goat anti-rabbit IgG Ab were obtained from Cell Signaling Technology (Beverly, MA, USA). LY294002, PD98059, SB203580, SP600125 and Bay11-7082 were obtained from Calbiochem (San Diego, CA, USA). Recombinant mouse TNF-α and an anti-TNF-α Ab were purchased from Peprotech (Rocky Hill, NJ, USA) and R&D Systems (Minneapolis, MN, USA), respectively. Pam3CSK4, CpG DNA (ODN1826), imiquimod and poly I:C was purchased from Invivogen (San Diego, CA, USA). Indomethacin was obtained from Wako Pure Chemical (Tokyo, Japan).
Cell culture
The murine auditory cell line HEI-OC1 was established from long-term cultures of Immortomouse cochlea and used as conditionally-immortalized auditory cells. 11 HEI-OC1 cells were maintained in DMEM containing 10% heat-inactivated FCS (GIBCO-BRL, Gaithersburg, MD, USA) and penicillin G (Sigma Chemicals) at 33℃ under 5% CO2. The murine macrophage cell line RAW 264.7 was obtained from the Riken Cell Bank (Tsukuba, Japan) and maintained in RPMI medium containing 5% heat inactivated FCS, antibiotics and antimycotics at 37℃ under 5% CO2.
Determination of PGE2
HEI-OC1 cells were stimulated with or without LPS and the concentration of PGE2 in the culture supernatant was determined with ELISA using a commercial kit (Cayman chemical, Ann Arbor, MI, USA).
Determination of TNF-α and IL-1β
HEI-OC1 cells were stimulated with or without LPS and the concentrations of TNF-α and IL-1β in the culture supernatant were determined with ELISA using commercial kits from R&D Systems.
Immunoblotting
Immunoblotting was performed as described previously.12,13 Briefly, cells were cultured with or without LPS for indicated time and then lysed in lysis buffer. Protein concentrations were measured using a bicinchoninic acid protein assay reagent (Pierce, Rockford, IL, USA). Equal amounts of protein (0.02 mg) diluted using 4× sample buffer and boiled for 5 min were analyzed by SDS-PAGE (Tefco, Tokyo, Japan) under reducing conditions, and proteins separated were transferred to membranes (Durapore, Merck Millipore, Billerica, MA, USA) by electroblotting. After blocking with 5% skimmed milk in PBS for 1 h, membranes were treated with appropriately diluted Abs. Resulting immune complexes were reacted with HRP-conjugated goat anti-rabbit IgG secondary Ab at a 1:2000 dilution. Finally, labeled Ag bands were detected with a chemiluminescence reagent, supersignal west dura (Pierce) and analyzed using an AE6955 light capture system with a CS analyser (Atto, Tokyo, Japan). For re-probing, the membranes were stripped with the restore immunoblot striping buffer (Thermo Scientific, Rockford, IL, USA) for 20 min, blocked with 5% skimmed milk for 1 h and then treated with corresponding Abs. Prestained protein markers from BioDynamics Laboratory (Tokyo, Japan) were used to estimate molecular mass. Immunoblotting bands were quantified by densitometric analysis using ImageJ software, and relative level was evaluated against β-actin.
RT-PCR and real-time PCR
The total RNA was isolated using the SV total RNA isolation system (Promega, Madison, WI, USA) in accordance with the manufacturer’s protocol. The RT-PCR was performed as described previously.14,15 Briefly, RT-PCR was carried out by using the PrimeScriptT RT–PCR kit (Takara, Shiga, Japan). Primers were obtained from Invitrogen (Carlsbad, CA, USA) with the following sequences: TLR2, forward 5′-AACTTCGTACGGAGCGAGTG-3′ and reverse 5′- CTCTCAATGGGCTCCAGCAA-3′; TLR3, forward 5′- CTTGCGTTGCGAAGTGAAGAA-3′ and reverse 5′-CCAATTGTCTGGAAACACCCC-3′; TLR4, forward 5′- GGCAACTTGGACCTGAGGAG-3′ and reverse 5′- CCATGTGTTCCATGGGCTCT-3′; TLR7, forward 5′- AGGGCATTCCCACTAACACC-3′ and reverse 5′- TGGTTCAGCCTACGGAAGGA-3′; TLR9, forward 5′- ATAAGGCACAGAGCGCAGTT-3′ and reverse 5′- ATCTCGGTCCTCCAGACACA-3′; and GAPDH, forward 5′-ATGGGGAAGGTGAAGGTCGGAGTC-3′ and reverse 5′-GCTGATGATCTTGAGGCTGTTGTC-3′. GAPDH was used as an equal loading control. RNA and dNTP mixture were kept at 65℃ for 5 min; then, enzyme was added and reverse transcription was performed at 37℃ for 15 min followed by 85℃ for 5 s using a portion of the synthesized strand from the reverse transcription as a template for PCR using Takara ExTaq HS. Optimized PCR conditions were 94℃ for 1 min and 30 cycles at 94℃ for 30 s, 60℃ for 30 s and 72℃ for 1 min. The PCR products were analyzed by electrophoresis on 1.5% agarose gel. The gels were stained with ethidium bromide (Sigma Chemicals) and visualized under ultraviolet UV transilluminator. The 100-base pair DNA size marker (Invitrogen) was also run to determine the approximate size of the product.
The expression of mRNA was quantified using the cDNA by real-time PCR with StepOne real-time PCR, according to the manufacturer’s instructions (Applied Biosystems, Foster, CA, USA). The reaction was performed as described previously.16,17 Briefly, the reaction mixture consisted of SYBR green fast PCR master mix (Applied Biosystems) and sequence-specific primers: COX2, forward 5′-CCTGCTGCCCGACACCTTCAACAT−3′ and reverse 5′-CAGCAACCCGGCCAGCAATCT-3′. Optimized real-time PCR conditions were 95℃ for 20 s followed by 40 cycles at 95℃ for 3 s and 60℃ for 30 s.
Experiments were performed in triplicate. The expression levels of COX2 mRNA were normalized to GAPDH using the ΔCt method. Parallelism of standard curves of the test and control was confirmed.
Statistical analysis
Statistical analysis was performed using Student’s t-test and P-values < 0.05 were considered significant. All experiments were performed independently at least three times. Data represent the mean value of triplicates ± SD.
Results
Augmentation of PGE2 production in HEI-OC1 cells by LPS
The PGE2 productivity of HEI-OC1 cells in response to LPS was examined. HEI-OC1 cells were incubated with various concentrations of LPS for 24 h and the concentration of PGE2 in the culture supernatant was determined with ELISA (Figure 1). LPS at 0.01 µg/ml significantly augmented the synthesis of PGE2, and the highest level of PGE2 was produced at 0.1 or 1.0 µg/ml of LPS. In addition, HEI-OC1 cells produced a small amount of PGE2 in the absence of LPS. Next, the time kinetics of LPS-induced PGE2 production were examined (Figure 1B). Cells were incubated with LPS at 0.1 µg/ml for various hours. LPS significantly induced PGE2 production 1 h after the stimulation, and PGE2 production at 3 h was higher than that at 1 h. There was no significant difference in the PGE2 level among 3, 6 and 24 h after LPS stimulation.
Effect of LPS on production of PGE2 in HEI-OC1 auditory cells. (A) Cells were incubated with various concentrations of LPS for 24 h. (B) Cells were incubated with LPS at 0.1 µg/ml for various lengths of time. The concentration of PGE2 in the culture supernatant was determined with ELISA. *P < 0.01 versus non-treated control, **P < 0.01 versus 1 h treatment.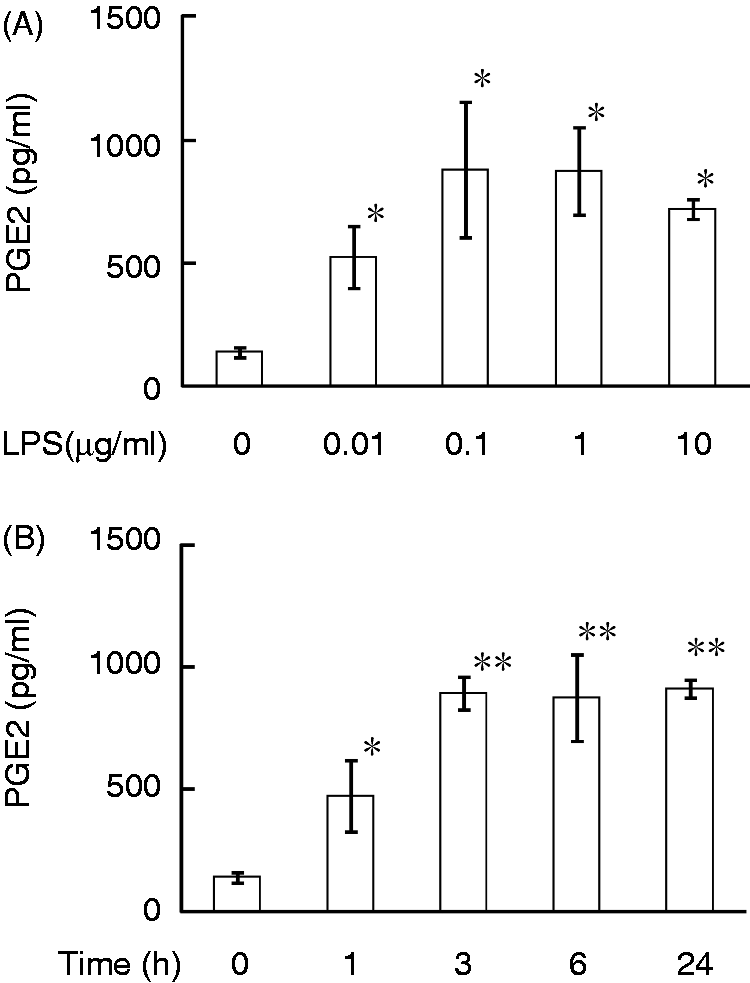
Induction of COX2 protein expression by LPS
The effect of LPS on the expression of COX2 protein leading to PGE2 synthesis was examined (Figure 2). HEI-OC1 cells were incubated with LPS at various concentrations of LPS for 6 h. Immunoblotting analysis demonstrated that a strong band of COX2 protein was detected in LPS-treated cells, although a faint band was detectable in untreated cells (Figure 2A). LPS at 0.1–10.0 µg/ml augmented the expression of COX2 protein. The time kinetics of COX2 protein expression was examined (Figure 2B). HEI-OC1 cells were incubated with LPS at 0.1 µg/ml for various lengths of time. Immunoblotting analysis demonstrated that the expression of COX2 protein was slightly augmented 1 h after LPS stimulation and that the highest expression of COX2 protein was detected 3 and 6 h after the stimulation. The level of COX2 expression decreased 24 h after LPS stimulation. When HEI-OC1 cells were pretreated with indomethacin as an inhibitor of COX1/2 at 100 µM for 30 min, it inhibited LPS-induced PGE2 production (50% inhibition), suggesting the involvement of COX1/2 in the PGE2 production.
Effect of LPS on expression of COX2 protein in HEI-OC1 auditory cells. (A) Cells were incubated with various concentrations of LPS for 6 h. (B) Cells were incubated with LPS at 0.1 µg/ml for various lengths of time. COX2 protein expression was determined by immunoblotting. Immunoblotting bands were quantified by densitometry and normalized against β-actin. A typical result of three independent experiments is shown.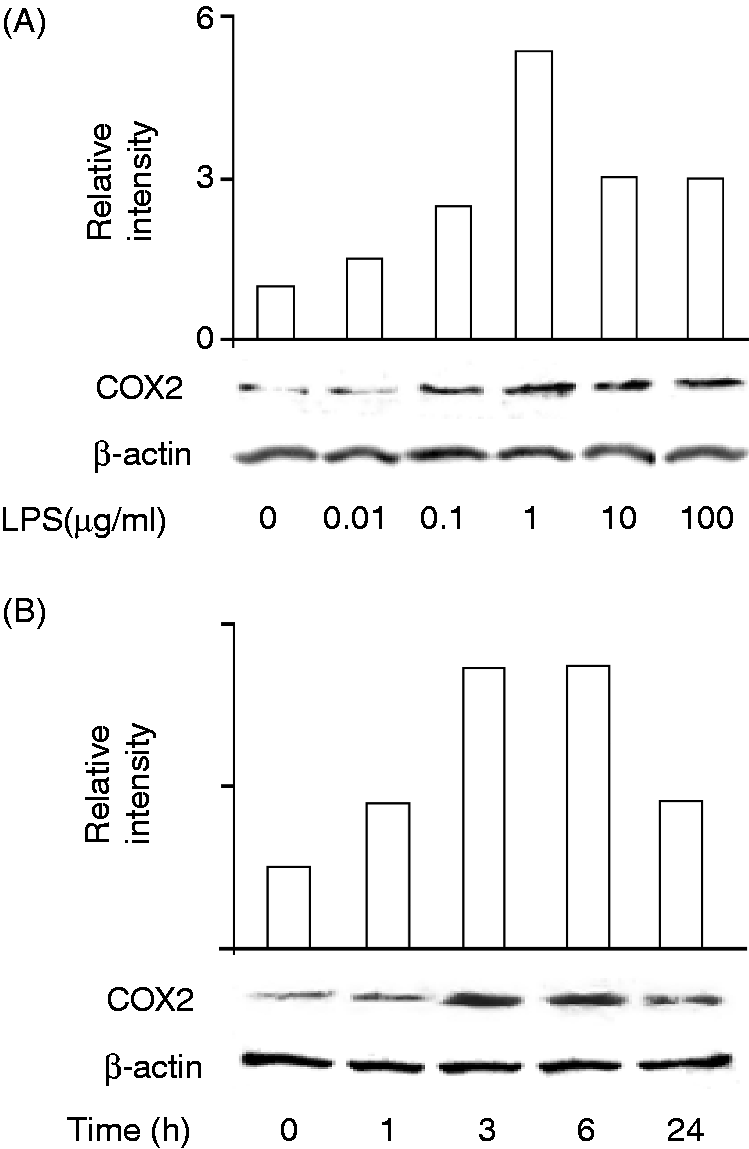
Induction of COX2 mRNA expression by LPS
The effect of LPS on the expression of COX2 mRNA was examined (Figure 3). Based on a small amount of PGE2 production in normal HEI-OC1 cells, the expression of COX2 mRNA in normal HEI-OC1 auditory cells and RAW 264.7 macrophage cells was compared with RT-PCR (Figure 3A). COX2 mRNA was detected in normal HEI-OC1 cells, but not RAW 264.7 cells, suggesting constitutive PGE2 production in HEI-OC1 cells.
Effect of LPS on expression of COX2 mRNA in HEI-OC1 auditory cells. (A) COX2 mRNA expression in normal HEI-OC1 cells and RAW 264.7 cells was compared with RT-PCR. (B) HEI-OC1 cells were incubated with various concentrations of LPS for 4 h. (C) HEI-OC1 cells were incubated with LPS at 1 µg/ml for various lengths of time. (B, C) COX2 mRNA expression was quantified by real-time PCR. A typical result of three independent experiments is shown. *P < 0.01 versus non-treated control.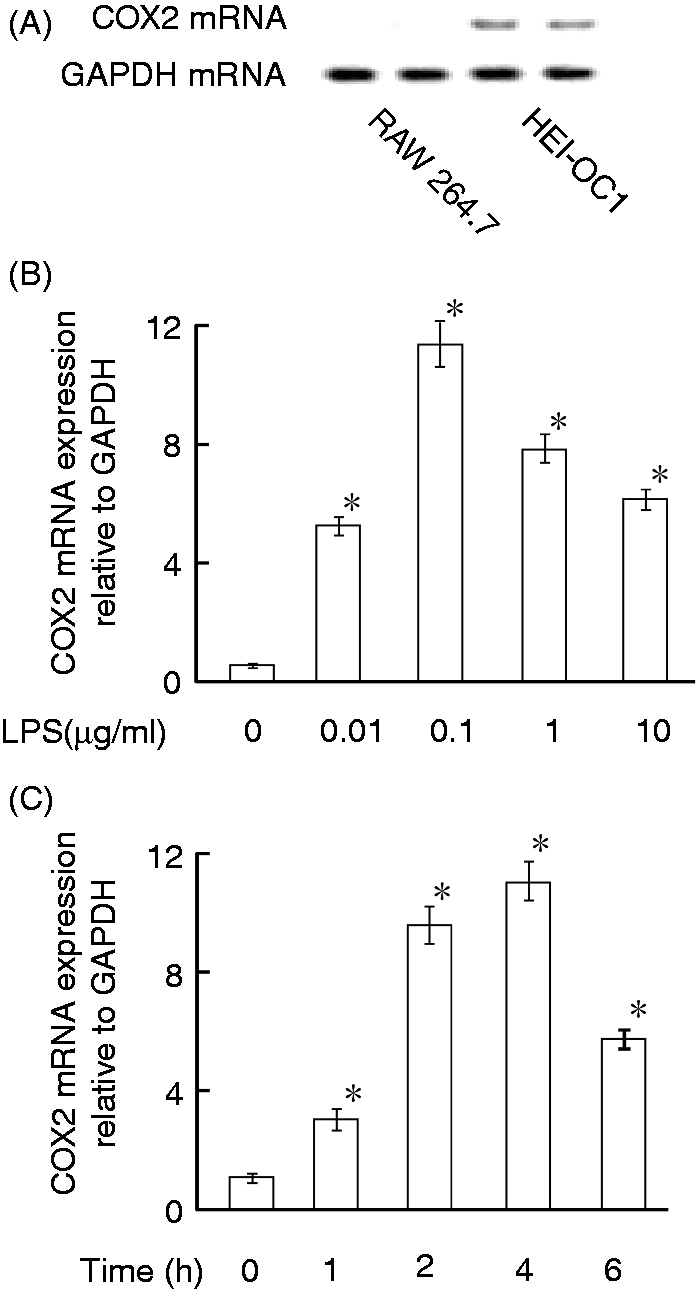
The effect of various concentrations of LPS on the expression of COX2 mRNA in HEI-OC1 cells was examined. Real-time PCR analysis demonstrated that LPS at 0.01 µg/ml significantly augmented the COX2 mRNA expression and that the COX2 mRNA expression was maximal at LPS 0.1 µg/ml (Figure 3B).
The time course of COX2 mRNA expression was examined with real-time PCR (Figure 3C). HEI-OC1 cells were treated with LPS (0.1 µg/ml) for various lengths of time. The expression of COX2 mRNA was augmented 1 h after LPS stimulation. Expression of COX2 mRNA increased up to 2 and 4 h; thereafter, it decreased at 6 h.
Induction of cytokines affecting PGE2 production in response to LPS
Several cytokines affecting PGE2 synthesis, such as TNF-α and IL-1β,18,19 are produced in response to LPS. In order to characterize the involvement of cytokines in LPS-induced PGE2 production, the effect of LPS on the production of TNF-α and IL-1β was examined (Figure 4). HEI-OC1 cells were incubated with LPS at 0.1 µg/ml for 3 h. The cytokine levels were determined with ELISA. Production of TNF-α was induced 3 h after LPS stimulation whereas that of IL-1β was not induced.
Effect of LPS on production of TNF-α and IL-1β in HEI-OC1 auditory cells. Cells were incubated with LPS at 0.1 µg/ml for various lengths of time. The concentrations of TNF-α and IL-1β in the culture supernatant were determined with ELISA. *P < 0.01 versus non-treated control. A typical result of three independent experiments is shown.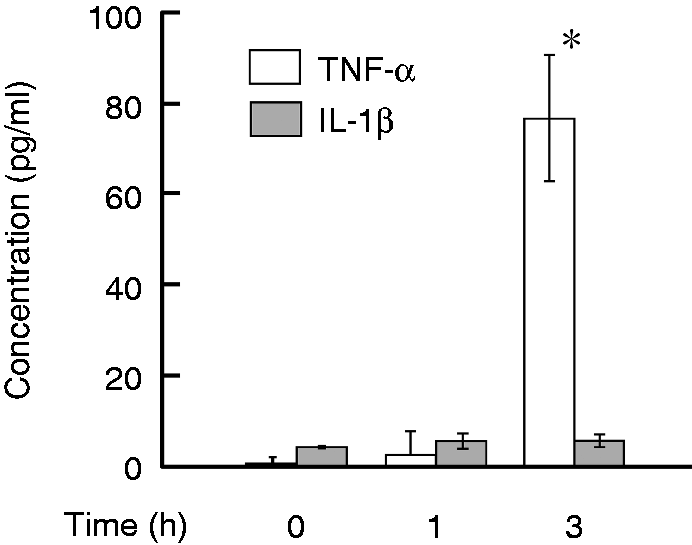
Involvement of TNF-α in LPS-induced PGE2 production
Considering that LPS induced TNF-α production in HEI-OC1 cells within 3 h, the involvement of TNF-α on LPS-induced PGE2 production was examined (Figure 5A). HEI-OC1 cells were stimulated with LPS (0.1 µg/ml) in the presence or absence of an anti-TNF-α neutralizing Ab (5 µg/ml) for 6 h. The anti-TNF-α Ab (5 µg/ml) inhibited detection of TNF-α (10 ng/ml) in ELISA (70% inhibition) (data not shown). TNF-α, as well as LPS, induced production of PGE2, whereas anti-TNF-α Ab reduced it in response to LPS or TNF-α. Next, the effect of anti-TNF-α Ab on LPS-induced COX2 mRNA expression was examined (Figure 5B). HEI-OC1 cells were stimulated with LPS (0.1 µg/ml) in the presence or absence of anti-TNF-α Ab (5 µg/ml) for 6 h. Real-time PCR analysis showed that anti-TNF-α Ab reduced the expression of PGE2 mRNA in response to LPS or TNF-α, although LPS or TNF-α induced PGE2 mRNA expression.
Effect of anti-TNF-α Ab on production of PGE2 in response to LPS or TNF-α. HEI-OC1 cells were incubated with LPS at 0.1 µg/ml or TNF-α at 10 ng/ml for 6 h in the presence or absence of anti-TNF-α Ab (5µg/ml). (A) The concentration of PGE2 were determined with ELISA. (B) The expression of COX2 mRNA was quantified with real-time PCR. *P < 0.01 versus control in the absence of Ab.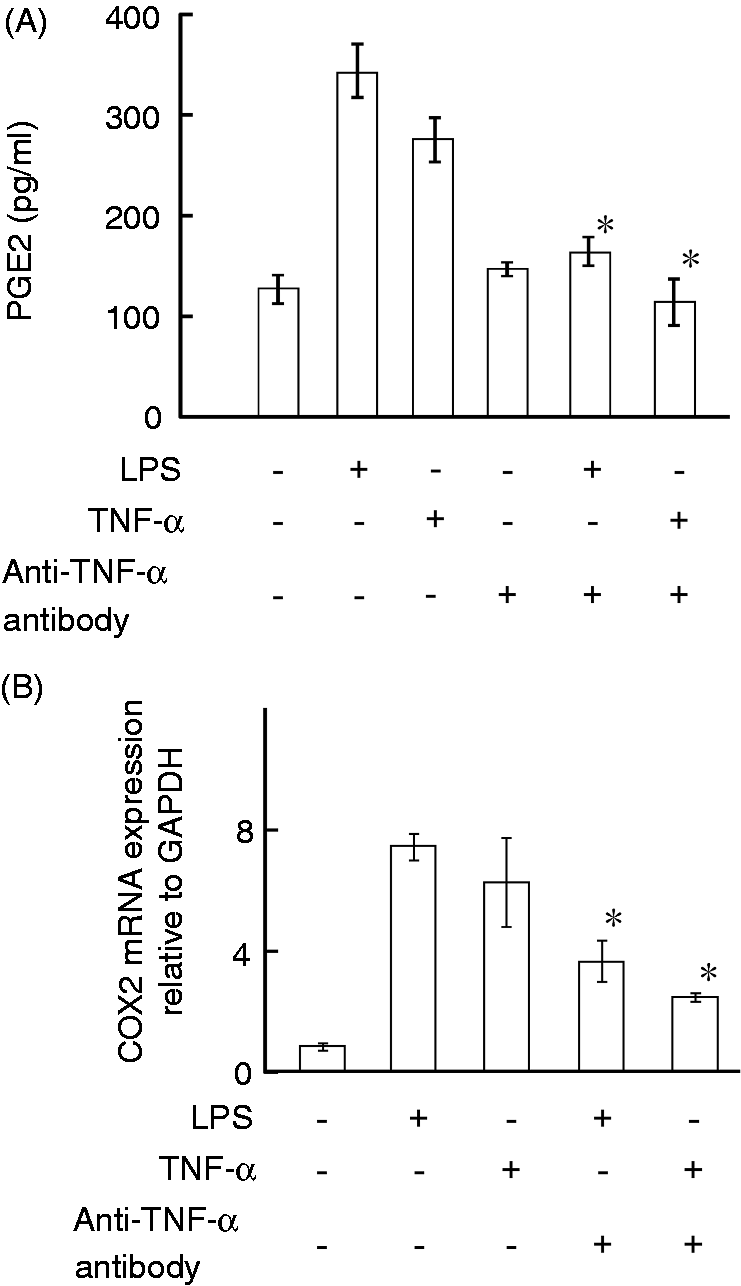
Effect of various signal inhibitors on LPS-induced PGE2 production
The effect of a series of signal inhibitors on LPS-induced PGE2 production was examined. HEI-OC1 cells were stimulated with LPS (0.1 µg/ml) in the presence of a series of signal inhibitors for 6 h. Bay 11-7082 as a NF-κB inhibitor, LY294002 as a phosphoinositide 3-kinase (PI3K) inhibitor, PD98059 as an ERK 1/2 inhibitor, SB203580 as a p38 inhibitor and SP600125 as a JNK inhibitor inhibited LPS-induced PGE2 production (Figure 6).
Effect of a series of signaling inhibitors on LPS-induced PGE2 production in HEI-OC1 cells. Cells were incubated with LPS at 0.1 µg/ml in the presence or absence of Bay (a NF-κB inhibitor, 2.5 µM), LY294002 (a PI3K inhibitor, 20 µM), PD98059 (an ERK1/2 inhibitor, 25 µM), SB203589 (a p38 inhibitor, 25 µM) or SP600125 (a JNK inhibitor, 20 µM). The concentration of PGE2 in the supernatant was determined with ELISA. *P < 0.01 versus control in the absence of inhibitors.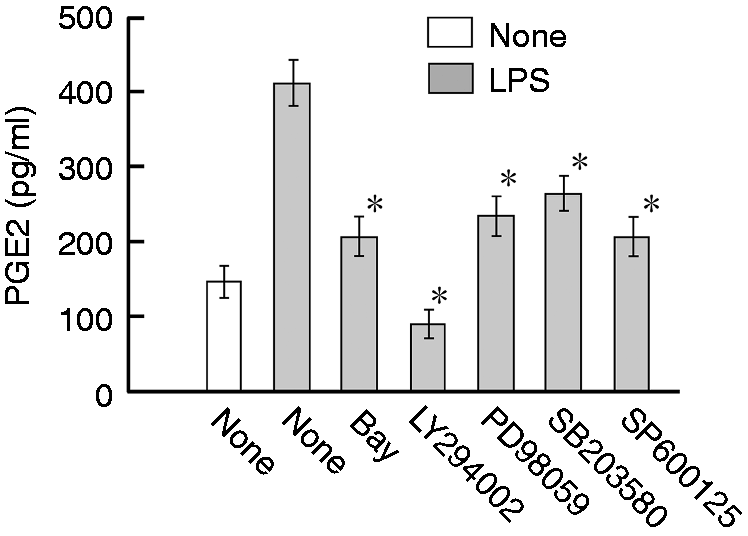
Effect of various TLR ligands on PGE2 production
The effect of various TLR ligands on the production of PGE2 was examined. HEI-OC1 cells were incubated with various TLR ligands at indicated concentrations for 24 h. LPS (TLR4 ligand) and Pam3CSK4 (TLR2 ligand) augmented PGE2 production, whereas poly I:C (TLR3 ligand), imiquimod (TLR7 ligand) and CpG DNA (TLR9 ligand) did not augment it (Figure 7A). Neither Pam3CSK4 nor CpG DNA further augmented it in the presence of LPS. The effect of LPS, Pam3CSK4 and CpG DNA on the expression of PGE2 mRNA was examined. Real-time PCR analysis showed that LPS and Pam3CSK4, but not CpG DNA, augmented COX2 mRNA expression (Figure 7B).
Effect of a series of TLR ligands on PGE2 production and COX2 mRNA expression in HEI-OC1 cells. (A) HEI-OC1 cells were incubated with Pam3CSK4 (10 µg/ml), poly I:C (10 µg/ml), imiquimod (10 µg/ml) or CpG DNA (5 µM) in the presence or absence of LPS (0.1 µg/ml) for 8 h. The concentration of PGE2 in the supernatant was determined with ELISA. (B) HEI-OC1 cells were incubated with LPS (0.1 µg/ml), Pam3CSK4 (10 µg/ml) and CpG DNA (5 µM) for 4 h. The expression of COX2 mRNA was quantified with real-time PCR. A typical result of three independent experiments is shown. *P < 0.01 versus non-treated control.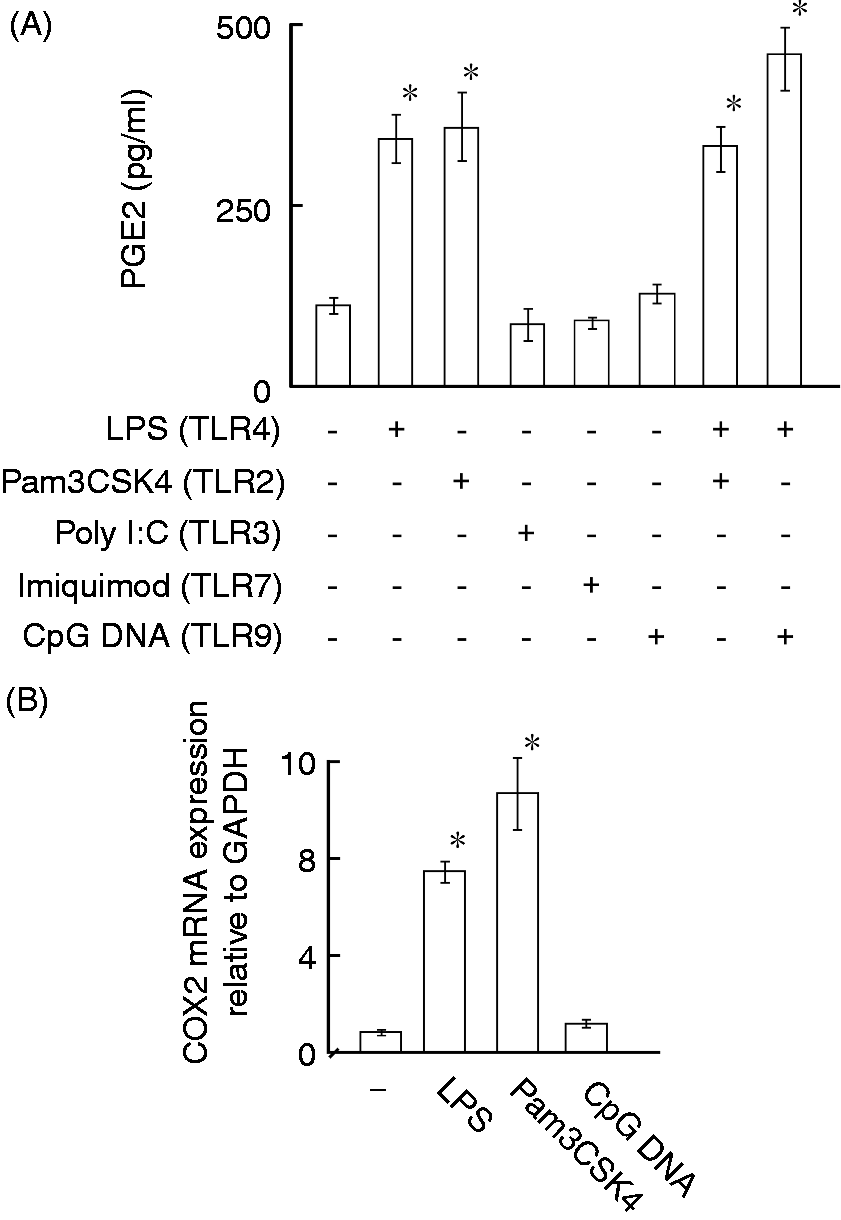
Expression of various TLRs in HEI-OC1 cells
The mRNA expression of various TLRs in normal HEI-OC1 auditory cells and RAW 264.7 macrophage cells was examined with RT-PCR (Figure 8). The mRNA expression of TLR2, TLR4 and TLR9 was detected in HEI-OC1 cells, whereas that of TLR3 and 7 was not detected. However, all TLR mRNA was expressed in RAW 264.7 macrophage cells.
Expression of various TLRs in HEI-OC1 cells. The expression of various TLRs mRNA in normal HEI-OC1 auditory cells and RAW 264.7 macrophage cells were compared with RT-PCR.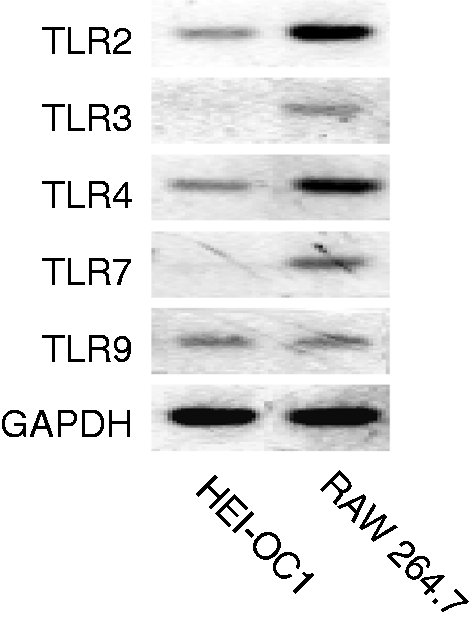
Discussion
We have demonstrated that HEI-OC1 auditory cells produce a high level of PGE2 in response to LPS via augmented expression of COX2 protein and mRNA. The constitutive synthesis of PGE2 in the cochlea has been reported.7–9 The constitutive expression of COX1 is found in various types of cochlear cell, while COX2 expression in normal cochleae is still controversial.7,8 Our results support the constitutive COX2 expression and PGE2 synthesis in normal auditory cells. LPS is suggested to up-regulate the expression of COX2 protein and mRNA, and augment PGE2 synthesis in HEI-OC1 auditory cells. This is the first report showing LPS-induced PGE2 production in auditory cells via COX2 expression, although conditionally immortalized auditory cells from long-term cultures of immortomouse cochlea are used as auditory cells.
Acute inflammation is a protective host response to pathogens or injury. PGE2 is synthesized in substantial amounts at sites of inflammation where it acts as a potent vasodilator. 20 Therefore, auditory cells are suggested to play an important role in regulation of inflammatory response and tissue repair in the organ of Corti. Considering that PGE2 has been traditionally regarded as an immunosuppressant,3,21 PGE2 produced by pro-inflammatory mediators such as TNF-α in response to LPS may terminate acute inflammatory responses. Thus, the synthesis of PGE2 in auditory cells must be an essential homeostatic factor in infection, inflammation and tissue injury, and apoptosis in the organ of Corti, although the precise role of PGE2 production in auditory cells in response to LPS is still unclear. However, PGE2 has been referred to as a classical pro-inflammatory mediator. 22 The possibility that LPS-induced PGE2 production is involved in promotion of inflammation in the organ of Corti and cochleae is not excluded.
The overexpression of COX2 is induced by pro-inflammatory mediators such as TNF-α and IL-1β.18,19 In fact, LPS-induced PGE2 production in HEI-OC1 auditory cells is mediated by TNF-α. It is supported by several other studies that PGE2 is induced by a pro-inflammatory cytokines, such as TNF-α, IL-1β, IFN-γ18,19 and NO 23 . Recently, we have reported LPS-induced NO production in HEI-OC1 cells. 10 However, NO-mediated PGE2 synthesis is unlikely as LPS-induced PGE2 and NO production in auditory cells occurs 3 h and 24 h after LPS stimulation, respectively. PGE2 induced by TNF-α is possible to suppress acute inflammation and terminate early inflammatory response.
The MAPK pathway, JNK and/or p38, are important intracellular signaling pathways for the induction of COX2.24–26 NF-κB is also involved in LPS-induced COX2 expression in macrophages. 27 Our finding demonstrates that inhibitors of p38 and JNK reduce the production of PGE2 in response to LPS. Moreover, pharmacological inhibitors of NF-κB, PI3K and ERK1/2 abolish LPS-induced PGE2 production. Based on the finding that LPS-induced PGE2 production is mainly dependent on TNF-α production, the signaling inhibitors modulating LPS-induced TNF-α production possibly affect PGE2 production. The MyD88-dependent pathway of LPS signaling would be mainly involved in LPS-induced PGE2 production in auditory cells.
We show, for the first time, that HEI-OC1 auditory cells express TLR2, TLR4 and TLR9, but not TLR3 or TLR7. However, it is unknown whether physiologic auditory cells possess the same expression pattern of TLRs or not. Furthermore, there is no report on the responsiveness of HEI-OC1 cells to TLR ligands other than LPS. It is reasonable that neither poly I:C nor imiquimod augments the PGE2 production in HEI-OC1 cells because of no respective TLR expression. However, CpG DNA does not augment PGE2 production in HEI-OC1 cells expressing TLR9. The unresponsiveness of HEI-OC1 to CpG DNA cells awaits further characterization.
Recently, we have reported that HEI-OC1 cells require a higher concentration of LPS, such as 10 or 100 µg/ml, for NO production. 10 However, the present study shows that HEI-OC1 cells require LPS concentrations ranging from 0.1 to 10.0 µg/ml for PGE2 production. PGE2 production in auditory cells is more susceptible to LPS than the NO production. Auditory cells appear to detect a lower level of LPS and produce PGE2 as a potent vasodilator for tissue repair and remodeling at an early stage of inflammatory response. Moreover, they may produce NO as another vasodilator in response to a higher level of LPS.
In conclusion, auditory cells produce PGE2 in response to LPS via COX2 expression. The PGE2 production may be involved in tissue repair and remodeling in the organ of Corti. Auditory cells might be important effector cells in host response to infection and inflammation in the organ of Corti and cochleae.
Footnotes
Funding
This work was supported by in part by a Grant-in-Aid for Scientific Research from the Ministry of Education, Science, Sports and Culture of Japan and a grant of Strategic Research Foundation Grant-aided Project for Private Universities from Ministry of Education, Culture, Sports, Science, and Technology, Japan (MEXT), 2011-2015 (S1101027).
Conflict of interest
The authors do not have any potential conflicts of interest to declare.