
Abstract
Using a single-stranded DNA (ssDNA) aptamer exhibiting high binding affinity (Kd = 12 nM) to endotoxin as a probe, an impedance sensor where aptamer-conjugated gold nanoparticles (AuNPs) were electrochemically deposited on a gold electrode was fabricated and its performance in regard to endotoxin detection assessed. AuNPs have been employed widely as biosensors because of their unique physical and chemical properties. In order to maximize the performance of the impedance aptasensor on endotoxin detection, some critical factors affecting aptamer conjugation to AuNPs and target recognition ability (i.e. concentrations of aptamer coupled with AuNPs, pH, ion strength and cation effect at the time of aptamer–endotoxin interaction) were optimized. Electrochemical impendence spectroscopy, cyclic voltametry, atomic force microscope, scanning electron microscope and quartz crystal microbalance were employed to characterize all the modification/detection procedures during the sensor fabrication. The developed aptasensor showed a broad linear dynamic detection range (0.01–10.24 ng/ml) with a very low detection limit for endotoxin (0.005 ng/ml), despite the presence of several biomolecules (e.g. plasmid DNA, RNA, serum albumin, Glc and sucrose) known to interfere with other endotoxin assays. The demonstrated aptasensor required a detection time of only 10 min, providing a simple and fast analytical method to specifically detect endotoxin from complex biological liqors.
Introduction
Endotoxin (LPS) exists in the outer membrane of most Gram-negative bacteria. Although endotoxin itself is chemically inert, its presence in blood (endotoxemia) triggers strong immune responses, which are frequently accompanied by inadvertent changes in structures of organs and cells, metabolic functions, body temperature and hemodynamics, thereby leading to septic shock and mortality.1–4 The presence of endotoxin has always been a serious threat to the safety of food processing, medical treatments and drug manufacturing.
Electrochemical biosensors are often considered as rapid, robust, cost-effective and accurate analytical tools for the detection of various target molecules.5–7 The introduction of gold nanoparticles (AuNPs) to electrochemical biosensors has attracted much attention owing to their novel shape-/size-dependent physical and chemical properties, such as fast electron transfer, high surface area, excellent biocompatibility and facile synthesis.8–10 In particular, the formation of a self-assembled monolayer (SAM) on the AuNP surface via Au–S bonding is the most facile, effective and popular technique to yield sensing interfaces in a variety of biosensing platforms.11–13
Aptamers are single-stranded nucleic acid (RNA or DNA) molecules possessing unique binding affinity and high specificity to various target substrates, including small ions, proteins and cells. 14 Compared with the traditional probes (e.g. Abs and enzymes), aptamers present several unique advantages, such as in vitro selection procedure, reproducible chemical synthesis, easy modification, remarkable flexibility, low cost, high stability, small size and reversible denaturation (i.e. easy regeneration).15–17 This has enabled aptamers to provide huge potential in the bioanalytical field since their first in vitro selection by Gold and Ellington.18–20 A recent study reported a single-stranded DNA (ssDNA) aptamer evolved through a nonequilibrium capillary electrophoresis of equilibrium mixtures (NECEEM)-based non-systematic evolution of ligands by exponential enrichment (non-SELEX) method to show high, and specific, affinity to endotoxin. An electrochemical sensor using this aptamer as probes was subsequently developed to demonstrate endotoxin detection from 0.01 ng/ml to 1 ng/ml, with a sensitivity of 2046 Ω per 10-fold increase in endotoxin concentration. 21 Later, another impedance sensor with a lower limit of endotoxin detection (0.001 ng/ml) was developed using 3-mercaptopropionic acid (MPA) as a linker to immobilize the same aptamer. However, its sensitivity (i.e. 597 Ω per 10-fold increase in endotoxin concentration) was not very high owing to the presence of a thick insulation layer comprising the linker molecules. 22
In this study, a new electrochemical aptasensor was designed with the assistance of AuNPs as signal transducers and/or amplifiers. After electrochemical deposition of gold nanoparticles, the gold electrode was modified with a self-assembled monolayer of thiolated ssDNA aptamers. The morphology of AuNPs and aptamer/AuNP-coated electrodes were characterized by scanning electron microscope (SEM) and atomic force microscope (AFM). Aptamer coverage on the AuNP surface was measured by quartz crystal microbalance (QCM). Electrochemical impedance spectroscopy (EIS) was employed to detect varying concentrations of endotoxin (0.005–10.24 ng/ml) in biomimetic cocktail solutions containing sugars, nucleic acids and protein as representative interfering molecules. The factors affecting the aptamer immobilization and target binding were optimized to maximize the sensitivity and to reduce the response time. The schematic diagram for the modification and detection processes of the aptasensor is shown in Figure 1.
A schematic of fabricating aptasensor to selectively detect endotoxin from biomimetic cocktail solutions crowded with Glc, sucrose, plasmid DNA, RNA and BSA. MCH: 6-mercapto-1-hexanol.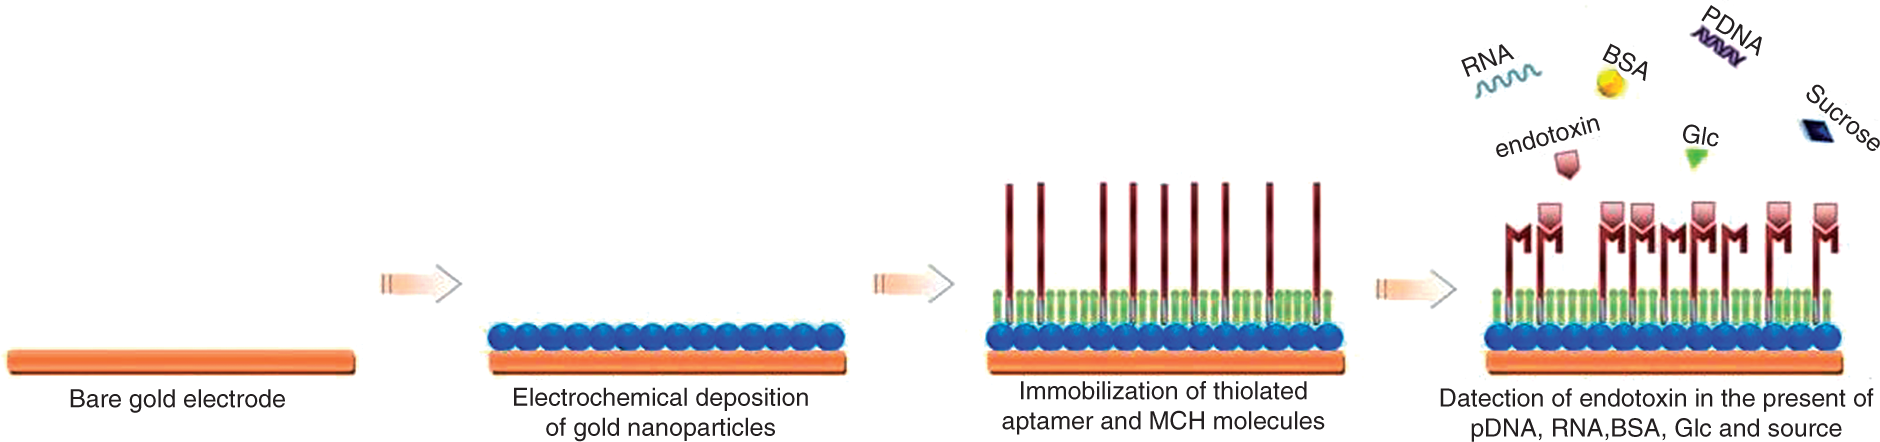
Materials and methods
Materials and apparatus
HAuCl4, K3Fe(CN)6, K4Fe(CN)6, DTT and 6-mercapto-1-hexanol (MCH) were purchased from Sigma-Aldrich (St Louis, MO, USA) and used without further purification. Endotoxin from Escherichia coli 055:B5 (L4524) was purchased from Sigma and stored at −20℃ before use. The pyrogenic activity of endotoxin was measured according to the Limulus amebocyte lysate (LAL) assay protocols described elsewhere;
23
1 ng of endotoxin used in the present study was found to be equivalent to 0.5 endotoxin units (EU). The endotoxin binding aptamer,
21
5′-CTT CTG CCC GCC TCC TTC C- TAG CCG GAT CGC GCT GGC CAG ATG ATA TAA AGG GTC AGC CCC CCA -GGA GAC GAG ATA GGC GGA CAC T-3′, was synthesized by Integrated DNA Technologies (IDT, Coralville, IA, USA) and stored at −20℃ before use.
VSP Potentiostat (Princeton Applied Research, Oak Ridge, TN, USA) and EC-Lab software were used to record all the electrochemical experiments conducted in a conventional three-electrode system with a working Au disk of 2 mm diameter (CH Instruments, Inc., Austin, TX, USA), a reference (Ag/AgCl in saturated KCl) and a counter (Pt plate) electrode. In order to estimate the amount of aptamer loaded onto the gold electrode, 10 MHz AT-cut crystal coated with polished gold disk (5 mm in diameter) on both sides was deposited electrochemically with AuNPs in the same condition used for gold electrode modification and used for QCM (Princeton Applied Research) measurement. The frequency change of 1 Hz corresponded to the binding of 1.3 ng of aptamer to the gold disk.
In EIS measurement, a sine wave of 10 mV amplitude was applied in the frequency range from 0.1 Hz to 100 kHz to the working electrode immersed in PBS (10 mM Na2HPO4, 50 mM NaCl, pH 7) containing 2 mM
The structures of bare, AuNP-coated and aptamer-coupled gold electrodes were analyzed by taking AFM (SPA300HV, SIINT, Japan) and SEM (JSM-7600F; JEOL, Tokyo, Japan) images to confirm the morphological changes on the electrode surfaces following electrochemical deposition of AuNPs and/or assembly of aptamers on the AuNPs.
Fabrication of aptamer/AuNP-based biosensor
An 86-mer aptamer exhibiting high, and specific, affinity to endotoxin was synthesized by Integrated DNA Technologies to have a disulfide modifier at its 5′-end. In order to render self-assembly of aptamer molecules on the gold surface, this aptamer was reduced by DTT and purified as described previously 21 to give 2.4 µM of thiolated aptamer in PBS on the basis of UV absorption at 260 nm.
The gold disk electrode was thoroughly polished and cleaned according to the protocol described elsewhere.22,26 A thin layer of AuNPs was deposited electrochemically on the gold surface by immersing the bare gold electrode in 0.5 M H2SO4 aqueous solution containing 10 mM HAuCl4 under −0.2 V potential applied against a Ag/AgCl reference electrode for 20 s. 27 Electrodepostion is a promising technique in preparing metal nanoparticle layers on the electrode surfaces with controlled size, shape and density by leveraging electrochemical potentials at the time of deposition.
The AuNP-coated electrode was dried and immersed immediately in the thiolated aptamer/PBS solutions for 3 h at room temperature (25℃) followed by 1 h incubation in 1 mM MCH aqueous solution for further blocking of the gold surface. 28 The modification process was recorded by EIS and CV. To explore an optimum condition for maximum coverage of the gold surface with aptamer molecules, the AuNP-coated electrodes were subjected to incubation in a series of PBS solutions with varying concentrations of aptamer, and EIS measurements were conducted every 10 min.
After determining the optimum aptamer concentration to give the maximum efficiency for coating AuNP surface, the effects of other factors (e.g. pH, conductivity and cation effect) on aptamer–endotoxin interaction were explored by EIS.
Performance of AuNP-based aptasensor on endotoxin detection
The performance of the aptamer/AuNP-coated electrode on endotoxin detection was evaluated using biomimetic cocktail solutions containing varying concentrations of endotoxin (0.005, 0.01, 0.04, 0.16, 0.64, 2.56 and 10.24 ng/ml) supplemented with several compounds interfering with endotoxin assay as follows: 100 ng/ml pDNA, 25 µg/ml RNA, 500 µg/ml BSA, 50 µg/ml Glc and 50 µg/ml sucrose. Those biomolecules are often found in biological liqors where endotoxin is likely to exist. 21
Results and discussion
Electrochemical deposition of gold nanoparticles
A bare gold electrode subjected to repeated voltammetric cycling in 0.5 M H2SO4 solution showed stable currents and invariant reduction peaks, which is a good signature for a clean and uniform surface.
29
Following electrochemical deposition of gold nanoparticles, the reduction peak corresponding to the AuNP-coated electrode showed a significant increase, indicative of a larger surface area afforded by the AuNPs deposited on the bare gold electrode (Figure 2).
The cyclic voltammograms for gold electrodes in 0.5 M H2SO4 at a rate of 100 mV/s before (solid line) and after (dot line) deposition of the gold nanoparticles.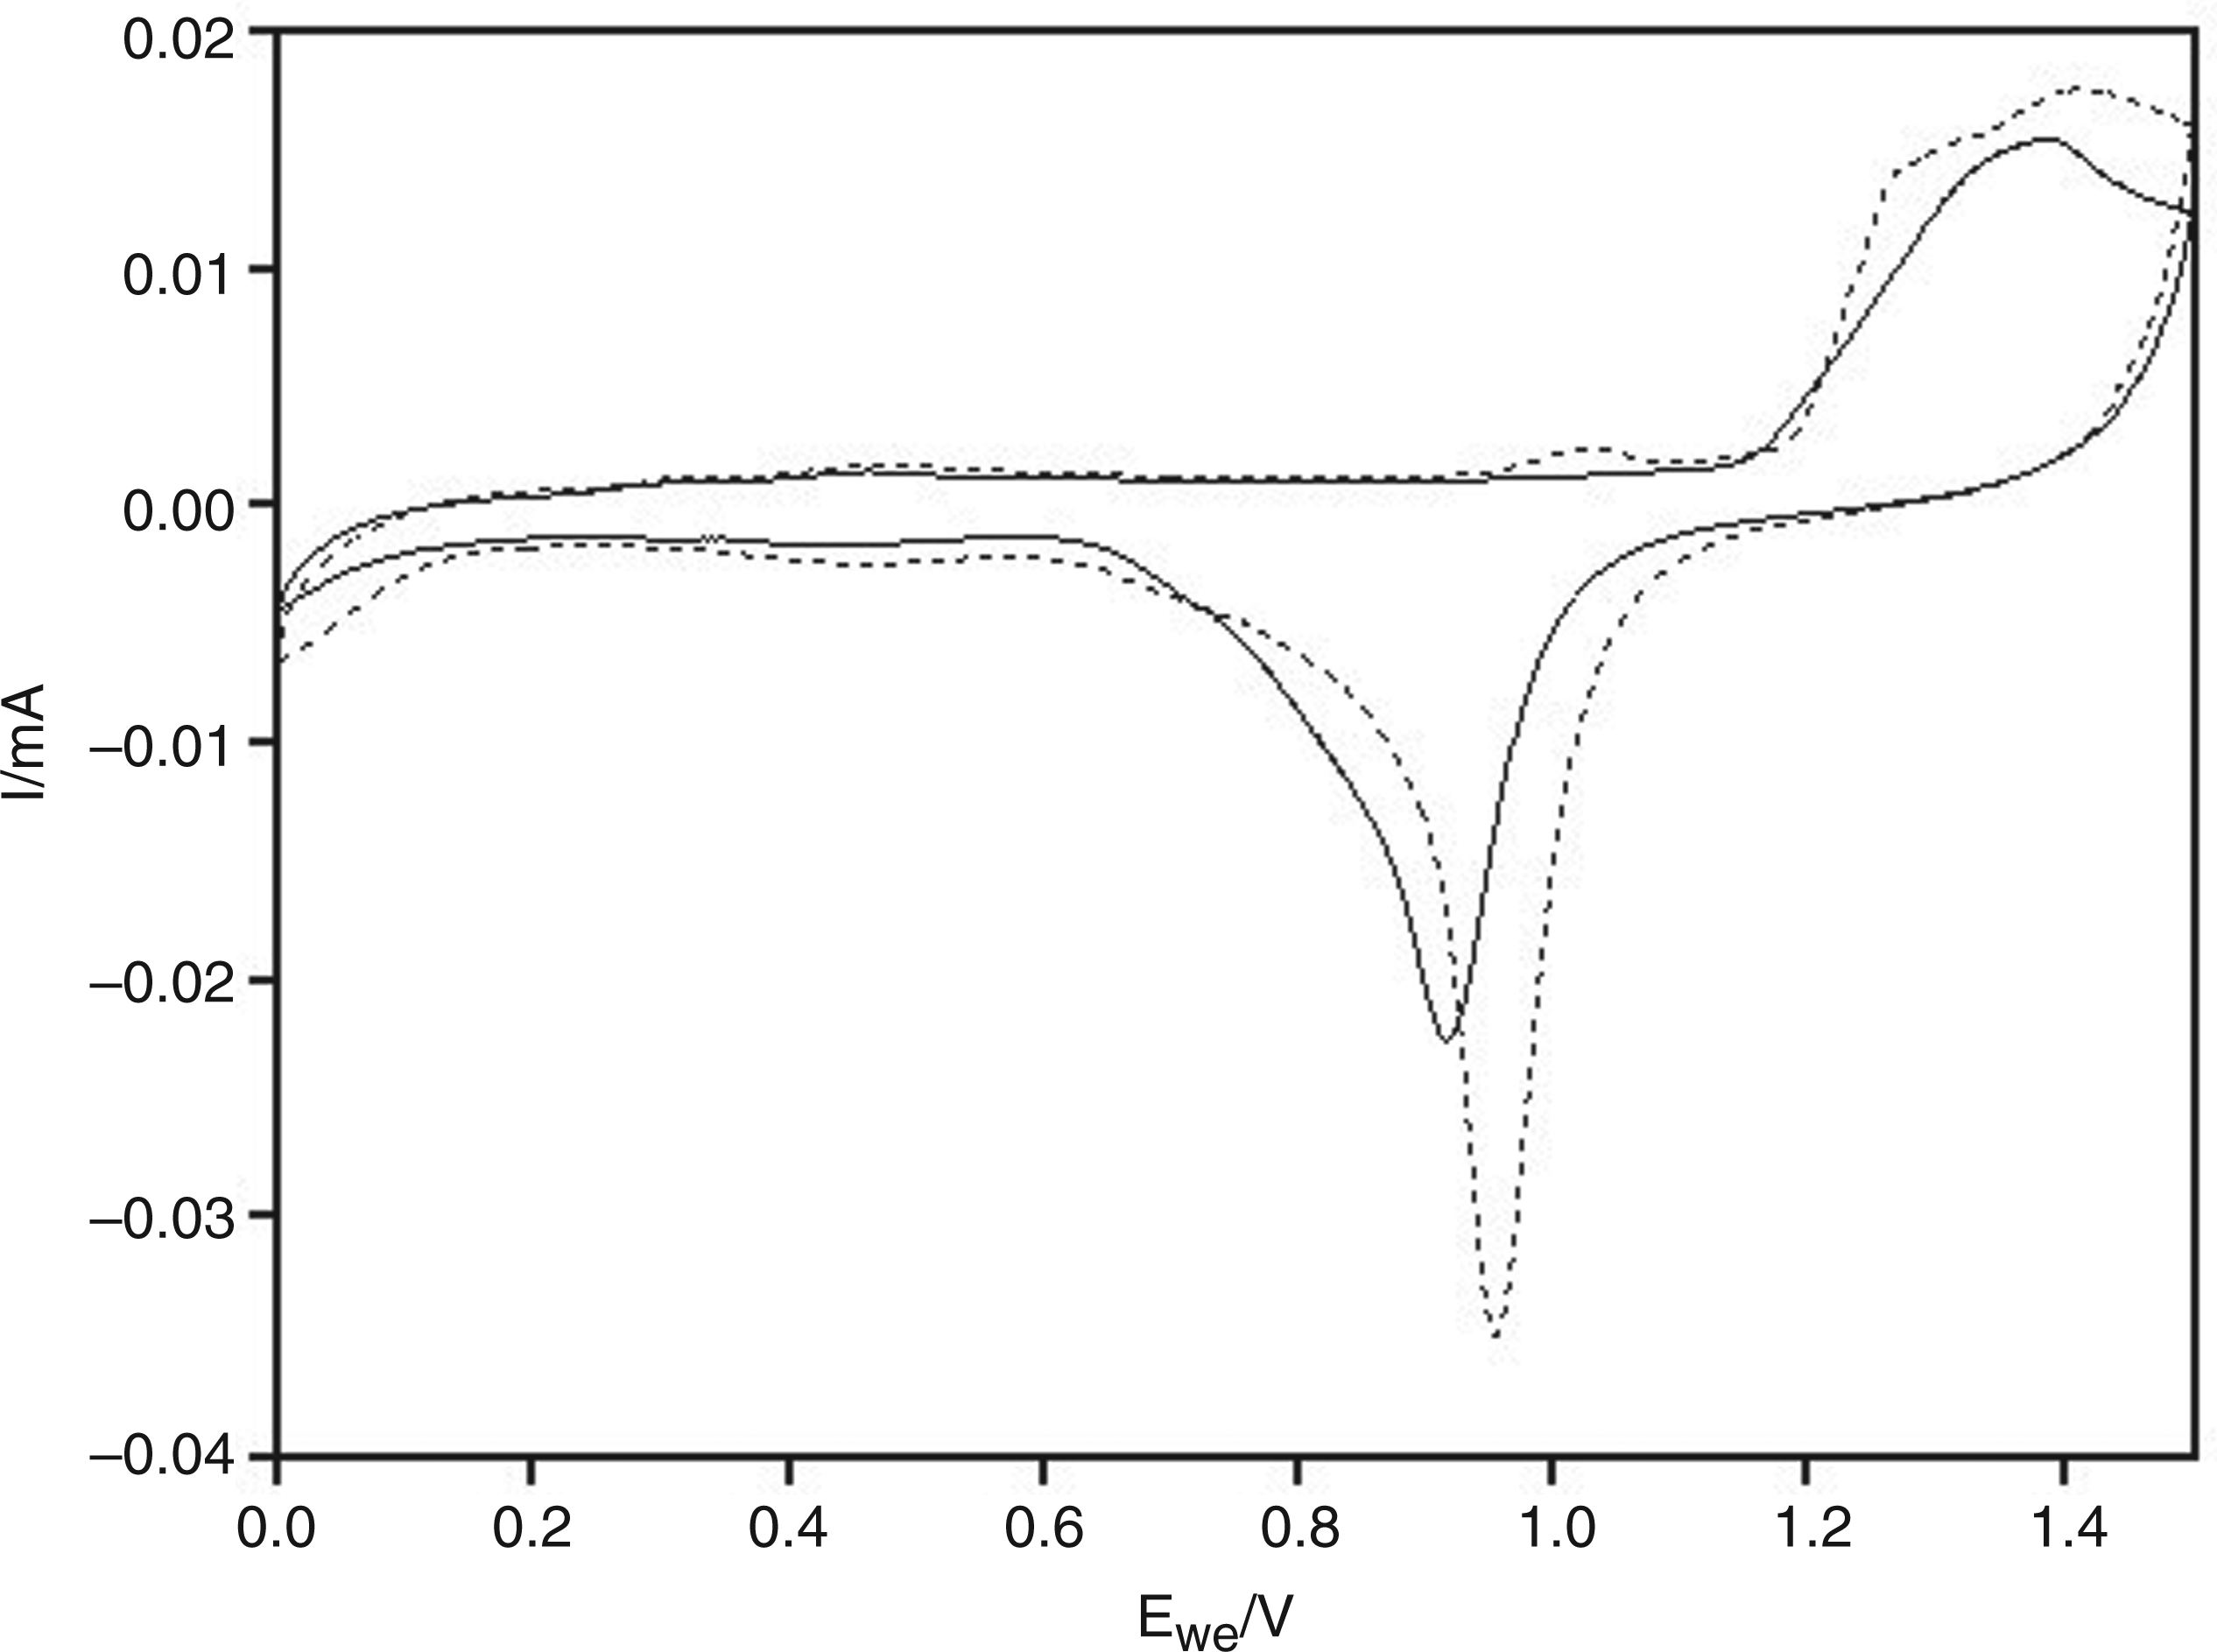
The morphology of the AuNP-coated gold electrode was studied by SEM and AFM images (Figure 3). Compared with the SEM image of the bare gold (Figure 3A), it is clear that the electrode surface was completely covered through the electrochemical deposition process with the oblate gold nanoparticles (Figure 3B). Most of them stood on the surface, with an average diameter of 200 nm. The AFM images provide more detailed information on the electrodeposited AuNPs. Figure 3C shows the morphology of the bare gold surface with a root-mean-square (RMS) roughness of 11.12 nm. After electrodeposition of AuNPs, the RMS roughness of this formed surface was found to increase to 25.13 nm (Figure 3D) owing to the formation of the relatively uniform granular structure arising from AuNPs. The properties of metal nanoparticles, departing from bulk materials, are highly dependent on their size, shape and distribution, which are, in turn, closely affected by electrochemical deposition milieu (e.g. period, applied potential, electrolyte component).
30
Scanning electron microscope (SEM) (A and B) and atomic force microscope (AFM) (C, D and E) images for the bare (A and C), AuNP-coated (B and D) and aptamer/AuNP-coated (E) gold electrodes.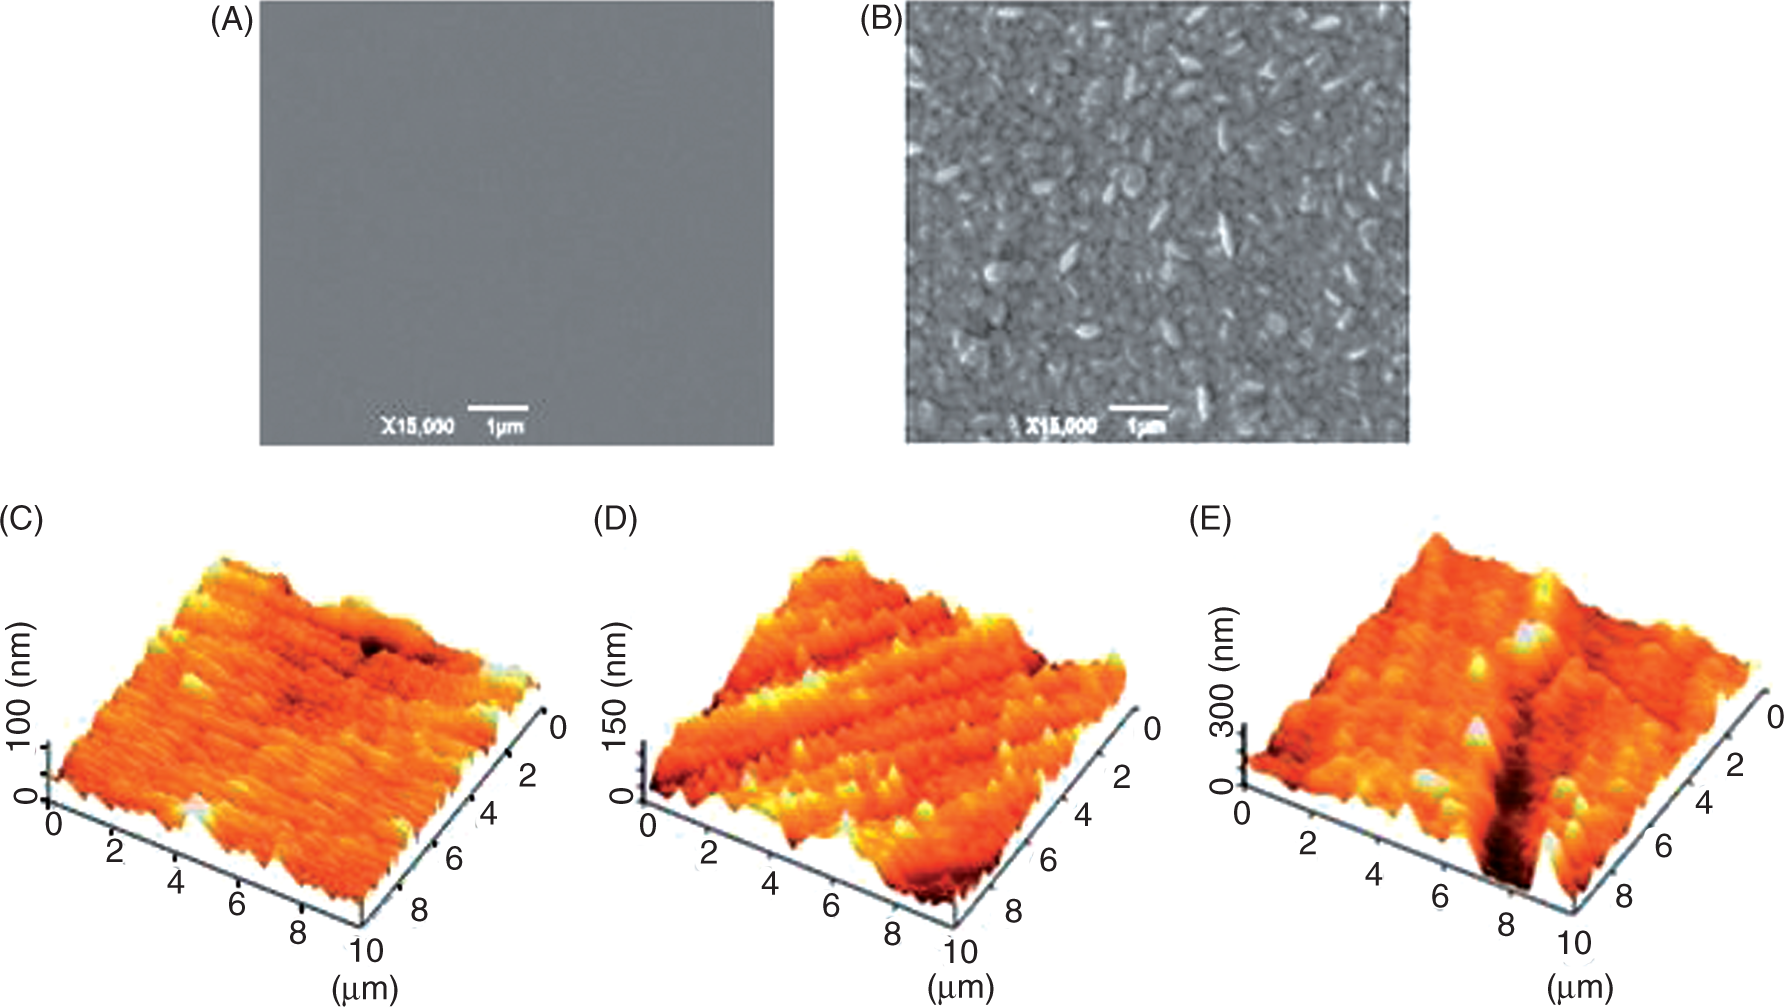
Figure 3E depicts the surface morphology of the AuNP-covered electrode after its immersion in aptamer/PBS solution. The gold nanoparticles wrapped with thiolated aptamer molecules were found to have a size distribution ranging from 300 nm to 500 nm, 1.5–2.5 times larger than the naked ones (i.e. 200 nm). The increased RMS roughness (47.1 nm) accounted for the adherence of the self-assembled aptamer molecules on the particle surface.
Preparation of aptasensors
EIS is a powerful analysis technique used to describe the physicochemical changes at the interface (i.e. between bulk solution and solid electrode) arising from the formation of insulating films incurred by interaction of the analytes with their probing molecules immobilized on electrode surfaces. By assessing the corresponding impedance increases [e.g. electron transfer resistance (Ret)] for transport of electrolytes across the interfacial layer, EIS provides a rapid, sensitive and nondestructive platform to detect various analytes, including biomolecules that would otherwise be difficult to quantify.
The impedance data are usually expressed as Nyquist plots (Zim vs Zre) or Bode plots [Log|Z| and θ (phase shift) vs frequency]. Typical Nyquist plots consist of a semicircle in the high frequency region representative of electron transfer limited process and a straight line in the low frequency region associated with diffusion controlled process. In this study, a modified mixed control model with a constant phase element [Figure 4 (inset)],
31
instead of the ideal element, was used to interpret the obtained impedance spectra because of the microscopic roughness and atomic scale inhomogeneity of the modified electrode surface.
Nyquist plots for electrochemical impedance spectroscopy (EIS) data collected from the bare or modified gold electrodes following corresponding modifications. Each curve represents the EIS response for (a) bare Au, (b) AuNP-coated, (c) aptamer/AuNP-coated and (d) 6-mercapto-1-hexanol (MCH)-blocked aptamer/AuNP-coated electrode immersed in 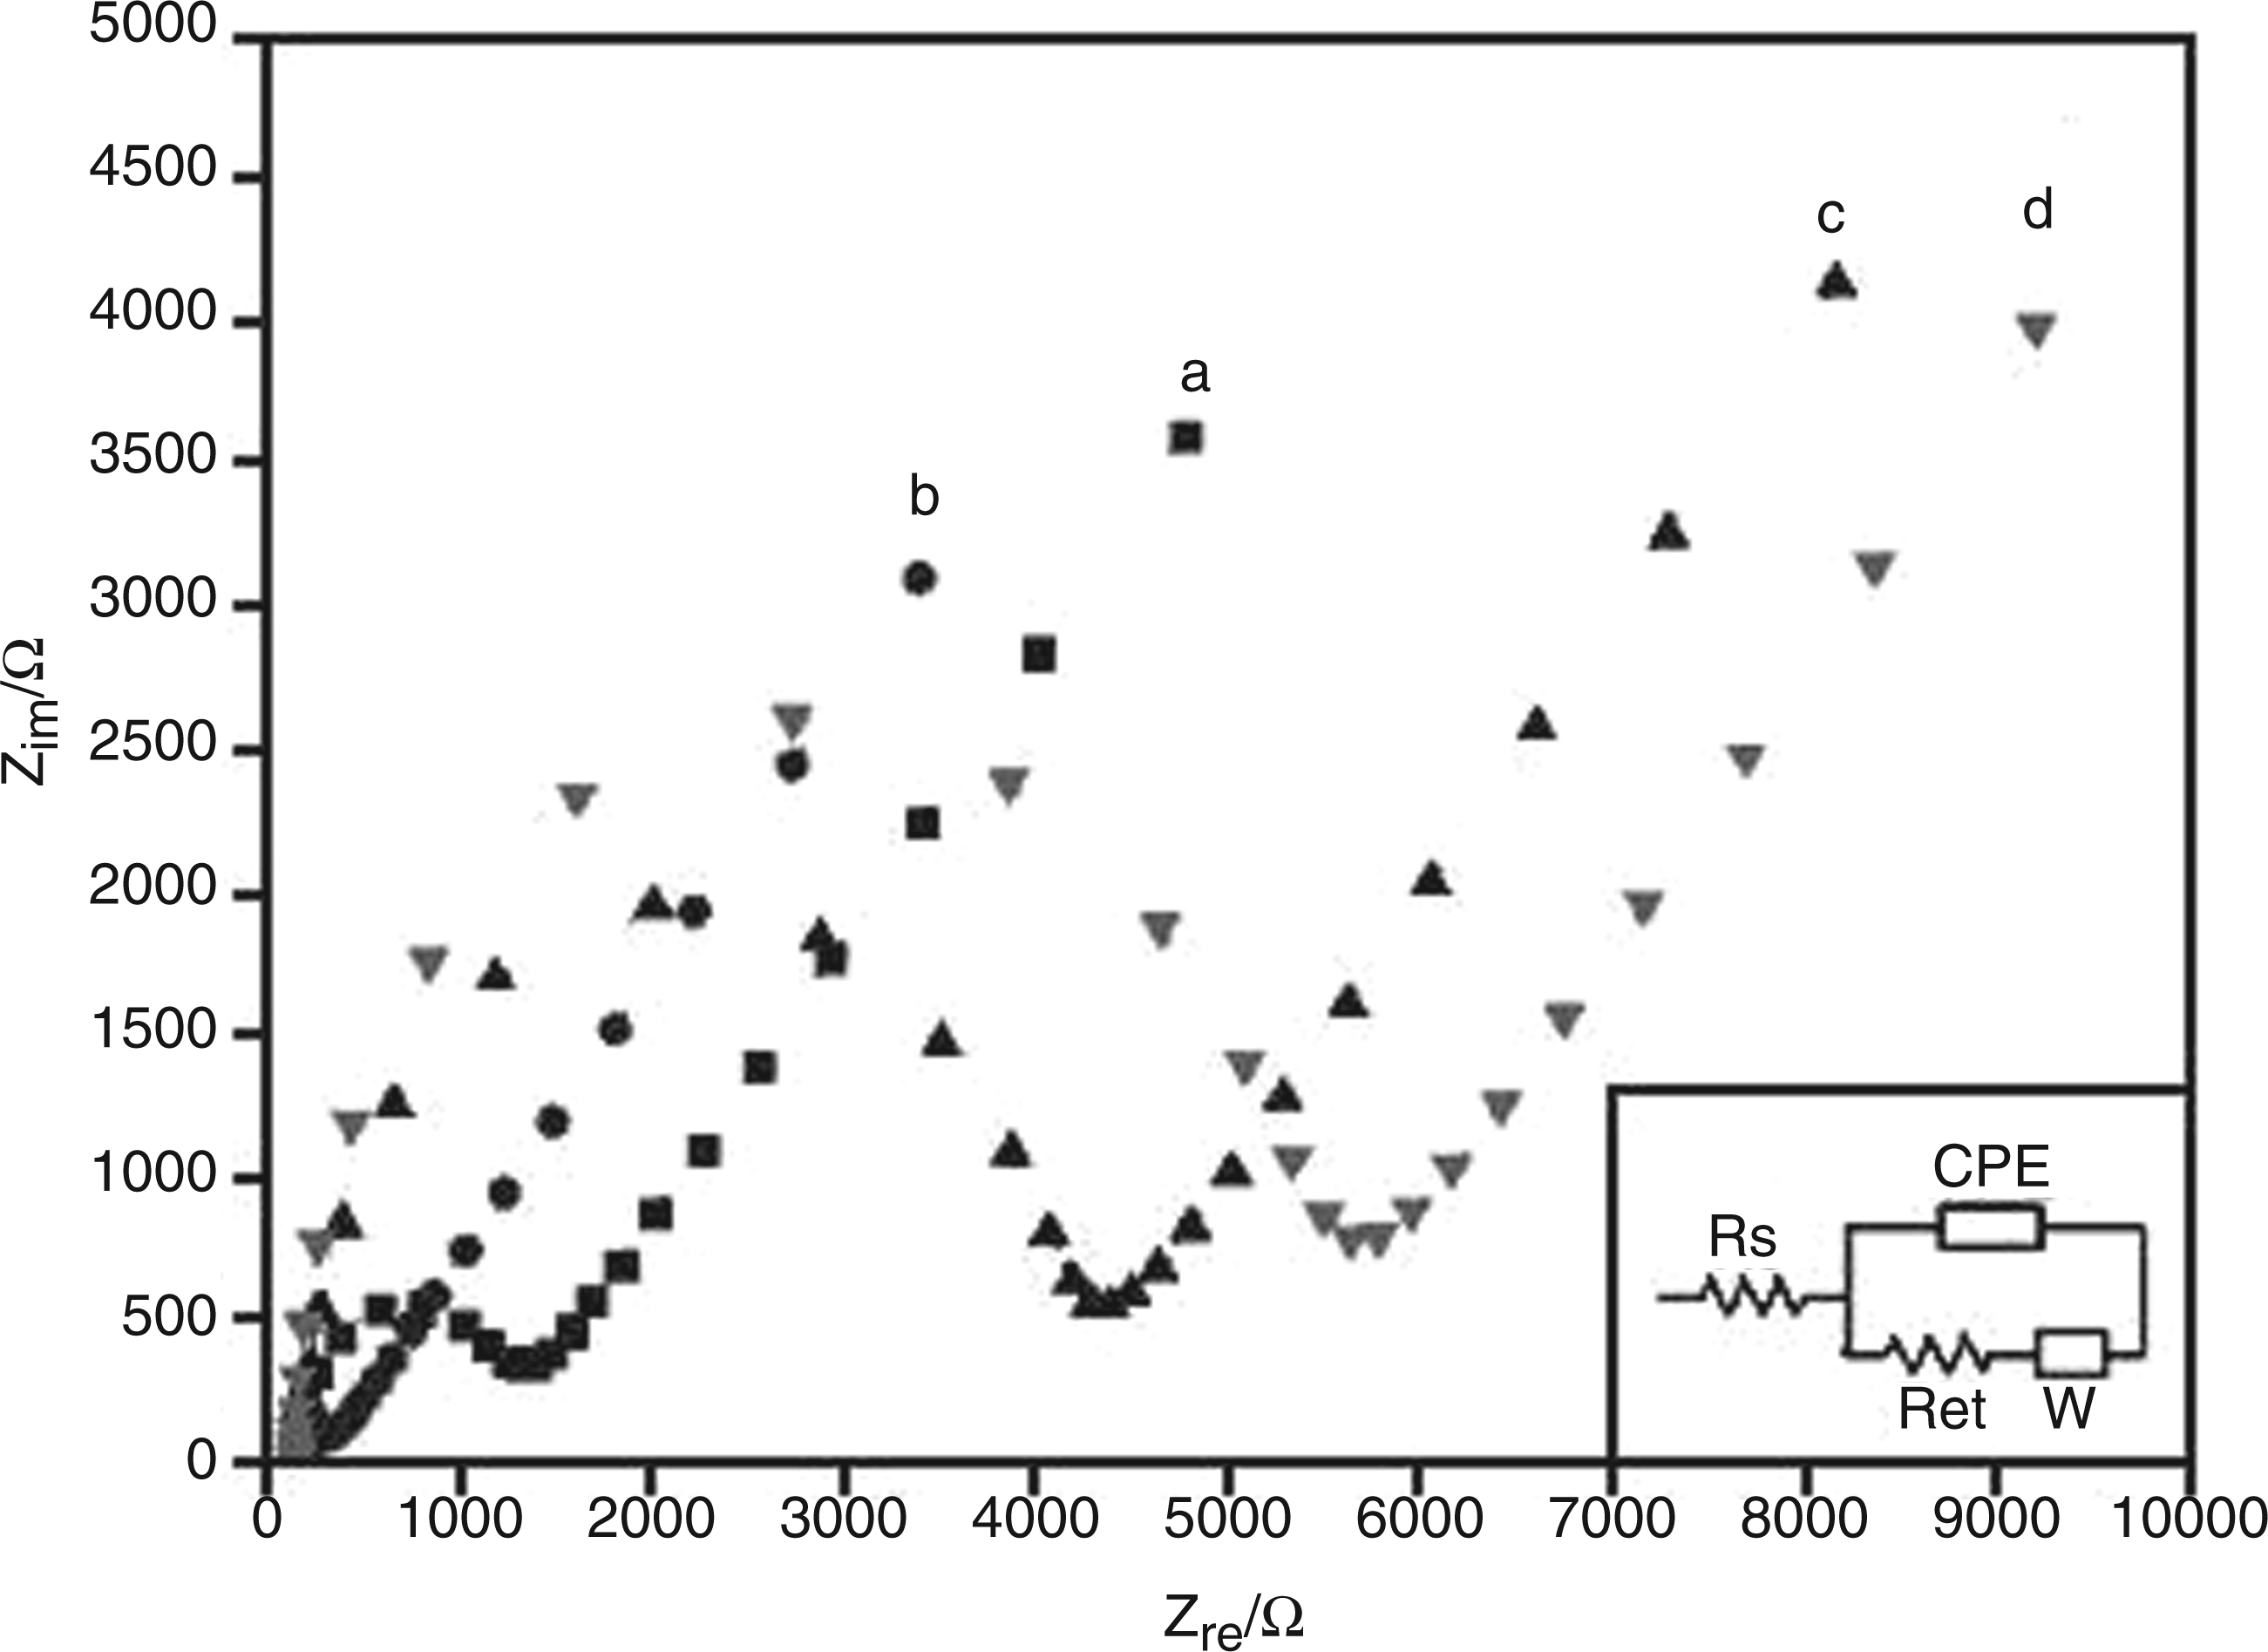
The bare gold electrode showed a small semicircle (Figure 4, curve a) in the high frequency region with a calculated Ret value of 1042 Ω/cm2. Following electrochemical deposition of AuNPs, the Nyquist plot for EIS spectra obtained from the AuNP-coated electrode corresponded to an almost straight line with a negligible semicircle shown in the very high frequency region (Figure 4, curve b), with a calculated Ret value of 150 Ω/cm2. This demonstrates that the presence of AuNPs on the electrode played an important role in reducing the surface resistance, 32 thereby providing a more effective platform for development of the aptasensor. The Nyquist plot for the electrode where thiolated aptamer molecules were conjugated to AuNPs exhibited a distinctive semicircle (Figure 4, curve c), indicative of the increased Ret due to a successful assembly of an aptamer layer on the electrode. As single-stranded aptamer molecules contain numerous negatively-charged phosphate groups, 33 they are likely to act as a barrier for restricting access of the anionic electrolyte (i.e. [Fe(CN)6]3-/4-) to the electrode surface. This accounted for the increase in Ret for the aptamer/AuNP-coated electrode. The larger semicircle (Figure 4, curve d), indicative of further increase in Ret, arose from formation of a mixed layer comprising aptamer and MCH molecules. The incorporation of MCH molecules to the mixed layer enhanced its insulating capability by further restricting migration of the electrolyte to the electrode. MCH molecules used in this study played a dual role as (i) a blocker to minimize exposed bare gold surface and (ii) a spacer to dislocate nonspecifically adsorbed aptamer molecules from the electrode surface. 34 Besides, MCH molecules rendered topologically-driven surface spread aptamer molecules to stand in an axial direction, giving rise to a tightly packed aptamer/MCH mixed layer which would be more conducive to reaching target analytes. 28
Optimization of aptasensor performance
The concentration of aptamer at the time of aptasensor fabrication is likely to affect the density and morphology of an aptamer layer and the time required for layer formation. Formation of a high density layer with few defects is important for maximizing biosensor performance. Therefore, PBS (10 mM, pH 7, 50 mM NaCl) solutions containing aptamers at varying concentrations from 1 nM to 500 nM were used to explore the conditions for maximizing coverage of the AuNP surface with aptamer molecules with an EIS measurement every 10 min until no further change in Ret was observed.
It is reported that formation of a self-assembled monolayer (SAM) occurs largely in two stages.
26
In the first stage, a SAM forms rapidly prior to reaching close proximity to equilibrium surface coverage, which changes little with prolonged incubation in the second stage.
33
The first stage normally corresponds to the adsorption of molecules onto the surface in a topologically-favored orientation, while the second stage is due to the rearrangement of the adsorbed molecules to upright configurations, leading to formation of a more closely-packed monolayer.
35
Figure 5A showed maximum Ret (Retmax) values and the time required to reach them for individual AuNP-coated electrodes incubated with varying concentrations of aptamer in PBS. Higher aptamer coverage on the AuNP-coated electrode was represented by a larger Ret value. A Retmax was observed for each electrode incubated with a predetermined concentration of aptamer solution, despite the concentration-dependent difference in incubation time for achieving the Retmax. The time required to reach a Retmax was inversely proportional to aptamer concentration. At aptamer concentrations higher than 100 nM, no further increase in Retmax was observed, despite faster saturation of the electrode surface with the increase in aptamer concentrations, indicating that all the adsorption sites on the electrode were fully occupied at an aptamer concentration of 100 nM or above. The density of aptamer molecules immobilized on the AuNP-coated electrode surface at a Retmax was found to be 14 ng/mm2 by QCM analysis (data not shown), seven times higher compared with the case where bare gold electrodes without electrodeposited AuNPs were used.
1
Based on these results, all the AuNP-coated electrodes used in this study were prepared by incubating the electrodes in 100 nM aptamer/PBS (10 mM, pH 7, 50 mM NaCl) solution for 3 h at room temperature unless otherwise stated.
(A) The effect of aptamer concentration on fabrication of aptamer-conjugated AuNP-coated electrode. (B) The effect of pH on the interaction between aptamer and endotoxin. (C) The effect of ion strength and Mg2+ on the interaction between aptamer and endotoxin (curve 1: detection of 1 ng/ml LPS in PBS containing NaCl from 10, 20, 50, 100, 150, 200 to 300 mM; curve 2: detection of 1 ng/ml LPS in PBS containing MgCl2 from 1, 3, 5, 7, 10, 15, 20, to 30 mM).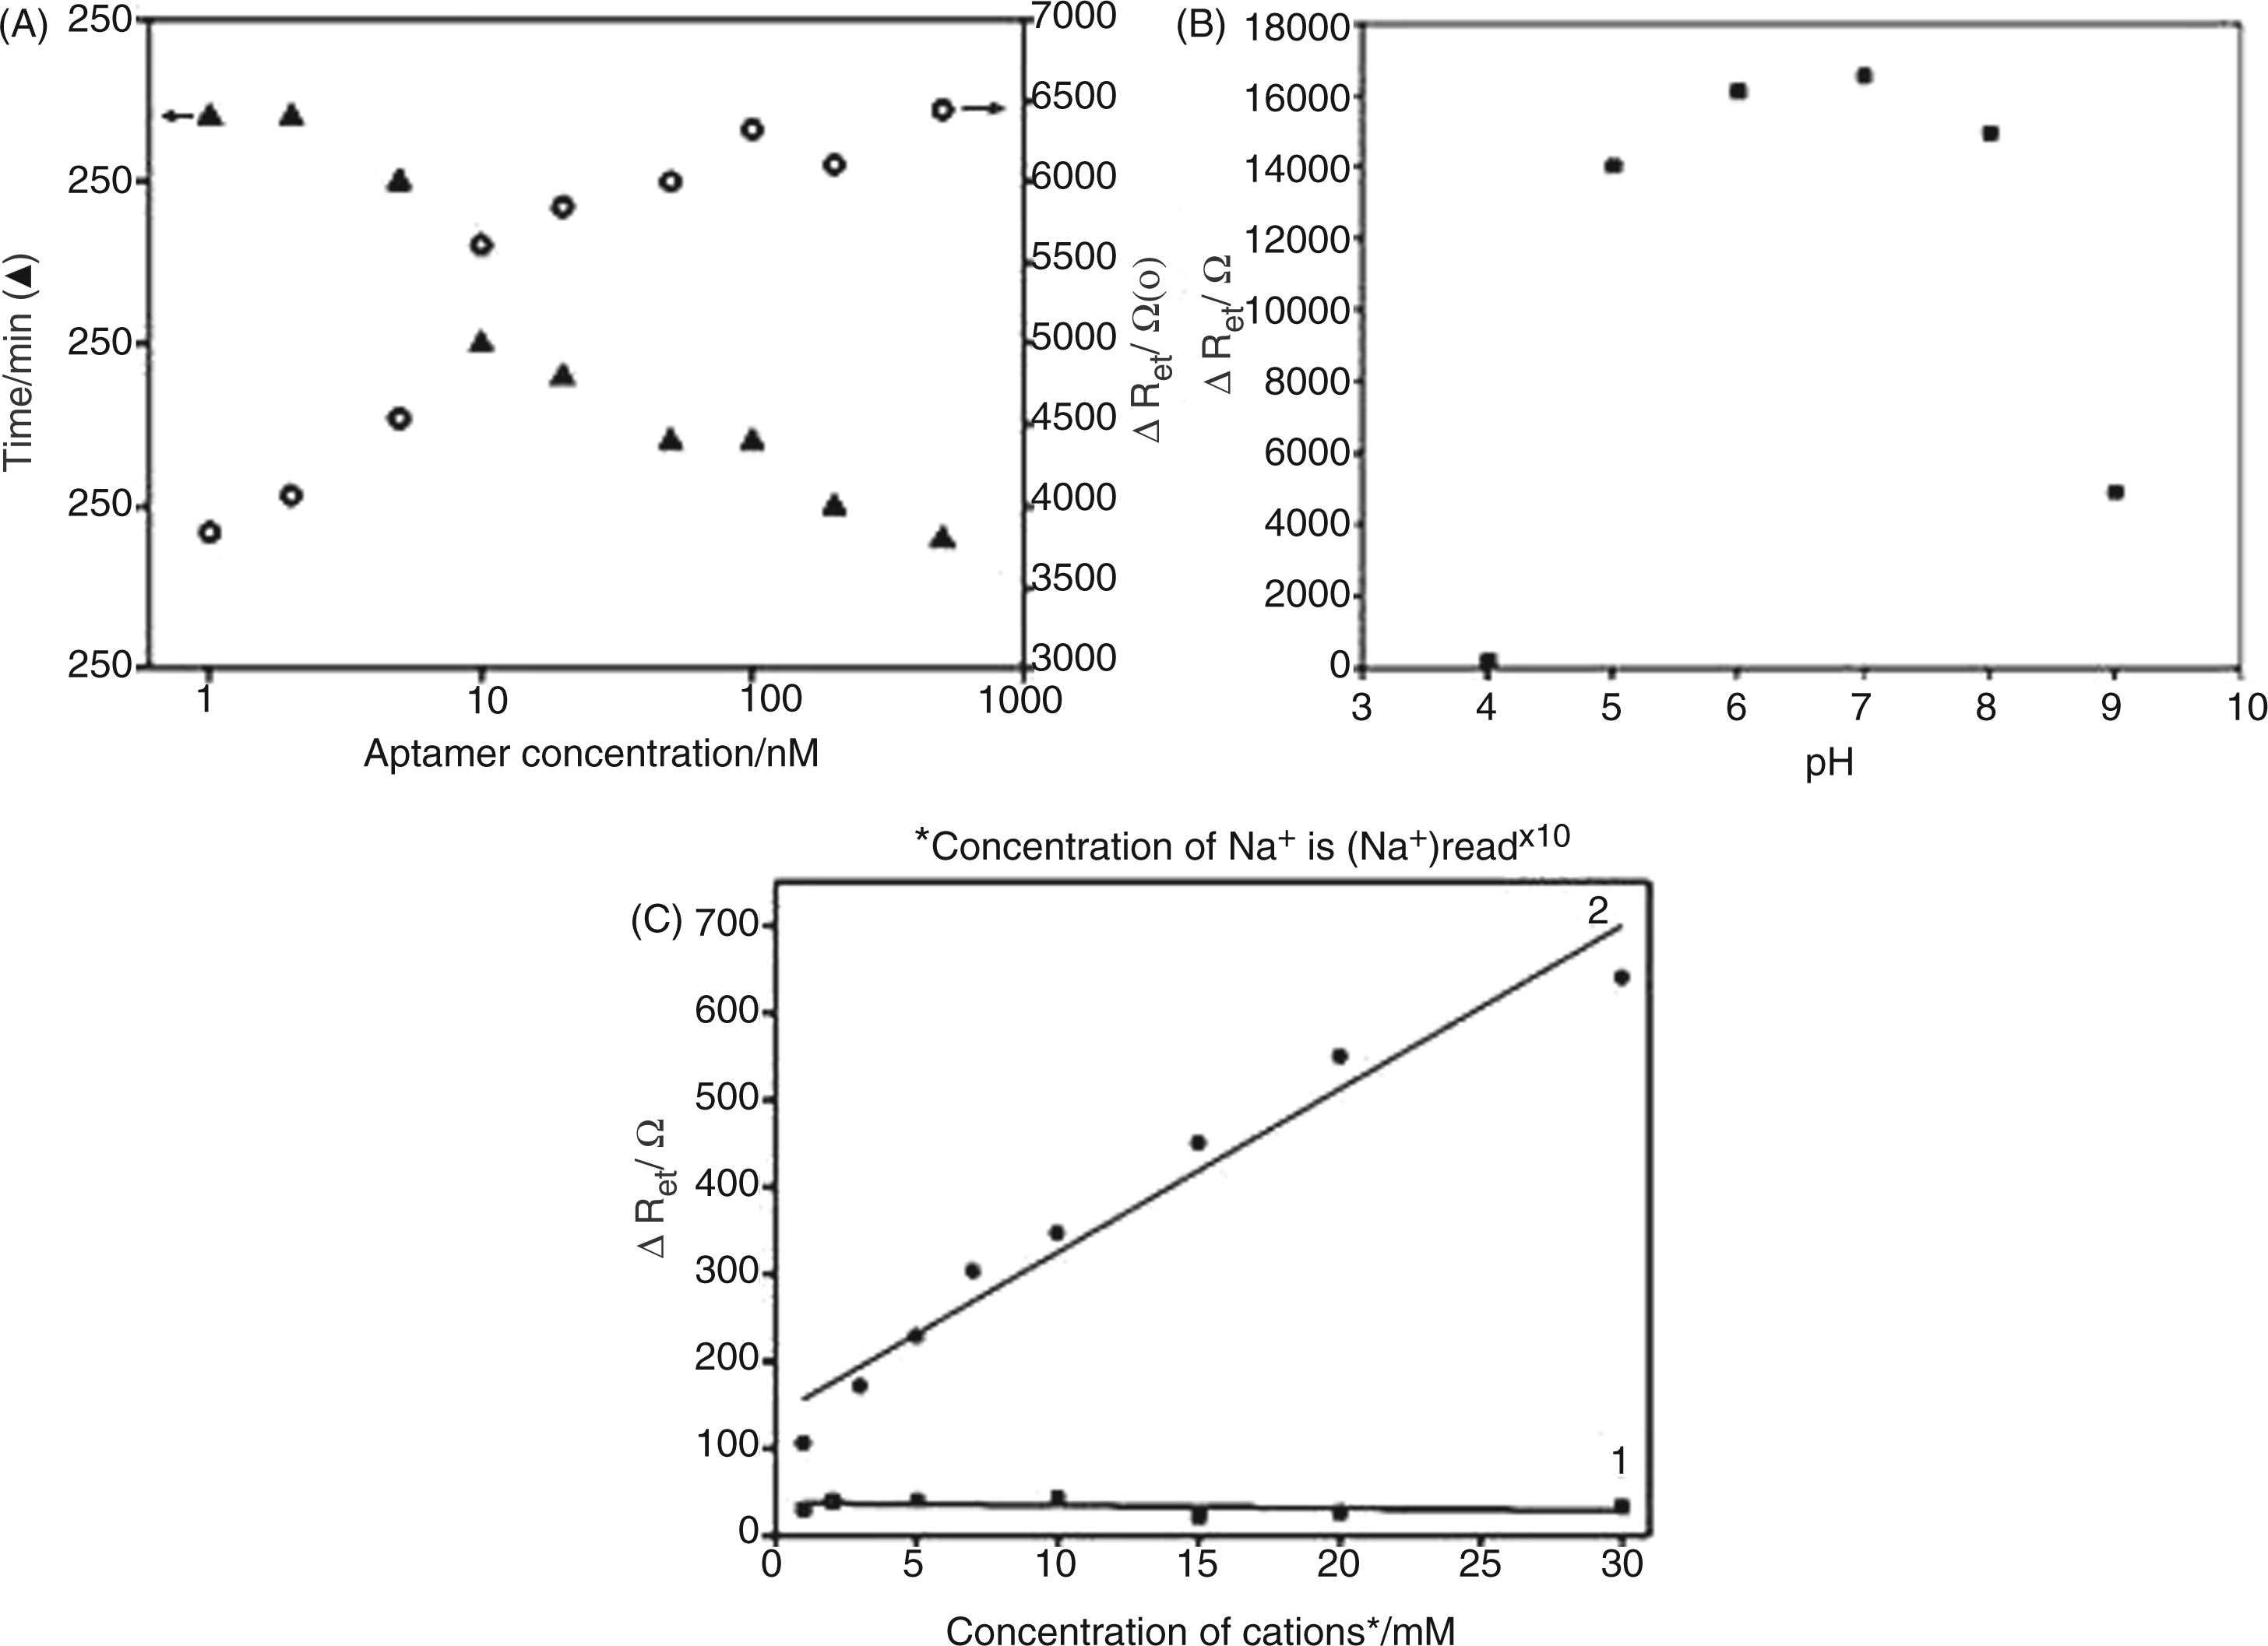
The pH value is one of the important factors that affect the responses of biosensors to their analytes. Particularly for negatively-charged ssDNA aptamers, highly acidic or alkaline surroundings would damage the immobilized aptamers or affect the interaction between aptamers and their targets. 22 In order to find an optimum pH for detection of endotoxin by our aptasensor, the Ret response for the interaction of endotoxin with AuNP-conjugated aptamer molecules was studied in a pH range from 4 to 9 in the presence of 0.1 ng/ml of endotoxin in PBS (10 mM, 50 mM NaCl). As shown in Figure 5B, the aptasenor showed a highly pH-dependent Ret response against endotoxin with a Retmax at pH 7. Following confirmation of the pH-dependent aptasensor performance, all the endotoxin measurements by EIS were conducted in PBS (10 mM, 50 mM NaCl) at pH 7 to ensure the aptasensor to operate at its maximum sensitivity.
Electrostatic interaction has been reported as a critical driving force for directly affecting association and/or dissociation of aptamers with their targets.
36
For example, recognition of both
For further study, different concentrations of divalent cations (i.e. Mg2+) were involved to investigate their effect on the interaction between aptamer and LPS. The modified electrode was incubated in 1 ng/ml LPS in 10 mM PBS (10 mM, pH 7, 50 mM NaCl) containing Mg2+ from 1 to 20 mM. In contrast to Na+, the introduction of a small amount of Mg2+ produced an obvious increase in Ret (Figure 5C, curve 2), indicating an enhanced affinity of aptamer to LPS. Mg2+ was known to stabilize the aptamer’s secondary structure, 38 , which is favorable to aptamer–LPS binding. The presence of more Mg2+ cations would be preferable to aptamers to stabilize their secondary structure.
Assessment of endotoxin detection efficiency by aptasensor
Electrochemical responses arising from aptamer–endotoxin interaction were probed directly and quantified by EIS. Diameters of the semicircles in a Nyquist plot, representative of the extent of Ret due to formation of endotoxin–aptamer complex were found to increase proportionally with the increase in endotoxin concentration in PBS (10 mM, pH 7, 50 mM NaCl). The change in Ret (ΔRet) in Figure 6A showed a good linear relationship with the logarithmic values of the endotoxin concentrations from 0.01 ng/ml to 10.24 ng/ml, with R2 close to 0.99 (Figure 6). From Figure 6B it is clear that the aptamer/AuNP-coated electrodes showed significantly increased ΔRet for a broad range of endotoxin concentrations (curve 1) compared with the endotoxin concentration vs ΔRet profile (curve 2) demonstrated by the aptasensor with aptamer molecules directly immobilized on bare gold electrodes.
21
This is due to a larger surface area produced by AuNPs, which allowed more aptamer molecules to be immobilized on the sensor surface. The effective area covered by the target recognition elements has been reported to critically affect the sensitivity and detection limit of biosensors.
8
The electrochemically deposited AuNP matrix was known to provide a biocompatible micro-environment conducive to stable anchorage of thiol-terminated aptamer molecules and maintenance of their bioactivity to interact specifically with their targets.
12
In addition to providing the enhanced effective surface area for immobilization of probe molecules, AuNPs also worked as signal transducers and/or amplifiers.
13
The quantum size effects arising from presence of numerous nanoparticles have been reported to promote the electron transport process by efficiently collecting and releasing electrons to the electrodes.
39
(A) Nyquist plots for electrochemical impedance (EIS) data collected from the aptamer/AuNP-coated electrodes following 10 min incubation in 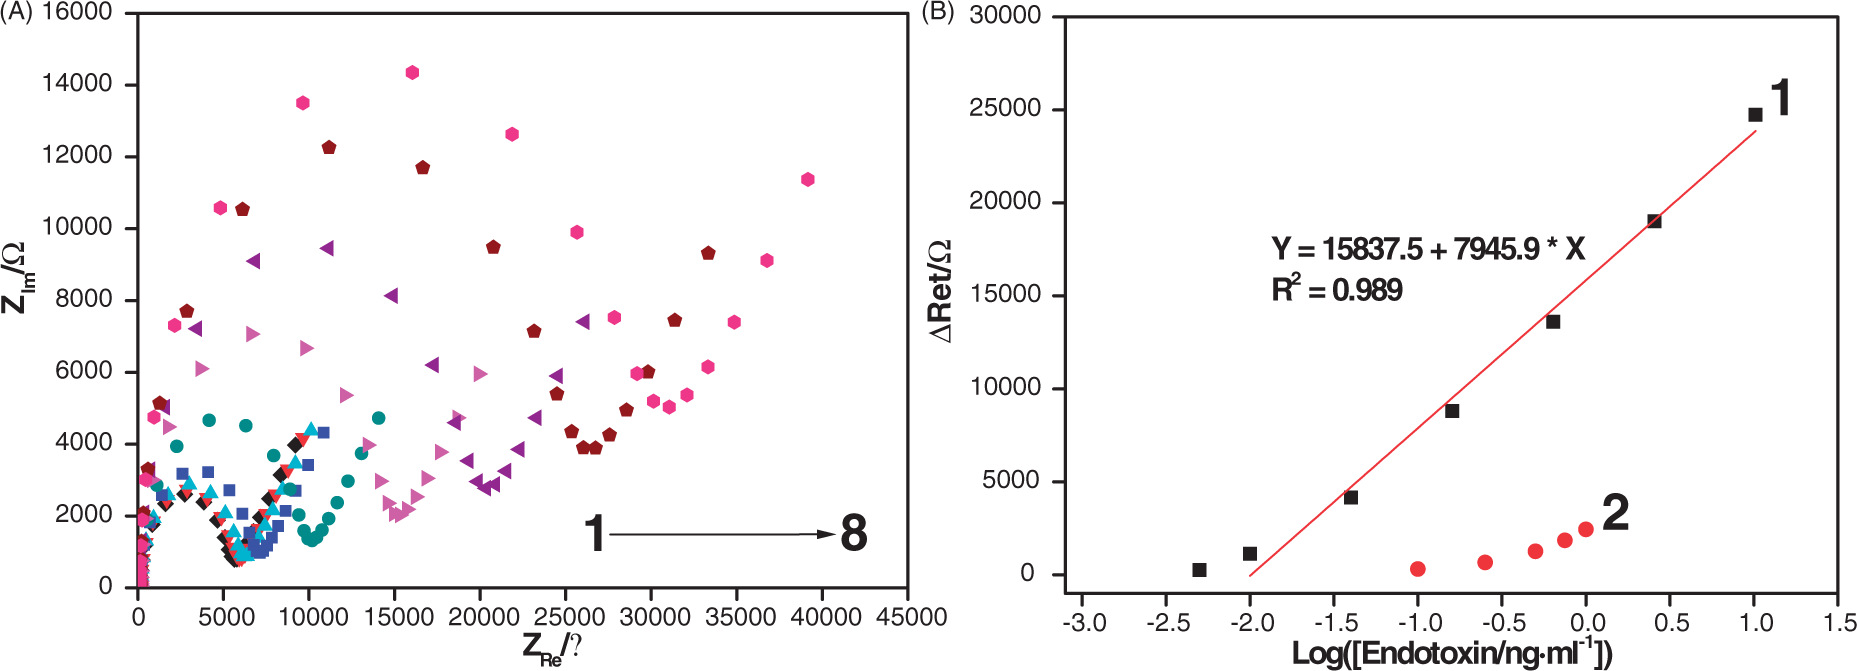
Nyquist plots have a major shortcoming because of their limitation in providing clear information on the frequency range where the data are collected. Moreover, determination of the value for each circuit element (e.g. Ret, a typical sensing signal for a majority of impedance biosensors) is dependent on the choice of a corresponding equivalent circuit model. In contrast to the complicated data analysis process required for EIS responses expressed in Nyquist plots, the Bode plots shown in Figure 7 provided a more intuitive interpretation of sensing signals from the aptasensors by comparing the log|Z| values recorded at a selected frequency of 1 Hz. The log|Z|@1 Hz values (Figure 7B, curve 1) were found to increase linearly with endotoxin concentrations from 0.01 ng/ml to 10.24 ng/ml. The superiority of the developed aptasensor in this study is clear in view of the broad linear dynamic detection range and the lower limit of detection compared with those exhibited by the aptasensor (Figure 7B, curve 2) lacking electrodeposited AuNP matrix.
21
(A) Bode plots for EIS data collected from the aptamer/AuNP-coated electrodes following 10 min incubation in 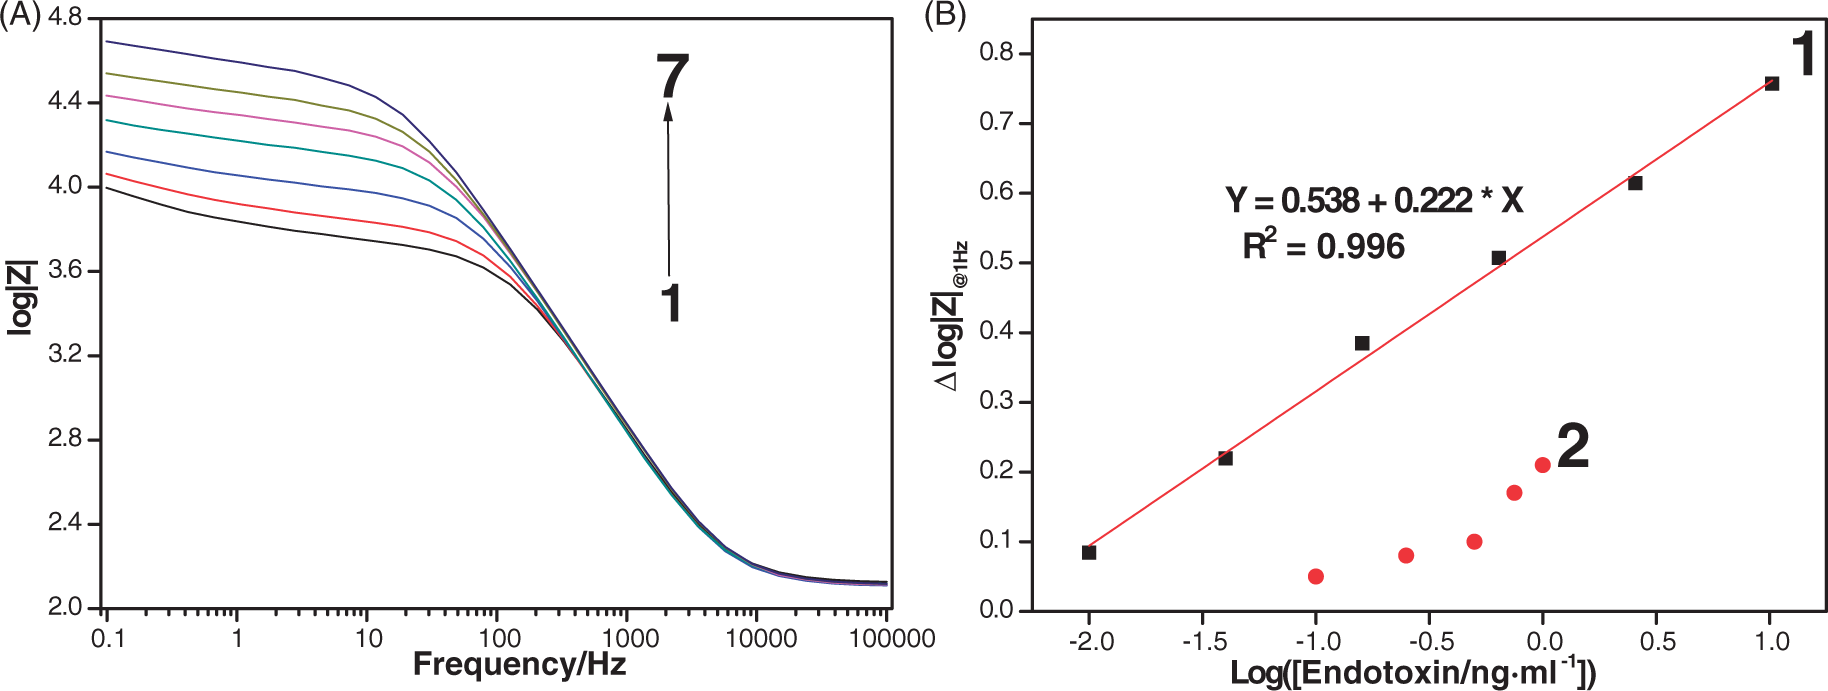
Conclusions
In this study, a successful fabrication of an endotoxin-detecting impedance aptasensor with electrodeposited AuNPs was demonstrated with exploration of critical factors capable of affecting the sensor performance (i.e. a maximum aptamer probe coverage and pH). The developed aptasensor showed a good sensitivity of detecting endotoxin levels as low as 0.005 ng/ml (i.e. 0.0025 EU/ml) with a broad linear dynamic detection range between 0.01 ng/ml and 10.24 ng/ml (i.e. 0.005–5.12 EU/ml) comparable with that (0.01–5 EU/ml) of the traditional LAL assay. In addition, the demonstrated aptasensor was very specific in selectively capturing endotoxin as its performance was achieved in a complicated milieu crowded with pDNA, RNA, BSA, glucose and sucrose, which have often been reported to interfere with conventional endotoxin assays. The fast detection time of the developed aptasensor (i.e. 10 min compared with >1h for the LAL assay) further highlighted its merits. Finally, departing from a majority of impedance biosensors where complicated EIS data interpretation procedures using Nyquist plots and equivalent circuit models were required, our aptasensor provided an intuitive simplified procedure for assessing endotoxin concentration with the use of log |Z|@1 Hz values from Bode plots.
Footnotes
Funding
This research was supported by Basic Science Research Program through the National Research Foundation of Korea (NRF) funded by the Ministry of Education, Science and Technology (2009-0083540) and by Ministry of Education, Science and Technology of Korea (grant no. 2012-002285).