
Abstract
We showed recently that repeated oral exposure to LPS stimulated humoral immune responses in periparturient dairy cows. Here, metabolic and mineral responses to repeated oral administration of LPS were investigated. Sixteen clinically healthy, pregnant Holstein cows were orally administered 3 ml of saline solution (control) or 3 ml of saline solution containing 3 increasing doses of LPS, at 07:00 h, as follows: (i) 0.01 µg/kg body mass (BM) on d −14 and −10, (ii) 0.05 µg/kg BM on d −7 and −3, and (iii) 0.1 µg/kg BM on d 3 and 7 relative to parturition. Blood samples were measured shortly before, and at 8 different time-points after (up to 6 h), the first challenge of each LPS dosage to evaluate the post-challenge plasma profile, as well as weekly up to 4 wk postpartum. Results showed that oral administration of LPS lowered concentrations of non-esterified fatty acids (P < 0.01) and β-hydroxy-butyrate (P < 0.01) in the plasma, particularly after the third LPS challenge. Also, after the third oral LPS challenge, treatment tended to increase plasma glucose. Plasma calcium did not change, but concentrations of insulin (P < 0.01) and zinc (P < 0.01) were greater, while that of copper was lower (P < 0.01) in the plasma of treated cows. This is the first report to indicate a potential role for repeated oral administration of LPS around parturition to modulate the profile of plasma metabolites and minerals postpartum.
Introduction
Endotoxin tolerance is a well-described in vivo phenomenon that results from sustained exposure to sub-lethal doses of LPS. Tolerant animals commonly experience a reduced inflammatory response to subsequent exposure to LPS owing to a decreased production of pro-inflammatory mediators 1 and, later, also a better humoral response with specific Abs against LPS.2,3 Although endotoxin tolerance and its clinical relevance are not fully understood, endotoxin challenge models have been used frequently in cattle to investigate the effects of endotoxin on metabolism4–6 and immune responses.6,7
An increasing body of evidence indicates that parenteral administration of LPS causes perturbations in various metabolic pathways, related to host responses against LPS. For example, single or multiple intravenous administration of LPS modifies the concentration of multiple plasma variables, including non-esterified fatty acid (NEFA) and β-hydroxy butyric acid (BHBA) in cattle.4,6,8,9 Infusion of LPS to heifers results in a biphasic response of plasma glucose with an initial peak and a latter decline. 9 The same study also reports increased concentration of lactate and a short-term increase in the concentration of cortisol in the plasma. 9 Additionally, the infusion of LPS triggers alterations in several plasma minerals, such as calcium (Ca), zinc (Zn) and copper (Cu).6,10
The route of LPS administration has also been shown to have an important role on the metabolic and immune responses to LPS challenge. For example, differently from the intravenous challenge, the metabolic responses to intramammary administration of LPS have not been consistent in cattle. One study observed no obvious effects, 11 whereas another study detected peaks of NEFA and cortisol in the plasma during the first 8 h post-treatment. 12 Most interestingly, a recent investigation showed that pretreatment of the udder with LPS elicited tolerance against Escherichia coli, with pretreated cows showing no leukopenia, and reduced systemic and local inflammation after the E. coli challenge. 13 Although an increasing number of investigations have studied parenteral responses of dairy cows or other experimental animals to LPS, to our best knowledge only a few studies have examined host responses to repeated mucosal oral exposure to LPS in livestock species.
Research in rodents has shown that repeated oral presentation of LPS protects mice from lethal effects of sepsis induced by cecal ligation and puncture. 14 We reported previously from the same study that repeated oral exposure to LPS stimulates humoral immune responses in periparturient dairy cows. 3 Therefore, we hypothesized that repeated oral exposure to increasing doses of LPS might modulate metabolic and mineral responses of dairy cows transitioning from close-up dry period to early lactation.
The main aim of the present investigation was to evaluate the metabolic and mineral responses of periparturient dairy cows to repeated oral administration of increasing doses of LPS. Multiple blood samples were collected shortly before, and at various time intervals after, the first administration of each LPS dosage to determine diurnal metabolic responses relative to LPS challenges. Measurements conducted up to 4 wk postpartum were also used to evaluate the effects of oral LPS challenge on plasma metabolites and minerals during the peripartal phase. Results of the immune and clinical variables, including the feed intake of the cows, are reported elsewhere. 3
Materials and methods
Animals, study design and treatments
Four primiparous and 12 multiparous (second to fifth parity) Holstein dairy cows at 14 d before the expected day of parturition were used in this study. All experimental procedures were approved by the University of Alberta Animal Care and Use Committee for Livestock, and animals were cared for in accordance with the guidelines of the Canadian Council on Animal Care. 15 Veterinary supervision was provided to the animals throughout the experiment. Cows were blocked by parity and the anticipated day of calving, and were allocated randomly to one of the two treatment groups, with eight cows each, according to a randomized block design. Details of the experimental setup, administration protocol of LPS, management of animals and diet descriptions are given in a companion article. 3 In brief, cows were orally administered 3 ml of saline solution (CTR) or 3 ml of saline solution containing 3 increasing doses of LPS (i.e. 3 LPS challenges) from E. coli 0111:B4 (Sigma-Aldrich Canada Ltd, Oakville, ON, Canada); each dose was administered twice, as follows: (i) 0.01 µg/kg body mass (BM) on d −14 and −10 (i.e. ranging between d −7 and −17 prepartum), (ii) 0.05 µg/kg BM on d −7 and −3 (i.e. ranging between d −2 and −10 prepartum), and 0.1 µg/kg BM on d +3 and +7 postpartum. The lowest dose of 0.01 µg/kg BM was chosen because previous experiments have shown minimal changes in the metabolism of dairy cows at this concentration, 3 whereas the highest dose was also selected owing to a maximum host response at this dose observed previously. 3 Animals were fed a total mixed ration at 08:00 h and milked twice daily in their stalls at 05:00 and 15:30 h.
Blood sampling
Before each LPS challenge, cows were moved to the maternity barn, adjacent to each other, and were then restrained in order to take blood samples from an intravenous catheter introduced into the jugular vein 1 h before sampling. Ten milliliters of blood was collected through a plastic syringe and poured gently into a tube containing Na-EDTA (Preanalytical Systems Beliver Industrial Estate, Plymouth, UK). Starting at approximately 07:00 h each time, blood was consecutively withdrawn from the catheters at −15, 15, 30, 60, 120, 180, 240, 300 and 360 min relative to the oral LPS challenge. Measurements of blood variables were conducted in multiple samples collected after the first challenge of each LPS dosage only (i.e. multiple samplings on d −14, −7, and 3 for doses of 0.01, 0.05 and 0.1 µg LPS/kg BM respectively), so that there were 3 sampling days in total to determine post-exposure diurnal metabolic responses. Our hypothesis was that the first challenge is stronger than the second challenge of the same LPS dosage and is therefore sufficient to evaluate potential post-challenge responses in the plasma. 6
Blood collected on d −14, −10, −7, −3, 3 and 7, as well as blood samples collected on d 14, 21 and 28 postpartum, always at the same time (07:00 h), were used to determine peripartal metabolic and mineral responses. Blood samples were immediately put on ice, centrifuged within 20 min (Rotanta 460 R, Hettrich Zentrifugen, Tuttlingen, Germany), and plasma was separated and stored at −20℃ until analysis. Immediately after blood withdrawal indwelling catheters were filled with 2–3 ml of 0.85% sterile saline containing 50 IU of heparin (Sigma-Aldrich Canada Ltd, Oakville, ON, Canada) to prevent clot formation.
Plasma variables
The procedures of quantitation of plasma metabolites are the same as described recently. 16 In brief, the concentration of glucose in plasma was quantified by an enzymatic method with a kit provided by Diagnostic Chemicals Ltd (Charlottetown, PE, Canada). Plasma NEFA was determined quantitatively by an enzymatic colorimetric method using kits provided by Wako Chemicals (Richmond, VA, USA). Enzymatic measurement of BHBA by β-hydroxybutyrate dehydrogenase was used for measuring plasma concentration of BHBA using a commercially available kit (Stanbio Laboratory, Boerne, TX, USA). The concentration of lactate in plasma was determined using commercially available lactate assay kits (Biomedical Research Service Center, Buffalo, NY, USA). Plasma cholesterol was measured using kits provided by Diagnostic Chemicals Ltd. The cortisol concentration in plasma was measured by a commercially available EIA kit (Diagnostic Systems Laboratories, Inc., Webster, TX, USA). The optical densities were measured with a microplate reader (Spectramax 190; Molecular Devices Corporation, CA, USA). Concentrations of plasma Ca, Zn and Cu were determined by atomic absorption spectrometry (Spectr AA800; Varian, Sydney, Australia), as described previously. 17 In brief, all plasma samples were diluted with deionized water 100 times for estimation of Ca, and 10 times for measurement of Zn and Cu. All samples were run in duplicate and inter- and intra-assay coefficients of variation (CV) were ≤10%. Control paired plasma samples were tested in the same run to exclude interassay CV of >10%.
Statistical analyses
The data were analyzed using the MIXED procedure of SAS
18
according to the following model
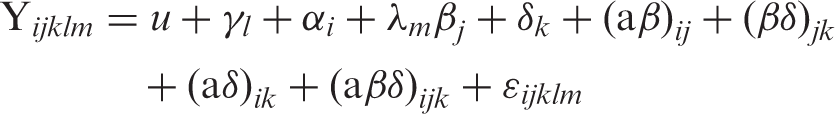
Where Y ijklm is the observation for dependent variables, μ is the population mean, γl is the independent parameter for animal l, α i is a population parameter corresponding to treatment i, λm is the independent parameter for parity m, β j is the fixed effect of measurement time (relative to each LPS challenge) j, δ k is the fixed effect for dose k, (αβ) ij is the effect of treatment by time interaction, (βδ) jk is the effect of dose by time interaction, (αδ) ik is the effect of treatment by dose interaction, (αβδ) ijk is the effect of the interaction treatment by dose by time and εijklm is the residual error. Degrees of freedom were approximated by the method of Kenward–Roger. The measurements taken on the same cow, but at different sampling hours and administration doses, were considered as double repeated measures in the model. The Kronecker product of a completely unrestricted variance–covariance matrix (for LPS dose) and a first-order autoregressive variance–covariance matrix (for time after LPS administration) was used to account for double repeated measures taken on individual cows across time. 19 Multiple differences between treatments were tested by the SLICE option. Data of peripartal responses were analyzed according to the model described previously. 3 Results are shown as least-squares means (LSM) and SEM. Significance was declared at P ≤ 0.05 and a tendency was considered at 0.05 < P ≤ 0.10.
Results
Post-challenge diurnal metabolic responses
Probability values for plasma metabolites (post-challenge measurements) as related to the factors treatment, time and challenge LPS dose (dose), as well as their interactions. a
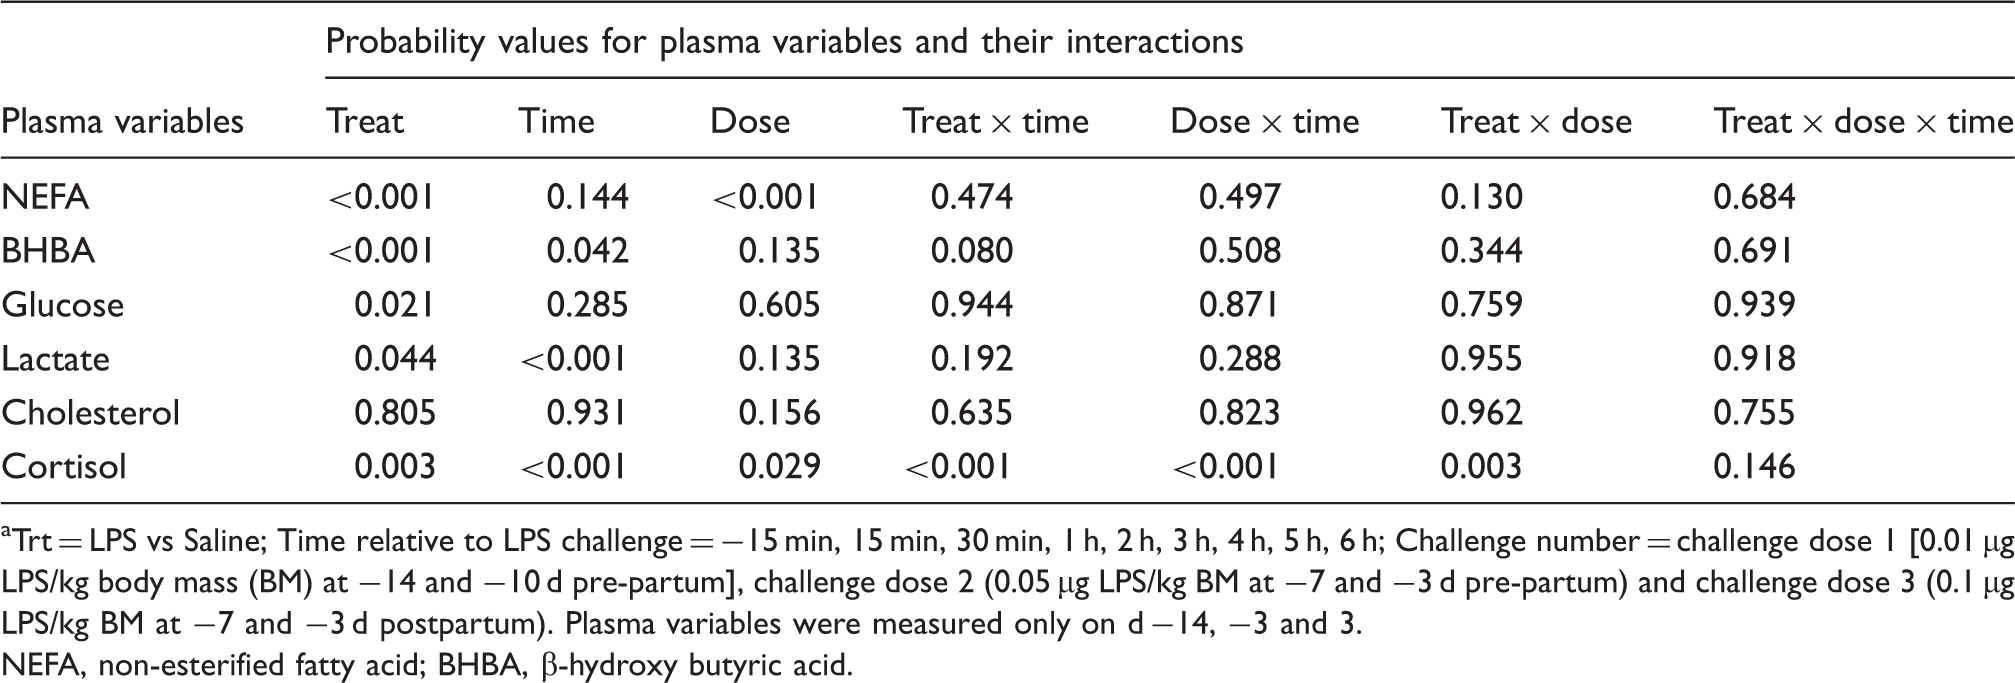
Trt = LPS vs Saline; Time relative to LPS challenge = −15 min, 15 min, 30 min, 1 h, 2 h, 3 h, 4 h, 5 h, 6 h; Challenge number = challenge dose 1 [0.01 µg LPS/kg body mass (BM) at −14 and −10 d pre-partum], challenge dose 2 (0.05 µg LPS/kg BM at −7 and −3 d pre-partum) and challenge dose 3 (0.1 µg LPS/kg BM at −7 and −3 d postpartum). Plasma variables were measured only on d −14, −3 and 3.
NEFA, non-esterified fatty acid; BHBA, β-hydroxy butyric acid.
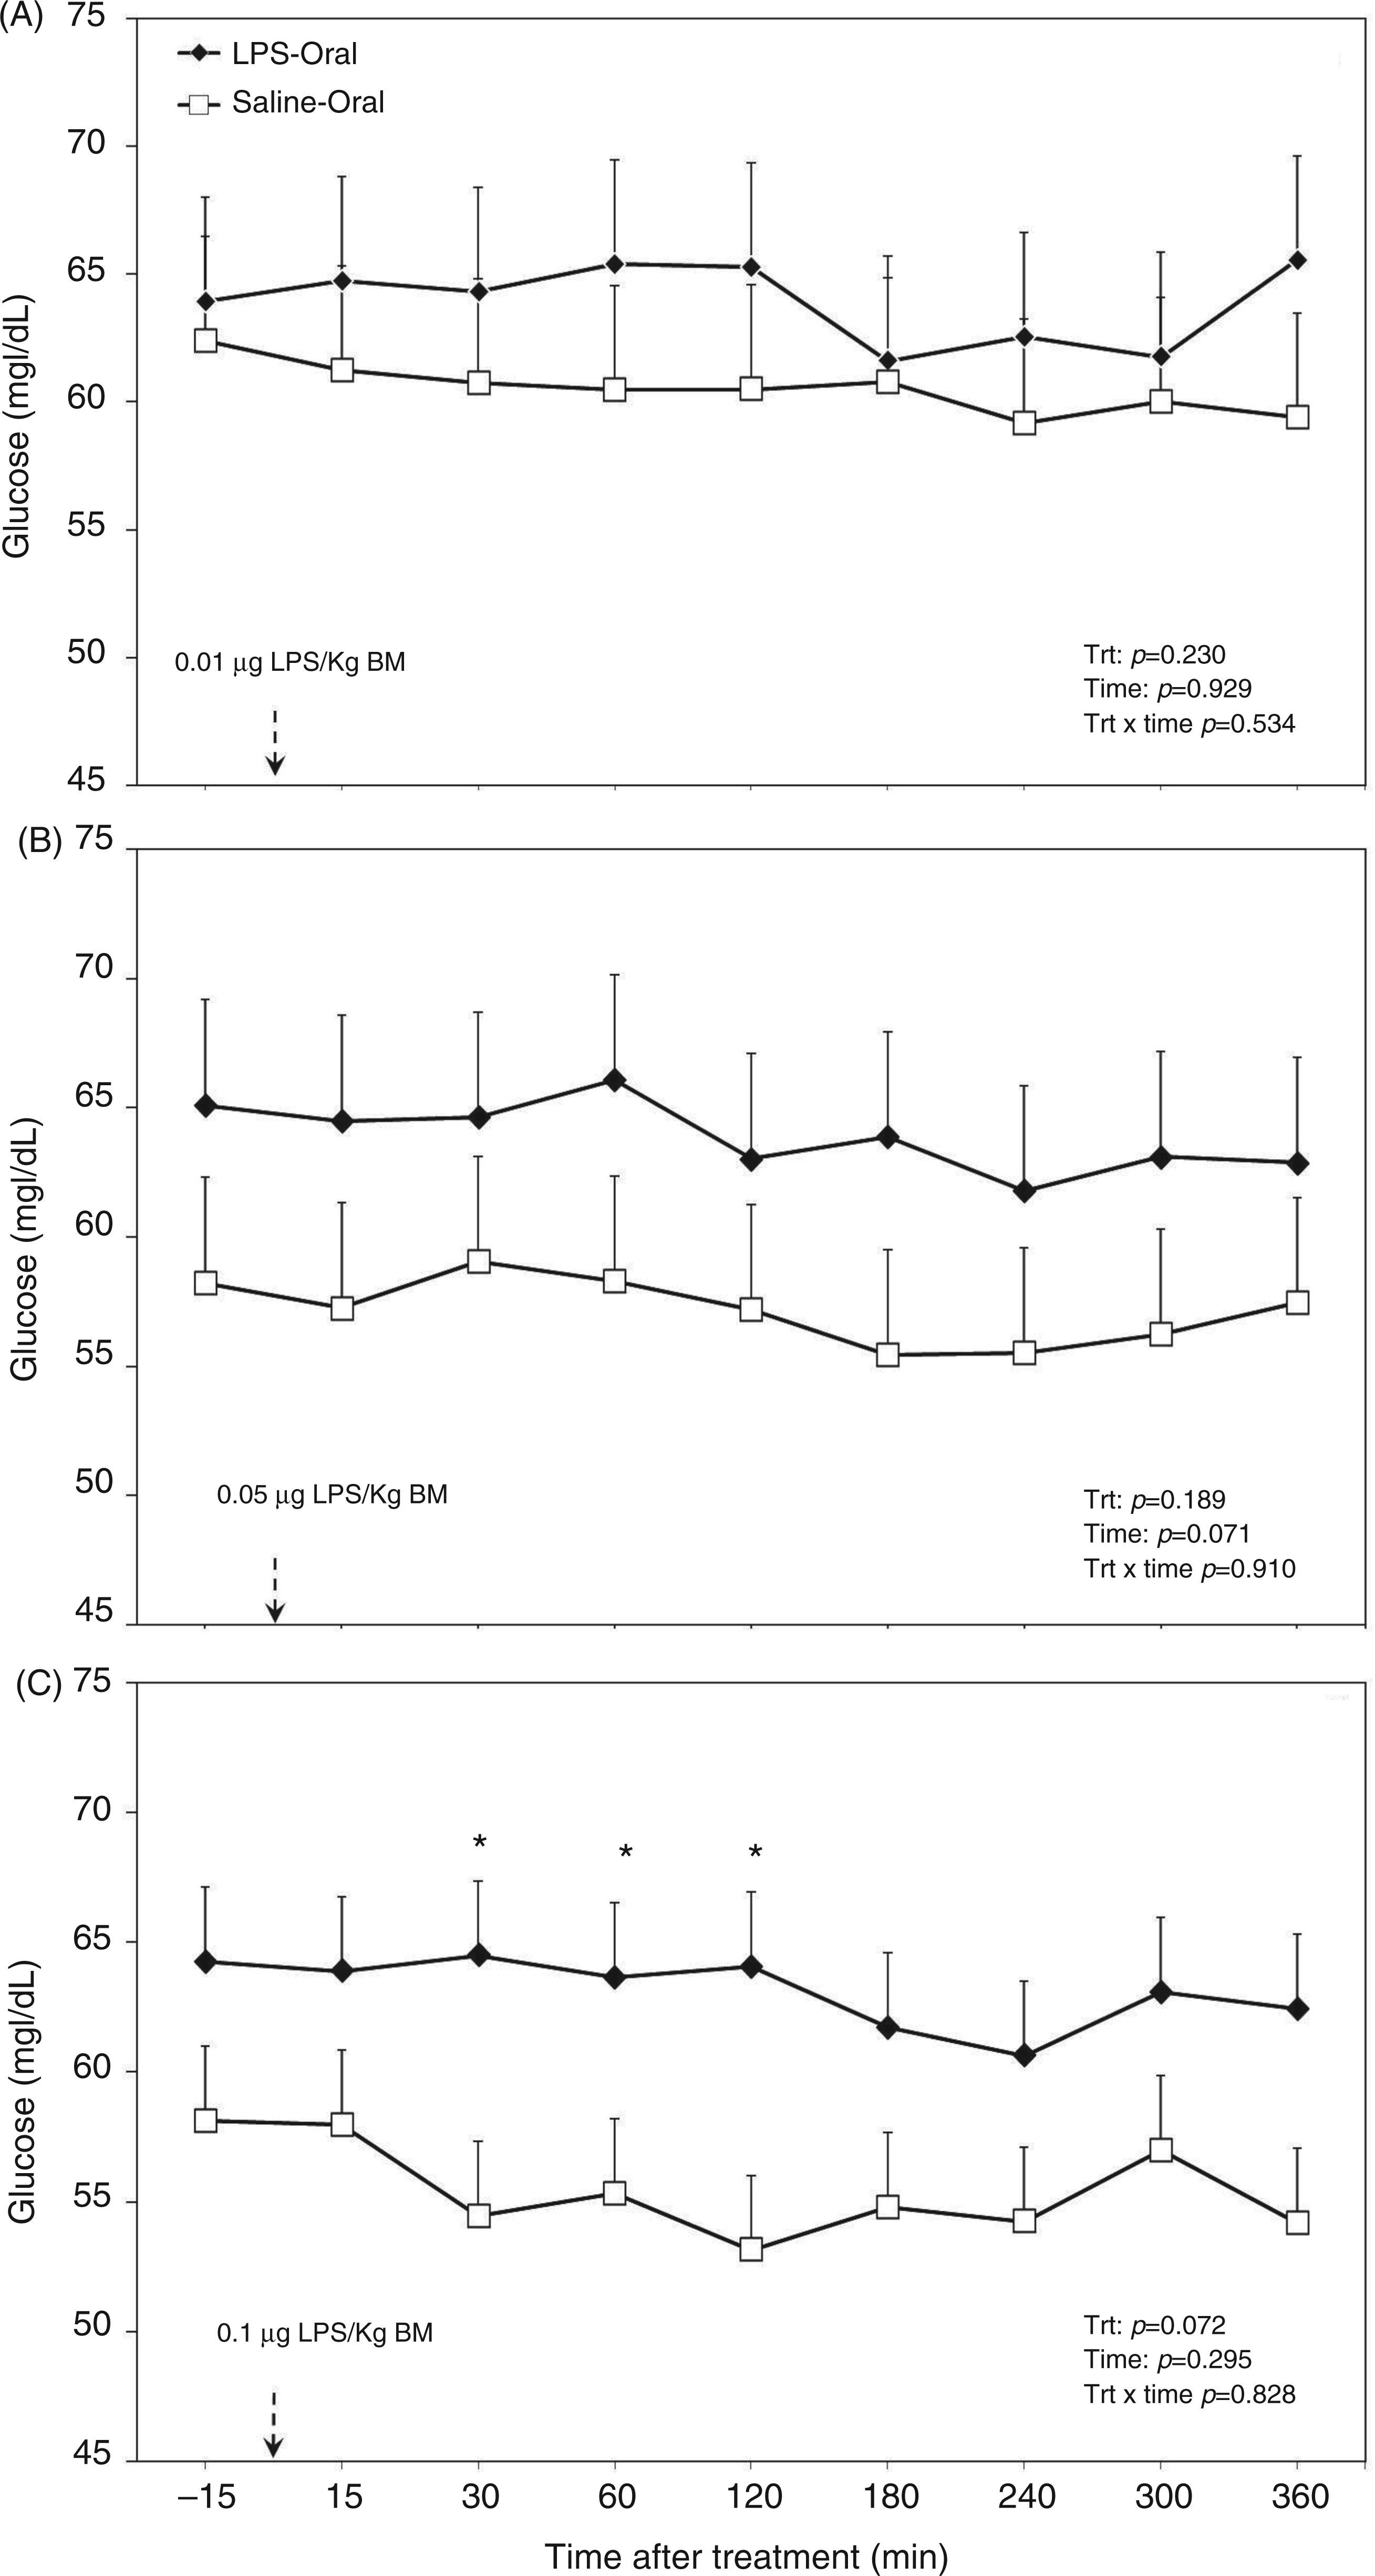
Post-challenge profile of glucose in the plasma of periparturient dairy cows after repeated oral administration of saline or LPS measured on d (A) −14 [i.e. after administration of 0.01 µg LPS/kg BM], (B) −7 (i.e. after administration of 0.05 µg LPS/kg BM) and (C) 3 postpartum (i.e. after administration of 0.1 µg LPS/kg BM); data are shown as least-squares means and respective standard errors. n = 8; trt: effect of treatment. *Indicates differences between treatments at different sampling times (P < 0.05).
Although there seemed to be an increasing effect of oral administration of LPS on lactate concentration in plasma (P = 0.044; Table 1), treatment did not alter this variable in the separated challenges (Figure 2). The factor time within challenge dose did not have an effect for the first two challenge doses and also there was no effect for a treatment by time interaction (all challenge doses; Figure 2A, B). However, lactate in plasma decreased with time after the third challenge dose (P < 0.001; Figure 2C).
Post-challenge profile of lactate in the plasma of periparturient dairy cows after repeated oral administration of saline or LPS measured on d (A) −14 [i.e. after administration of 0.01 µg LPS/kg BM], (B) −7 (i.e. after administration of 0.05 µg LPS/kg BM) and (C) 3 postpartum (i.e. after administration of 0.1 µg LPS/kg BM); data are shown as least-squares means and respective standard errors. n = 8; trt, effect of treatment. *Indicates differences between treatments at different sampling times (P < 0.05).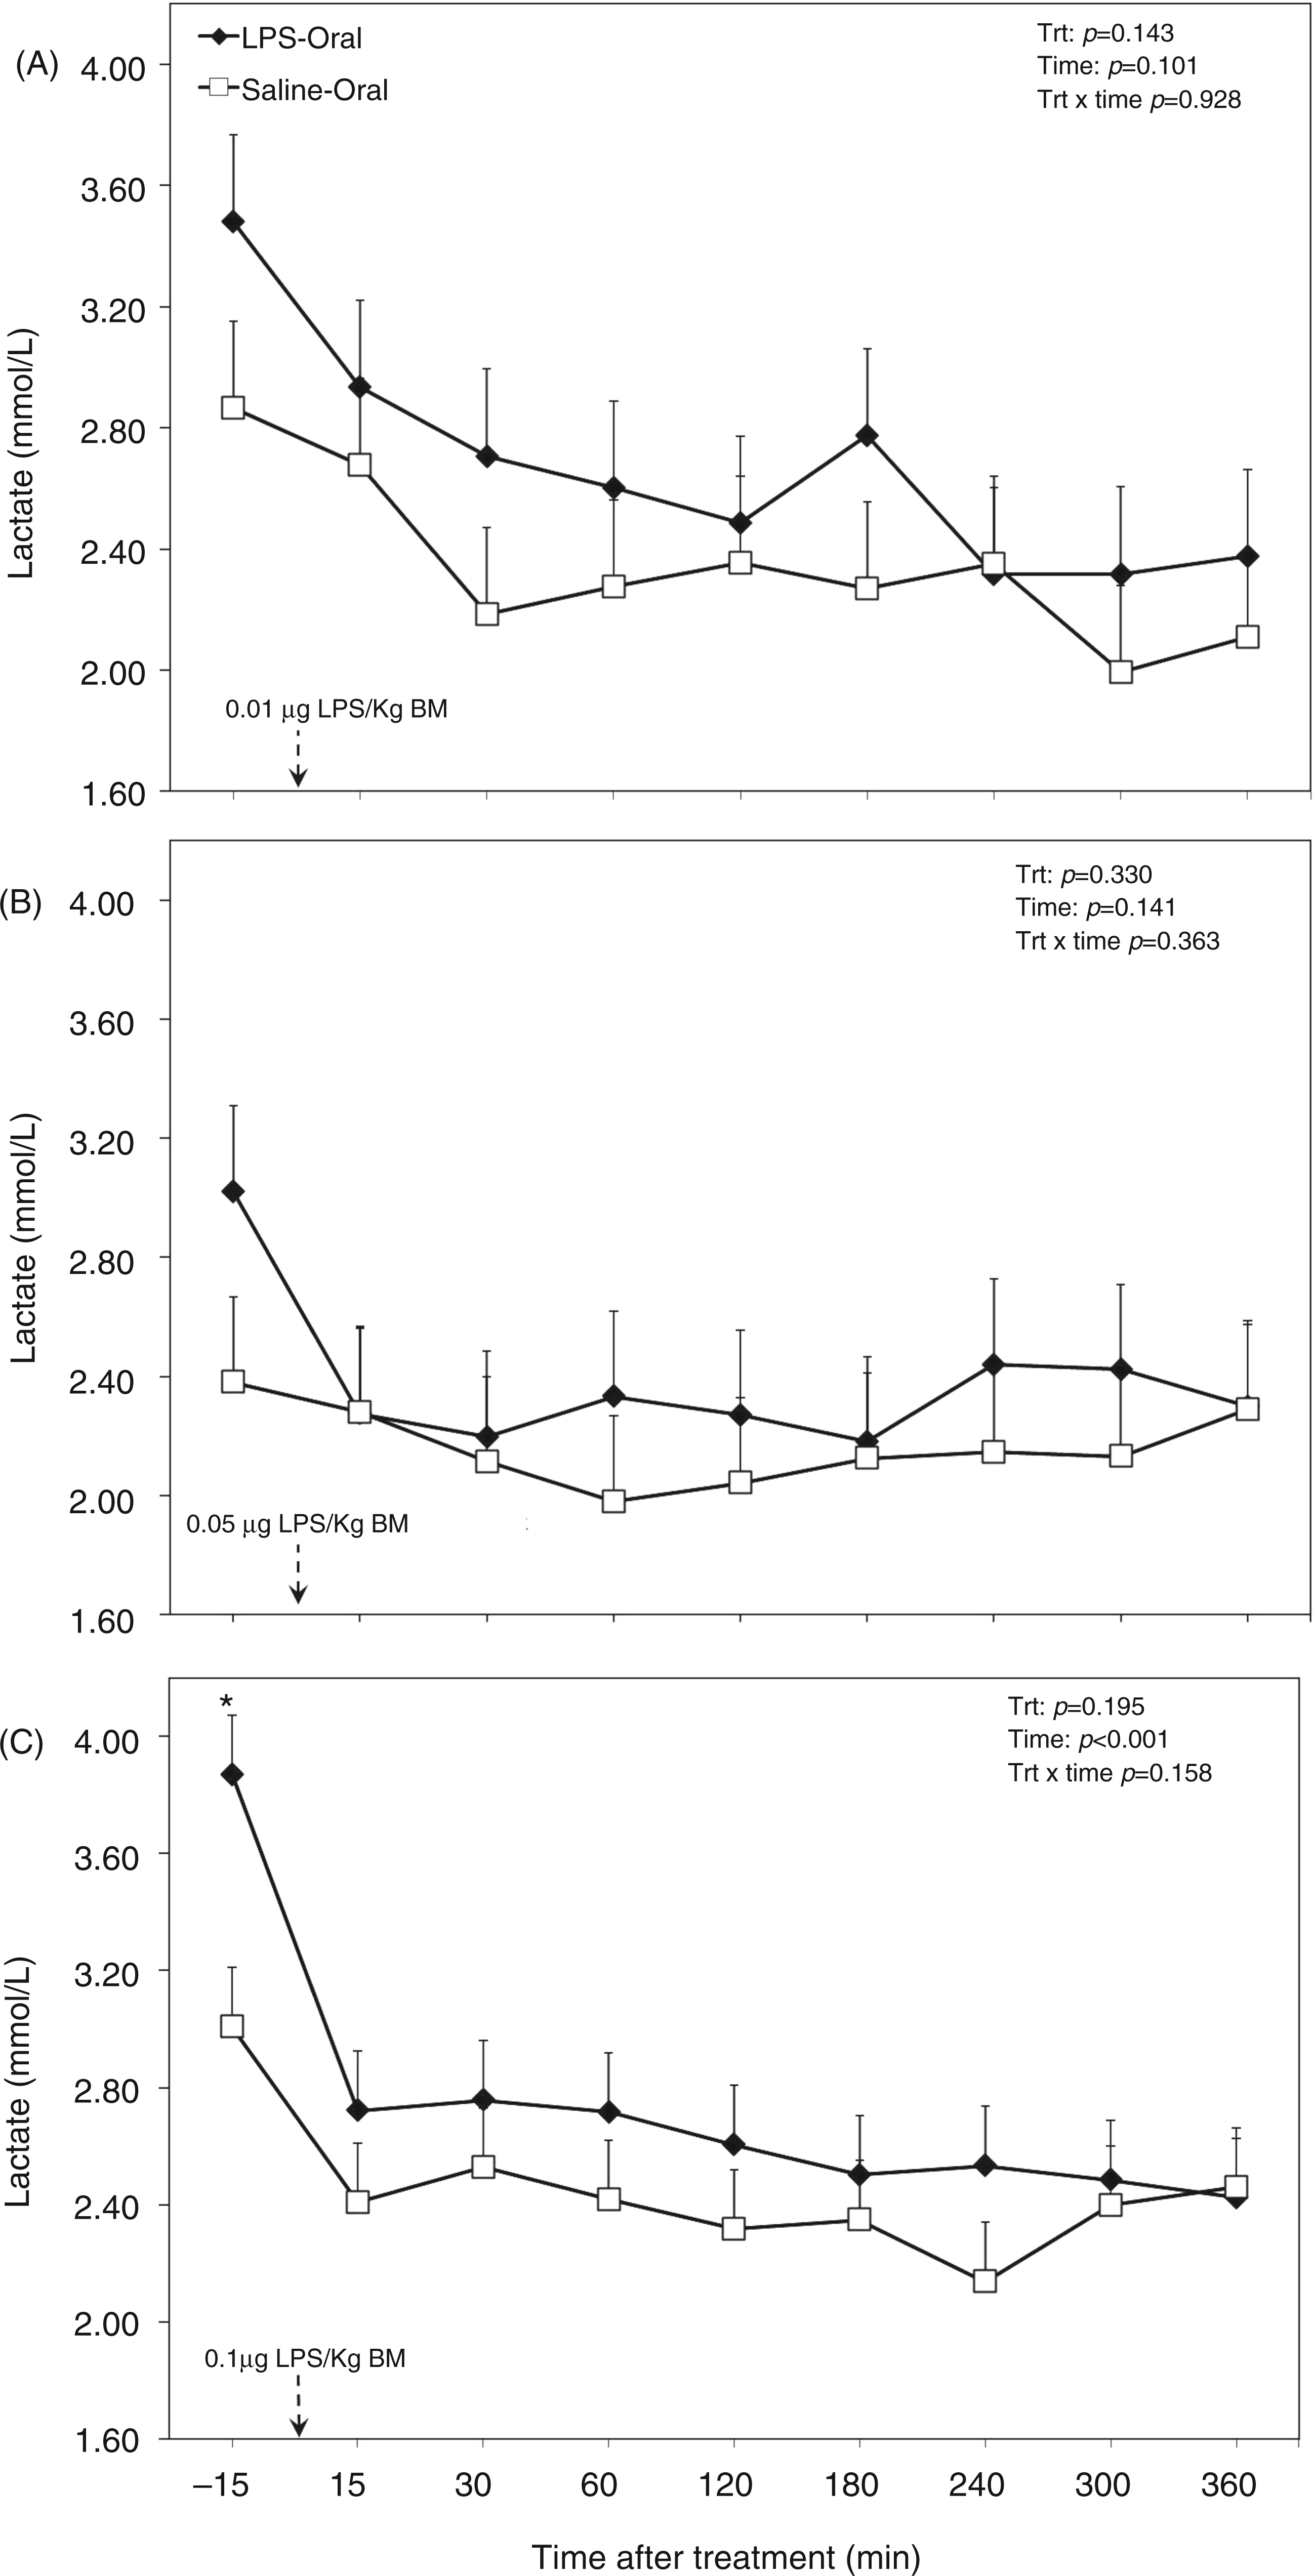
The overall ANOVA revealed that the factor oral LPS lowered concentration of BHBA in the plasma (P < 0.001; Table 1). Moreover, the effect of sampling time relative to LPS administration decreased plasma BHBA concentration (P = 0.042; Table 1). This was reflected in a tendency in the interaction treatment × time (P = 0.080; Table 1). When separated by challenge dose the TRT group tended to have a lower BHBA concentration in LPS dose 1 (P = 0.053; Figure 3A), and challenge dose 2 (P = 0.018; Figure 3B), whereas postpartum (challenge dose 3) the concentration was much lower (P < 0.001; Figure 3C). During the diurnal measurement period the factor time showed an effect for dose 1 (P = 0.002; Figure 3A).
Post-challenge profile of BHBA in the plasma of periparturient dairy cows after repeated oral administration of saline or LPS measured on d (A) −14 [i.e. after administration of 0.01 µg LPS/kg BM], (B) −7 (i.e. after administration of 0.05 µg LPS/kg BM) and (C) 3 postpartum (i.e. after administration of 0.1 µg LPS/kg BM); data are shown as least-squares means and respective standard errors. n = 8; trt, effect of treatment; *Indicates differences between treatments at different sampling times (P < 0.05).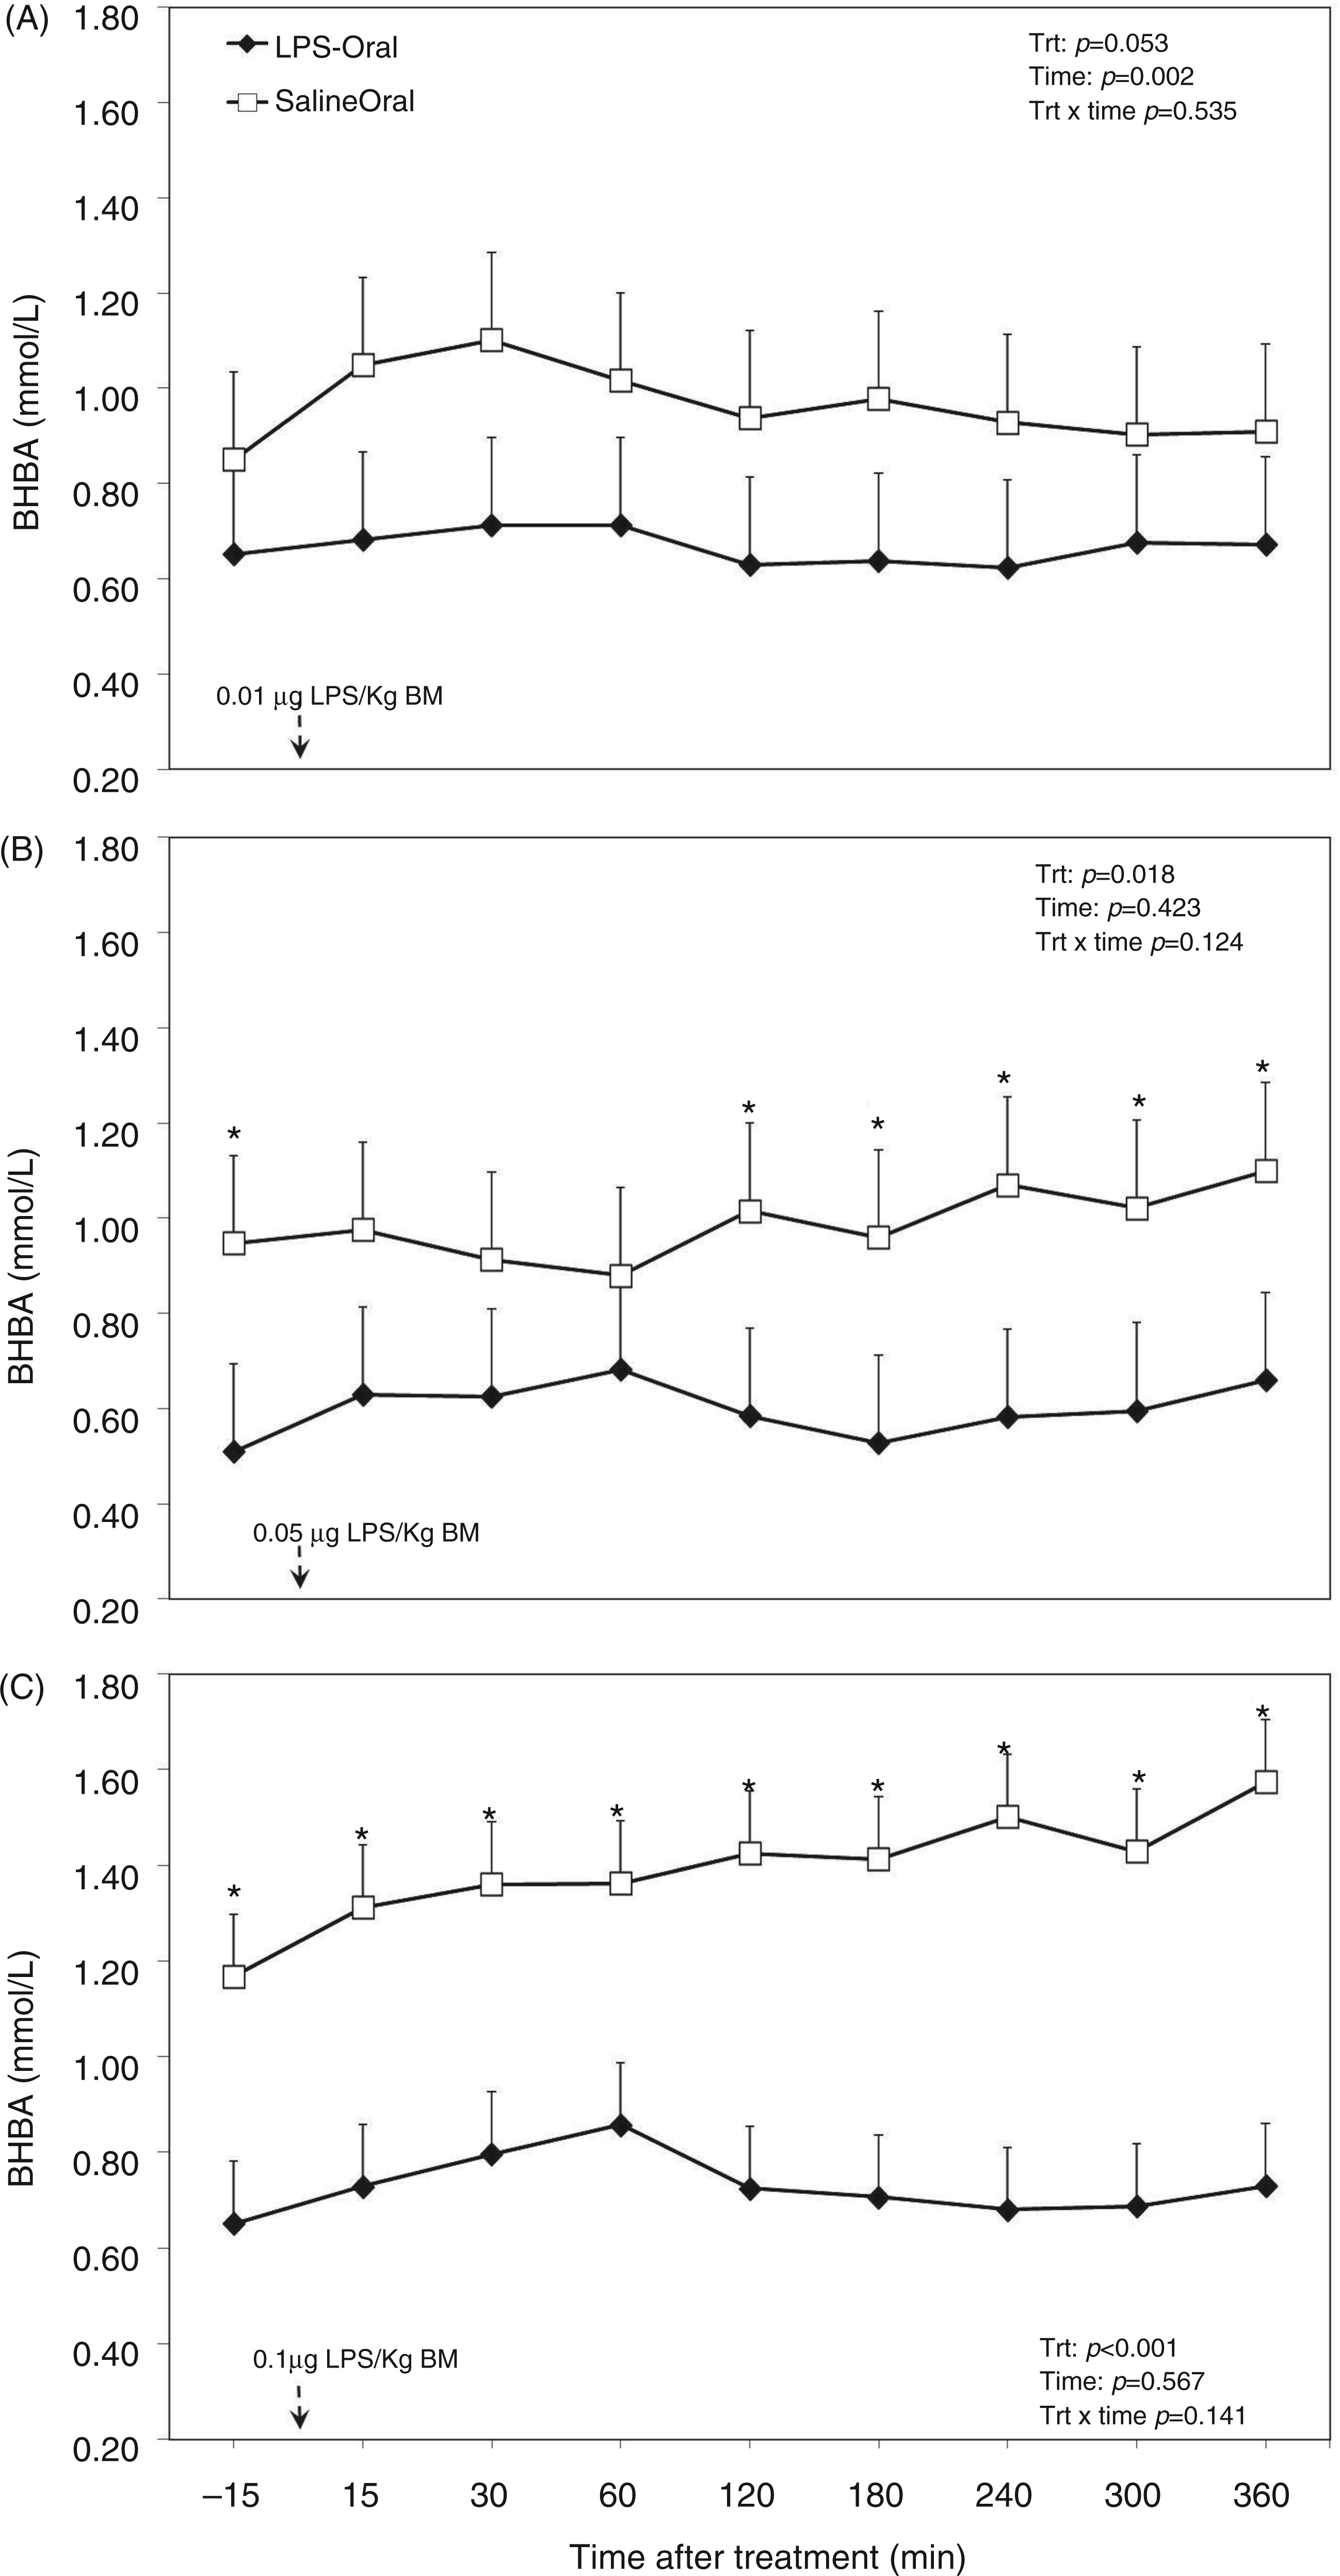
Overall diurnal concentration of NEFA in the plasma of the TRT group was lower than in the CTR group (P < 0.001; Table 1). Furthermore, with increasing doses of LPS (factor challenge dose of LPS) plasma concentration of NEFA decreased (P < 0.001; Table 1). Separated by dose, in dose 3, NEFA concentration was lowered by almost 50% (P < 0.001; Figure 4C), whereas doses 1 (Figure 4A) and 2 (Figure 4B) did not show effects. In the dataset, which was separated by challenge dose, the factor sampling time relative to LPS application had a lowering effect on plasma NEFA concentration during administration of dose 1 (P = 0.019; Figure 4A), no effect for dose 2 (P = 0.702; (Figure 4B) and a decreasing tendency for dose 3 (P = 0.096; Figure 4C).
Post-challenge profile of NEFA in the plasma of periparturient dairy cows after repeated oral administration of saline or LPS measured on d (A) −14 [i.e. after administration of 0.01 µg LPS/kg BM], (B) −7 (i.e. after administration of 0.05 µg LPS/kg BM) and (C) 3 postpartum (i.e. after administration of 0.1 µg LPS/kg BM); data are shown as least-squares means and respective standard errors. n = 8; trt, effect of treatment. *Indicates differences between treatments at different sampling times (P < 0.05).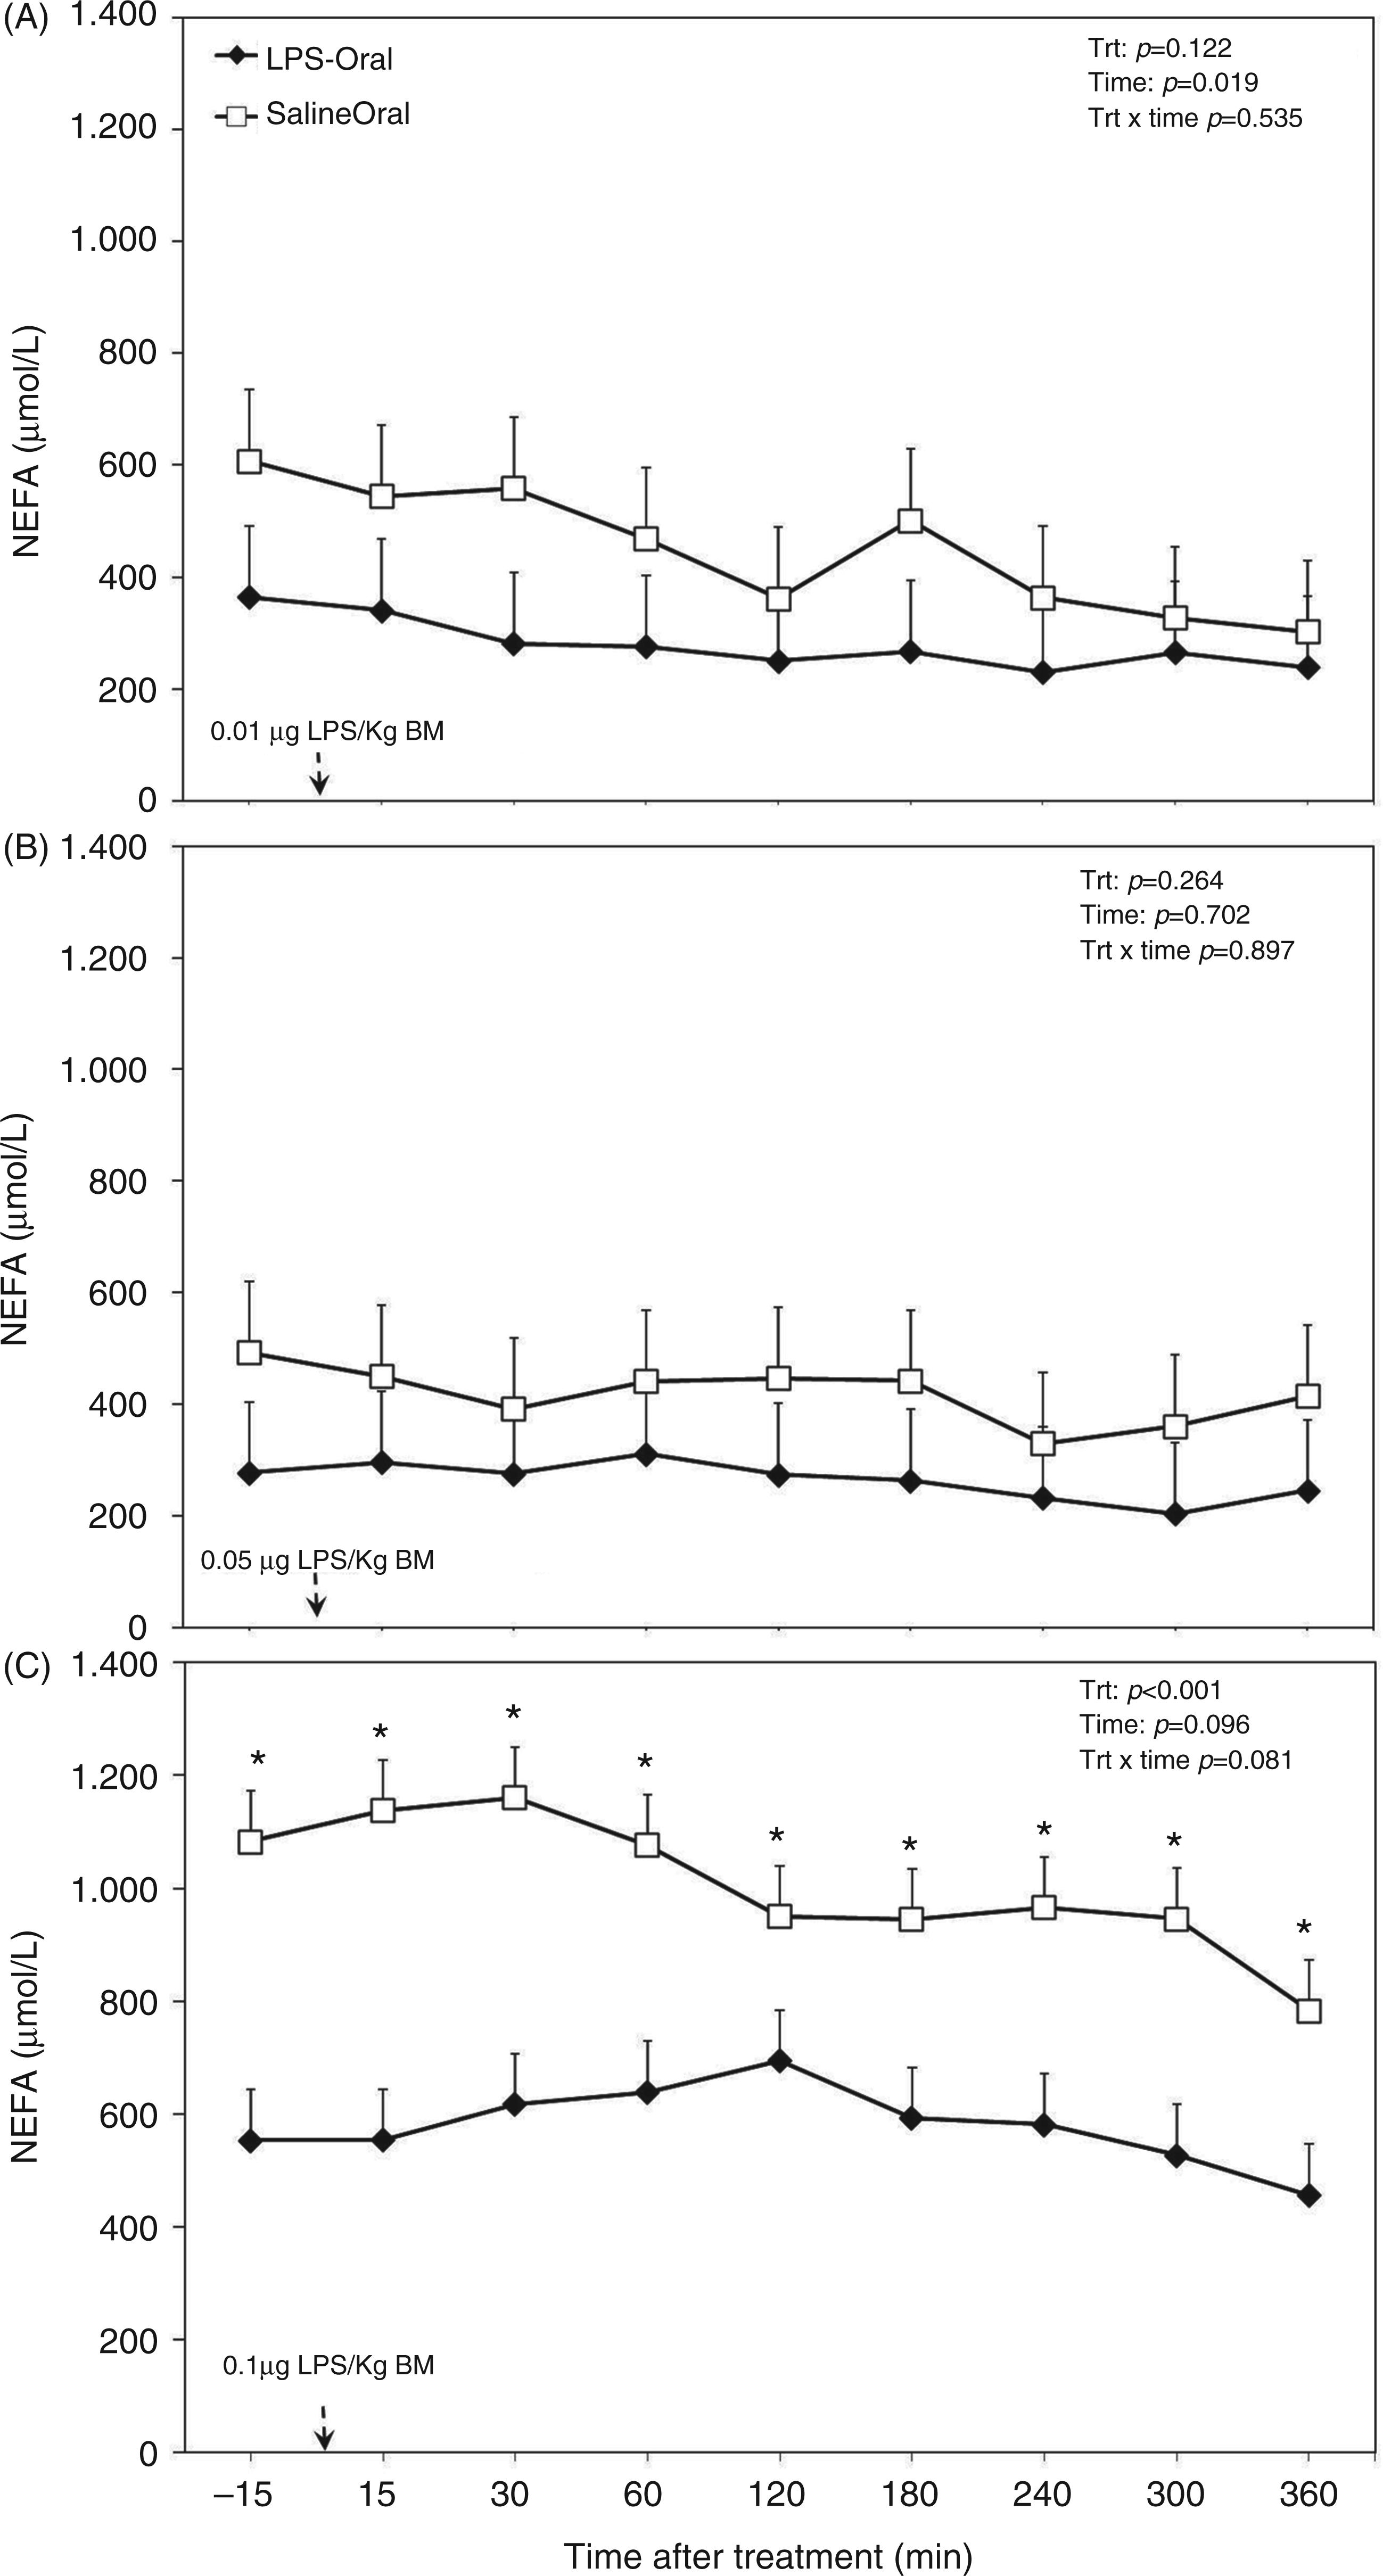
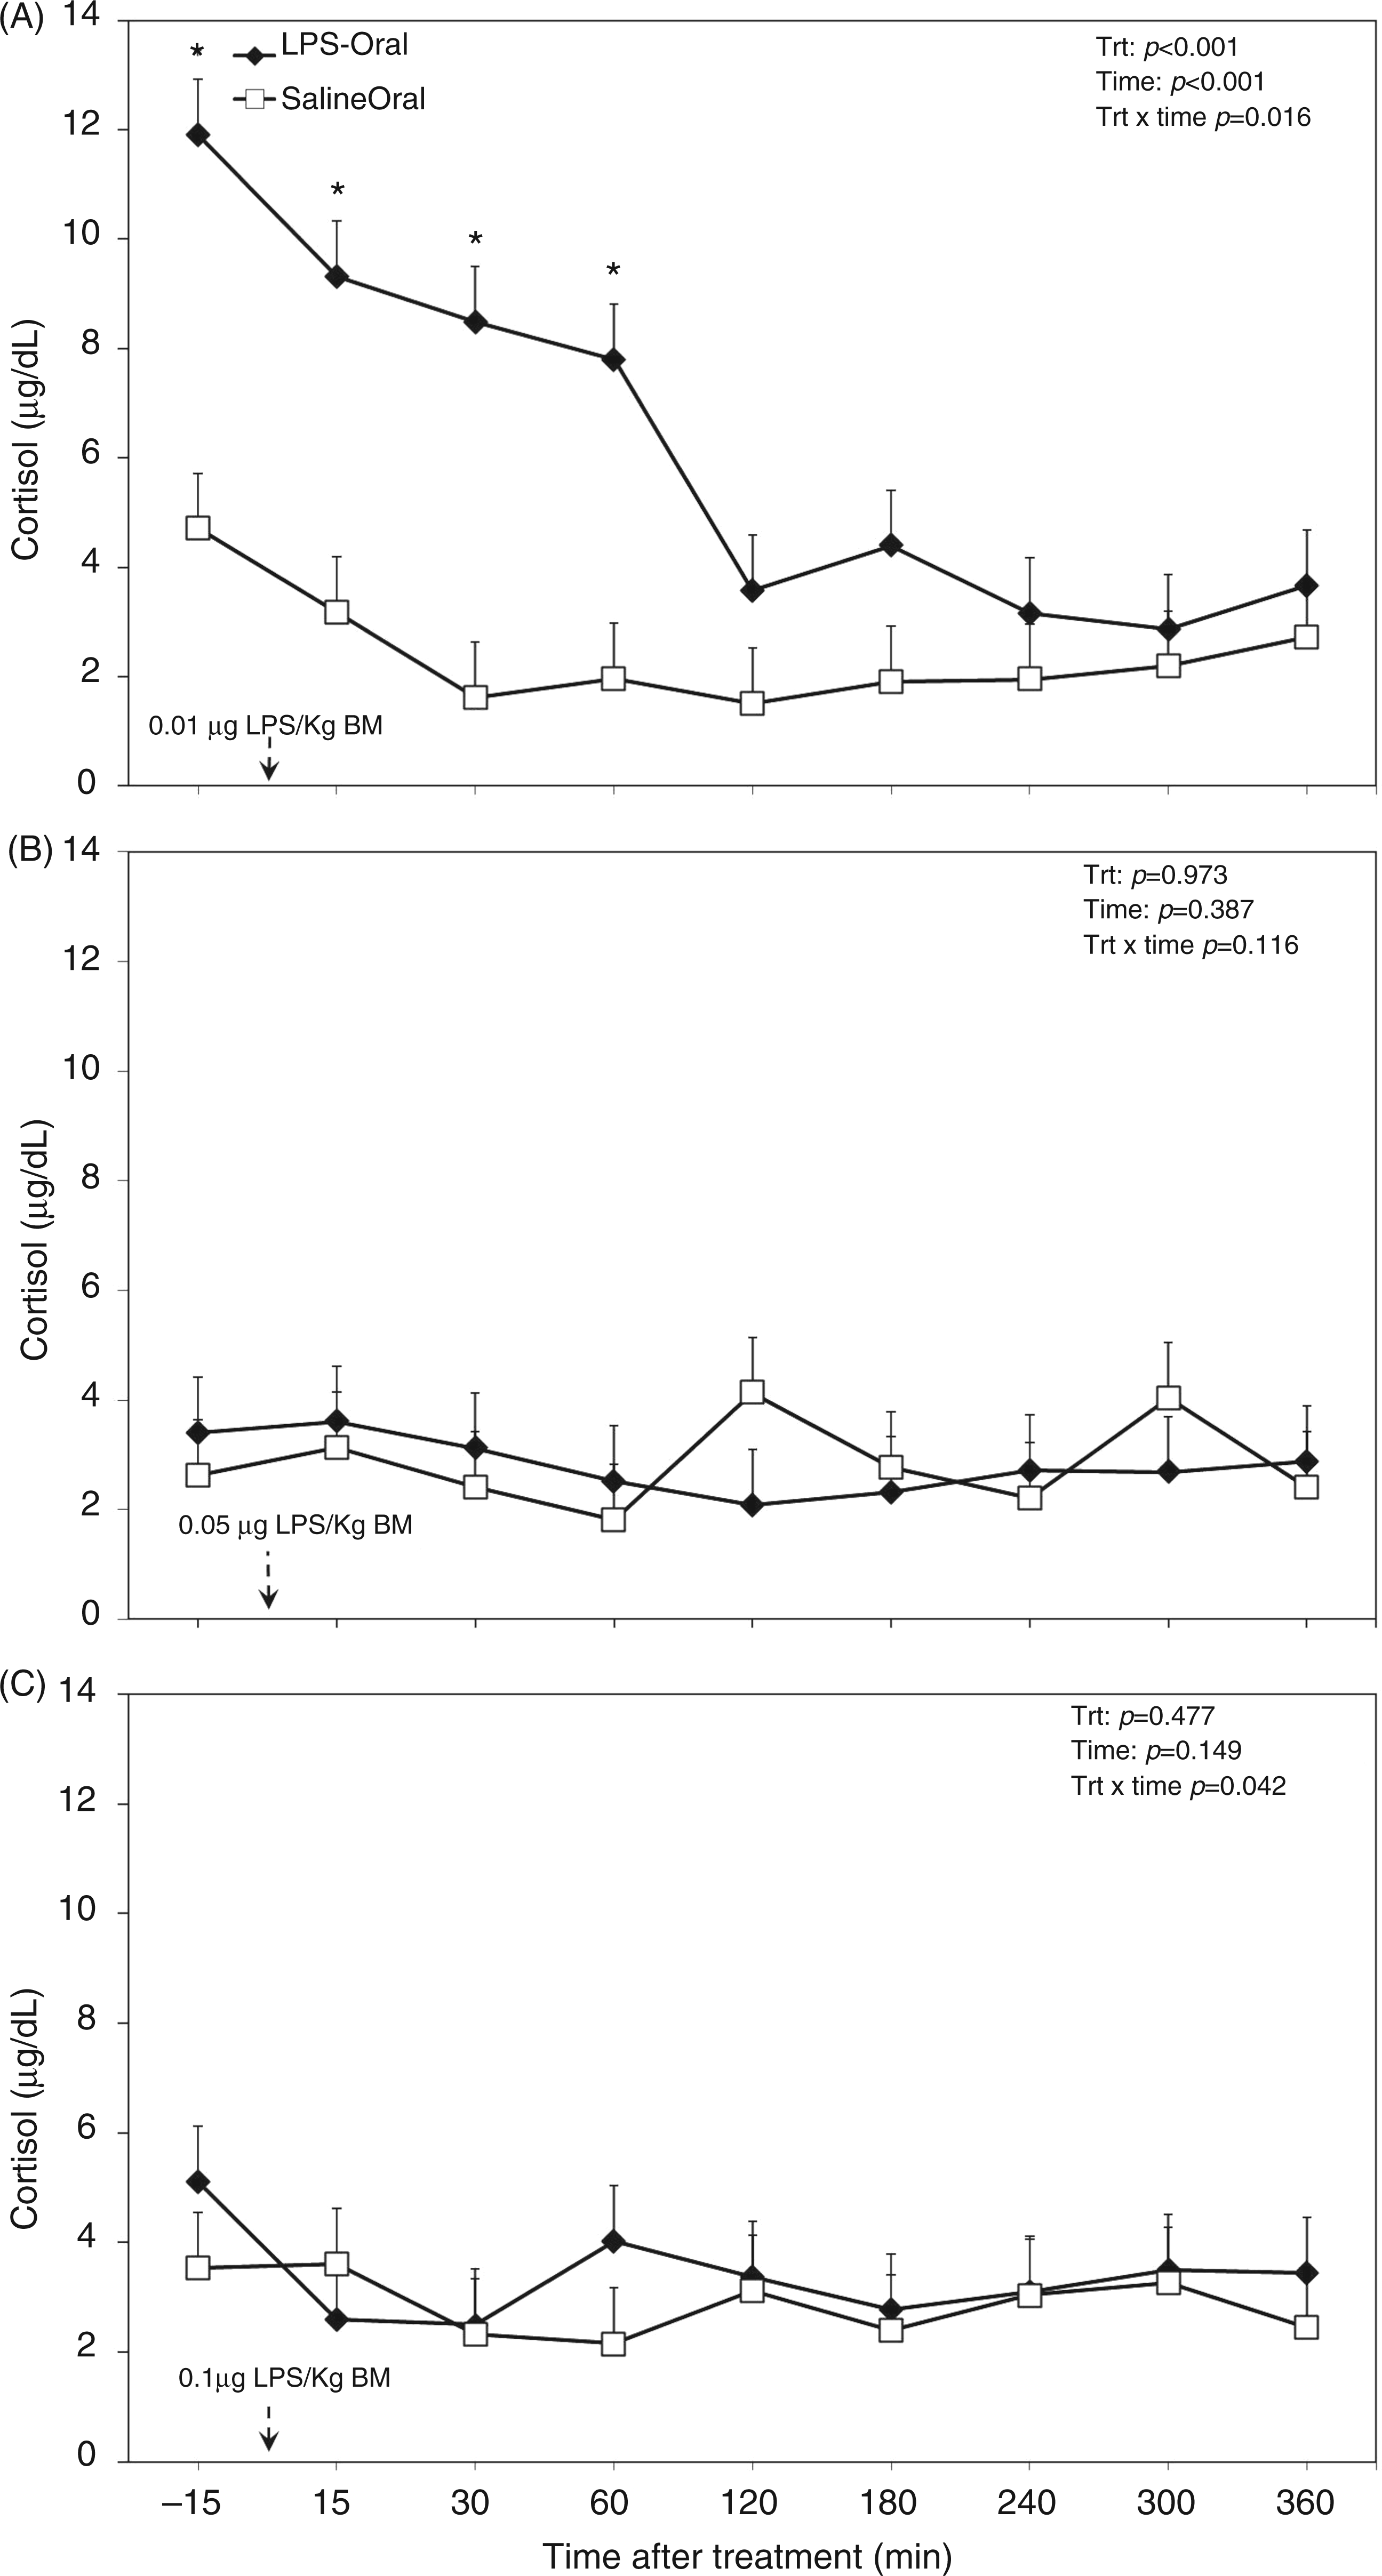
The overall diurnal profile of plasma cholesterol was not affected by oral LPS, time, or the interaction of treatment and time (Table 1). Also, analysis of data separated by challenge dose of LPS did not reveal any differences (Figure 5). There were greater cortisol concentrations in the plasma of TRT cows (Table 1), in particular during the first challenge (Figure 6A). Within the first 60 min of challenge with dose 1 (Figure 6A), we detected 3 times greater concentration of the stress hormone cortisol compared with the saline group (P < 0.001). Oral LPS did not show effects on plasma cortisol in challenge dose 2 (P = 0.97; Figure 6B) and 3 (P = 0.47; Figure 6C).
Post-challenge profile of cholesterol in the plasma of periparturient dairy cows after repeated oral administration of saline or LPS measured on d (A) −14 (i.e. after administration of 0.01 µg LPS/kg BM), (B) −7 (i.e. after administration of 0.05 µg LPS/kg BM) and (C) 3 postpartum (i.e. after administration of 0.1 µg LPS/kg BM); data are shown as least-squares means and respective standard errors. n = 8; trt, effect of treatment. Post-challenge profile of cortisol in the plasma of periparturient dairy cows after repeated oral administration of saline or LPS measured on d (A) −14 [i.e. after administration of 0.01 µg LPS/kg BM], (B) −7 (i.e. after administration of 0.05 µg LPS/kg BM) and (C) 3 postpartum (i.e. after administration of 0.1 µg LPS/kg BM); data are shown as least-squares means and respective standard errors. n = 8; trt, effect of treatment. *Indicates differences between treatments at different sampling times (P < 0.05).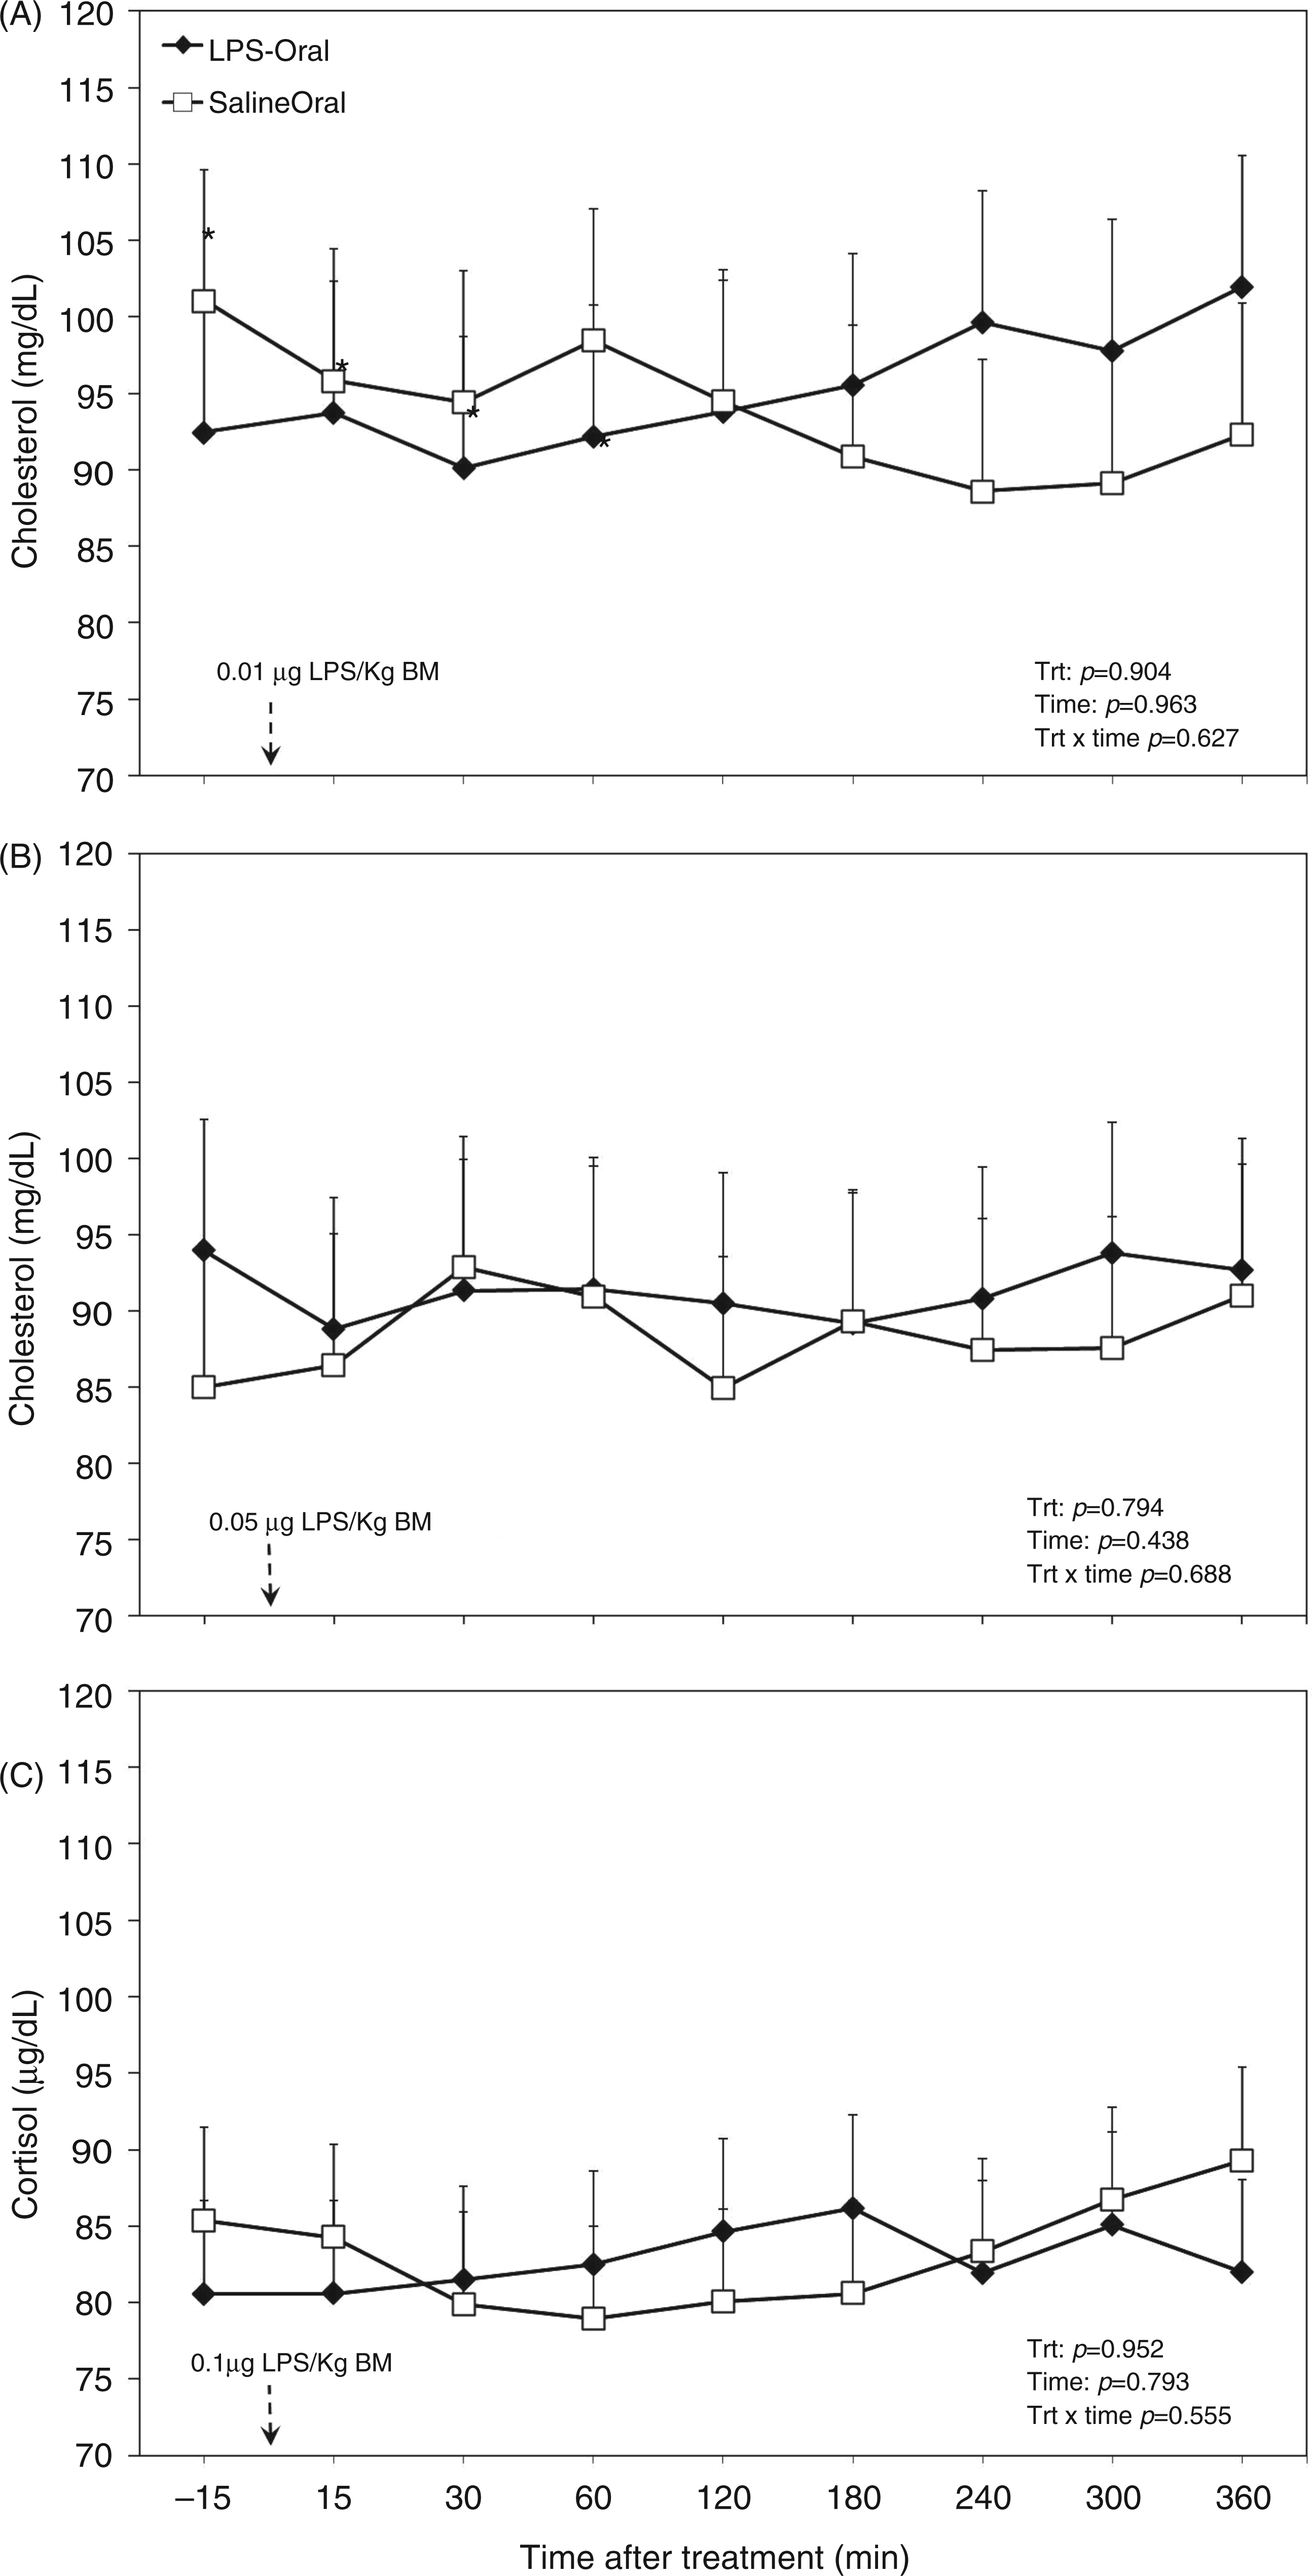
Peripartal responses of plasma metabolites and minerals to increasing doses of LPS
Concentration of glucose in the plasma was greater in cows treated orally with LPS versus the control group (P < 0.01; Figure 7A). No time effect or treatment by time interaction was evidenced for plasma glucose up to four wk postpartum (Figure 7A). Plasma lactate was greater in challenged cows than in control counterparts (P < 0.05; Figure 7B). This variable reached peak levels on wk 2 after parturition in LPS treated cows and dropped to similar levels with control animals on wk 2 after parturition, and stayed at those levels for the remainder of the experiment. There was no time effect or treatment by time interaction regarding plasma lactate (Figure 7B).
Peripartal effects of oral challenge of increasing doses of LPS twice per wk during wk −2, −1 and 1 postpartum on (A) glucose, (B) lactate and (C) BHBA measured in the plasma until 4 wk postpartum. Arrows indicate the schedule of LPS administration with doses; data are shown as least-squares means and respective standard errors. n = 8; trt, effect of treatment. *Indicates differences between treatments at different sampling times (P < 0.05).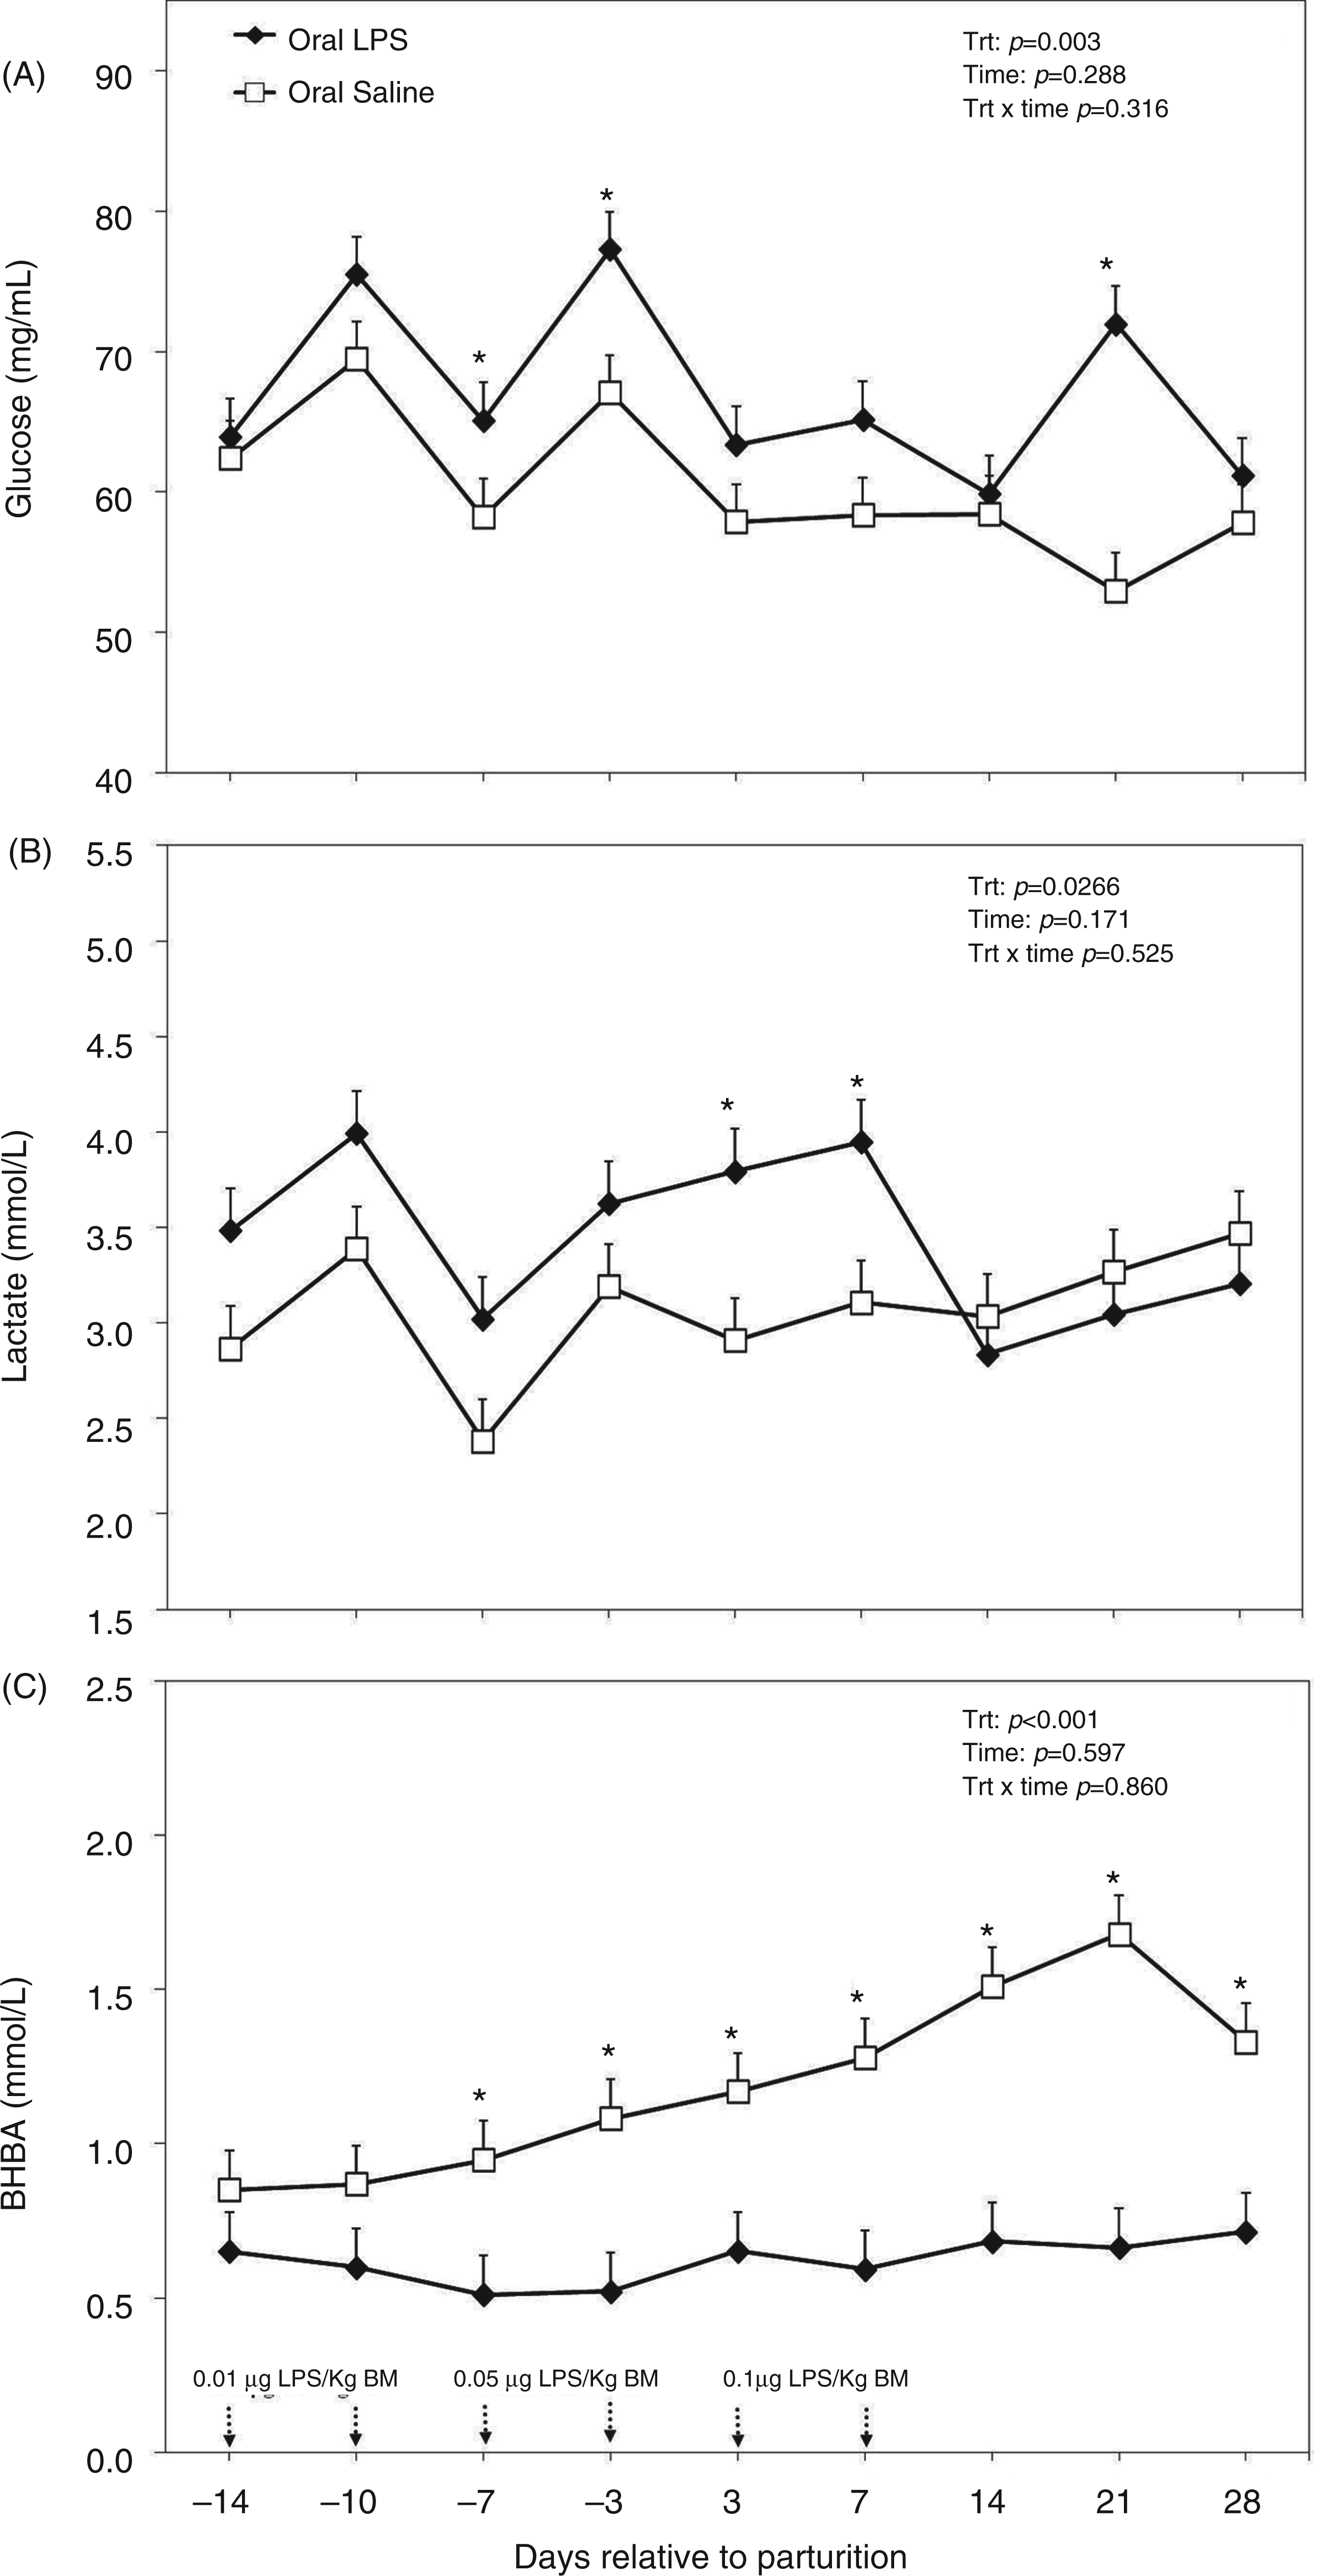
Plasma concentration of BHBA was greater in control cows starting from the week before parturition (P < 0.001; Figure 7C). Concentration of BHBA reached peak levels in control animals 3 wk after parturition at 1.67 mmol/l. No time effect or treatment by time interaction was obtained for plasma BHBA (Figure 7C).
Concentration of NEFA in the plasma was greater in the control cows (Figure 8A). There was also a time effect for plasma NEFA with peak levels 1 wk after parturition in both control animals and those treated with oral LPS at 1153 and 627 µmol/l respectively (Figure 8A). No treatment by time interaction was obtained for plasma NEFA (Figure 8A). Cholesterol in the plasma was not different among the control and treated cows (P = 0.313; Figure 8B). However, there was a time effect obtained for plasma cholesterol with values starting to increase by the end of the first week (P < 0.001). There was no treatment by time interaction regarding plasma cholesterol (Figure 8B).
Peripartal effects of oral challenge of increasing doses of LPS twice per wk during wk −2, −1 and 1 postpartum on (A) NEFA and (B) cholesterol measured in the plasma until 4 wk postpartum. Arrows indicate the schedule of LPS administration with doses; data are shown as least-squares means and respective standard errors. n = 8; trt, effect of treatment. *Indicates differences between treatments at different sampling times (P < 0.05).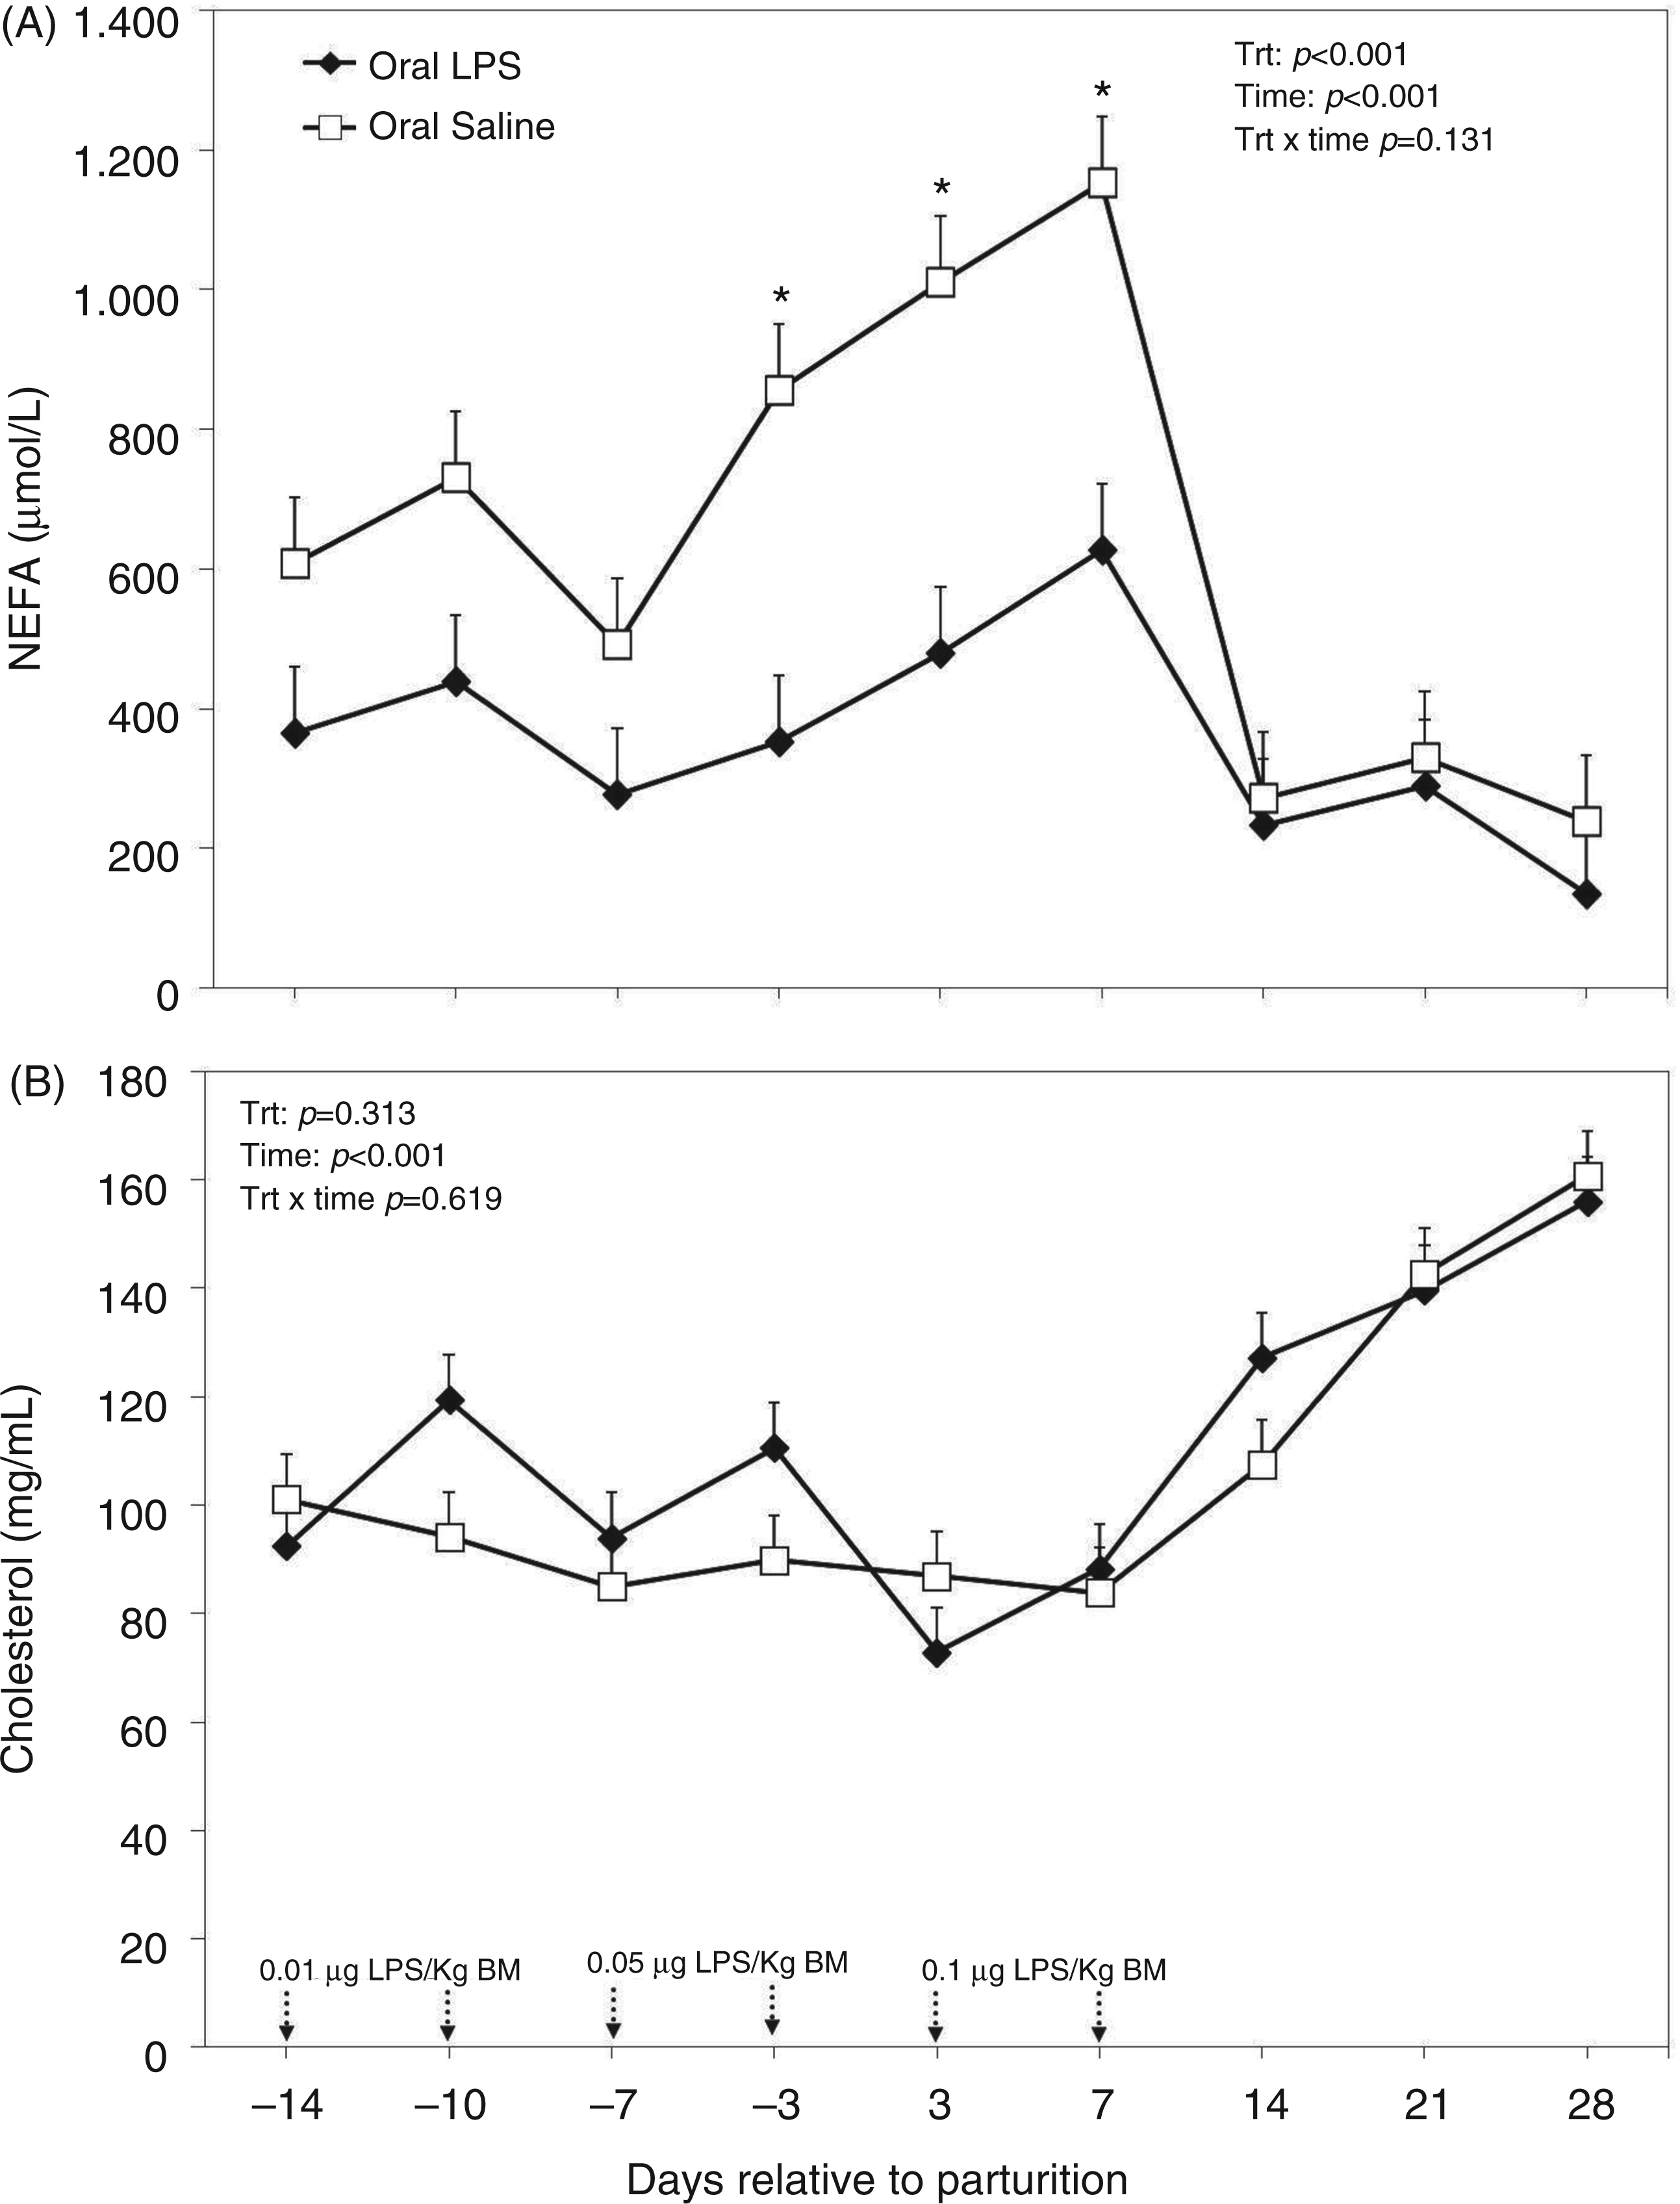
Plasma insulin was greater in cows treated orally with LPS when compared with the control cows (P = 0.006; Figure 9). Although no significance was reached, data indicated that insulin was higher two weeks before parturition and decreased numerically thereafter; however, no such declining trend was observed for cows treated orally with LPS. The ANOVA indicated no time effect or treatment by time interaction for plasma insulin (Figure 9).
Peripartal effects of oral challenge of increasing doses of LPS twice per wk during wk −2, −1 and 1 postpartum on insulin measured in the plasma until 4 wk postpartum. Arrows indicate the schedule of LPS administration with doses; data are shown as least-squares means and respective standard errors. n = 8; trt, effect of treatment. *Indicates differences between treatments at different sampling times (P < 0.05).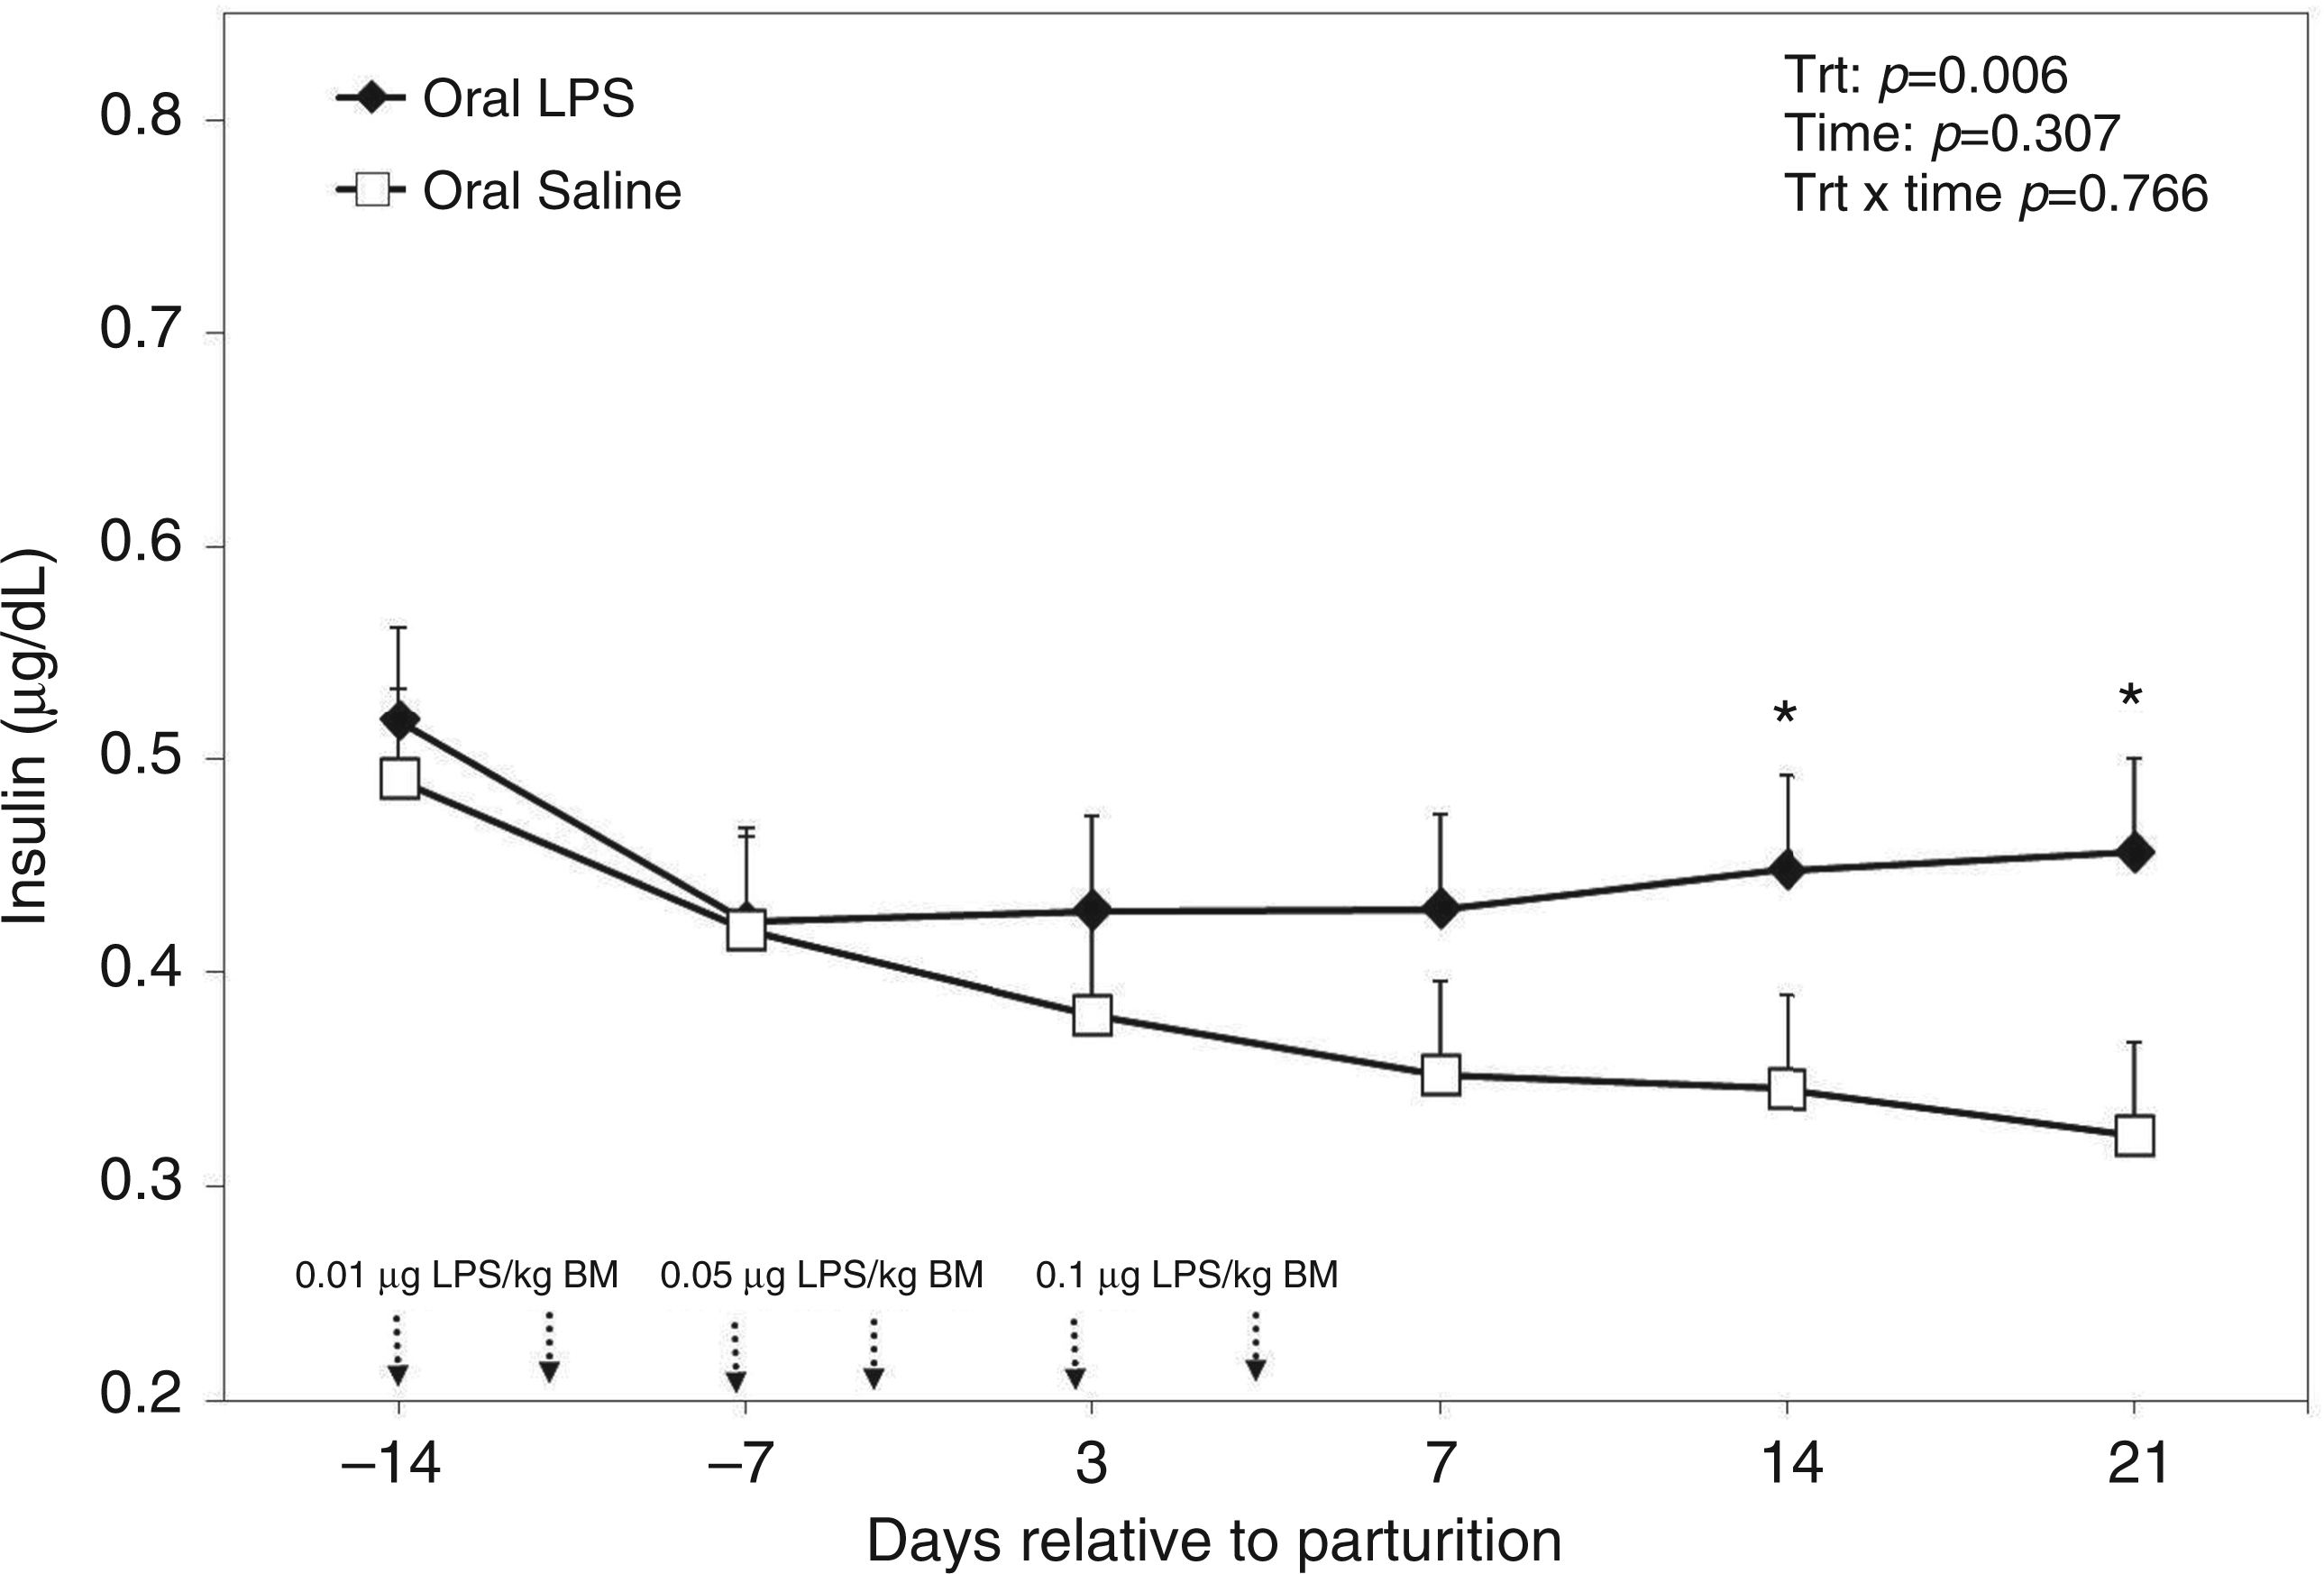
There were no differences between plasma concentrations of Ca between the control and treated groups (Figure 10A). Plasma Ca declined below 10 mg/dl immediately after parturition in both groups of cows and returned to normal afterwards; this effect was evidenced by ANOVA (P < 0.001). No interaction between time and treatment was evidenced for plasma Ca (Figure 10A). Both plasma Zn and Cu were affected by oral LPS challenge administered to cows. However, whilst plasma Zn was greater in cows treated with oral LPS (P = 0.002; Figure 10B), plasma Cu was lower (P = 0.002; Figure 10C) in treated animals versus those of controls. There were no time effects or treatment by time interactions regarding plasma Zn and Cu in this study.
Peripartal effect of oral challenge of increasing doses of LPS twice per wk during wk −2, −1 and 1 postpartum on (A) calcium, (B) zinc and (C) copper measured in the plasma until 4 wk postpartum. Arrows indicate the schedule of LPS administration with doses; data are shown as least-squares means and respective standard errors. n = 8; trt, effect of treatment. *Indicates differences between treatments at different sampling times (P < 0.05).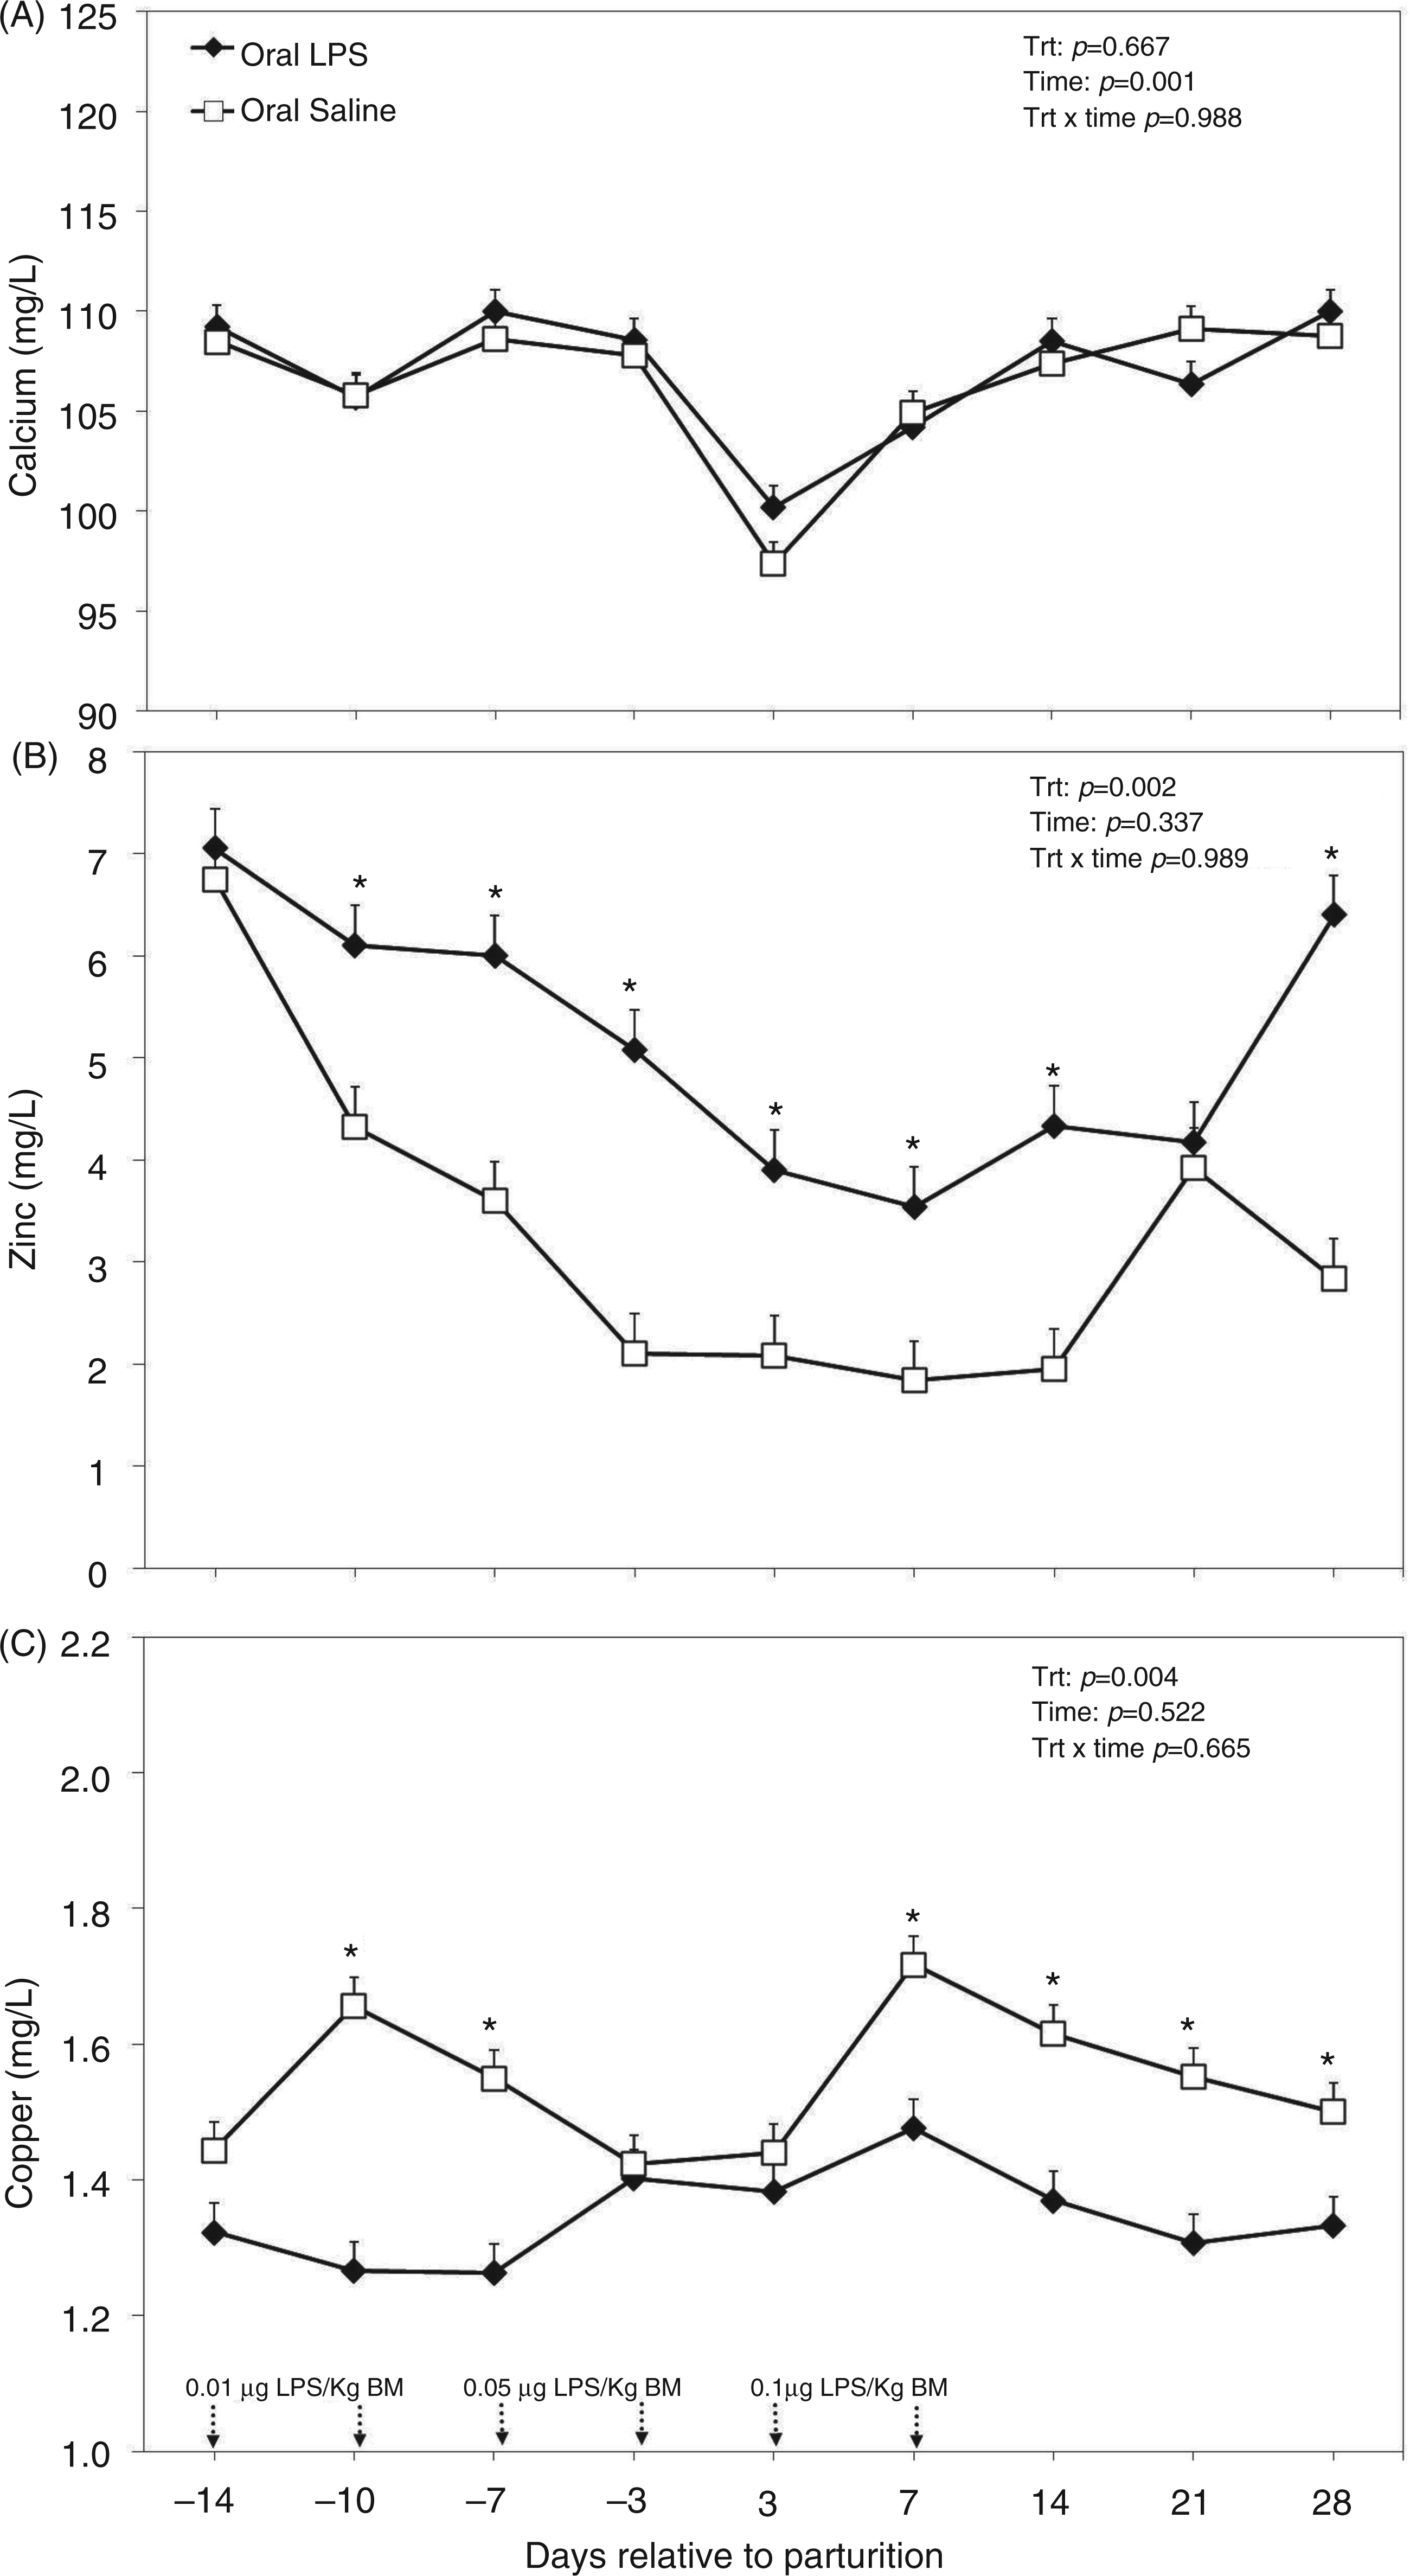
Discussion
We hypothesized that repeated oral exposure to LPS could modify the profile of plasma metabolites and minerals in periparturient dairy cows. As the basis for this, the hypothesis served other findings of the same study, indicating that oral exposure to increasing doses of LPS stimulates humoral immune responses. 3 Because parenteral exposure to LPS has been shown to affect various plasma metabolites and minerals of cattle in several studies,4,8–11 we further hypothesized that development of an oral tolerance to LPS might positively influence metabolic and mineral responses in dairy cows postpartum.
Indeed, the most important findings of this study were that concentrations of NEFA and BHBA early postpartum were lower, whereas those of glucose, insulin and Zn were greater in the plasma of TRT cows. An excessive mobilization of fat body reserves, resulting in elevated concentrations of NEFA and BHBA in the plasma, is often observed in dairy cows postpartum. 20 Scarcity of glucose around parturition and imbalances in the lipid and carbohydrate metabolite networks, such as excessive plasma NEFA and high concentrations of BHBA postpartum, are predispositions for common metabolic diseases of dairy cattle, such as fatty liver and ketosis.21–23 Therefore, strategies to lower the postpartum peak of NEFA in the plasma and the subsequent release of BHBA from liver hepatocytes postpartum are important in terms of lowering the incidence of fatty liver and ketosis in dairy cows. In this respect, the findings of this study with regard to lowered postpartal concentrations of both NEFA and BHBA in the plasma of cows challenged orally with LPS are of great physiological importance.
The exact mechanism(s) behind the effects of oral LPS challenge in lowering concentrations of NEFA are not well understood at present and require further research. However, it is speculated that immune events associated with the oral administration of LPS might have played a role. In support of this postulate are reports indicating that repeated oral challenges with increasing doses of LPS enhance mucosal immunity against LPS. 3 In that study, concentrations of IgM anti-LPS Abs in the plasma were greater in the LPS-treated cows, suggesting that repeated oral administration of LPS stimulates humoral immune responses, resulting in a greater oral LPS tolerance. 3 Tolerant animals experience a reduced inflammatory response to subsequent exposure to LPS, often perceived as decreased production of pro-inflammatory mediators.1,2 Whilst oral LPS tolerance may not stimulate systemic inflammation,2,3 translocation of large amounts of LPS from gastrointestinal tract postpartum is known to induce metabolic endotoxemia and activation of the pro-inflammatory cascade.24,25 As a result, it is known that TNF-α and cytokines, such as IL-1 and IL-6, are released by activated macrophages once they bind endotoxin. 26 The release of those cytokines is believed to increase the lysis of fat depots in dairy cows, resulting in the release of large amounts of free fatty acids in the plasma and accumulation of fatty acids in the liver in the form of triglycerides.27,28
After parturition, concentration of BHBA in the plasma remained lower for the TRT group, which is related to the lower concentration of plasma NEFA observed. In postpartum cows, BHBA typically originates from oxidation of NEFA in hepatic mitochondria. The periparturient period, as confirmed by the CTR group, is characterized by an increase in the concentration of plasma NEFA followed by an increase in plasma BHBA. 29 Other research involving intravenous administration of LPS in non-lactating heifers or mid-lactating cows indicates that endotoxin perturbs plasma NEFA and BHBA concentrations. For example, Steiger et al. 8 and Waldron et al. 4 reported that parenteral administration of LPS was associated with a dramatic decrease of plasma BHBA post-infusion. Although in our study oral LPS did not have an acute effect on plasma BHBA, in the long run it lowered plasma BHBA, which is in agreement with results reported previously by Steiger et al. 8 and Waldron et al. 4 who showed decreased BHBA after intravenous LPS injection.
Other findings of this investigation were that plasma concentrations of three metabolites representing energy metabolism, such as glucose, lactate and insulin, were greater in cows treated orally with LPS. This suggests that TRT cows were in a better energy balance than control cows and they therefore mobilized less body reserves, which is in line with lower concentrations of NEFA and BHBA in the plasma of the latter cows. One of the main problems in the postparturient period is that initiation of lactation and production of large amounts of milk increase glucose demand for milk synthesis at a time when cows are in a negative energy balance. 30 Interestingly, plasma glucose in cows treated with LPS did not follow a biphasic pattern, but showed a greater sustained plasma glucose in the LPS-treated cows. The same pattern was also followed by the profile of insulin. Earlier studies with single i.v. administration of LPS showed an immediate glucose peak after administration, with a steady long-term decline. 8 Although the precise mechanism by which the glucose concentration declined is not clear, it has been reported that pro-inflammatory cytokines released during the immune response to endotoxin enhance glucose uptake by immune cells/macrophages and peripheral tissues, and inhibit the rate-limiting enzyme responsible for gluconeogenesis, thereby decreasing glucose concentration.31–33
Greater concentrations of glucose at simultaneously elevated insulin plasma concentrations in response to oral LPS challenge may indicate a systemic insulin resistance in these cows. Constant plasma glucose at simultaneously increased plasma insulin concentrations has been reported after intramammary LPS challenge in dairy cows.11,34 Waldron et al. 11 interpreted the latter effect as a consequence of increased hepatic gluconeogenesis and simultaneously decreased mammary glucose utilization after LPS challenge. However, an association between inflammation and insulin insensitivity has been described in several studies.34,35 Although the exact mechanisms behind inflammation-related insulin insensitivity are not yet fully understood, it has been suggested, on one hand, that decreased peripheral glucose utilization by inflammation aims to provide energy precursors for the immune system.33,34 On the other hand, however, increasing levels of insulin while maintaining elevated, but physiologically normal, glucose concentrations might be seen as a positive physiological event in early lactating dairy cows. 36 Insulin resistance becomes a health problem when early lactation cows are hyperglycemic. Based on glucose concentrations, the LPS-treated cows of this study had normal glucose concentration in the plasma, whereas the control cows were hypoglycemic in early lactation. Also, based on the insulin concentrations, the LPS-treated cows had normal insulin values in early lactation, whereas the control cows were hypoinsulinemic. Thus, in terms of the glucose:insulin ratio, the LPS-treated cows in early lactation were similar to control and LPS-treated cows in a later lactation phase, which indicates no evident risk of insulin resistance for these cows.
The results of this study also showed that oral administration of LPS increased the concentration of lactate in the plasma. Previous investigations with multiparous and primiparous cows showed an increase in the concentration of plasma lactate 3 h after i.v. infusion of LPS that remained elevated up to 48 h post-challenge.8,37 This might be explained by the inhibiting effect of LPS on phosphoenolpyruvate carboxykinase (PEPCK), a gluconeogenesis rate-limiting enzyme. Recently, it was reported that gene expression of PCK2, a precursor of PEPCK, was significantly lowered. 38 As PEPCK is used for lactate recycling, the circulating levels of lactate increase. Although, in this experiment, the concentration of lactate increased after administration of LPS, the observed increase was within the normal ranges, which might have contributed positively to the energy metabolism.
The concentration of cortisol in the plasma was greater in the TRT group. However, data showed that only during the first exposure to oral LPS did cortisol result in much greater concentrations during the first 3 h post-exposure, whereas there was no difference between the oral LPS and CTR cows for LPS challenges of doses 2 and 3. In general, a greater concentration of plasma cortisol for both CTR and TRT could be a direct result of the stress occurring with handling and restraining of the cows to fit the catheters on the first sampling day. Elsasser et al. exposed beef steers to i.v. LPS and observed a greater, and longer-lasting, increase in the concentration of plasma cortisol. 39 Interestingly, in other studies, it was reported that repeated exposure to endotoxin did not alter the plasma concentration of cortisol.6,40
Repeated and increasing oral doses of LPS did not affect the concentration of cholesterol in both overall and dose-related ANOVA analyses. Our results differ with parenteral endotoxin models where LPS injection resulted in lower concentrations of cholesterol in the plasma of treated cows.6,8 Levels et al., 41 using experimental endotoxemia models, reported low total cholesterol and low content of cholesterol in major lipoproteins, such as very low-density lipoprotein, low-density lipoprotein and high-density lipoprotein combined with high concentrations of IL-6, IL-8, C-reactive protein and LPS-binding protein. As our treatment did not affect cholesterol concentration, it is assumed that the low-grade inflammatory state present in the LPS-tolerant cows does not markedly affect metabolism of cholesterol around parturition. However, there were significant day-to-day variations in the profile of glucose, lactate and cholesterol in particular before parturition. The reason for this variation may also be related to daily fluctuations in the patterns of feed intake of the cows as these plasma variables are very responsive to short-term intake patterns and the related changes in energy metabolism. 42
Transition from pregnancy to lactation is also known to be characterized by major changes in mineral metabolism, including depression of plasma concentrations of Ca and Zn, and increased plasma Cu.43,44 Indeed, plasma Ca was lowered in both groups of cows around the day of calving, whereas the drop of plasma Zn was greater in CTR cows in this study. In previous studies, the LPS challenge has been shown to lower, 11 or not, 6 plasma Ca in dairy cows. In contrast with the Ca results, there were differences between treatments in both trace elements tested in this study. Both Zn and Cu are important trace minerals essential for normal functioning of many enzymes and immune events in the organism. Withdrawal of Zn from plasma during inflammation and infection has been suggested to be part of the immune response because high plasma Zn has been shown to impair phagocytic functions. 45 Pro-inflammatory cytokines, such as IL-6, stimulate the release of metallothionein, which is known to sequester Zn. 46
Greater Cu concentration in the plasma is an indicator of the development of inflammatory processes, which are known to cause significant perturbations of Cu metabolism.17,47,48 Moreover, previous research demonstrates a similar increase in both plasma Cu and ceruloplasmin during inflammatory conditions.48,49 Ceruloplasmin is a Cu-containing protein produced by hepatocytes under stimulation by pro-inflammatory cytokines, such as IL-1, IL-6 and TNF-α. 50 In fact, ceruloplasmin contains 95% of all plasma Cu and its blood concentrations are highly sensitive to inflammatory signals. 47 Therefore, our data support the hypothesis that control cows were in a higher inflammatory condition than their TRT counterparts during the postpartum period.
Conclusion
Altogether, the results of this study provide new evidence that orally-administered LPS in periparturient dairy cows modulated several measured blood metabolites and minerals. Treatment with LPS was associated with greater glucose and insulin, and lowered concentrations of both NEFA and BHBA in the plasma of treated cows, indicating that LPS-treated animals either did not undergo a severe fat mobilization process or NEFA usage was increased in those cows after parturition. Furthermore, oral LPS challenge had no effect on plasma Ca, but increased the concentration of Zn and lowered that of Cu. Further research with a larger cohort of animals is warranted to understand the underlying mechanisms behind the effects of oral LPS challenge, and also to investigate whether this treatment can be used as a prophylactic intervention against metabolic and mineral perturbations associated with inflammation in periparturient dairy cows.
Footnotes
Acknowledgements
We are thankful to D. G. V. Emmanuel, R. P. Pandian and R. Psutka for their technical help, and to the technical staff at the Dairy Research and Technology Center, University of Alberta, for their help with, and care of, the cows.
Funding
Financial support for this research was provided by Alberta Milk (Edmonton, Alberta, Canada), Alberta Livestock Industry Development Fund (Edmonton, Alberta, Canada), and the Natural Sciences and Engineering Research Council of Canada (Ottawa, Ontario, Canada), which is gratefully acknowledged.