
Abstract
To determine differences between peripheral blood mononuclear cells and the plasma metabolites in patients with impaired fasting glucose or type 2 diabetes and healthy controls. In all, 65 nononobese patients (aged 30–70 years) with impaired fasting glucose or type 2 diabetes and 65 nonobese sex-matched healthy controls were included, and fasting peripheral blood mononuclear cell and plasma metabolomes were profiled. The diabetic or impaired fasting glucose patients showed higher circulating and peripheral blood mononuclear cell lipoprotein phospholipase A2 activities, high-sensitivity C-reactive protein and tumour necrosis factor-α than controls. Compared with controls, impaired fasting glucose or diabetic subjects showed increases in 11 peripheral blood mononuclear cell metabolites: six amino acids (valine, leucine, methionine, phenylalanine, tyrosine and tryptophan),
Introduction
A number of studies have reported on the metabolic patterns in prediabetic or diabetic patients.1–6 In a nested case–control study design, the Framingham Offspring study found that three branched-chain amino acids (isoleucine, leucine and valine) and two aromatic amino acids (tyrosine and phenylalanine) could predict the future development of diabetes in otherwise healthy individuals. 1 Xu et al. 2 recently reported that impaired fasting glucose (IFG) and type 2 diabetes (T2D) are characterized by abnormalities in amino acids, fatty acids, glycerophospholipids and sphinglomyelin metabolism. In addition, Menni et al. 3 found a novel association between the branched-chain keto acid metabolite, 3-methyl-2-oxovalerate and IFG in both plasma and urine.
In early-onset T2D, peripheral blood mononuclear cells (PBMCs) are sensitive to a variety of stimuli; thus, individuals with T2D show a greater inflammatory reaction of PBMC than those without diabetes. 7 PBMC consist of monocytes and lymphocytes. Blood monocytes play a key role in the onset and development of the inflammatory reaction by generating bioactive molecules, such as proinflammatory cytokines and lipoprotein phospholipase A2 (Lp-PLA2).7,8 Inflammatory processes have been increasingly recognized as a critical step in the pathogenesis of diabetes. 9 Therefore, measuring the PBMC metabolome could provide a novel source of IFG/T2D biomarkers. 10 The aim of this study was to assess the differences in metabolites in PBMC and in the plasma of patients with IFG or T2D compared to healthy controls.
Methods
Subjects and study design
Nonobese subjects [18.5 ⩽ body mass index (BMI) < 30 kg/m2] with 30–70 years old were recruited from the routine check-ups at the National Health Insurance Corporation Ilsan Hospital, Goyang, Republic of Korea, from January to June 2013. Based on the data screened from Ilsan Hospital, subjects who were in IFG (100 ⩽ fasting glucose < 126 mg/dL) or newly diagnosed T2D (fasting glucose ⩾ 126 mg/dL) were referred to the Department of Family Medicine or Internal Medicine. Subjects were excluded if they took any medications or supplements known to affect lipid metabolism. Also, diagnosed with dyslipidemia, hypertension, liver/cardiovascular/cerebrovascular/renal disease or cancer; history of medication or alcohol abuse or were pregnant or breast feeding. A total of 65 nonobese subjects with IFG or newly diagnosed T2D were enrolled, and 65 nonobese sex-matched healthy subjects were enrolled for the control group (Table 1). The macronutrient composition of each subject’s usual diet was that of a typical diet, which is consumed by a substantial number of Koreans. All subjects provided written informed consent which was approved by the Institutional Review Board of Yonsei University and Ilsan Hospital and performed according to the Helsinki Declaration.
Clinical and biochemical characteristics.
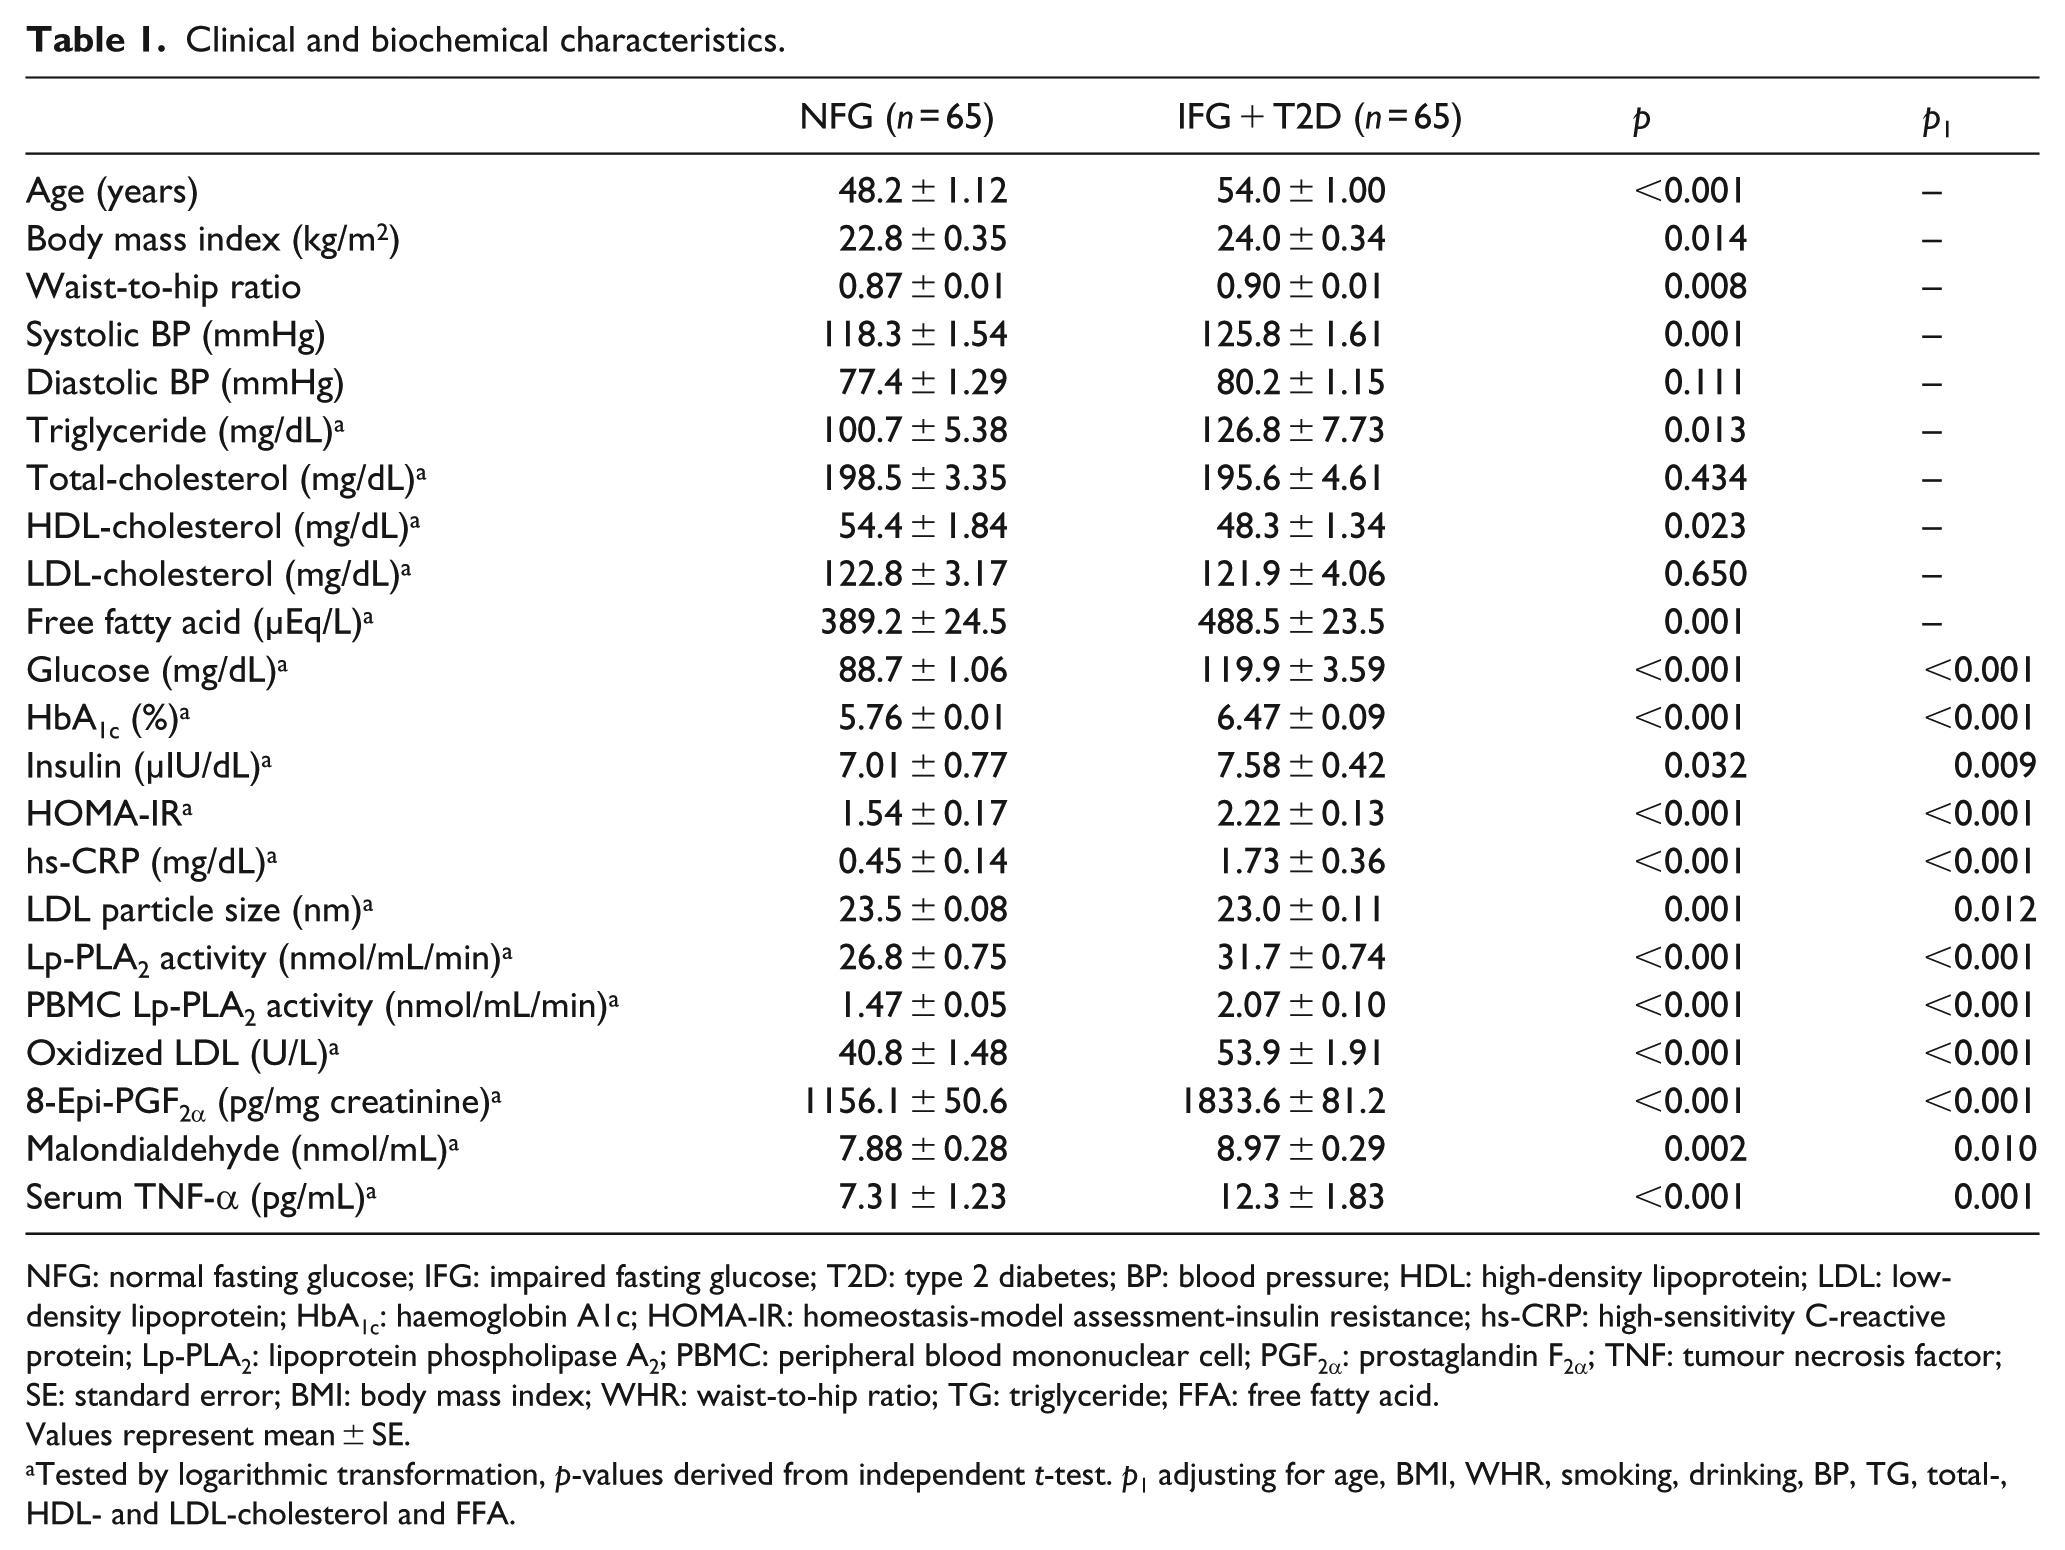
NFG: normal fasting glucose; IFG: impaired fasting glucose; T2D: type 2 diabetes; BP: blood pressure; HDL: high-density lipoprotein; LDL: low-density lipoprotein; HbA1c: haemoglobin A1c; HOMA-IR: homeostasis-model assessment-insulin resistance; hs-CRP: high-sensitivity C-reactive protein; Lp-PLA2: lipoprotein phospholipase A2; PBMC: peripheral blood mononuclear cell; PGF2α: prostaglandin F2α; TNF: tumour necrosis factor; SE: standard error; BMI: body mass index; WHR: waist-to-hip ratio; TG: triglyceride; FFA: free fatty acid.
Values represent mean ± SE.
Tested by logarithmic transformation, p-values derived from independent t-test. p1 adjusting for age, BMI, WHR, smoking, drinking, BP, TG, total-, HDL- and LDL-cholesterol and FFA.
Anthropometric parameters and sample collection
To calculate BMI (kg/m2), body weight and height were measured in the morning with participants unclothed and without shoes. Waist circumference was measured at the umbilical level at the end of normal expiration while standing. After a 20-min rest, blood pressure (BP) was measured two times with an automatic BP monitor (FT-200S; Jawon Medical, Gyeongsan, Republic of Korea). After a 12-h fasting period, blood and urine samples were collected. The blood samples were collected in ethylenediaminetetraacetic acid (EDTA)–treated tubes and used for the isolation of PBMCs or were separated into plasma, aliquoted and stored at−80°C until further analysis. The urine samples were collected in polyethylene tubes and stored at −20°C until further analysis after aliquoted.
Biochemical parameters and PBMC isolation
The lipid profile including total-cholesterol, triglyceride (TG) and free fatty acid (FFA) were measured using a Hitachi 7600 autoanalyzer (Hitachi Ltd, Tokyo, Japan). For separating high-density lipoprotein (HDL)-cholesterol by dextran-sulfate magnesium precipitation, the enzymatic method was used. The low-density lipoprotein (LDL)-cholesterol concentration was calculated by the Friedewald equation. Fasting glucose levels were analysed by the hexokinase method using a Hitachi 7600 autoanalyzer. Insulin levels were measured by an immunoradiometric assay kit from DIAsource ImmunoAssays S.A. (Louvain, Belgium). IR was calculated by the homeostasis-model assessment (HOMA). Haemoglobin A1c (HbA1c) was measured by immonoturbidimetric analysis.
Serum high-sensitivity C-reactive protein (hs-CRP) was measured with an ADVIA 2400 Clinical Chemistry System (Siemens Ltd, Tarrytown, NY, USA) using a commercially available, hs-CRP-Latex(II) X2 kit (Denka-Seiken Co., Ltd, Tokyo, Japan). The Lp-PLA2 activity in PBMC supernatant and plasma was measured using a modified high-throughput radiometric activity assay. 11 Plasma malondialdehyde (MDA) was measured from thiobarbituric acid-reactive substances (TBARS) using a TBARS Assay Kit (ZeptoMetrix Co., Buffalo, NY, USA). LDL particles were isolated by sequential flotation ultracentrifugation and particle size was examined following previous study. 12 Plasma oxidized (ox)-LDL was measured using an enzyme immunoassay (Mercodia AB, Uppsala, Sweden) and the resulting colour reaction was determined at 450 nm on a Wallac Victor 2 multilabel counter (Perkin-Elmer Life Sciences, Boston, MA, USA). 8-Epi-prostaglandin F2α (8-epi-PGF2α) was measured using a Urinary Isoprostane ELISA kit (Oxford Biomedical Research Inc., Rochester Hills, MI, USA). Urinary creatinine was determined by the creatinine Jaffe method. Serum tumour necrosis factor (TNF)-α concentrations were measured using the Bio-Plex Reagent Kit and a Bio-Plex (Bio-Rad Laboratories, Inc., Hercules, CA, USA) according to the manufacturer’s instructions. Procedure of isolating PBMC was followed as per previous studies.13,14
Nontargeted metabolic profiling of PBMC and plasma
The method for nontargeted metabolic profiling of PBMC and plasma progressed in the same workflow; PBMC and plasma extract sample preparation, analysis, using an ultra-performance liquid chromatography (UPLC) and linear-trap quadrupole (LTQ)-Orbitrap XL mass spectrometry (MS), data processing and identification of PBMC and plasma metabolites were demonstrated as in previous study. 15
Statistical analyses
Statistical analyses were performed with SPSS v. 21.0 (IBM/SPSS, Chicago, IL, USA) and a two-sided p-value of <0.05 was considered statistically significant. Skewed variables were logarithmically transformed for statistical analyses. Differences in biochemical characteristics between two groups were tested using Student’s independent t-test. General linear model UNIANOVA statistical procedure was applied to compare the parameter changes between the two groups by adjusting for the baseline values. Pearson’s and partial correlation coefficients were used to examine the relationships between variables over time. False discovery rate–adjusted q-values were computed using the fdrtool package in R version 3.1.2. Heat maps were created to visualize and evaluate correlations among metabolites and biochemical characteristics in the study populations. SIMCA-P+ software version 12.0 (Umetrics, Umeå, Sweden) was used for performing a multivariate analysis on plasma metabolites. 16 To classify the discrimination between the two groups, a partial least-squares discriminant analysis (PLS-DA) was applied for visualizing the score plot with the first- and second-PLS components. To validate the model, a 7-fold validation was applied to the PLS-DA model, and the reliabilities of the model were further rigorously validated by a permutation test (n = 200).
Results
Clinical characteristics and nutrient intake
The clinical and biochemical characteristics of healthy controls with normal fasting serum glucose level and subjects with IFG or newly diagnosed T2D are shown in Table 1. There were no significant differences in clinical characteristics, such as male/female distribution (25/40 vs. 25/40), education level, smoking, drinking and total calorie and macronutrient intake (data not shown), between the control and patient groups. The patient group was significantly older and heavier and had higher systolic BP, serum TG and FFA compared to controls. After adjusting for age, BMI, waist-to-hip ratio (WHR), BP, smoking, drinking and serum lipid profiles, when compared with control subjects those with IFG or T2D showed higher glucose, HbA1C, insulin, HOMA-IR, hs-CRP, circulating plasma and PBMC Lp-PLA2 activities, ox-LDL, 8-epi-PGF2α, MDA and TNF-α. The patient group also had a smaller LDL particle size compared with controls (Table 1).
PBMC and plasma metabolic profiling
Nontargeted metabolic pattern analysis
The MS data of PBMC metabolites were scaled by unit variance (UV) and analysed with a PLS-DA score scatter plot (Figure 1(a)). The two-component PLS-DA score scatter plot of the PBMC metabolites showed distinct clustering and clear separation for each of the healthy controls away from those subjects with IFG or T2D. Both groups could be clearly differentiated from each other by the primary component t(1) or the secondary component t(2) based on the model with R2X(cum) and R2Y(cum) values of 0.256 and 0.682, respectively, indicating a good fit of the data. The Q2Y(cum) value of 0.608 provides an estimate of the predictive ability of this model. The PLS-DA model was validated using a permutation test, which indicated an R2Y intercept value of 0.258 and a Q2Y intercept value of −0.185.
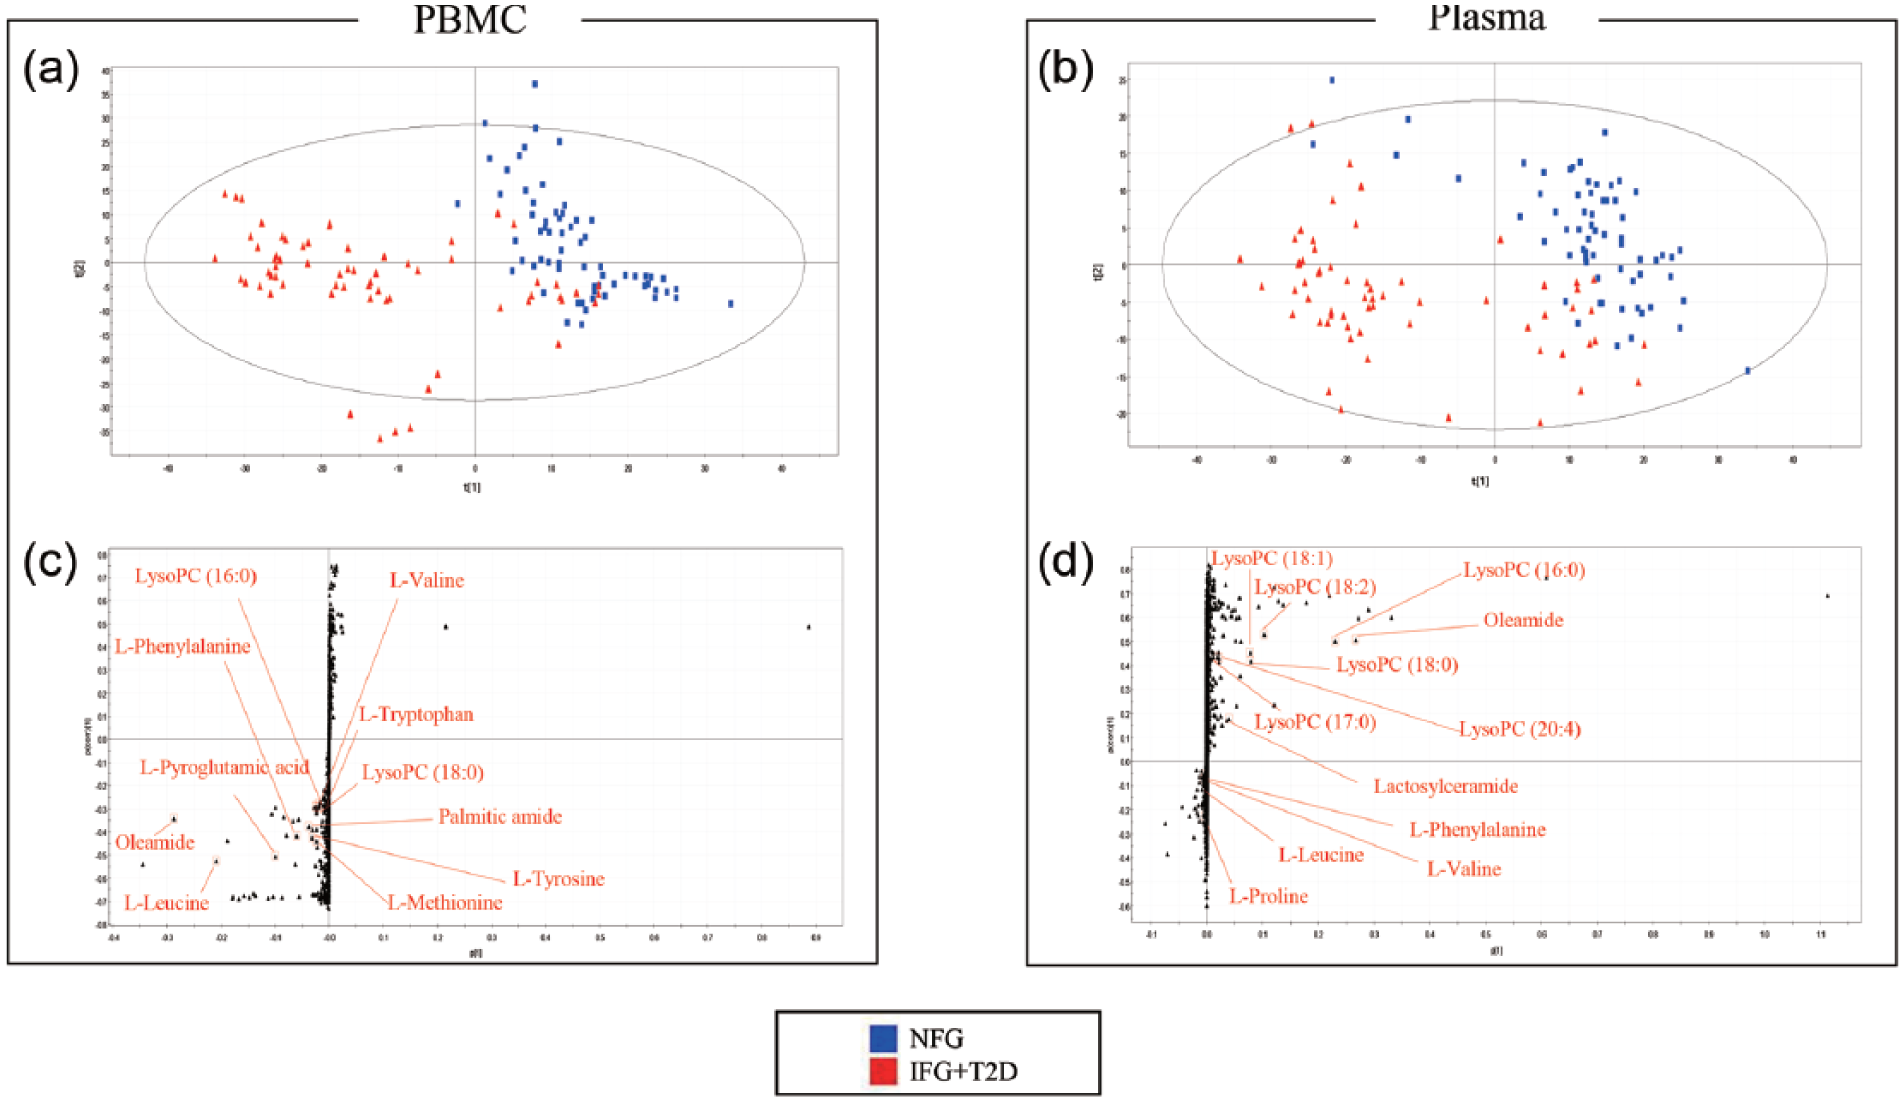
Identification of PBMC and plasma metabolites with significantly altered levels in each subgroup: (a) score scatter plot of PBMC metabolites from PLS-DA models classifying in NFG (n = 65) and IFG or T2D group (n = 65); (b) score scatter plot of plasma metabolites from PLS-DA models classifying in NFG (n = 65) and IFG or T2D group (n = 65) and (c and d) S-plots for covariance (p) and the reliability correlation [p(corr)] from PLS-DA models.
The MS data of plasma metabolites were scaled by UV and analysed with a PLS-DA score scatter plot (Figure 1(b)). The two-component PLS-DA score scatter plot of the plasma metabolites showed distinct clustering and clear separation for each of the healthy controls away from that observed for subjects with IFG or T2D. Both groups could be clearly differentiated from each other by the primary component t(1) or the secondary component t(2) based on the model with R2X(cum) and R2Y(cum) values of 0.12 and 0.708, respectively, indicating a good fit of the data. The Q2Y(cum) value of 0.414 provides an estimate of the predictive ability of the model. The PLS-DA model was validated using a permutation test, which indicated an R2Y intercept value of 0.486 and a Q2Y intercept value of −0.0496. To identify the metabolites that contributed to the differentiation between healthy controls and IFG or diabetic subjects, S-plots of p(1) and p(corr)(1) were generated using centring (Figure 1(c) and (d)). The S-plot revealed that metabolites with higher or lower p(corr) values were more relevant for discriminating between the two groups.
Identification of PBMC metabolites
Of 1948 PBMC metabolites, those that correlated with a separation between the groups were identified by the variable important in the projection (VIP) parameter generated from centred data. VIP values >1.0 were considered highly relevant for group differences. Thirty-six metabolites were selected based on VIP values >1.0; 11 of these were previously identified, and 25 were unknown. Eleven PBMC metabolites (VIP > 1.0) are shown in Table 2. The normalized peak intensities of six amino acids (valine, leucine, methionine, phenylalanine, tyrosine and tryptophan) were significantly higher in PBMCs of IFG or diabetic subjects compared to those of control subjects (all q-values <0.001).
Identification of PBMC metabolites.
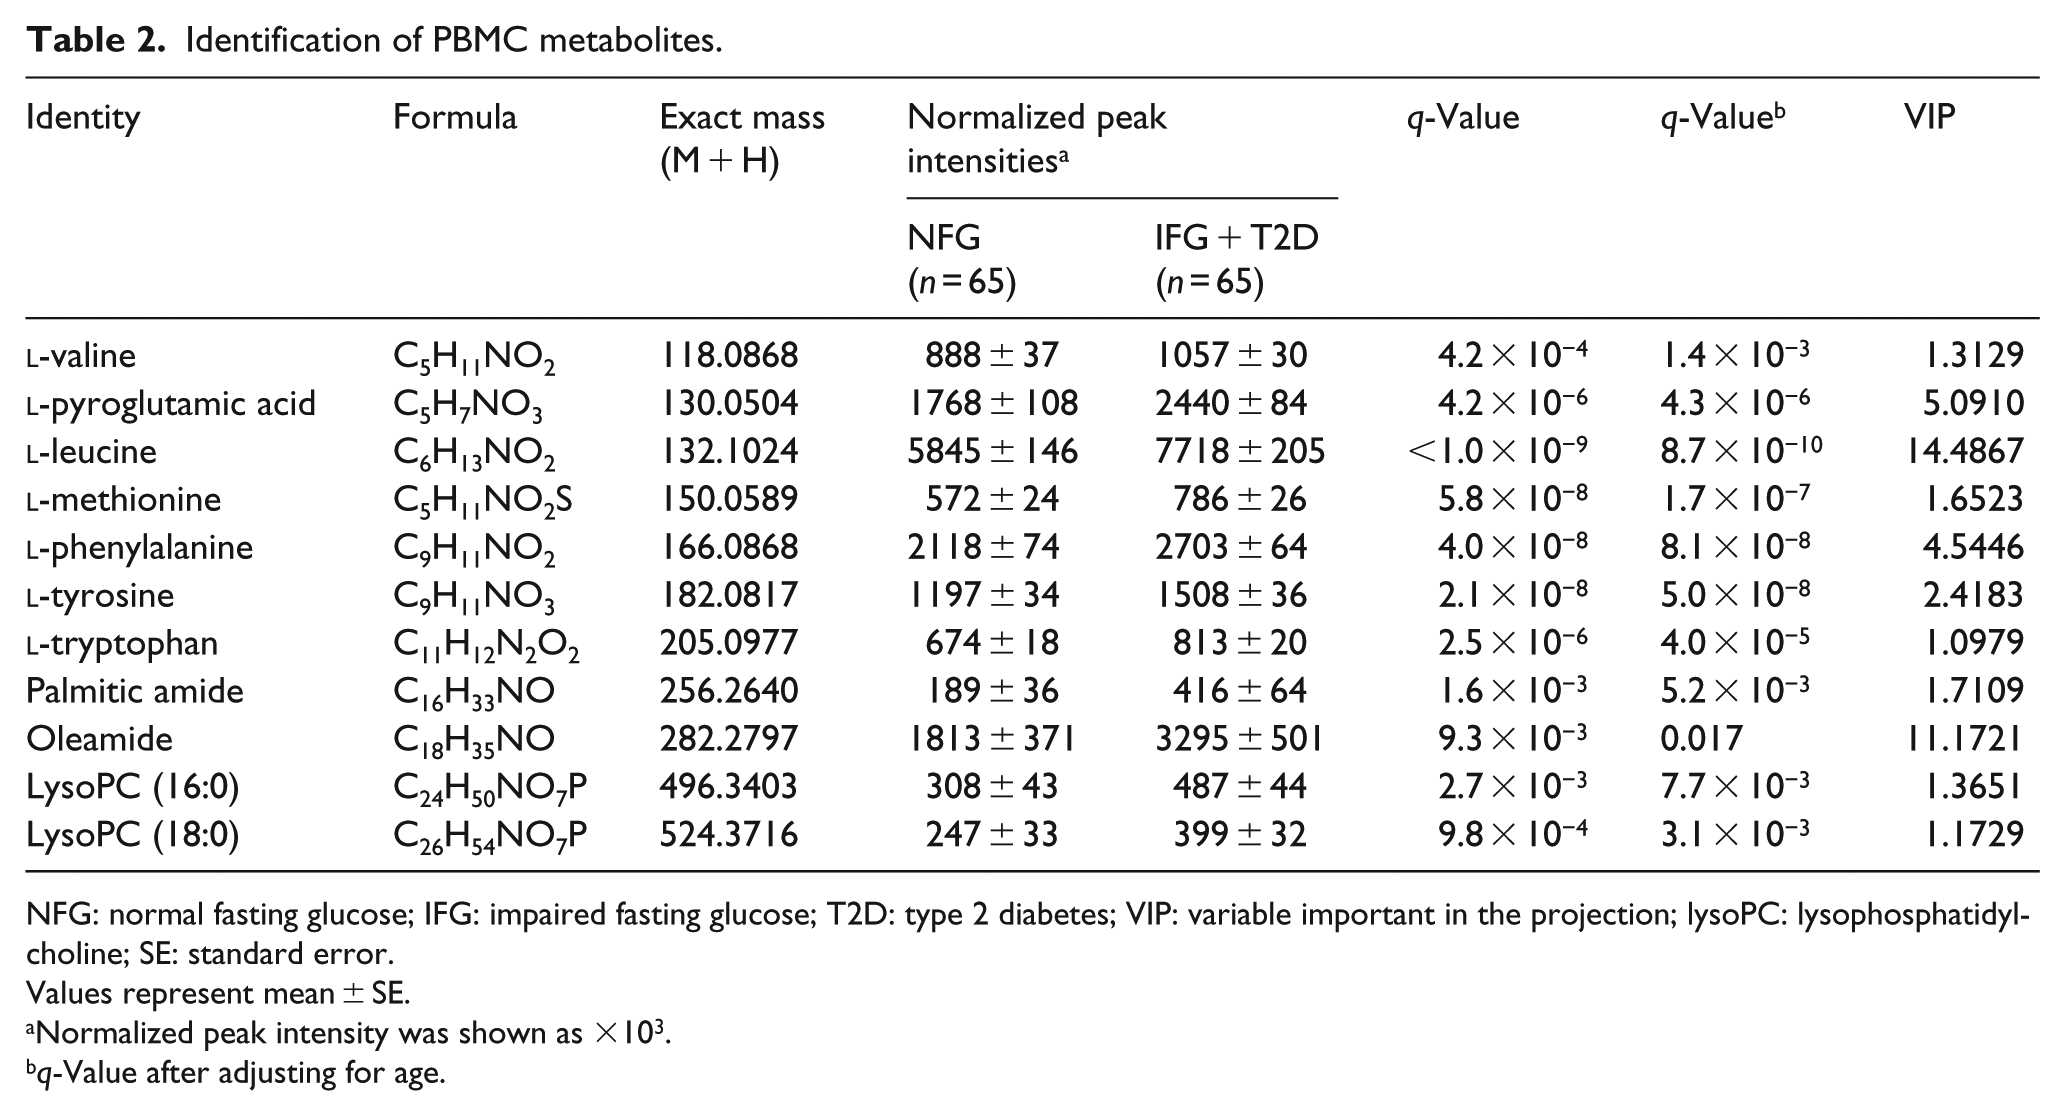
NFG: normal fasting glucose; IFG: impaired fasting glucose; T2D: type 2 diabetes; VIP: variable important in the projection; lysoPC: lysophosphatidylcholine; SE: standard error.
Values represent mean ± SE.
Normalized peak intensity was shown as ×103.
q-Value after adjusting for age.
Identification of plasma metabolites
Among 4164 metabolites in the plasma, we identified those that played important roles in the separation between the groups by selecting according to the VIP parameter generated from centred data. Eighty-one plasma metabolites were selected based on VIP values >1.0; 12 of these metabolites and PCs were previously identified, and 69 metabolites were unknown. A total of 12 plasma metabolites and PCs are shown in Table 3. The normalized peak intensities of three amino acids (proline, valine and leucine) were significantly higher in the plasma of IFG or diabetic subjects compared to the peak intensities observed in control subjects (both q-values <0.05) before and after adjusting for age. Five lysoPC containing C16:0, C17:0, C18:2, C18:1 and C18:0 were significantly lower in the plasma of IFG or diabetic subjects compared with control subjects; however, significance of these plasma metabolites disappeared after adjusting for age (Table 3).
Identification of plasma metabolites.
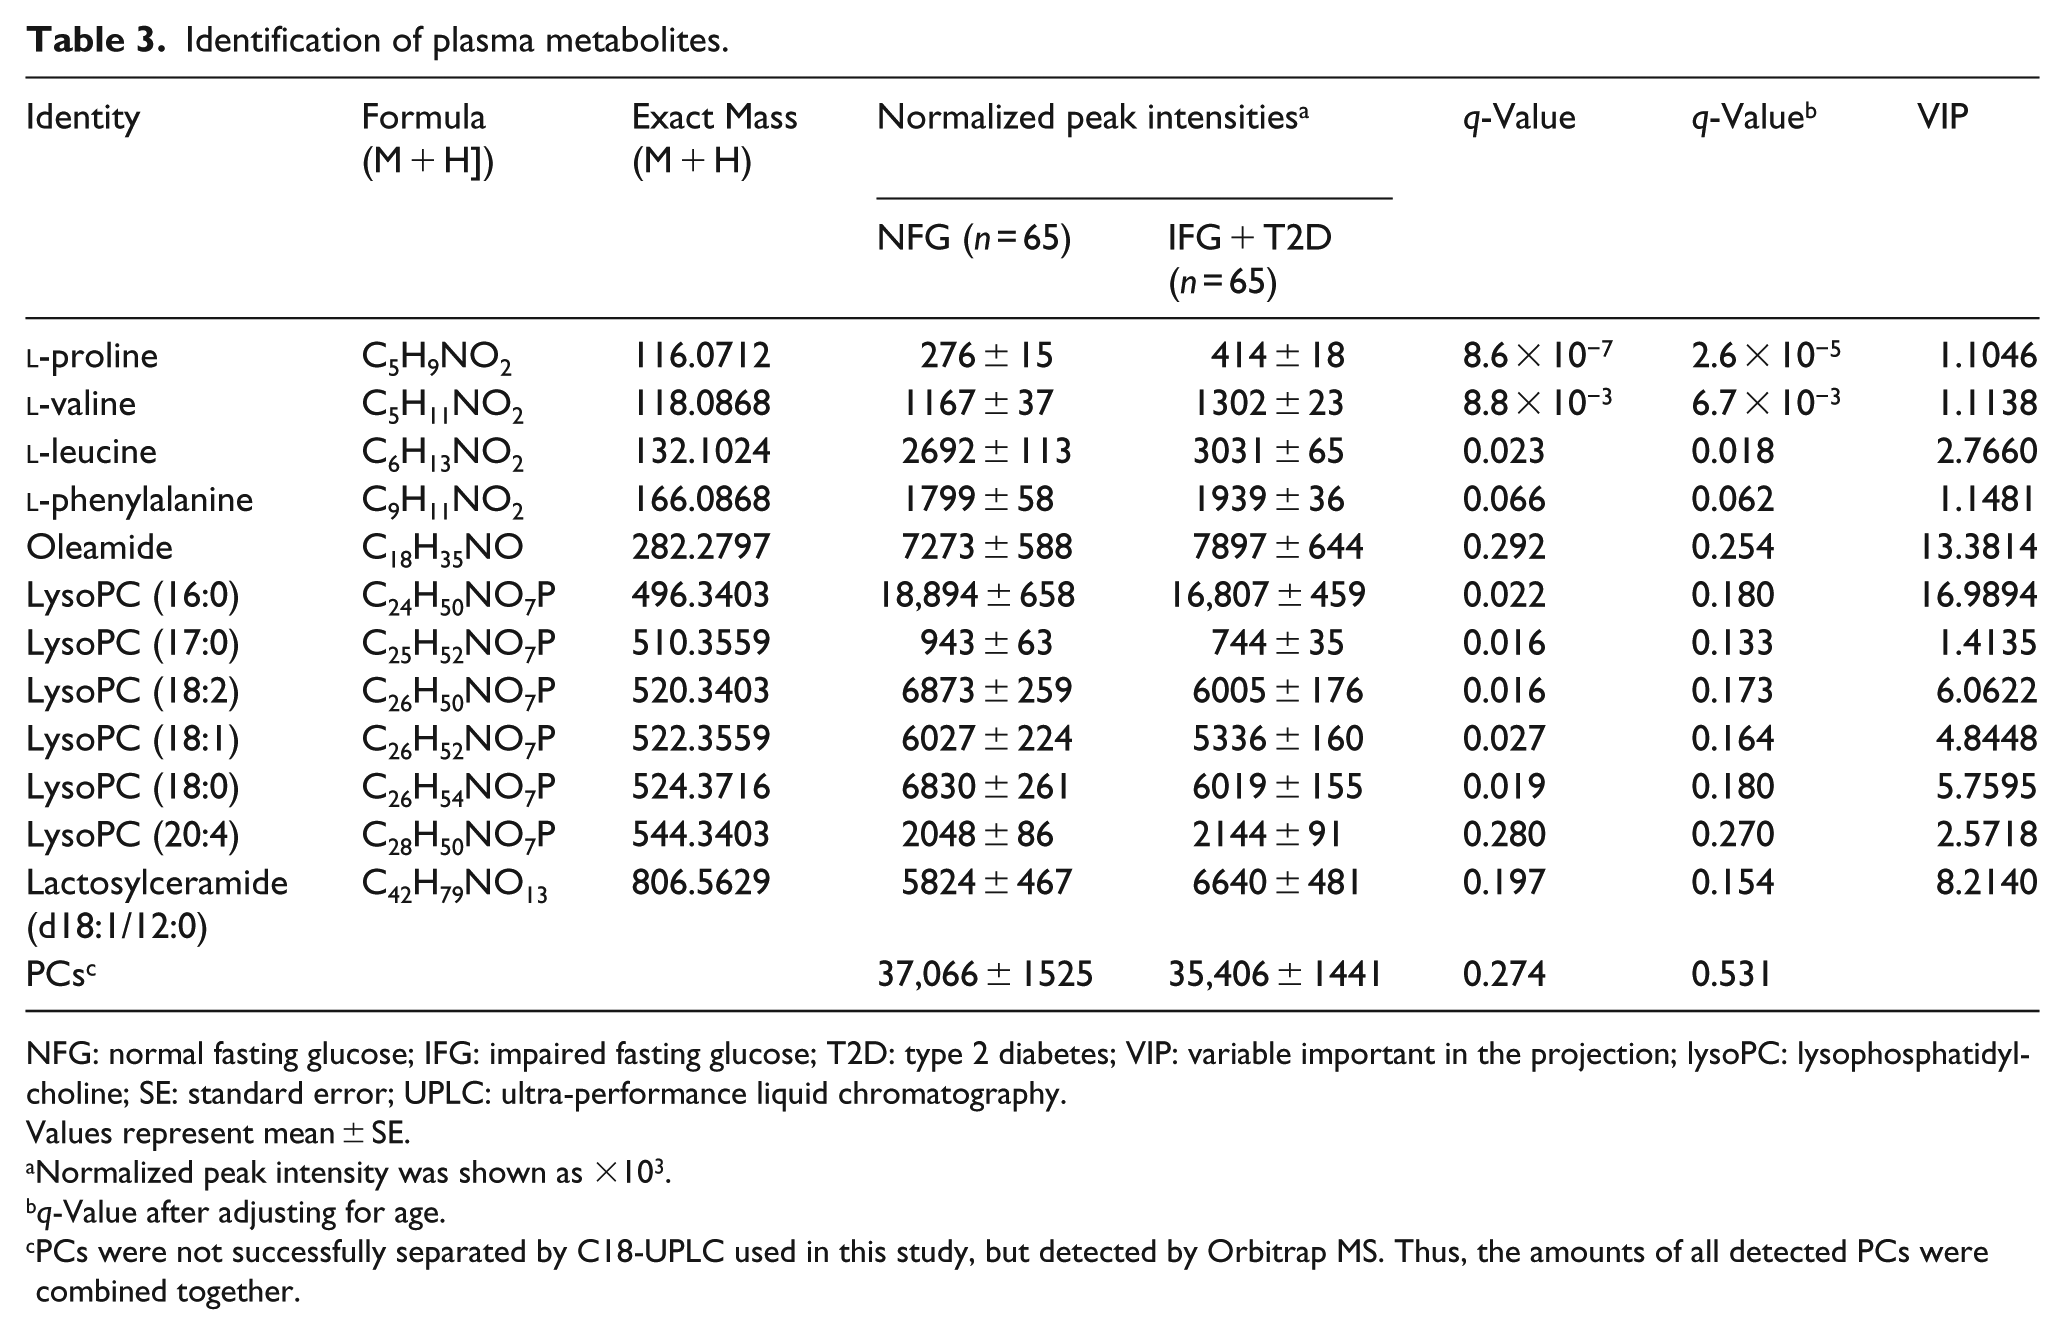
NFG: normal fasting glucose; IFG: impaired fasting glucose; T2D: type 2 diabetes; VIP: variable important in the projection; lysoPC: lysophosphatidylcholine; SE: standard error; UPLC: ultra-performance liquid chromatography.
Values represent mean ± SE.
Normalized peak intensity was shown as ×103.
q-Value after adjusting for age.
PCs were not successfully separated by C18-UPLC used in this study, but detected by Orbitrap MS. Thus, the amounts of all detected PCs were combined together.
Correlations among fasting glucose, plasma and PBMC Lp-PLA2 activities, biochemical parameters and major PBMC and plasma metabolites
The correlation matrix among fasting glucose, plasma and PBMC Lp-PLA2 activities, biochemical parameters and major PBMC and plasma metabolites was computed for all subjects (n = 130) as well as for the control and patient groups (Figure 2). In all subjects, fasting glucose, plasma and PBMC Lp-PLA2 activities, biochemical parameters and major PBMC and plasma metabolites were highly correlated. For example, fasting glucose correlated positively with HOMA-IR, ox-LDL, plasma and PBMC Lp-PLA2, hs-CRP, TNF-α, 8-epi-PGF2α, PBMC valine,
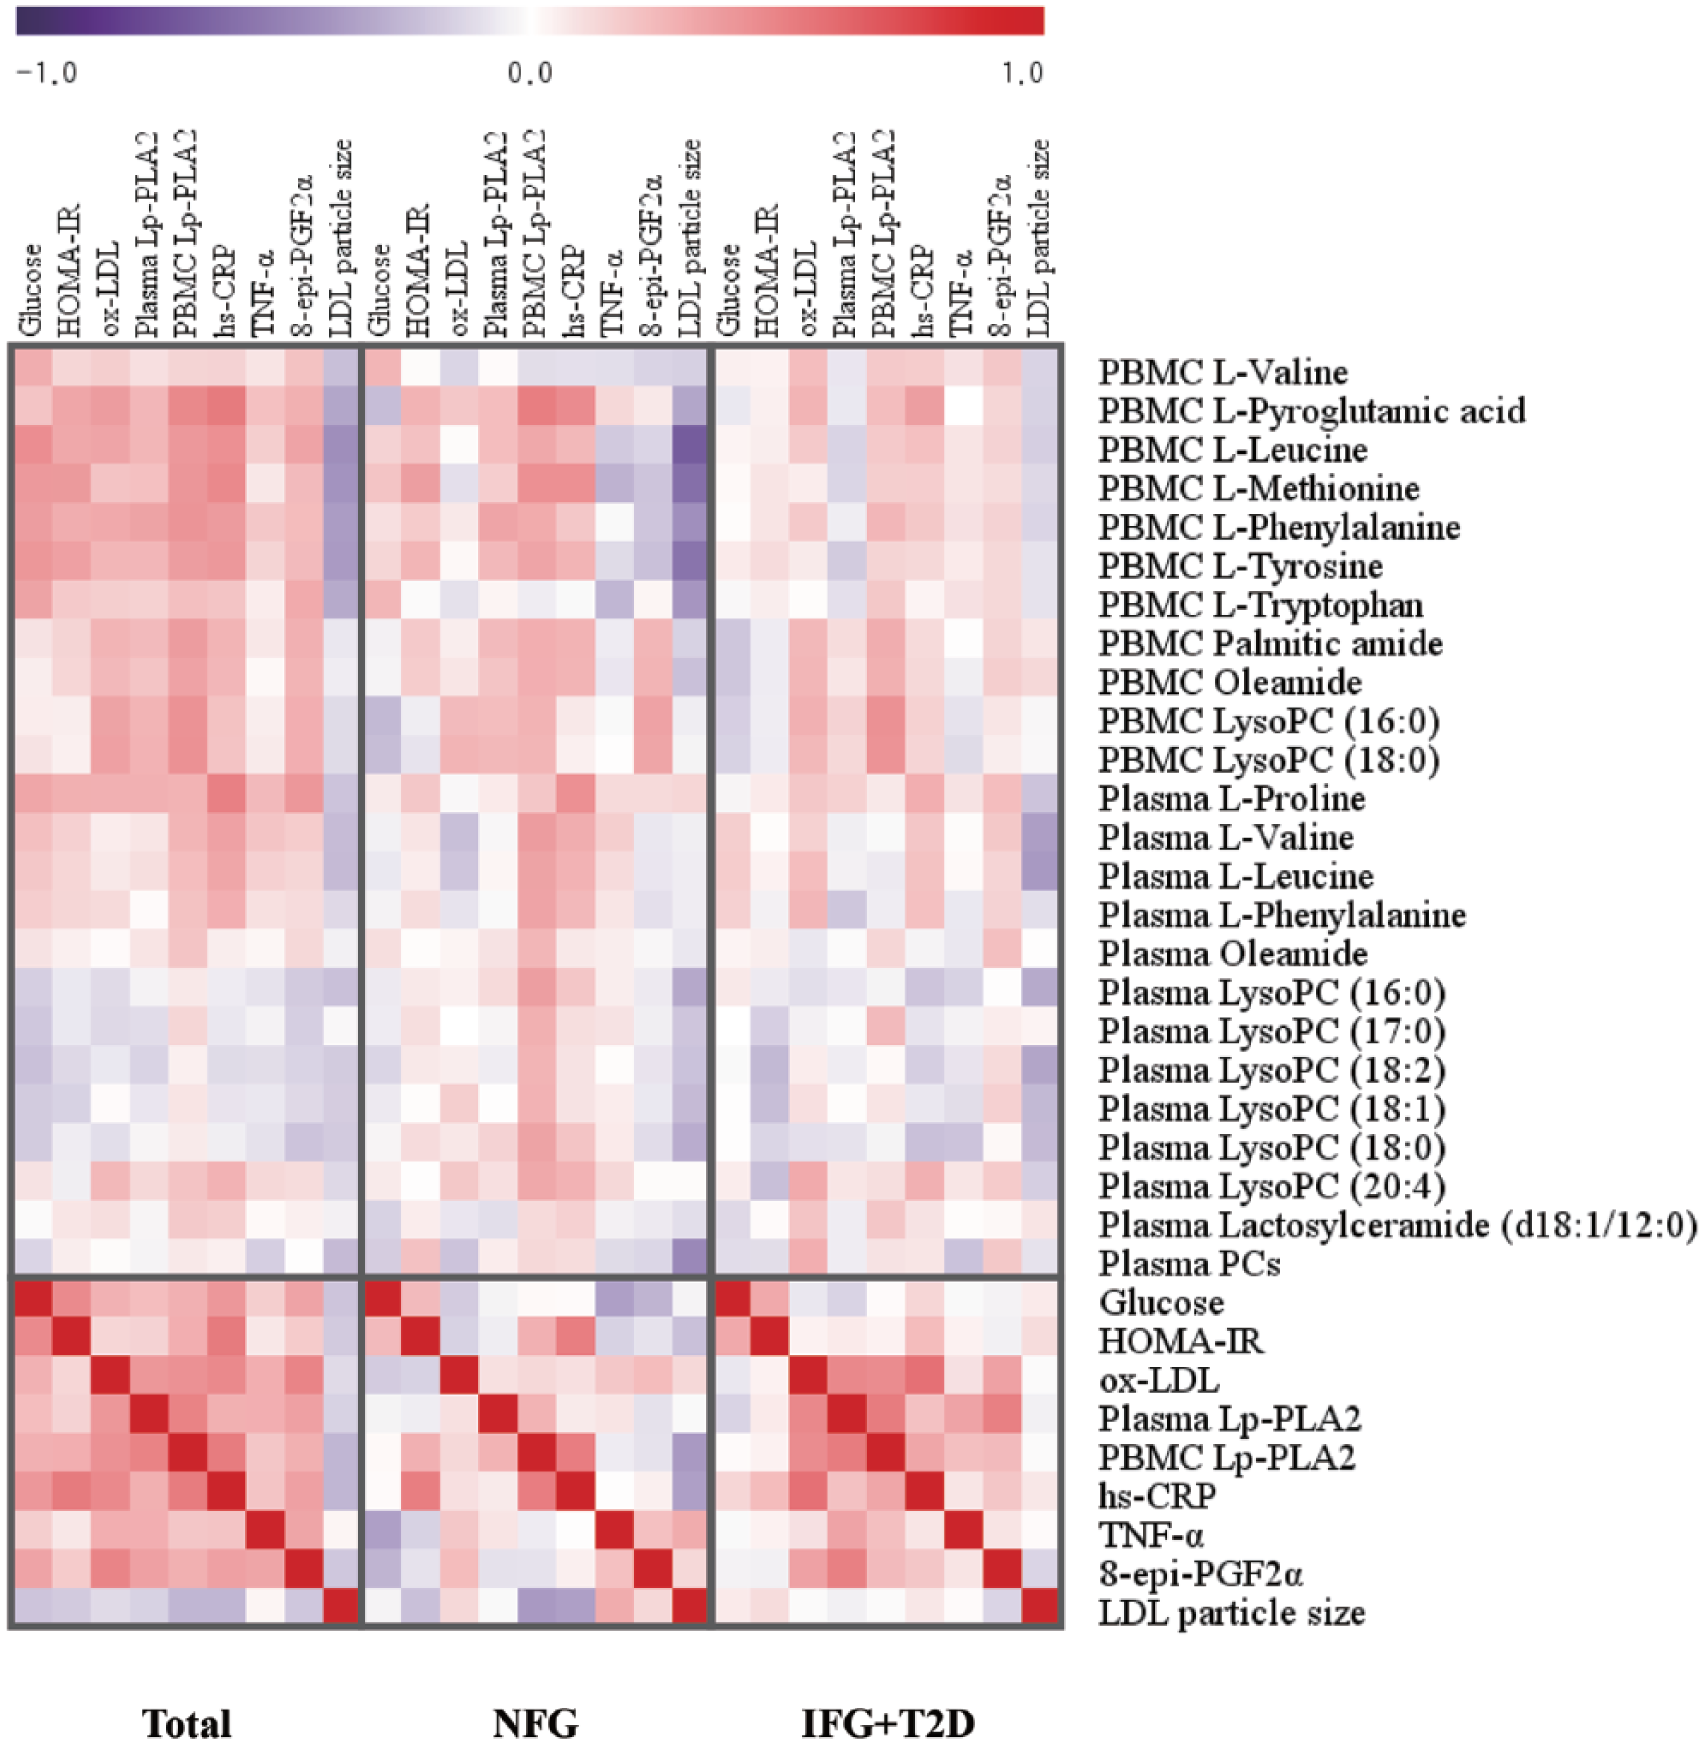
Correlation matrix among metabolites and biochemical characteristics in each group. All biochemical characteristics were tested by logarithmic transformation. Correlations were obtained by deriving a Spearman correlation coefficient. 12 PBMC metabolites, 13 plasma metabolites and 9 biochemical characteristics are listed on the right side of the heat map with the nine biochemical characteristics listed across the top. Red represents a positive correlation, and purple represents a negative correlation.
In the control group, fasting glucose positively correlated with PBMC valine and tryptophan. Plasma Lp-PLA2 activity positively correlated with PBMC Lp-PLA2 (r = 0.273, p = 0.032), phenylalanine, tyrosine and lysoPC 18:0 (r = 0.251, p = 0.048). PBMC Lp-PLA2 activity correlated positively with HOMA-IR, hs-CRP, PBMC leucine, methionine, phenylalanine, tyrosine, palmitic amide, oleamide, lysoPC (16:0; r = 0.273, p = 0.030), lysoPC (18:0; r = 0.266, p = 0.035), plasma valine, leucine, phenylalanine, oleamide and lysoPCs containing C16:0, C17:0, C18:2, C18:1, C18:0 and C20:4. Fasting glucose negatively correlated with LDL particle size.
In the patient group, plasma Lp-PLA2 activity strongly and positively correlated with ox-LDL (r = 0.464, p < 0.001), 8-epi-PGF2α (r = 0.500, p < 0.001), TNF-α and PBMC Lp-PLA2 (r = 0.518, p < 0.001). PBMC Lp-PLA2 activity positively correlated with hs-CRP, TNF-α, ox-LDL (r = 0.445, p < 0.001), PBMC phenylalanine, palmitic amide, oleamide, lysoPC 16:0 (r = 0.421, p < 0.001) and lysoPC 18:0 (r = 0.415, p < 0.001; Figure 2).
Discussion
The major finding of this study is that compared with plasma metabolites, the PBMC metabolites show unique metabolomic features and have a greater difference between patients with IFG or T2D compared to healthy controls. Accounting for IFG- or diabetes-related alterations of PBMC and plasma major metabolites, we identified 11 PBMC metabolites to be significantly different between the control and patient groups. These included six amino acids (valine, leucine, methionine, phenylalanine, tyrosine and tryptophan),
In a nested case–control study design, five plasma branched-chain and aromatic amino acids (isoleucine, leucine, valine, tyrosine and phenylalanine) had significant associations with the development of diabetes. 1 Our cross-sectional investigation also showed PBMC branched-chain and aromatic amino acids and methionine to be significantly elevated in subjects with IFG or T2D. Unlike PBMC metabolites, only three plasma amino acids, proline, valine and leucine, showed significant differences when comparing the control and patient groups. This discrepant finding may indicate divergent mechanisms used by different tissues to control metabolites. Pyroglutamic acid is important in the intracellular transport of free amino acids, and Xu et al. 2 found serum pyroglutamic acid to be lower in patients with diabetes. In contrast, in this study, PBMC pyroglutamic acid was higher in subjects with IFG or T2D. Furthermore, we observed discrepancies between lysoPCs in plasma compared with that of PBMC. We detected lower lysoPCs in the plasma and higher lysoPCs in PBMC in subjects with IFG or T2D compared with controls.
Compared with healthy patients, those patients with IFG or T2D showed an increase in plasma ox-LDL as well as elevations in PBMC Lp-PLA2 activities and PBMC lysoPCs. The observed strong association between PBMC Lp-PLA2 and ox-LDL supports previously published data demonstrating a direct effect of ox-LDL on the expression of Lp-PLA2 in THP-1 monocytes. 18 Indeed, plasma ox-LDL has been suggested to have a causal role in up-regulating Lp-PLA2 messenger RNA (RNA) expression in PBMC of smokers. 19 Lp-PLA2 hydrolyses oxidized phospholipids in LDL particles at the sn-2 position and produces bioactive oxidized free fatty acids and lysoPCs. In this study, strong positive associations among plasma ox-LDL, PBMC Lp-PLA2 activities, PBMC lysoPC (16:0) and PBMC lysoPC (18:0) may indicate that plasma ox-LDL and PBMC Lp-PLA2 activities are major determinants of PBMC lysoPC levels. Furthermore, a negative relationship of PBMC Lp-PLA2 activities, PBMC lysoPC (16:0) and PBMC lysoPC (18:0) with LDL particle size may reflect the apparent binding preference of Lp-PLA2 for small dense LDL. 20 Similar to a recent report, 21 this study also showed positive associations among fasting glucose, PBMC Lp-PLA2 and plasma Lp-PLA2 activities. In a porcine model of diabetes, Shi et al. 22 found the up-regulation of Lp-PLA2 mRNA expression in PBMC.
In this study, IFG- or T2D-related decreases in most plasma lysoPCs were observed regardless of increases in plasma Lp-PLA2 activities. This result may partly be explained by the previous finding of reduced serum activity of lecithin-cholesterol acyltransferase (LCAT) in T2D, which transfers a fatty acid from PC to cholesterol and also regulates reverse cholesterol transport and HDL remodeling. 23 In the plasma, significant amounts of lysoPCs and most saturated lysoPCs can be formed by the action of LCAT. 24 Reducing LCAT activity in T2D patients was recently suggested to limit the adverse effects of enhanced circulating ox-LDL on HDL-cholesterol metabolism. 23 This study also showed an increase in plasma ox-LDL along with decreases in both HDL-cholesterol and plasma lysoPCs containing C16:0, C17:0, C18:2, C18:1 and C18:0. Therefore, IFG- or T2D-related decreases in most plasma lysoPCs may, in part, be due to decreased biosynthesis resulting from depressed serum LCAT activity rather than increased clearance from the circulation by tissues. Whereas LCAT activity was not measured in this study, this LCAT-dependent mechanism is a plausible hypothesis. However, significance of plasma lysoPCs disappeared after adjusting for age. An impact of age has been shown in some of plasma metabolites such as lysoPCs; in other words, these plasma metabolites could more easily be affected by an age than PBMC metabolites.
IFG- or T2D-related increases in PBMC fatty acid primary amides, oleamide and palmitic amide were observed. Oleamide was the first fatty acid primary amide to be identified as a signalling molecule, and it has been shown to participate in several signalling pathways. 25 This study identified PBMC oleamide (VIP value of 11.1721) and PBMC leucine (VIP value of 14.4867) as the most important PBMC metabolites for evaluating the difference between healthy patients and subjects with IFG or T2D. Recently, Ha et al. 4 found that of the plasma metabolites, plasma oleamide was useful for distinguishing between nondiabetic and diabetic men (VIP value of 6.952). Our study is in agreement with these findings. We found plasma oleamide (VIP value of 13.3814) and plasma lysoPC 16:0 (VIP value of 16.9894) to be the most important plasma metabolites for indicating IFG or T2D.
A large number of metabolite markers were detected by UPLC-LTQ-Orbitrap MS in this study, but most of these metabolites remain unidentified. Large databases of endogenous biomolecules have not yet been constructed for use with LC-MS-based techniques for metabolomics research.
26
The relatively small sample size in this study may not be sufficiently large to detect all IFG- or T2D-associated metabolic changes in PBMC and plasma. Despite these limitations, our approach using UPLC-LTQ-Orbitrap MS-based metabolomics and multivariate data analysis revealed increases in 11 PBMC metabolites in subjects with IFG or T2D, including six amino acids (valine, leucine, methionine, phenylalanine, tyrosine and tryptophan; all q-values <0.001),
In conclusion, this study demonstrates greater differences between patients with IFG or T2D and healthy controls in the PBMC metabolome than those observed in the plasma metabolome. These data indicate that age effect was reflected in the changes in plasma metabolites; thus, metabolites from PBMCs could be a useful tool to better understand inflammatory pathophysiology of IFG or diabetes.
Footnotes
Acknowledgements
The authors thank the research volunteers who participated in the studies described in this article and the technical assistants of Yonsei Center for Research Facilities, Yonsei University, for data generation of LC-MS [LTQ-Orbitrap (micro-LC)].
Declaration of conflicting interests
The author(s) declared no potential conflicts of interest with respect to the research, authorship and/or publication of this article.
Funding
This work was supported by the Bio-Synergy Research Project (NRF-2012M3A9C4048762) of the Ministry of Science, ICT and Future Planning through the National Research Foundation. Also, it was funded by a grant of the Korean Health Technology R&D Project, Ministry of Health & Welfare, Republic of Korea (HI14C2686, HI14C2686010115).