
Abstract
β-Glucans are components of fungal cell walls and potent stimulants of innate immunity. The majority of research on biological activities of glucans has focused on β-(1→3)-glucans, which have been implicated in relation to fungal exposure-associated respiratory symptoms and as important stimulatory agents in anti-fungal immune responses. Fungi—and bacteria and plants—produce a wide variety of glucans with vast differences in the proportion and arrangement of their β-(1→3)-, -(1→4)- and -(1→6)-glycosidic linkages. Thus far, the pro-inflammatory potential of different β-glucans has not been studied within the same experimental model. Therefore, we compared the potency of 13 different glucan preparations to induce in vitro production of IL-1β, IL-6, IL-8 and TNF-α in human, whole blood cultures. The strongest inducers of all cytokines were pustulan [β-(1→6)-glucan], lichenan [β-(1→3)-(1→4)-glucan], xyloglucan [β-(1→4)-glucan] and pullulan [α-(1→4)-(1→6)-glucan]. Moderate-to-strong cytokine production was observed for curdlan [β-(1→3)-glucan], baker’s yeast glucan [β-(1→3)-(1→6)-glucan] and barley glucan [β-(1→3)-(1→4)-glucan], while all other glucan preparations induced very low, or no, detectable levels of cytokines. We therefore conclude that innate immunity reactions are not exclusively induced by β-(1→3)-glucans, but also by β-(1→6)- and β-(1→4)-structures. Thus, not only β-(1→3)-glucan, but also other β-glucans and particularly β-(1→6)-glucans should be considered in future research.
Introduction
β-Glucans are microbial associated molecular patterns (MAMPs) produced by bacteria and fungi with large variation in proportion and arrangement of their β-(1→3)-, -(1→4)- and -(1→6)-glycosidic linkages. 1 Plants also produce β-glucans, which are, by definition, not MAMPs. These linear β-(1→4)-glucan chains with different amounts of β-(1→3)-linkages within the linear chain may, nevertheless, also interact with the vertebrate immune system.2–4 Fungal cell walls contain predominantly linear β-(1→3)-glucans with branches of shorter β-(1→6)-glucan chains,5,6 while in algae or bacteria the most common types are linear β-(1→3)-glucans. Another group of β-glucans with only β-(1→6)-linkages are produced by lichens7,8 and some fungi.9,10 Recent reports suggest that these β-(1→6)-glucans may also induce both innate and adaptive immune responses,11–13 but the actual mechanisms by which they elicit inflammatory reactions have not yet been investigated.
Even though such vast differences between β-glucan structures are known, the majority of studies on glucans as MAMPs have focused on β-(1→3)-glucan. 14 The principal innate immune receptor for β-(1→3)-glucan is dectin-1,15,16 which is primarily, but not exclusively, expressed on monocytic cell populations. 17 Complement receptor 3 (CR3)2,18 has also been identified to recognize β-(1→3)-glucans, but its exact role in antimicrobial defense mechanisms has not yet been elucidated. The activation of cellular innate immunity reactions by receptor binding commonly includes the induction of cytokine production.19–21 The potential of β-(1→3)-glucans to stimulate cytokine production in human blood cells has been investigated in several experimental in vitro studies, with curdlan, a linear β-(1→3)-glucan from bacterial origin,22–24 schizophyllan, a fungal β-(1→3)-(1→6)-glucan, and a carboxymethylated glucan from baker’s yeast 25 as stimulating agents. While the various β-(1→3)-glucans used in each of these studies induced clearly elevated cytokine levels, their pro-inflammatory potencies have, to our knowledge, not been systematically compared within one study and in the same experimental test model. Differences in pro-inflammatory potency may be anticipated, as the pronounced structural differences most likely result in different affinities for innate immunity receptors, as has been shown for instance for binding to dectin-1. 26
The objective of this study was therefore, to test and compare the potential of 13 different glucans to induce cytokine production, using human whole blood cultures as the test system.
Material and methods
Glucans
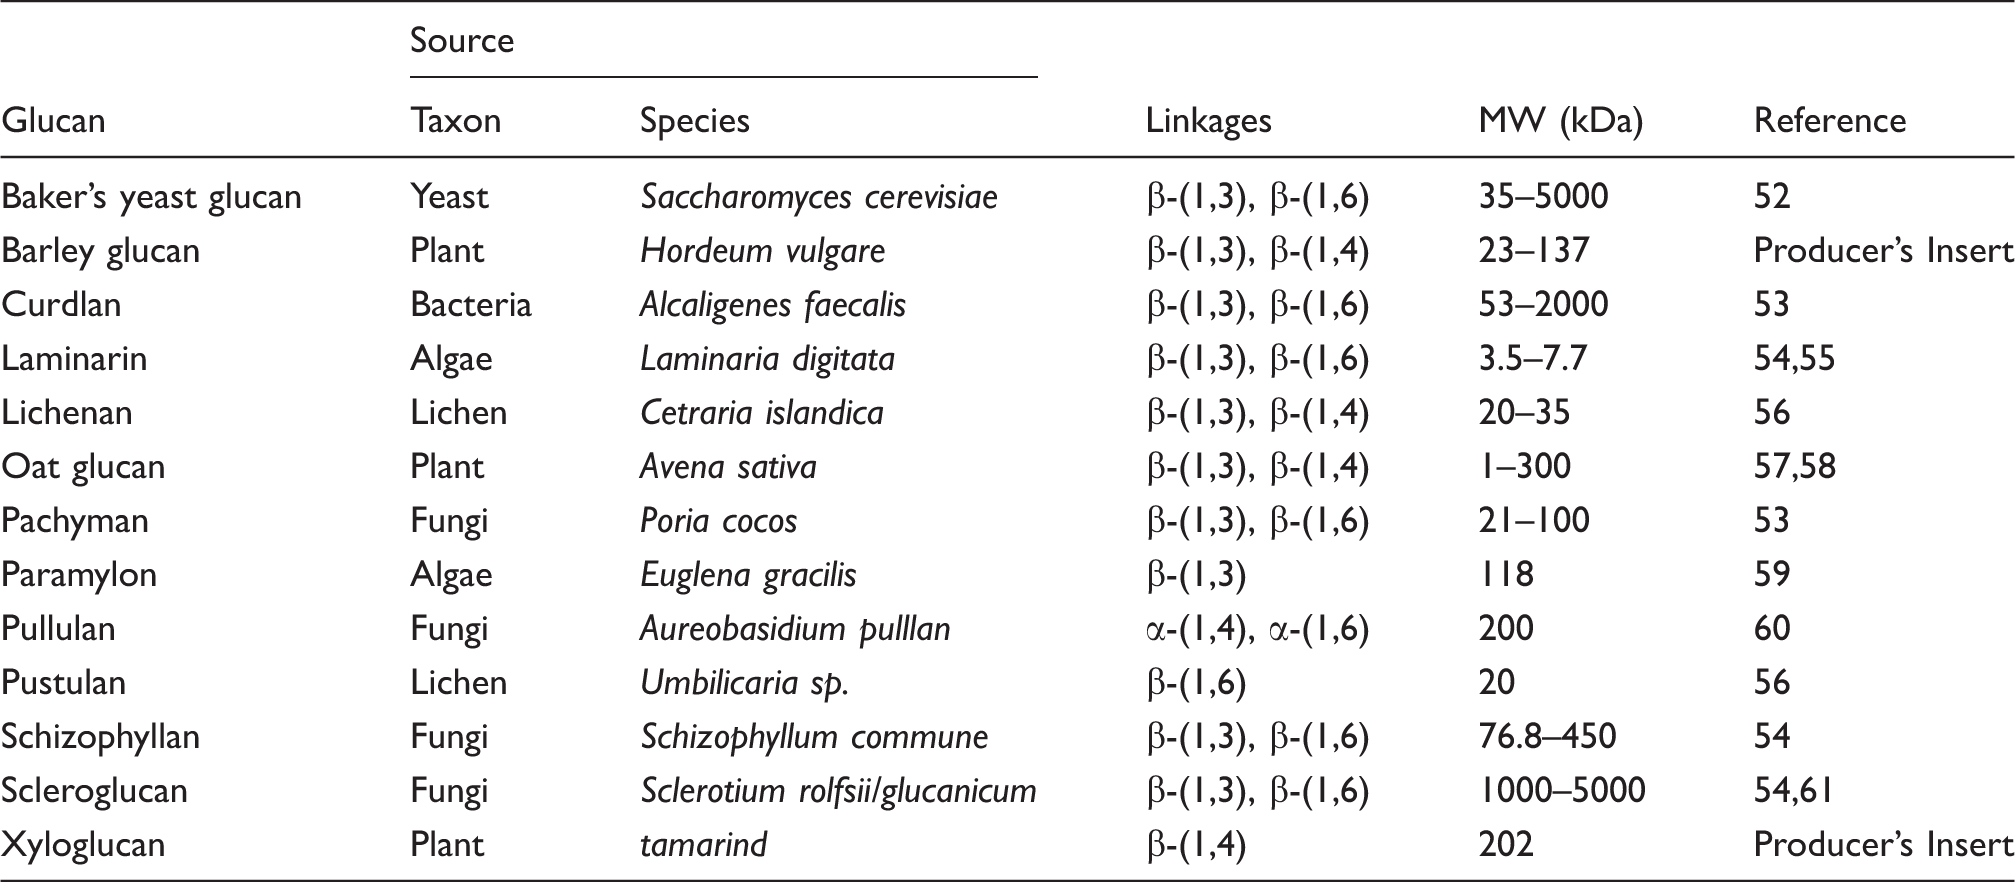
We used the β-(1→3)-glucans curdlan (Wako Chemicals GmbH, Neuss, Germany), laminarin (Sigma-Aldrich, Zwijndrecht, the Netherlands), pachyman (Megazyme, Wicklow, Ireland) and paramylon (Sigma-Aldrich), the β-(1→3)-(1→4)-glucans barley glucan, lichenan and oat glucan (all Megazyme), the β-(1→4)-glucan xyloglucan (Megazyme), the β-(1→3)-(1→6)-glucans baker’s yeast glucan (Sigma-Aldrich), schizophyllan and scleroglucan (gifts from Dr U. Rau, Department of Biotechnology, TU Braunschweig, Germany), and the β-(1→6)-glucan pustulan (Calbiochem, EMD Chemicals, Gibbstown, NJ, USA). In addition to the β-glucans, we tested the α-(1→4)-(1→6)-glucan pullulan (Megazyme). All glucans were available as dry powder and were >90% pure according to the suppliers’ information. Stock solutions were made of 1 mg/ml, based on preliminary experiments in which solubilities were assessed. Glucans were considered soluble when the mixture consisted of one clear homogenous phase. Specifically, baker’s yeast glucan and curdlan were dissolved in 0.05 M NaOH at room temperature (20–22°C), barley glucan, laminarin, lichenan and pustulan by autoclaving in ultrapure water, scleroglucan by autoclaving in 0.05 M NaOH, and oat glucan, xyloglucan and pullulan were dissolved in ultrapure water at room temperature. Pachyman, paramylon and schizophyllan were dissolved by autoclaving in 0.05 M NaOH followed by centrifugation at 1000 g for 15 min to eliminate possible particulates and supernatants were collected. Pellets were dried and weighed, and amounted to 5% (at maximum) of the original mass.
Beta-glucan types and structural differences.
Whole blood assay
Approximately 15 ml peripheral blood each of 7 healthy adult human donors was collected by venapuncture in sterile heparin tubes (Lithium Heparin, Venosafe; Terumo, Leuven, Belgium) and gently mixed for approximately 1 h. Heparin was chosen based on a previous pilot experiment which showed that heparin as anticoagulant gave more consistent and higher cytokine measurements (I.M. Wouters and L.A.M. Smit, unpublished data).
The whole blood stimulations were performed essentially as described earlier. 27 Briefly, the glucan solutions were diluted with RPMI 1640 medium supplemented with 100 U/ml penicillin and 100 mg/ml streptomycin (Gibco, Breda, the Netherlands) to 500, 250 and 50 µg/ml.
As positive control LPS (Escherichia coli O55:B5, Fluka, Buchs, Switzerland) was used at concentrations of 0.2, 0.02, 0.002 and 0.0002 ng/ml, and the RPMI 1640 diluent was used as negative control. All solutions and controls were transferred in 100 µl aliquots to sterile, flat-bottom, 96-well cell culture plates (Corning Inc., New York, USA) and 100 µl heparinized blood samples were added.
After culturing for 24 h at 37°C, 5% CO2 and 96% relative humidity, the plates were centrifuged (15 min, 1000 g) and supernatants were stored at −20°C. Enzyme immunoassays (EIAs) from Sanquin Reagents (Amsterdam, the Netherlands) were used to measure TNF-α (samples diluted 1/5 to 1/40), IL-1β (1/40 to 1/320), IL-6 (1/100 to 1/800) and IL-8 (1/100 to 1/2700) in the supernatants, with the lower detection limits (LOD) being 17.7 pg/ml, 11.5 pg/ml, 6.04 pg/ml and 1.96 pg/ml respectively.
Polymyxin treatment and LPS measurement
To control for possible endotoxin contamination all glucan solutions were treated with polymyxin, a cationic agent that removes endotoxin by binding to the negatively-charged lipid A portion of LPS.28,29 Polymyxin B-agarose (Sigma-Aldrich) was washed three times with 0.1 M ammonium bicarbonate buffer, followed by three washing steps with pyrogen-free water. One ml of 1 mg/ml polymyxin B-agarose (binding capacity: 200–500 µg LPS per ml) was added to 1 ml of 1 mg/ml glucan and incubated on an end-over-end roller for 2 h at room temperature. The mixture was centrifuged 20 min at 1000 g. The treated glucan solutions, as well as the stock solutions without treatment, were tested in the quantitative kinetic chromogenic Limulus amoebocyte lysate (LAL) assay (Lonza, LAL-Lysate lot GL155U) at a 1/4 dilution in pyrogen-free water.
LPS from E. coli O55:B5 (lot GL1157, 14 EU/ng) was used as the reference standard. The cut-off signal of the LAL assay was defined as the mean plus two standard deviations of the Vmax of the assay blanks. The corresponding sensitivity of the assay (LOD) for an undiluted sample was 0.012 EU/ml and thus for the (1/4) diluted glucan solutions the LOD was 0.048 EU/ml, which corresponds to approximately 0.003 ng pure LPS per ml. As β-(1→3)-glucans can produce false-positive results in LAL assays, we used the β-G-Blocker (Lonza) to assess this possibility in some informative samples. The use of the β-G-blocker did not affect the measured endotoxin content (data not shown).
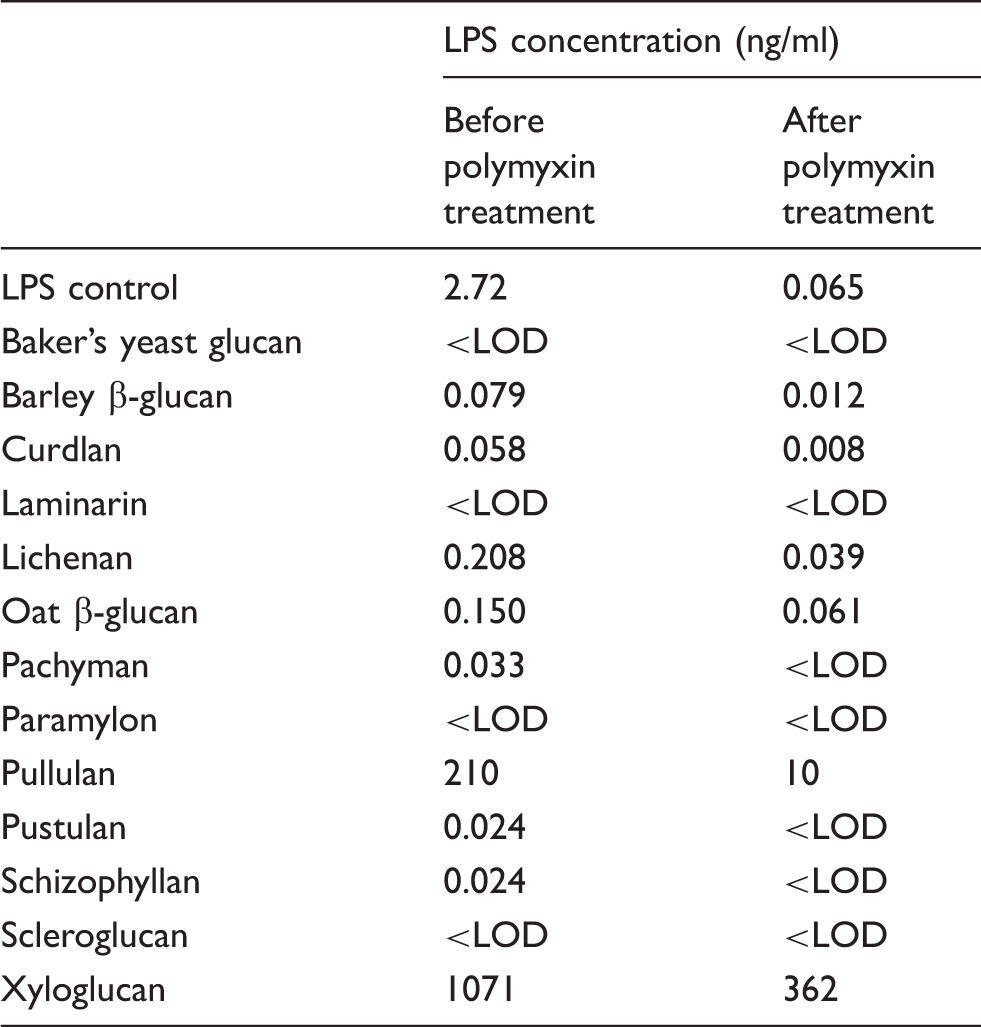
Endotoxin concentration before and after polymyxin treatment of the LPS-positive control (50 EU/ml = 3.5 ng/ml) and glucan stock solutions (1 mg/ml), as determined by the LAL assay; LOD = 0.003 ng/ml.
Finally, polymyxin-treated solutions were tested in the whole blood assay (WBA) as described before and results were compared with those of non-treated solutions. As a positive control for successful polymyxin treatment, a 3.5 ng/ml LPS standard preparation (E. coli O55:B5) was included parallel to the glucan solutions.
Statistics
All data showed a log-normal distribution, and therefore Pearson correlation coefficients (r) were calculated based on ln-transformed values.
For 3 donors complete data were available—thus for all 4 cytokines after stimulation with each of the 13 glucans in 3 stimulatory concentrations. We used medians of the cytokine responses of those three donors in the analysis. Correlations between the cytokine responses of the three different donors were similar for all cytokines and all pair-wise comparisons between the seven donors (r > 0.7) where applicable.
Figures were produced in Sigmaplot 10 (Systat Software, Inc., San Jose, CA, USA).
Results
Comparability between individual responses
As individual responses to β-glucan stimulation may differ qualitatively and quantitatively, a comparison between individual donors’ cytokine responses to the different glucans (Figure 1) was made. The comparisons between IL-6 responses in whole blood from three donors stimulated with 250 µg/ml of the glucans are presented in Figure 1. The analogous correlations for IL-6 induced by 125 and 25 µg/ml of the glucans, as well as the between-donor comparisons of IL-1β, IL-8 and TNF-α production, showed essentially the same pattern (all r > 0.8).
Comparison between IL-6 concentrations in whole blood of three donors after stimulation with 250 µg/ml glucan. (A) Donor 1 (x-axis) vs donor 2 (y-axis); (B) donor 1 (x-axis) vs donor 3 (y-axis); (C) donor 2 (x-axis) vs donor 3 (y-axis). BAK, baker’s yeast glucan; BAR, barley β-glucan; CUR, curdlan; LAM, laminarin; LIC, lichenan; oat, oat β-glucan; PAC, pachyman; PAR, paramylon; PUL, pullulan; PUS, pustulan; SCH, schizophyllan; SCL, scleroglucan; XYL, xyloglucan.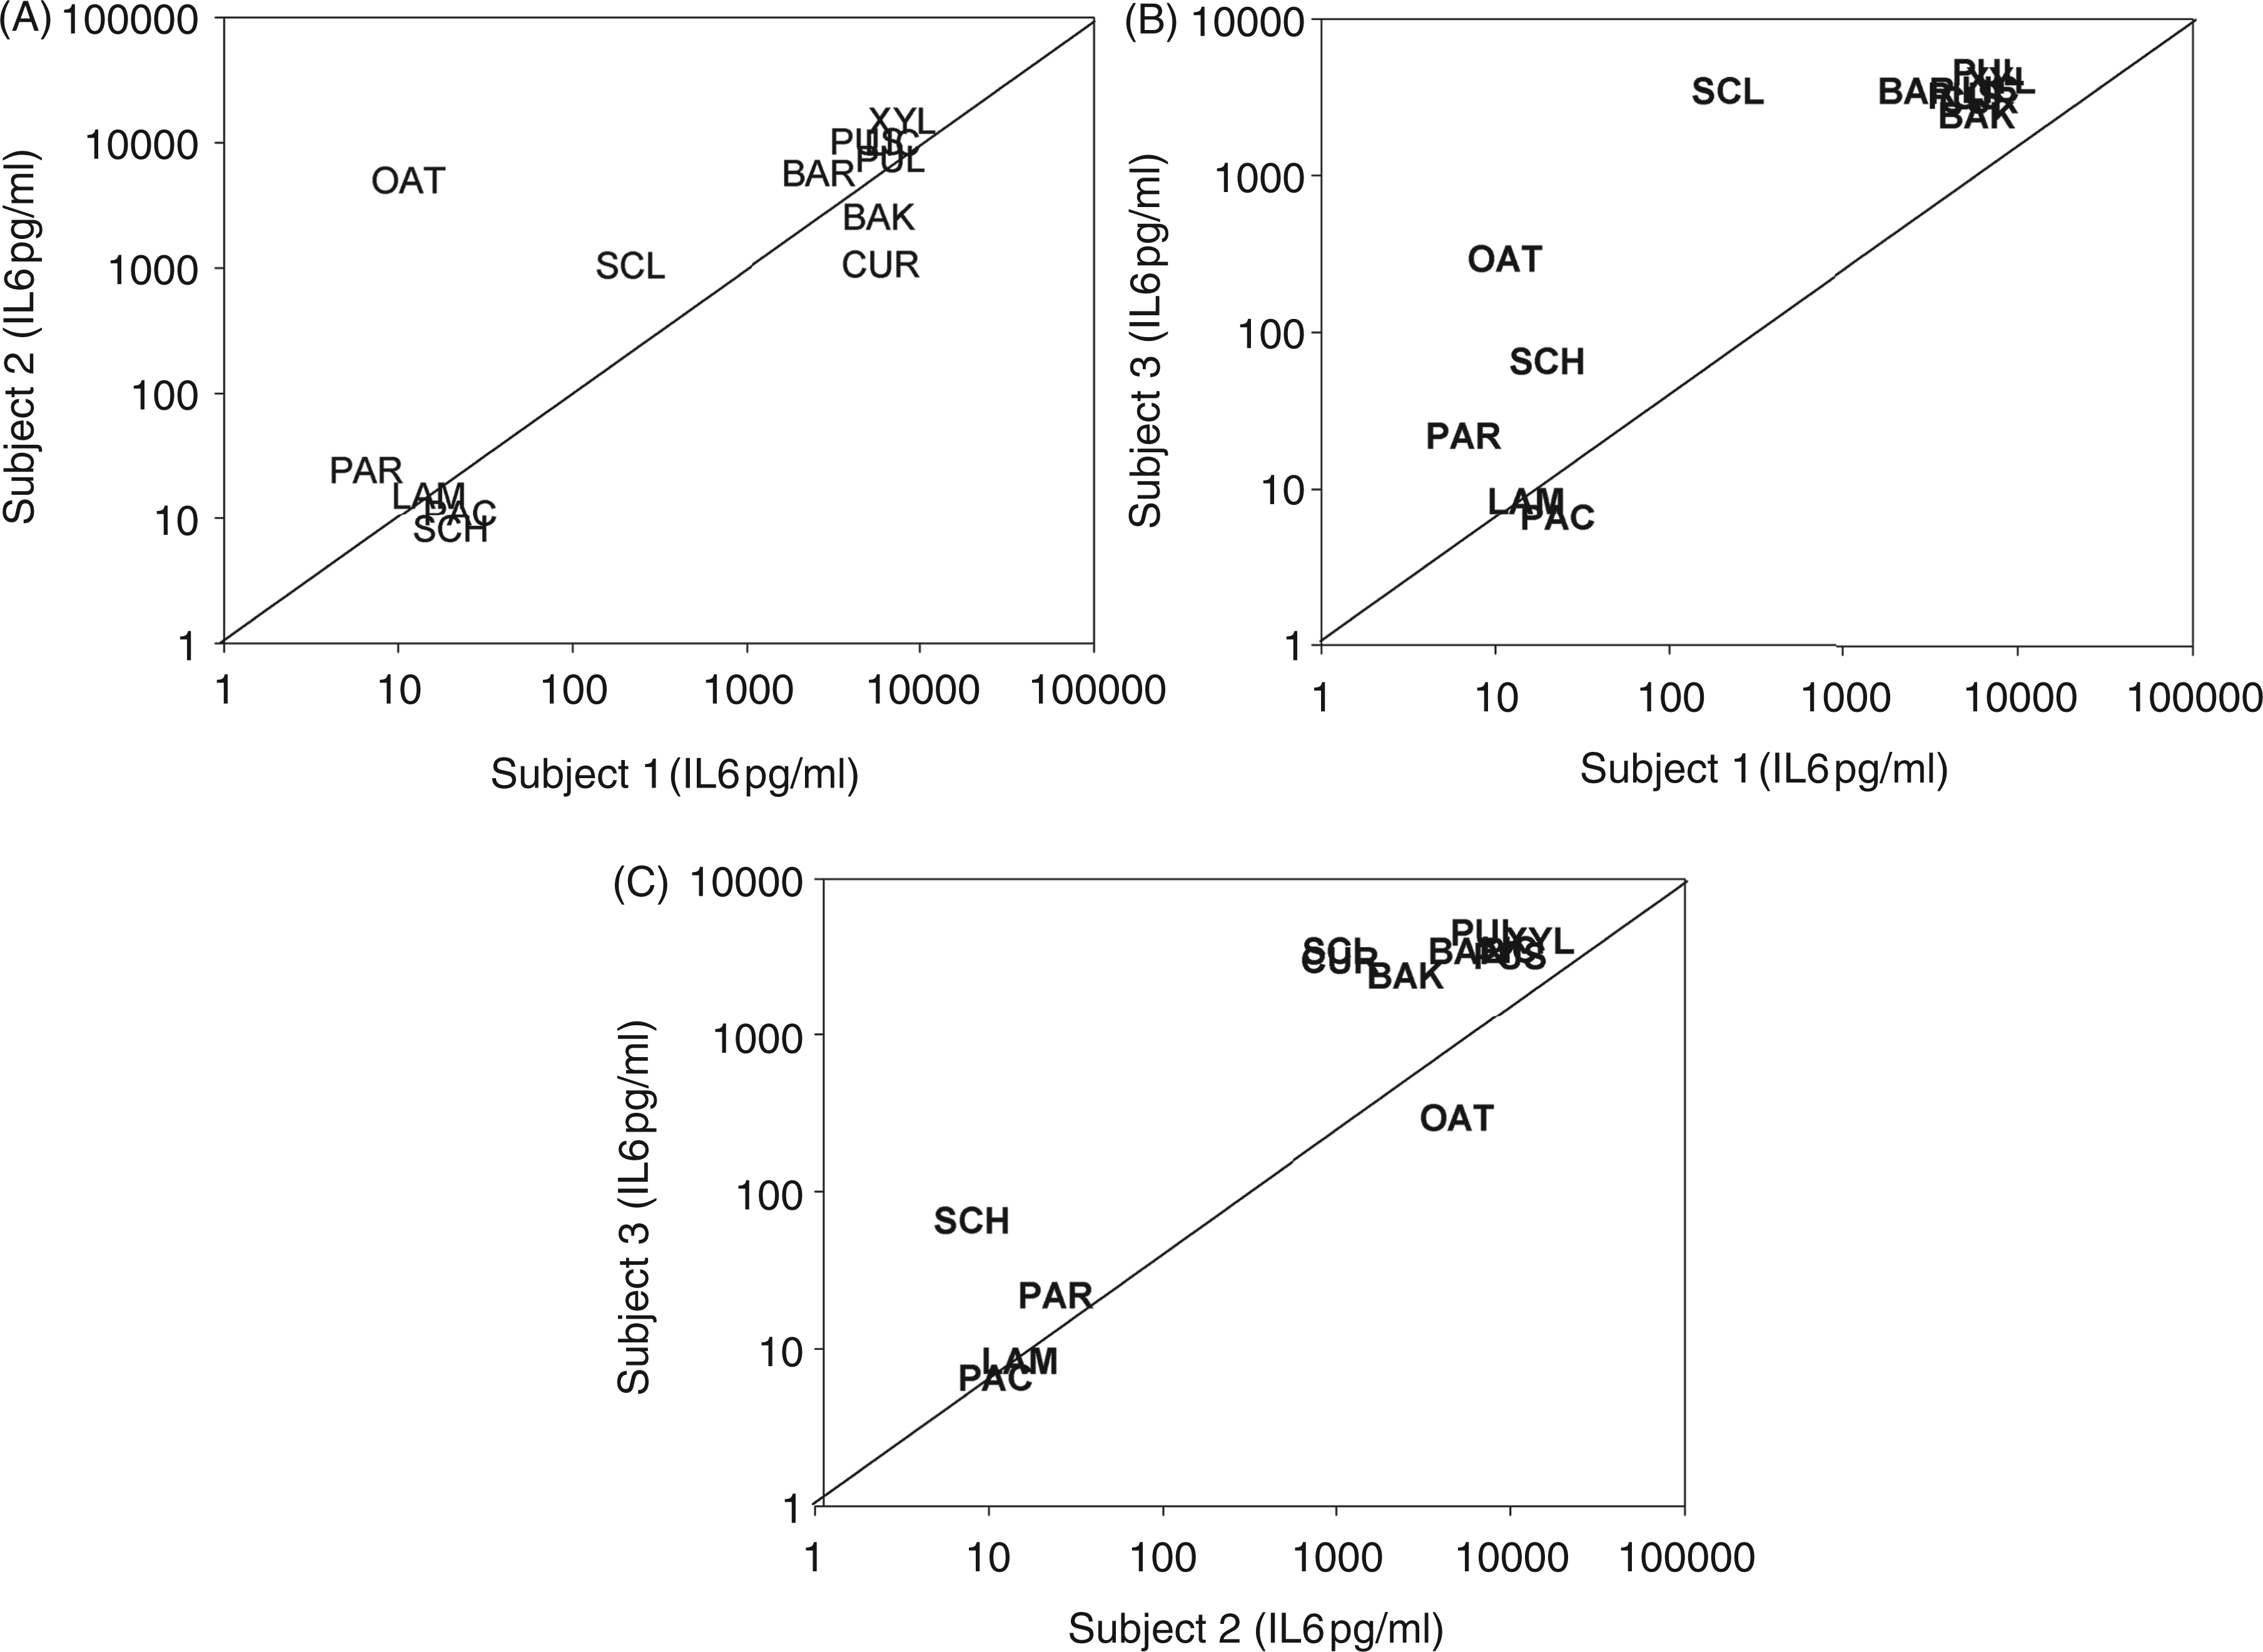
Some quantitative differences in cytokine responses were observed for different donors (Figure 1), but the ranking of the various glucans into weak, moderate, strong and very strong cytokine inducers was practically the same for all donors. An exception was oat β-glucan, which did not induce significant production of any cytokine in whole blood from donor 1, while high IL-6 production—and also high production of IL-1β, IL-8 and TNF-α (not shown) —was observed for both donors 2 and 3 (Figure 1A, B).
Cytokine induction potency of different glucans
Figure 2 presents an overview of the median cytokine levels after stimulation with LPS and the various glucan preparations.
Median cytokine levels in whole blood of three donors after 24 h stimulation with LPS and various glucan preparations. The different panels represent in vertical direction the measured median levels of IL-6, IL-1β, IL-8 and TNFα, and in horizontal direction the results for LPS (A) and glucans derived from fungi (B), lichen (C), algae and bacteria (D) and plants (E).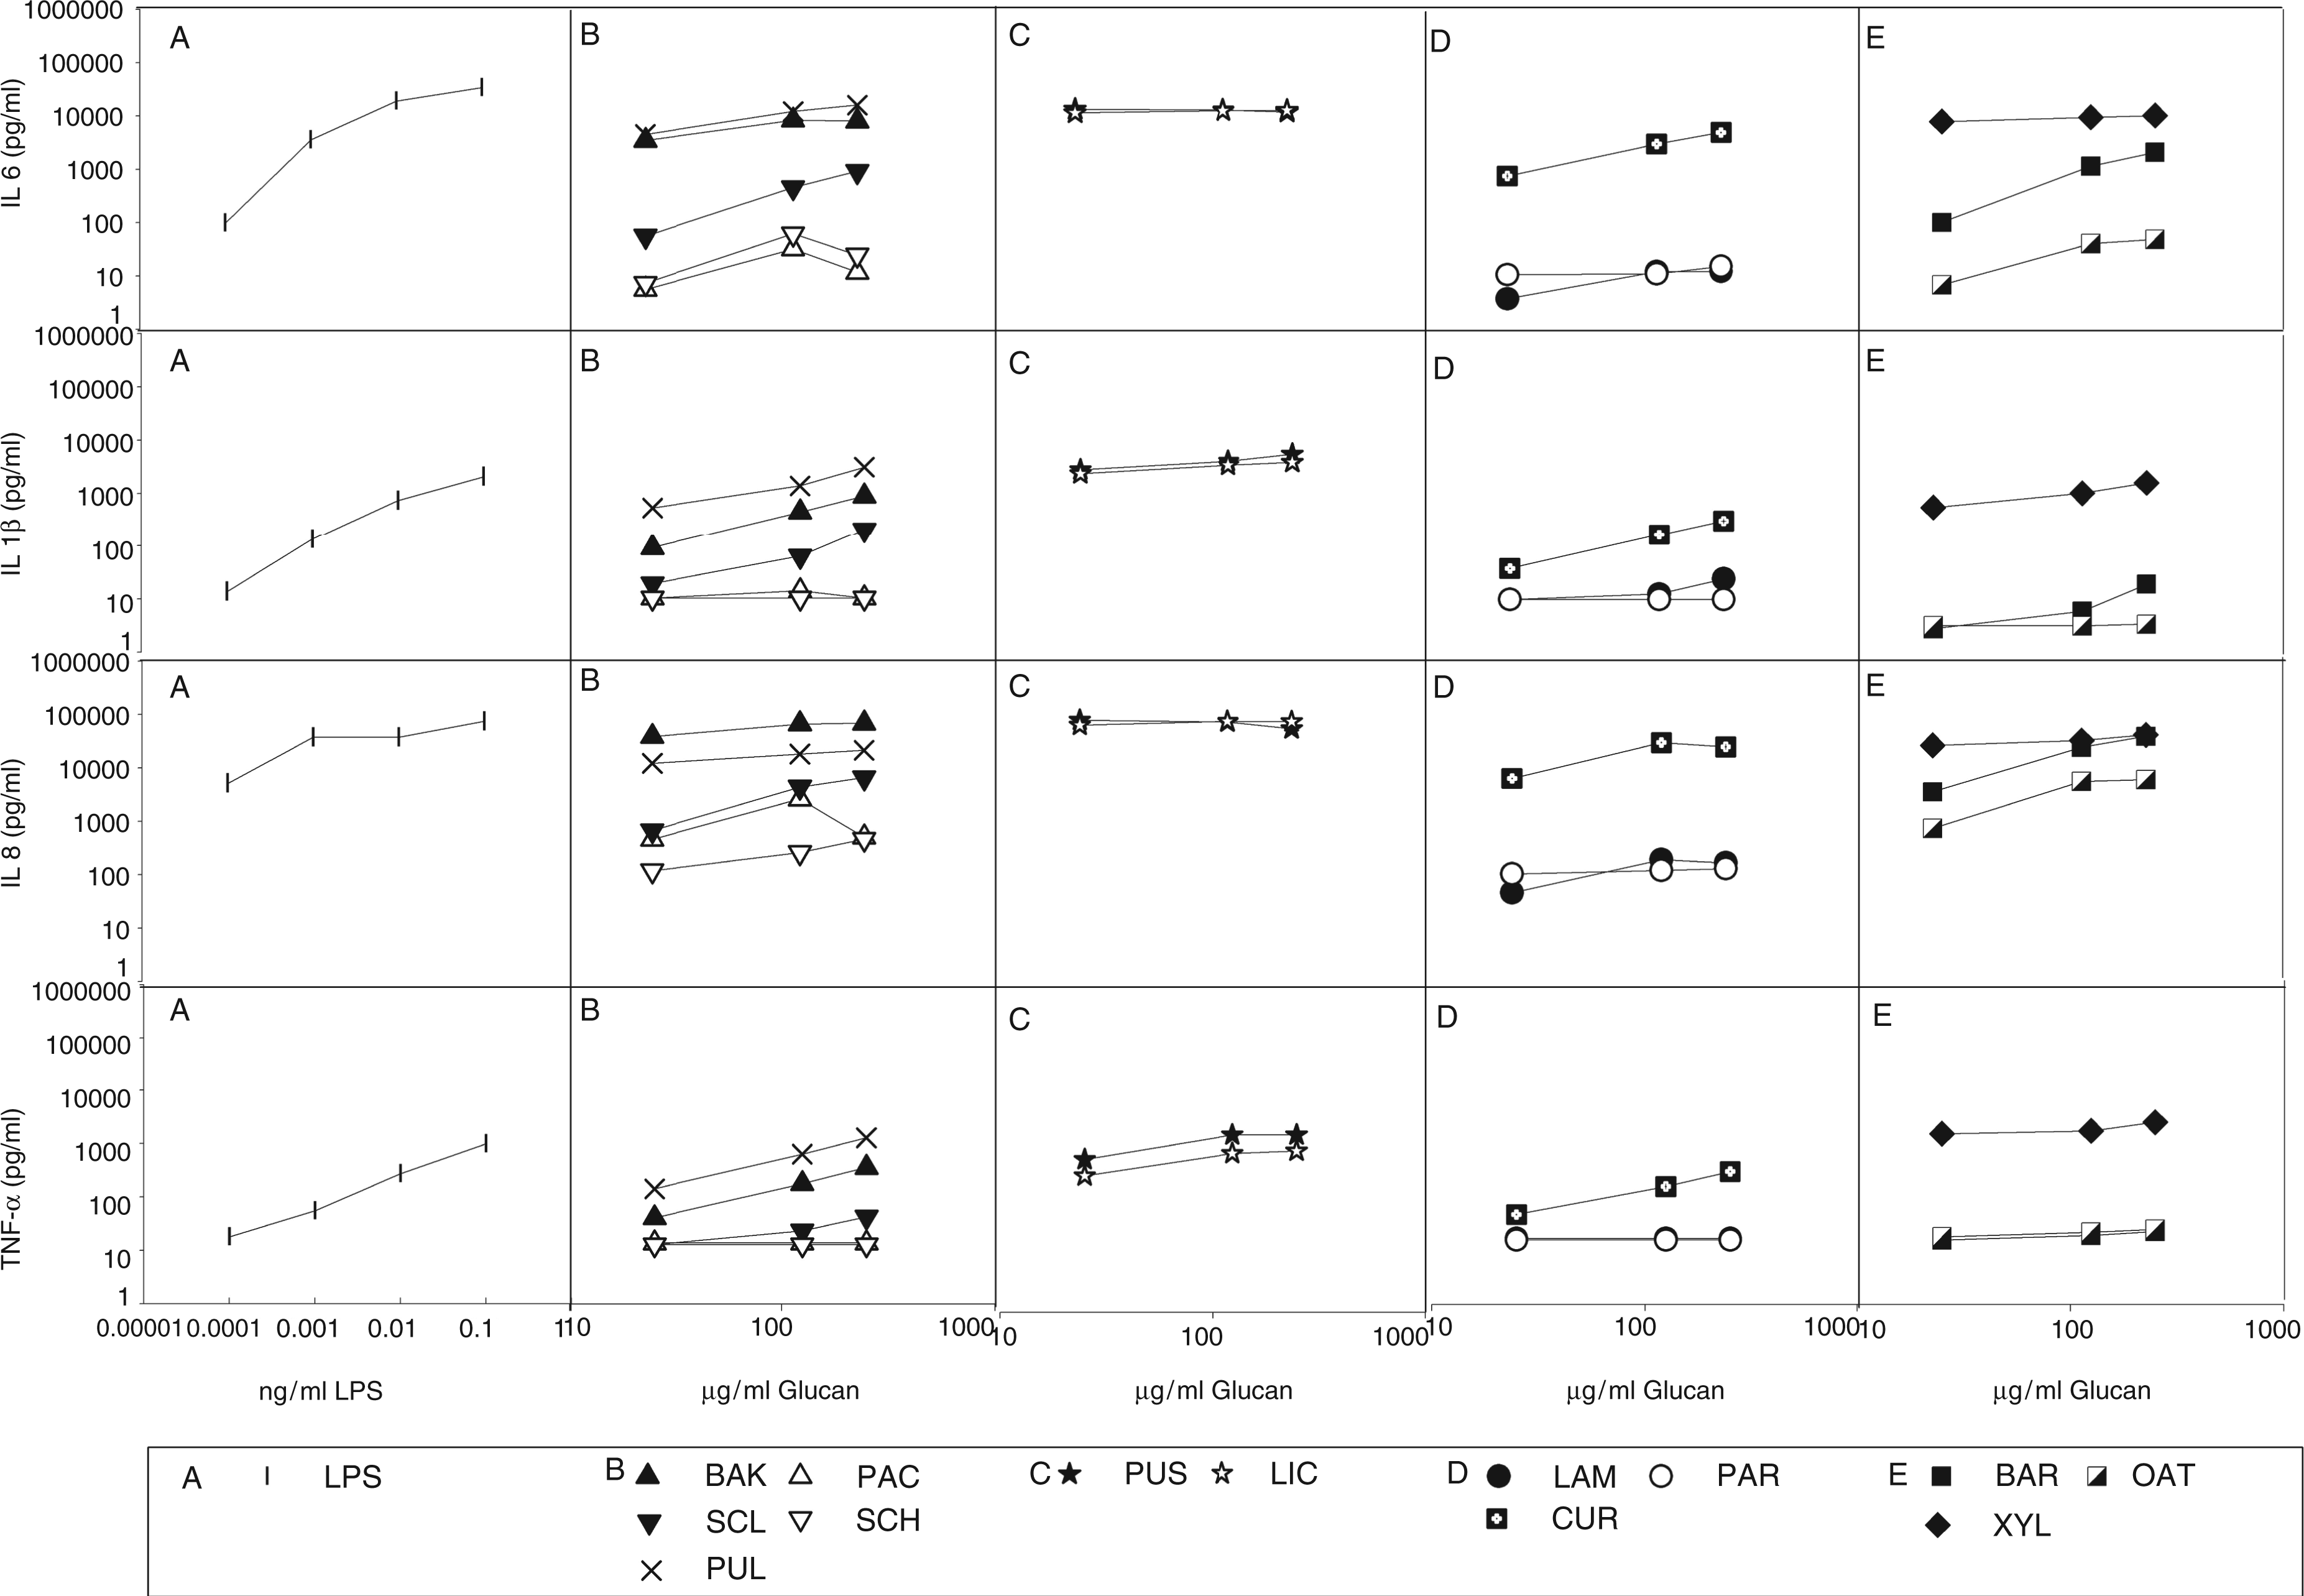
Generally, the two lichen glucans—the β-(1→6)-glucan pustulan and the β-(1→3)-(1→4)-glucan lichenan—and the plant glucan xyloglucan [β-(1→4)-glucan], as well as pullulan—a fungal α-(1→4)-(1→6)-glucan—were the strongest cytokine inducers. Baker’s yeast glucan [fungal β-(1→3)-(1→6)-glucan], barley β-glucan [plant β-(1→3)-(1→4)-glucan] and curdlan [bacterial β-(1→3)-glucan] also induced strong production of most cytokines. Scleroglucan [fungal β-(1→3)-(1→6)-glucan] and oat β-glucan [plant β-(1→3)-(1→4)-glucan] induced modest and all other glucans only weak or no cytokine production at all.
Comparison of different cytokine responses
To investigate whether the profile of pro-inflammatory cytokines, i.e. their relative abundance or absence compared with other cytokines, induced by different glucans showed qualitative variation, we also compared the induced levels of the four cytokines (Figure 3).
Comparison of productions of different cytokines in response to the various glucans. (A) IL-1β vs. IL-6; (B) IL-1β vs. IL-8; (C) IL-1β vs. TNF-α; (D) IL-6 vs IL-8; (E) IL-6 vs. TNF-α; (F) IL-8 vs. TNF-α. BAK, baker’s yeast glucan; BAR, barley β-glucan; CUR, curdlan; LAM, laminarin; LIC, lichenan; oat, oat β-glucan; PAC, pachyman; PAR, paramylon; PUL, pullulan; PUS, pustulan; SCH, schizophyllan; SCL, scleroglucan; XYL, xyloglucan.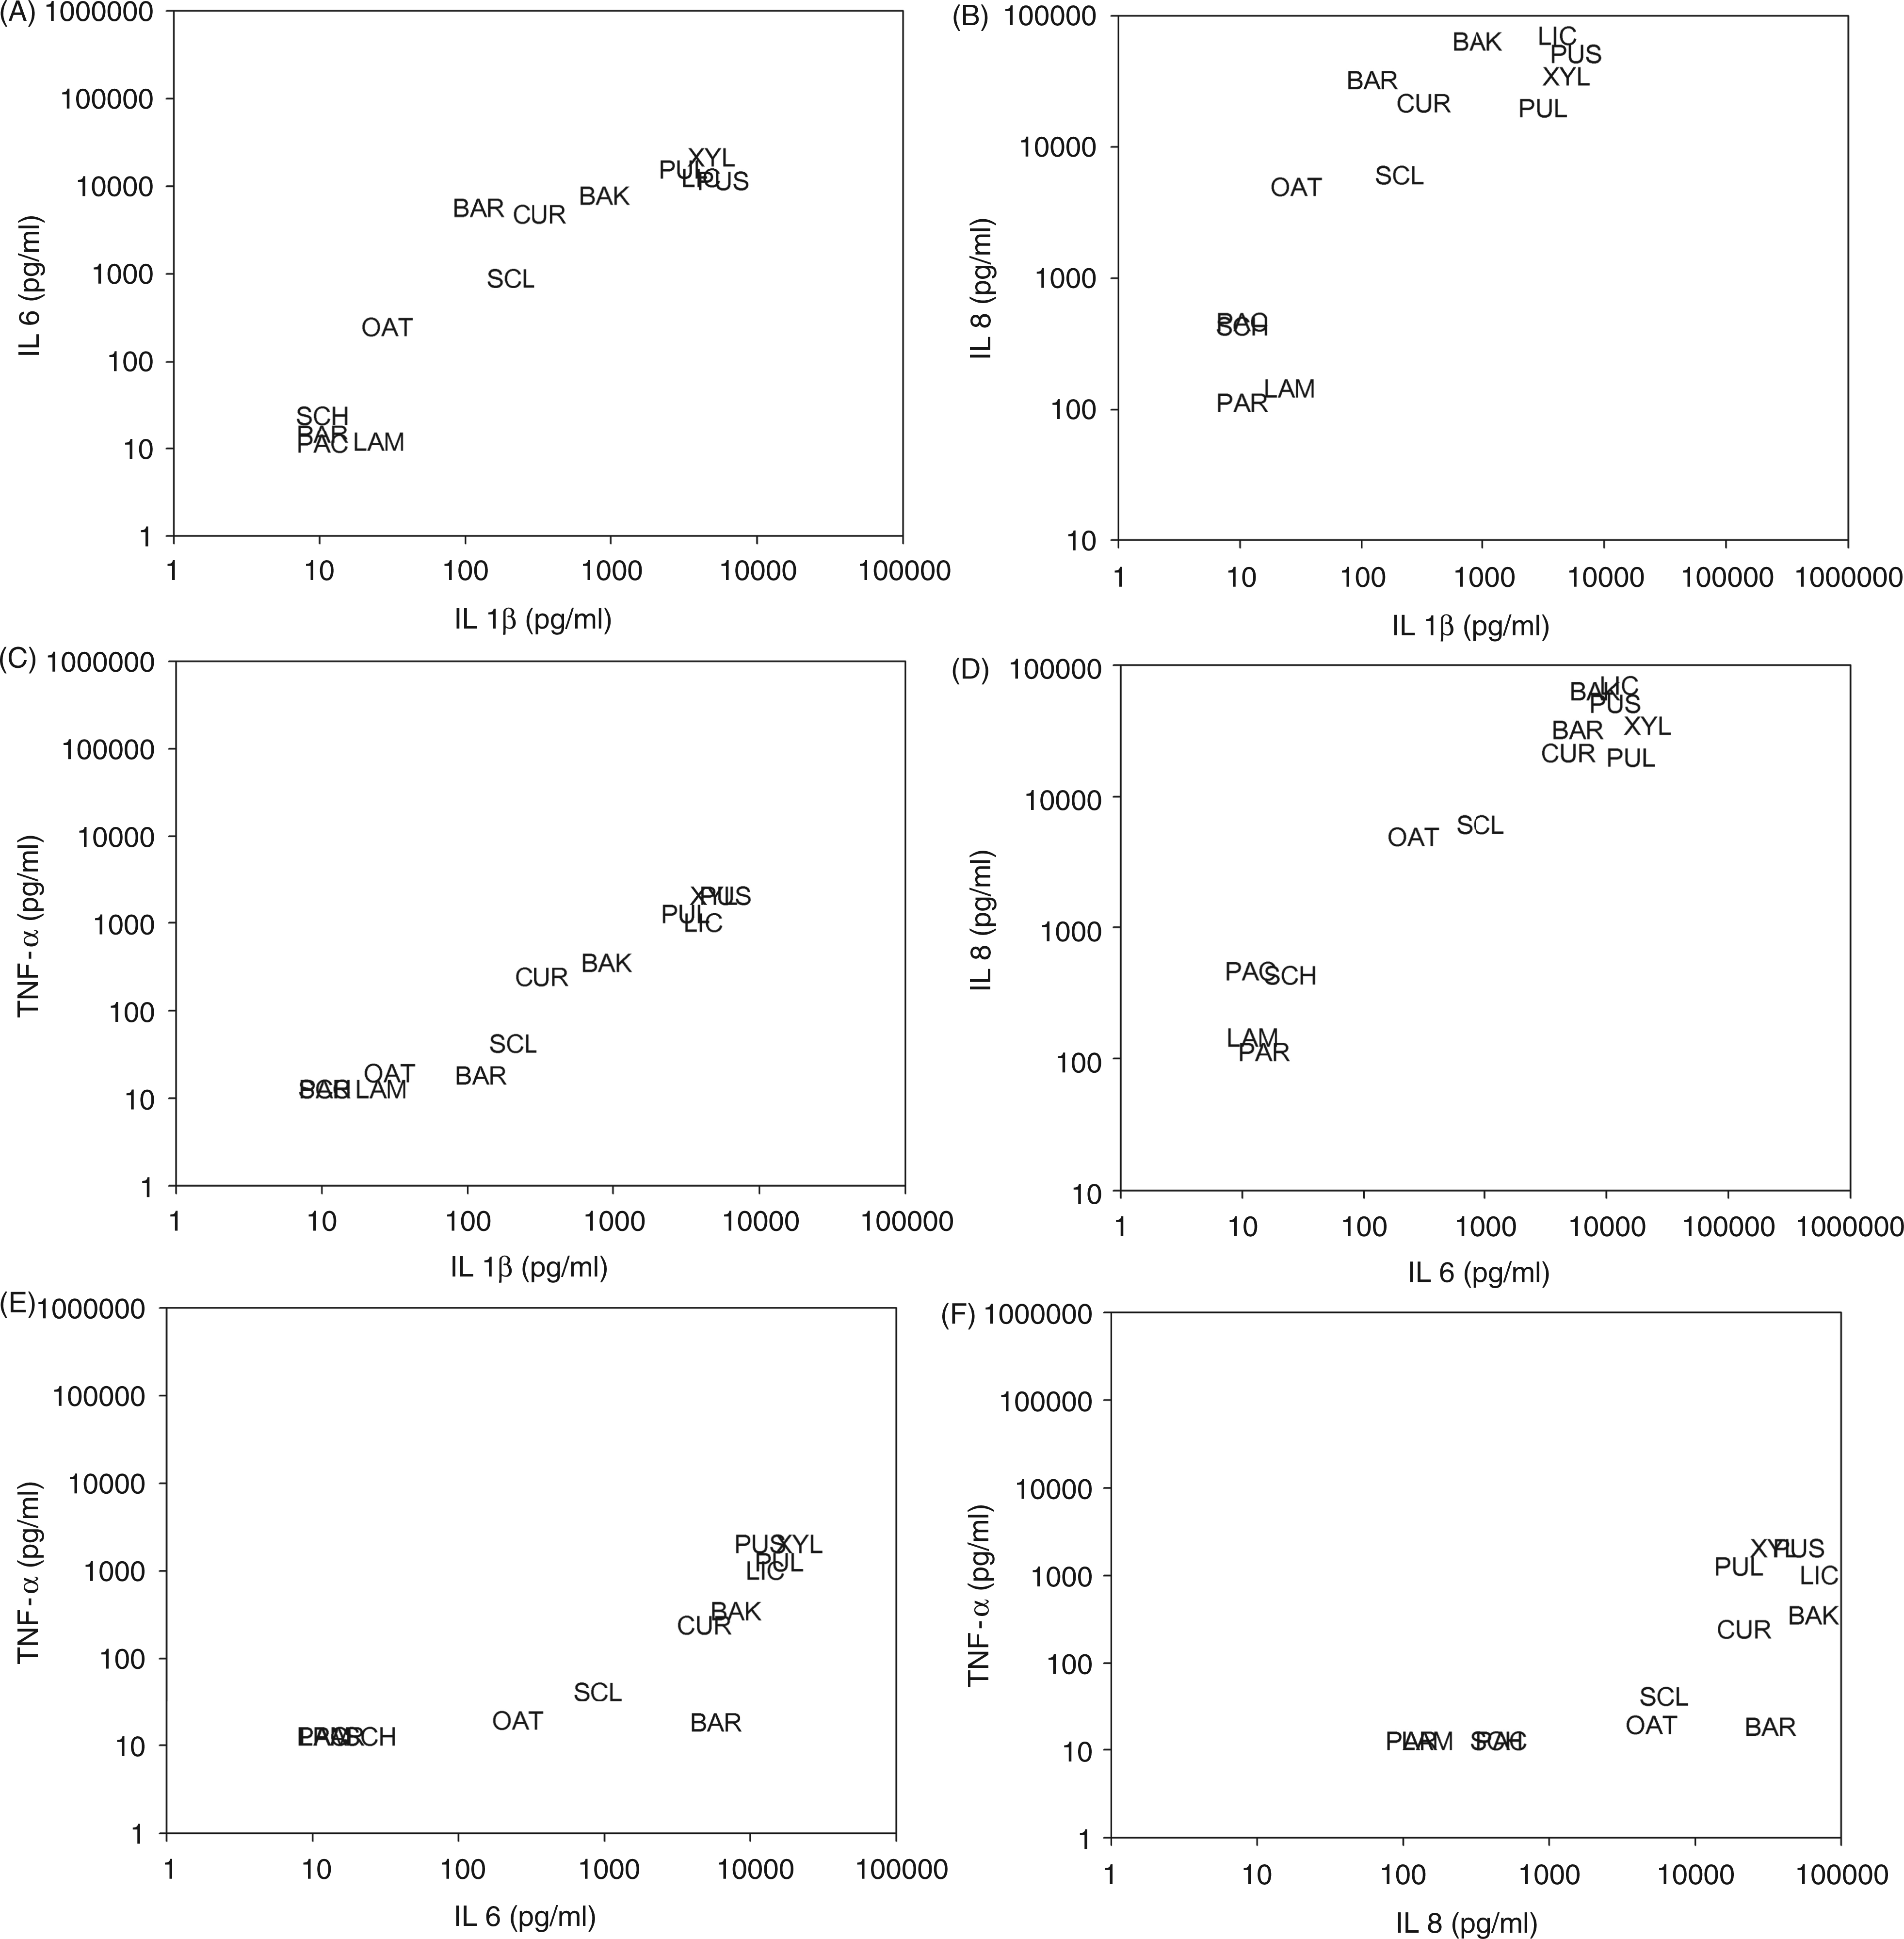
In general, the levels of different cytokines produced in response to a certain glucan were highly correlated. The strongest correlations (r > 0.9) were found between IL-8 and IL-6, between TNF-α and IL-1β, and between IL-6 and IL-1β. IL-8 correlated only moderately with TNF-α and IL-1β (0.6 < r < 0.8), while IL-6 correlated only moderately with TNF-α (r = 0.7).
Thus, we confirmed that the glucans could be grouped—irrespective of the blood donor or cytokine measured—into four categories of pro-inflammatory potential, ranging from very strong to practically none.
Endotoxin activity in the glucan solutions
Endotoxin is a very potent pro-inflammatory agent, as confirmed in Figure 2, where even the lowest concentrations of endotoxin—which are barely measurable in the LAL assay—could induce moderate-to-strong cytokine responses.
Polymyxin treatment of LPS removed more than 97% of the endotoxin reactivity (Table 2). Polymyxin treatment of the glucan preparations also removed most, but not all (60–95%) of the endotoxin reactivity as measured in the LAL assay, and the effectiveness of the treatment varied depending on the glucan preparation (Table 2).
Figure 4 shows the IL-6 concentrations after whole blood stimulation with polymyxin-treated and non-treated LPS, and various glucans with strong cytokine inducing potency. As expected from the LAL measurements, the treatment of the standard E. coli LPS solution caused a >95% loss of its IL-6-inducing potency. However, the cytokine stimulatory potency of glucans in the WBA was not, or much less, affected, and definitely not completely abolished by the polymyxin treatment.
Comparison of IL-6 concentrations induced in the WBA by six glucans (baker’s yeast glucan, pullulan, pustulan, lichenan, curdlan, xyloglucan) and the LPS positive control solution before (closed symbols) and after polymyxin treatment (open symbols).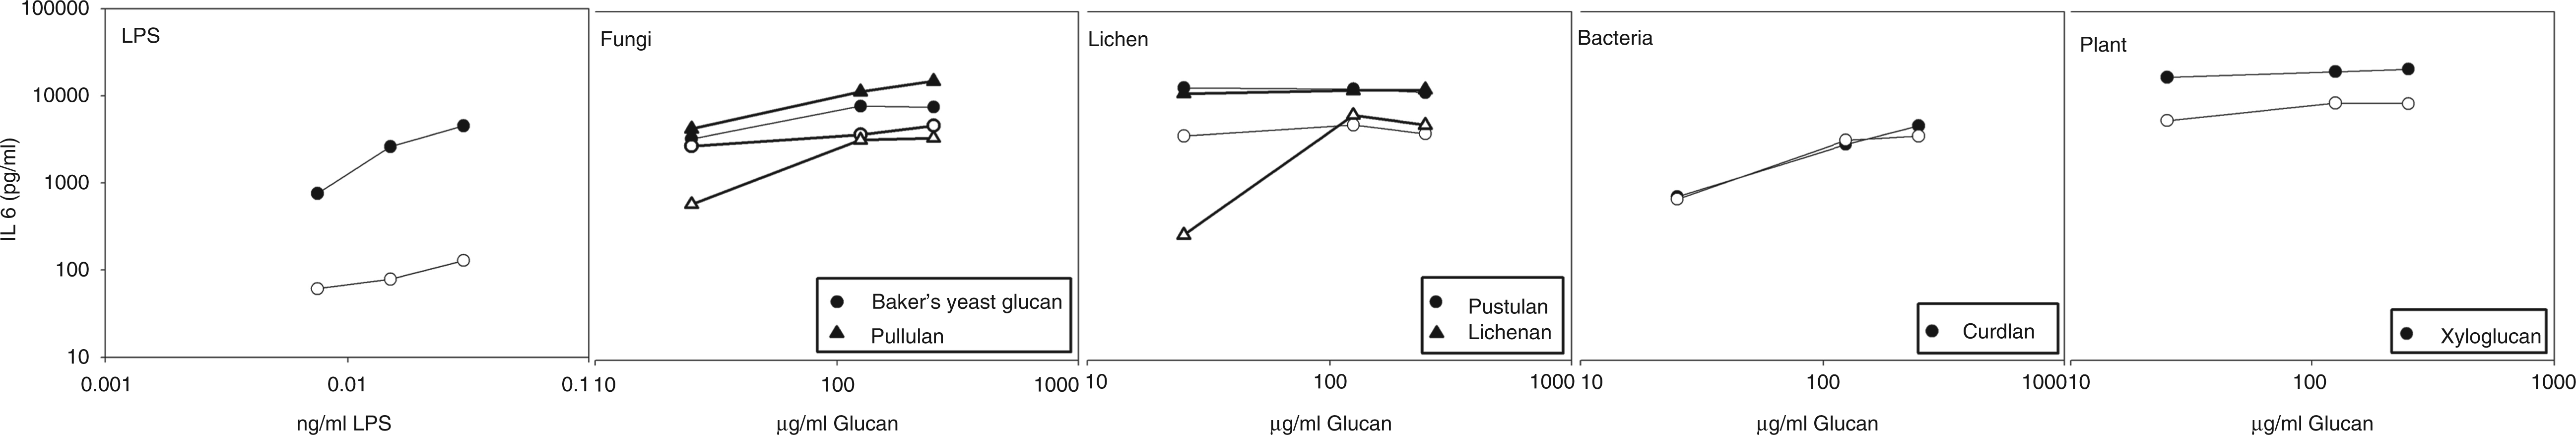
Overall, the results of the polymyxin treatment confirmed that the cytokine-inducing potential of most of the glucan preparations was not a result of endotoxin contamination. Moreover, none of the glucan solutions induced IL-6 responses corresponding to its apparent endotoxin content.
Discussion
A variety of differently structured glucans showed strong pro-inflammatory potential in the in vitro whole blood assay. Compared with endotoxin, there was no dose-response seen for many of the glucans which clearly induced a cytokine response. This is most likely the result from the relatively high stimulating concentrations applied. The high concentrations were selected in order to have the highest chance of also detecting the low cytokine induction potential of the various glucans, as established in a pilot experiment (data not shown). Thus, it is likely that the strongest inflammatory response inducing glucans will also lead to significant cytokine production at much lower concentrations in the range of 1 µg/ml or lower.
The levels of different cytokines produced in response to a certain glucan were highly correlated, suggesting that all glucan types elicit a similar, common type of inflammatory response. Interestingly, the glucans with the highest cytokine production potency had very different structures and molecular masses (Table 1): the pure β-(1→6)-glucan pustulan (20 kDa), the β-(1→3)-(1→4)-glucan lichenan (20–35 kDa), the β-(1→4)-glucan xyloglucan (202 kDa) and the α-glucan pullulan (118 kDa). The β-(1→3)-(1→6)-glucan from baker’s yeast (35–5000 kDa), β-(1→3)-glucan curdlan (53–2000 kDa) and β-(1→3)-(1→4)-glucan barley β-glucan (391 kDa) induced strong-to-moderate cytokine production, while scleroglucan [β-(1→3)-(1→6)-glucan, 1000–5000 kDa] and oat β-glucan [β-(1→3)-(1→4)-glucan, 1–300 kDa] induced moderate IL-6 and IL-8 production, and only low amounts of TNF-α and IL-1β. All other glucan preparations did not stimulate significant cytokine productions.
Low amounts of LPS, a component of the cell wall of Gram-negative bacteria, can induce strong cytokine responses and thus easily cause false-positives. Liebers et al. reported for 5 pg/ml LPS already substantial cytokine induction, 31 and we can report that even the low concentration of 2 pg/ml LPS induces moderate levels of IL-1β and TNF-α, and high levels of IL-6 and IL-8. We found relatively low-to-high endotoxin levels in the LAL measurements of some glucan preparations, although even here the measured LPS concentration (maximally 1071 ng/ml) related to only 0.1% of the total dry mass of the glucan preparations. This low amount might, indeed, have accounted for part of the strong cytokine-inducing potency of some glucans. Therefore, we treated all glucan solutions with polymyxin to remove possible LPS contamination. According to the LAL measurements the endotoxin activity of most glucan preparations was reduced by >80% and of the LPS control by 97% after polymyxin treatment, and, while the cytokine-inducing potential of all polymyxin-treated glucans was retained, the treated LPS control solution lost >95% of its cytokine-inducing capacity. Therefore, the pro-inflammatory potential of the glucans with an apparent endotoxin contamination was most likely not caused by LPS contamination.
Peptidoglycan (PGN) is a component of the bacterial cell wall (particularly of Gram-positive bacteria) and is a MAMP that induces signaling through the TLR and NOD-like receptor pathways. As PGN could be another possible contaminant, all glucan solutions used in this study were also tested for PGN at the University of Iowa, Pulmonary Toxicology Facility, using EIA. Pustulan showed the highest concentration of PGN in the analysis—namely 1.75 µg/ml in a 1 mg/ml preparation—thus slightly less than 0.2% of the dissolved glucan in the solution. This would mean that the highest dilution of pustulan in the WBA (25 µg/ml) —which still gave strong cytokine responses—contained maximally 45 ng/ml PGN. Rockel et al. 32 reported that PGN alone does not stimulate a cytokine response in human whole blood at 10 µg/ml and van der Meer et al. 33 found the same result for muramyldipeptide in human whole blood. Thus, the concentration of PGN measured in our glucan preparations was clearly below the minimum level required for cytokine induction. We therefore conclude that the pro-inflammatory potential of the glucans used in this study was most likely not caused by PGN contamination.
Despite the fact that we can conclude that the measured cytokine productions in this study were induced by the various investigated glucans rather than by LPS or PGN, there still may be the question of a possible interaction with another substance that may have been present in our glucan solutions. The NMR analysis, as well as the manufacturer’s information, does not exclude the presence of minor contamination at <5%, but it is highly unlikely that such contaminants would account for the high cytokine production seen with some of the glucans.
Our results for curdlan are similar to those of previous studies reporting high levels of IL-1β, TNF-α, IL-6 and IL-823,24 after whole blood stimulations with curdlan.
In vivo inhalation exposure studies in humans reported that IL-8 concentrations in nasal lavage samples were significantly higher after inhalation of dust spiked with curdlan than after exposure to non-spiked airborne dust alone. 34 We are aware that it is challenging to extrapolate results of in vitro work back to the biology of the intact organism, and the glucan concentrations used in the present and other studies to examine pro-inflammatory potential in vitro are much higher than the in vivo exposure dose of glucans that would be expected after inhalation of airborne glucans the home or occupational environment,35–37 which would only amount to ng glucan per kg body mass. Despite the pro-inflammatory nature of β-(1→3)-glucans in the previously reported in vitro studies,22–25 a series of studies investigating inhalation exposures of pure β-(1→3)-glucans in guinea pigs, mice or humans showed conflicting results, reporting no effects nor a neutrophilic or eosinophilic response (reviewed by Douwes 38 and Rylander 39 ). The same is observed in epidemiologic studies reporting associations between indoor β-(1→3)-glucan exposure and inflammatory reactions of the respiratory system,34,40–44 as well as protective effects of glucan exposure in early childhood against the development of asthma and allergy.45–48 Apart from the chemical structure, the solubility and the dose level have been suggested to play a role, based on comparisons between studies and a limited number of glucans within each study. In our current study—including a broad range of glucans, with confirmed structures within the same experimental model—no clear relation between chemical characteristics and cytokine-inducing potency could be recognized. Thus, one may conclude, that while in vitro studies may not be easily extrapolated to the biology of the intact organism, such studies are necessary to uncover the mechanisms behind the effects found in intact organisms.
For β-(1→3)-glucan, the pattern recognition receptor dectin-1 has been described as a primary receptor, 15 and binding to it will likely lead to the induction of cytokine responses. As dectin-1 only binds structures containing a β-(1→3)-linked backbone, but not pure β-(1→6)-glucan or the plant-type linear β-(1→3)-(1→4)-glucan like lichenan, barley or oat β-glucan,26,49 it is unlikely that the cytokine production induced by the tested glucans in this study was dectin-1 mediated in all cases. Thus, other dectin-1 independent mechanisms have to be considered. Complement receptor 3 (CR3) has been reported to bind β-glucans. CR3 binds barley and yeast glucans, as well as other polysaccharides, via its lectin site-located C-terminal to the I-domain. 50 Further CR3-mediated interaction with neutrophils may induce phagocytosis and thus lead to the induction of cytokine production by glucans, such as pustulan, lichenan, barley and oat β-glucan, which are not binding to dectin-1. A third possible mechanism could be anti-β-glucan Ab coating the glucan particles, leading to opsonization of the according glucans, followed by dectin-1 or CR3-independent monocyte activation via binding to the cell’s membrane Fc-receptors. In a previous study we confirmed the recent findings of Chiani et al. 11 that high anti-β-glucan Ab levels can be found in many normal human sera. The predominant antigenic structure appeared, in both studies, to be associated with β-(1→6)-linkages,11,12 which may explain induction of cytokine production by glucans containing β-(1→6)-linkages not binding to dectin-1 or CR3. Interestingly, both β-(1→3)-(1→6)-glucans—scleroglucan and baker’s yeast glucan—were capable of dectin-1 binding; 26 in our serologic studies we found high anti-scleroglucan, as well as anti-baker’s-yeast-glucan IgG levels, 12 but only baker’s yeast glucan induced moderate cytokine production. Furthermore, barley β-glucan—not binding to dectin-126,49 and in our serologic study an apparently poor IgG-binding antigen 12 —induced considerable cytokine production in the WBA. Thus, it seems reasonable to assume that the induction of cytokine production by several glucans may involve different and more complex mechanisms than we are yet aware of.
Our study reports a comparison of the pro-inflammatory potential of various glucan types. Our results clearly show not only that the β-(1→3)-glucans stimulate innate immunity but also that β-(1→6)- and β-(1→4) structures can elicit strong cytokine responses. The β-(1→6)-glucans even seem to have a much greater potential in eliciting immune responses compared with the much-investigated β-(1→3)-glucans. This is a new observation and in line with previously published studies.11,13,51
As it is generally accepted that the—in this study less reactive—β-(1→3)-glucans may have an effect on the immune system after inhalation of considerably lower concentrations, similar in vivo responses to inhaled low concentrations of the—in this study highly reactive—β-(1→6)-glucans are plausible. Therefore, we feel that it is reasonable to suggest that the biology of β-(1→6)-glucans may be an interesting new addition to future research, both in epidemiologic exposure studies and in studies investigating immunologic mechanisms for anti-fungal responses and general immune system skewing.
Footnotes
Funding
This study was financially supported by the European Commission as part of GABRIEL, contract number 018996 under the Integrated Program LSH-2004-1.2.5-1. I.N is financially supported by the German Research Foundation (Deutsche Forschungsgemeinschaft) (grant no. NO 928/1-1). PST is supported by U.S. NIH P30 ES005605.
Acknowledgement
We would like to thank D. W. Lowman for the NMR measurements and J. P. Kamerling for his help with the interpretation of the resulting spectra. We thank N. Metwali for peptidoglycan measurements.