
Abstract
Although the limulus amebocyte lysate (LAL) assay is widely used to determine the concentration of LPS in biological samples, it is known to be susceptible to interference caused by substances of non-bacterial origin. In particular, polysaccharides such as β-glucans and pectic polysaccharides from fungi or plants, respectively, were shown to give higher LPS readings than were actually present in the sample. Here, we describe an assay for the determination of LPS in biological samples based on the stimulation of TLR4/MD2/CD14 transfected HEK293 cells which dose dependently release IL-8 upon stimulation with increasing concentrations of highly purified Escherichia coli LPS. The resulting standard curve is used to determine the LPS concentration in unknown samples. We show that the outcome of the LPS stimulation is not affected by the presence of β-glucans or other environmental substances found in dust extracts. Although, we present evidence that the LPS concentration measured with the kinetic chromogenic LAL test correlates with data from the TLR4 assay, the LAL test displays higher LPS readings. We conclude that the described TLR4 assay is a reliable alternative to assess the concentration of LPS in environmental samples without being influenced by polysaccharides such as β-glucans and other environmental substances found in dust extracts.
Introduction
Since the hygiene hypothesis has come into focus of allergologists, several studies have concentrated on the measurement of LPS in environmental samples. Some studies revealed that exposure to high concentrations of LPS in the environment correlates well with the protection from allergic airway diseases, such as asthma. 1 However, LPS is discussed as one reason for the induction of occupational lung disease in farm workers.2,3 The beneficial or disease-provoking effects of LPS in humans might depend on the concentration of this microbial molecule in the environment.4,5 The most frequently used method for the quantification of LPS is the limulus amebocyte lysate (LAL) test. However, it is already known from the literature that the LAL test displays virtually higher LPS levels in environmental samples than are actually present. This was shown by comparison of LPS measurements taken by the LAL test with the determination of the concentration of 3-hydroxy fatty acids—a more precise chemical method for the determination of LPS. 6
The LAL test is critically influenced by polysaccharides, such as β-(1→3)-
Given the influence of environmental substances such as β-glucans on the LAL test and the cost-intensiveness of other assays with a higher specificity for LPS, we have developed an assay to determine the concentration of LPS in environmental samples by using HEK293 cells transfected with TLR4/MD2/CD14. We show that this assay gives reliable results with LPS from different bacterial species and that this assay is not affected by environmental substances other than LPS.
Materials and methods
Chemicals
LPS from Escherichia coli wild type, E. coli Nissle and Salmonella enterica sv. Minnesota were purified by phenol/chloroform extraction and subsequently purified by chromatography.
15
Ovalbumin (grade V) and β-(1→3)-
Cell culture
HEK293 cells stably transfected with a pUNO expression vector for TLR4/CD14/MD2 were purchased from Invivogen (Cayla, France). The cells were cultured in DMEM 10% FCS with normocin, hygrogold, penicillin and streptomycin as antibiotics. The medium was supplemented with Blasticidin for the positive selection of the plasmid-containing cells, as described by the manufacturer. Cells were sub-cultured before reaching confluence by short treatment with DetachinTM from AMS Biotechnology (Frankfurt, Germany).
HEK293-null control cells were transfected with a pUNO vector conferring Blasticidin resistance but lacking coding regions for the receptors. These cells were used as a control in the described experiments. None of the substances used in this work led to stimulation of IL-8 release from these control cells.
Stimulation of the transfected HEK293 cells with LPS
The cells were cultured in a density of 106 × ml−1 in a 96-depot cell culture plate in 100 µl DMEM medium containing 10% FCS. A standard curve was generated by stimulating the cells with 100 µl of E. coli LPS dissolved in DMEM reaching a final concentration of 10 pg/ml to 10 ng/ml for 24 h. Subsequently, IL-8 production was measured in the tissue culture supernatants. This standard curve was used to determine the TLR4-stimulating capacity in the different samples and expressed as E. coli LPS equivalent in ng/ml.
Determination of IL-8 in the cell culture supernatants
The supernatants were collected and centrifuged to sediment the cellular debris. The cleared supernatants were measured with an IL-8 OptEIA kit according to the manufacturers protocol (BDbiosciences, San Diego, CA, USA).
Environmental samples
Mattress dust was collected and extracted as described previously.1,16 To analyze whether substances from the extract had an influence on the assay, we subjected a pool of mattress dust extract to Endotrap blue affinity chromatography to remove LPS. Residual substances were used to spike the assay. Endotrap chromatography was performed according to the manufacturers’ protocol (Hyglos GmbH, Regensburg, Germany).
Statistical analysis
To determine the LPS concentration in unknown samples, a standard curve was generated by plotting the IL-8 concentration versus the logarithmic transformed LPS concentration used to stimulate the cells. Graph Pad Prism (Version 5.01) was used to generate a dose-response curve and to extrapolate the LPS concentration from unknown sample.
Results
Characterization of the reactivity of LPS on TLR4/CD14/MD2-transfected HEK293 cells
First, the TLR4 assay was characterized with wild-type LPS from E. coli. The minimum detectable concentration giving IL-8 readings above background levels was 10 pg/ml E. coli LPS. Concentrations above 1 ng/ml LPS usually resulted in a maximal stimulation of the HEK93 cells with no further increase of IL-8 release (Figure 1A). The standard curve was used in the range of the highest slope to determine unknown LPS concentration in a sample (usually between 10 and 1000 pg/ml). For determination of the coefficient of variation (CV), a sample of 0.1 µg/ml pure E. coli LPS was measured 10 times, resulting in a mean of 0.12 ± 0.02 µg/ml and a CV of 17%.
(A) Stimulation of CD14/TLR4/MD2-transfected HEK293 cells with E. coli LPS (WT). (B) Stimulation of cells with a mixture of LPS from three different bacterial strains (E. coli wild-type, E. coli Nissle, S. enterica sv. Minnesota) in comparison to stimulation with pure E. coli LPS from the wild type strain. (C) Stimulation of cells with FSL-1, a lipopeptide known to activate the TLR-2/6 heterodimer. IL-8 release was measured after stimulation with increasing concentrations of these substances for 24 h. All samples were run in duplicates. Data points represent mean with SEM.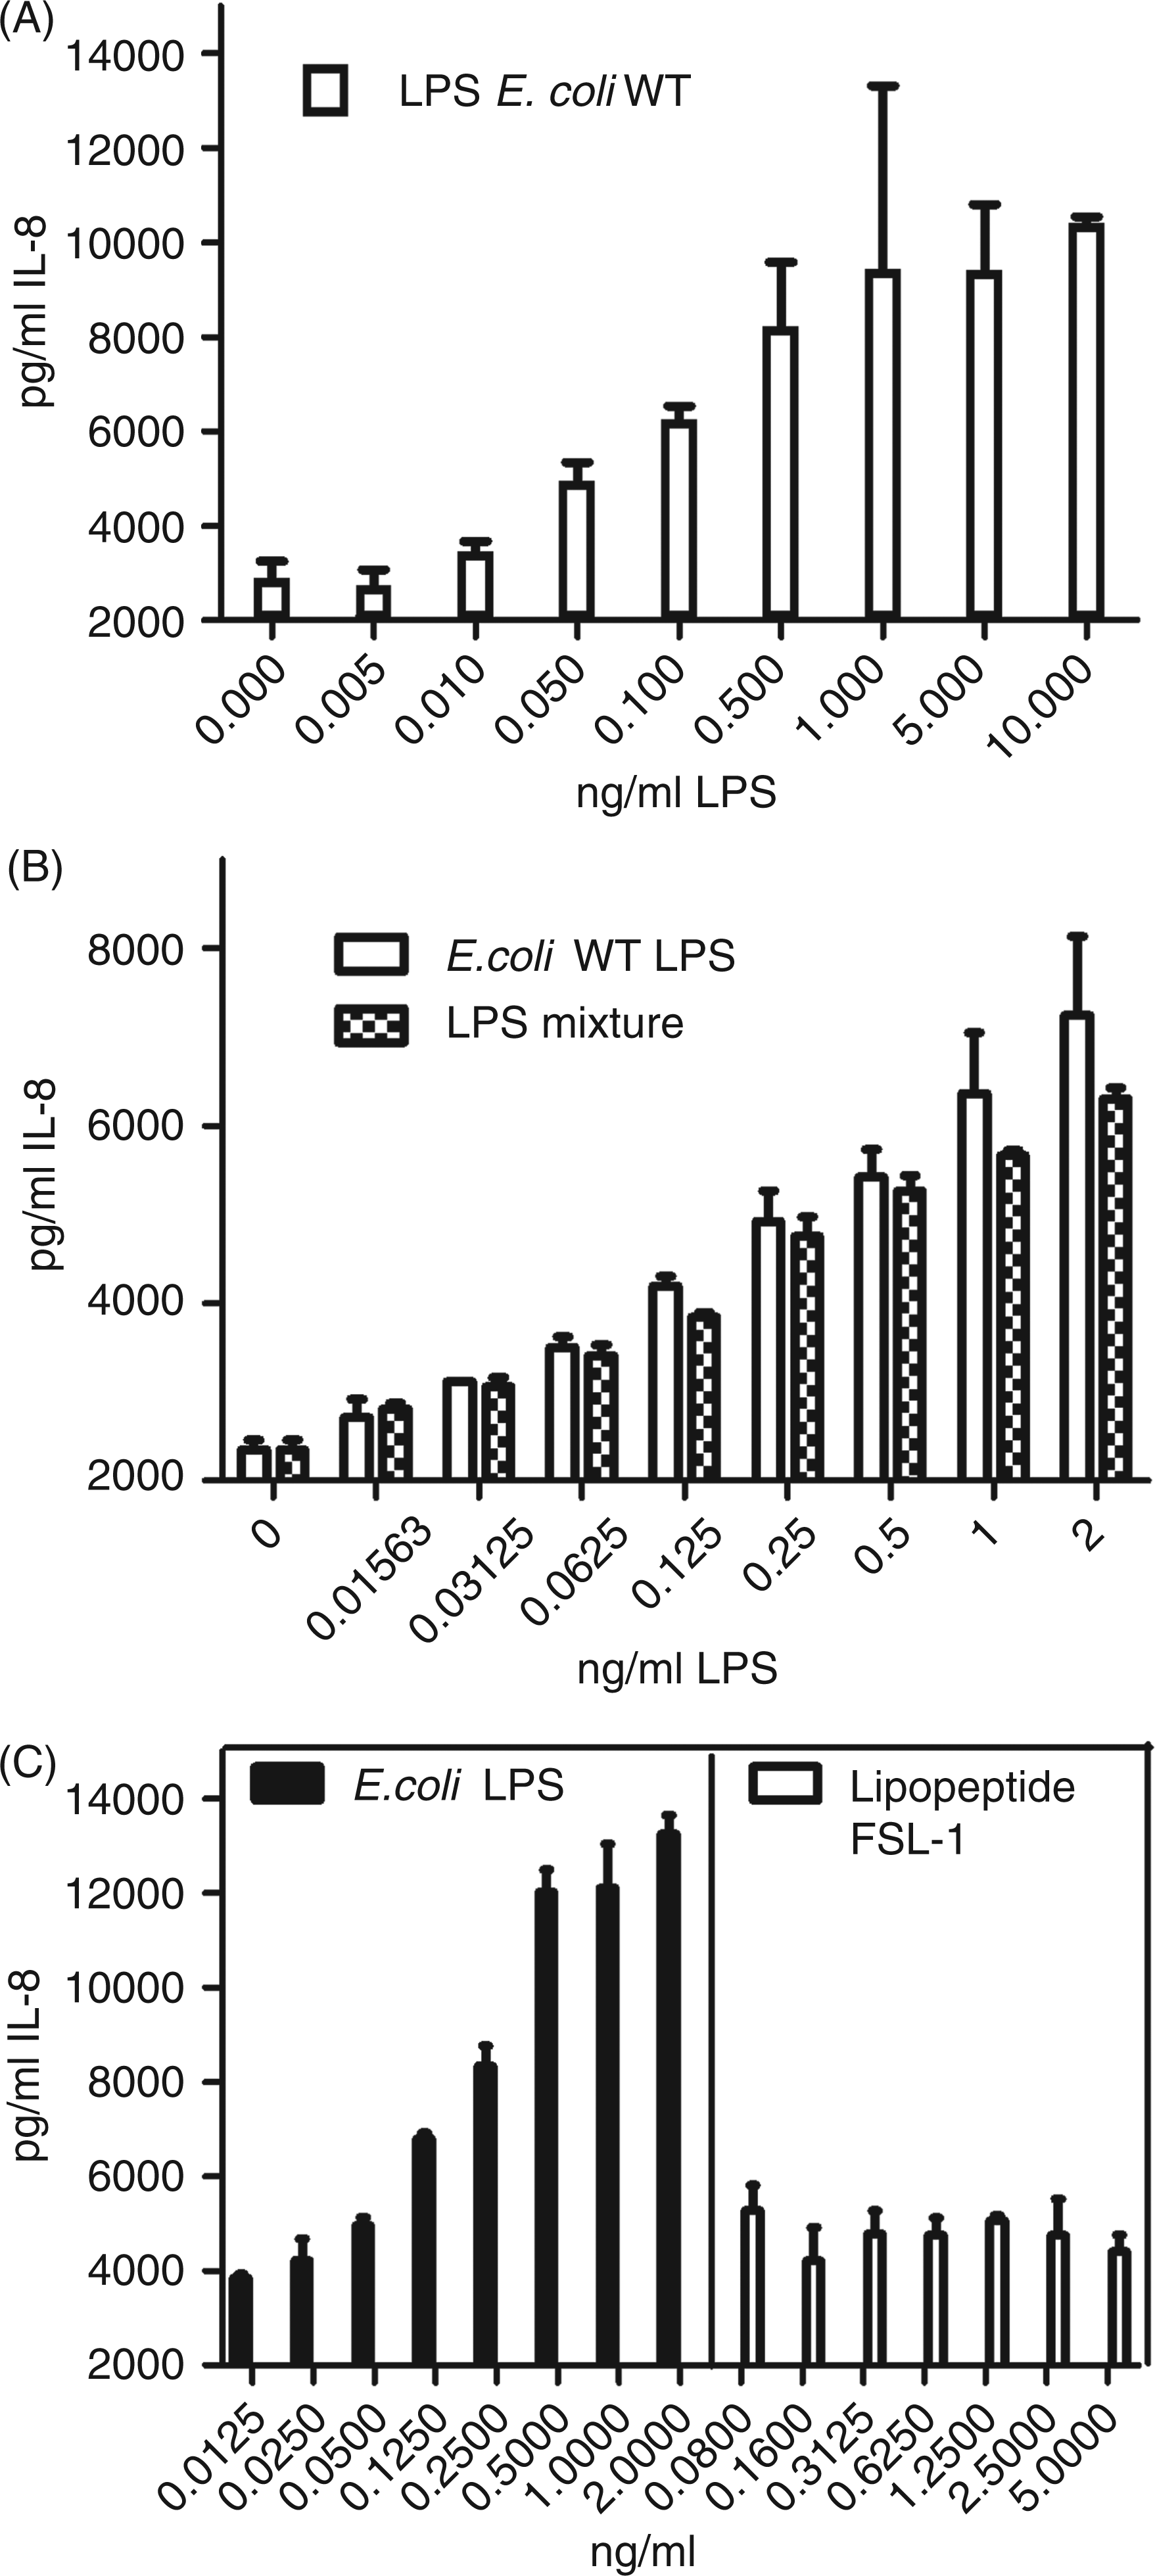
To analyze the reproducibility of the determination of the LPS concentration in organic samples we measured the LPS concentration in endotoxin-contaminated ovalbumin at three different time points resulting in three independent measurements resulting in a mean concentration of 3.01 ± 0.40 ng/ml.
As environmental extracts contain a mixture of LPS from different bacterial species we next determined whether results would differ from the E. coli standard curve when a mixture of different LPS was used. Therefore, IL-8 release resulting from a mixture of LPS, namely E. coli wild type, S. enterica sv. Minnesota and from E. coli Nissle, was compared with stimulation with LPS from E. coli wild type alone. As shown in Figure 1B, there is no difference between these two reagents.
As a control for the specificity of the assay, the HEK293 cells that were transfected with the empty vector were stimulated with LPS from different bacterial species or cells were stimulated with dust extract known to contain different pattern recognition receptor-stimulating substances. Neither TLR4 nor TLR2 agonists, nor β-(1→3)-
To analyze whether IL-8 production of the TLR4/CD14/MD2-transfected HEK293 cells is a specific reaction to LPS and not induced by another TLR-activating reagent, we stimulated the cells with the synthetic lipopeptide FSL-1 which is known to lead to strong activation of the TLR2/6 heterodimer. As shown in Figure 1C, stimulation with this lipopeptide did not activate the cells, showing that IL-8 production upon LPS stimulation is a specific reaction to this TLR4 ligand.
Environmental substances other than LPS do not interfere with the TLR4 assay
Next, it was important to find out whether there are substances in environmental samples that have an influence on the results of the TLR4 ligand assay. For instance, for pectic polysaccharides and β-(1→3)- Cells were stimulated with increasing concentrations of LPS in the presence of either different concentrations of β-(1→3)-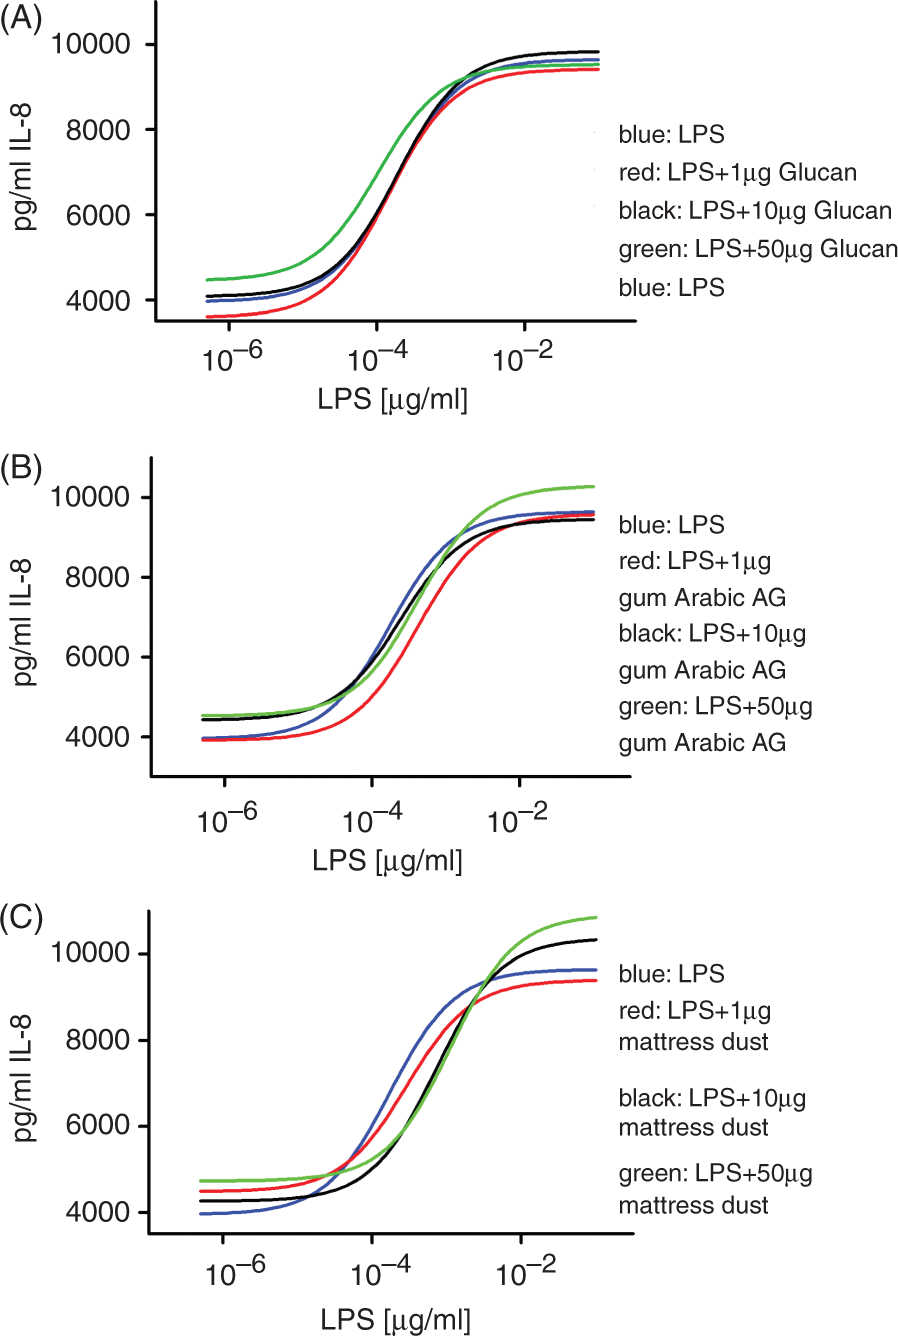
To further investigate the influence of environmental substances on TLR activation we removed LPS from mattress dust extract by means of Endotrap affinity chromatography. The LPS content of the mattress dust extract used for this study was 44 ng/mg. Following affinity chromatography, the LPS content of the dust extract was reduced to 7 ng/mg; however, it was impossible to get an extract free of LPS by this method. Subsequently, the LPS-reduced extract was used to spike a LPS standard used for stimulation of the TLR4 transfected cells (Figure 2C). Spiking of the LPS standard with the LPS-reduced extract did not lead to alteration of the shape of the standard curve revealing that the presence of substances in mattress dust extract does not have an impact on the quantification of LPS. However, spiking with the 10 and 50 µg/ml concentration of extract resulted in detection of slightly increased LPS levels, likely derived from LPS residues in the dust extract remaining after Endotrap chromatography.
Comparison of the LPS determination in mattress dust extracts by the LAL test and the TLR4 assay
Determination of LPS in mattress dust extract by means of LAL assay and TLR4 assay, respectively.
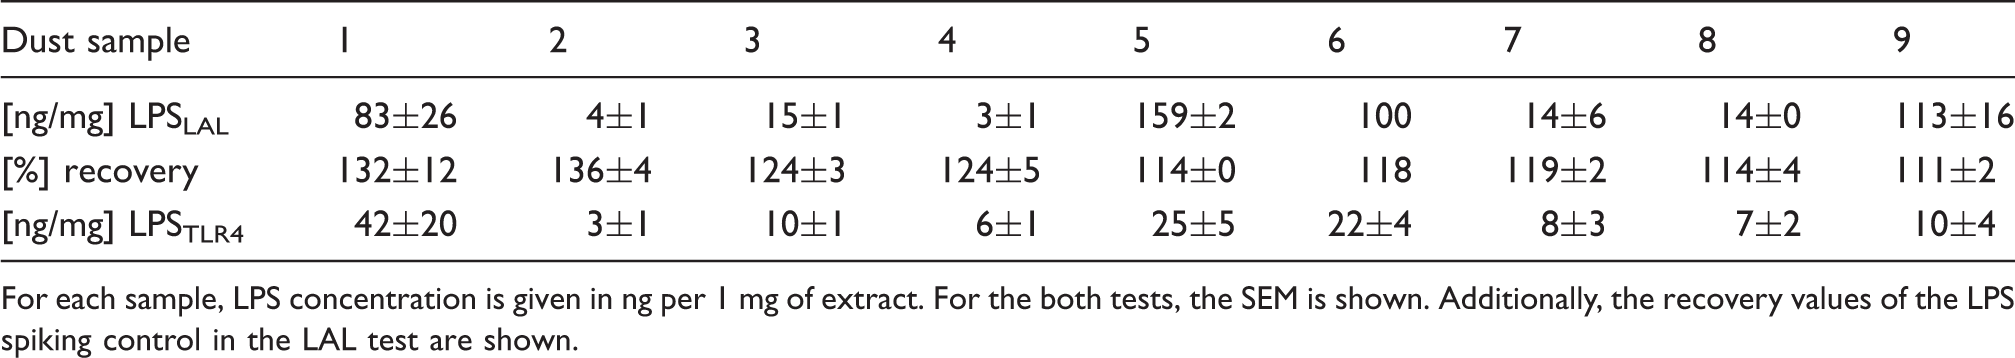
For each sample, LPS concentration is given in ng per 1 mg of extract. For the both tests, the SEM is shown. Additionally, the recovery values of the LPS spiking control in the LAL test are shown.
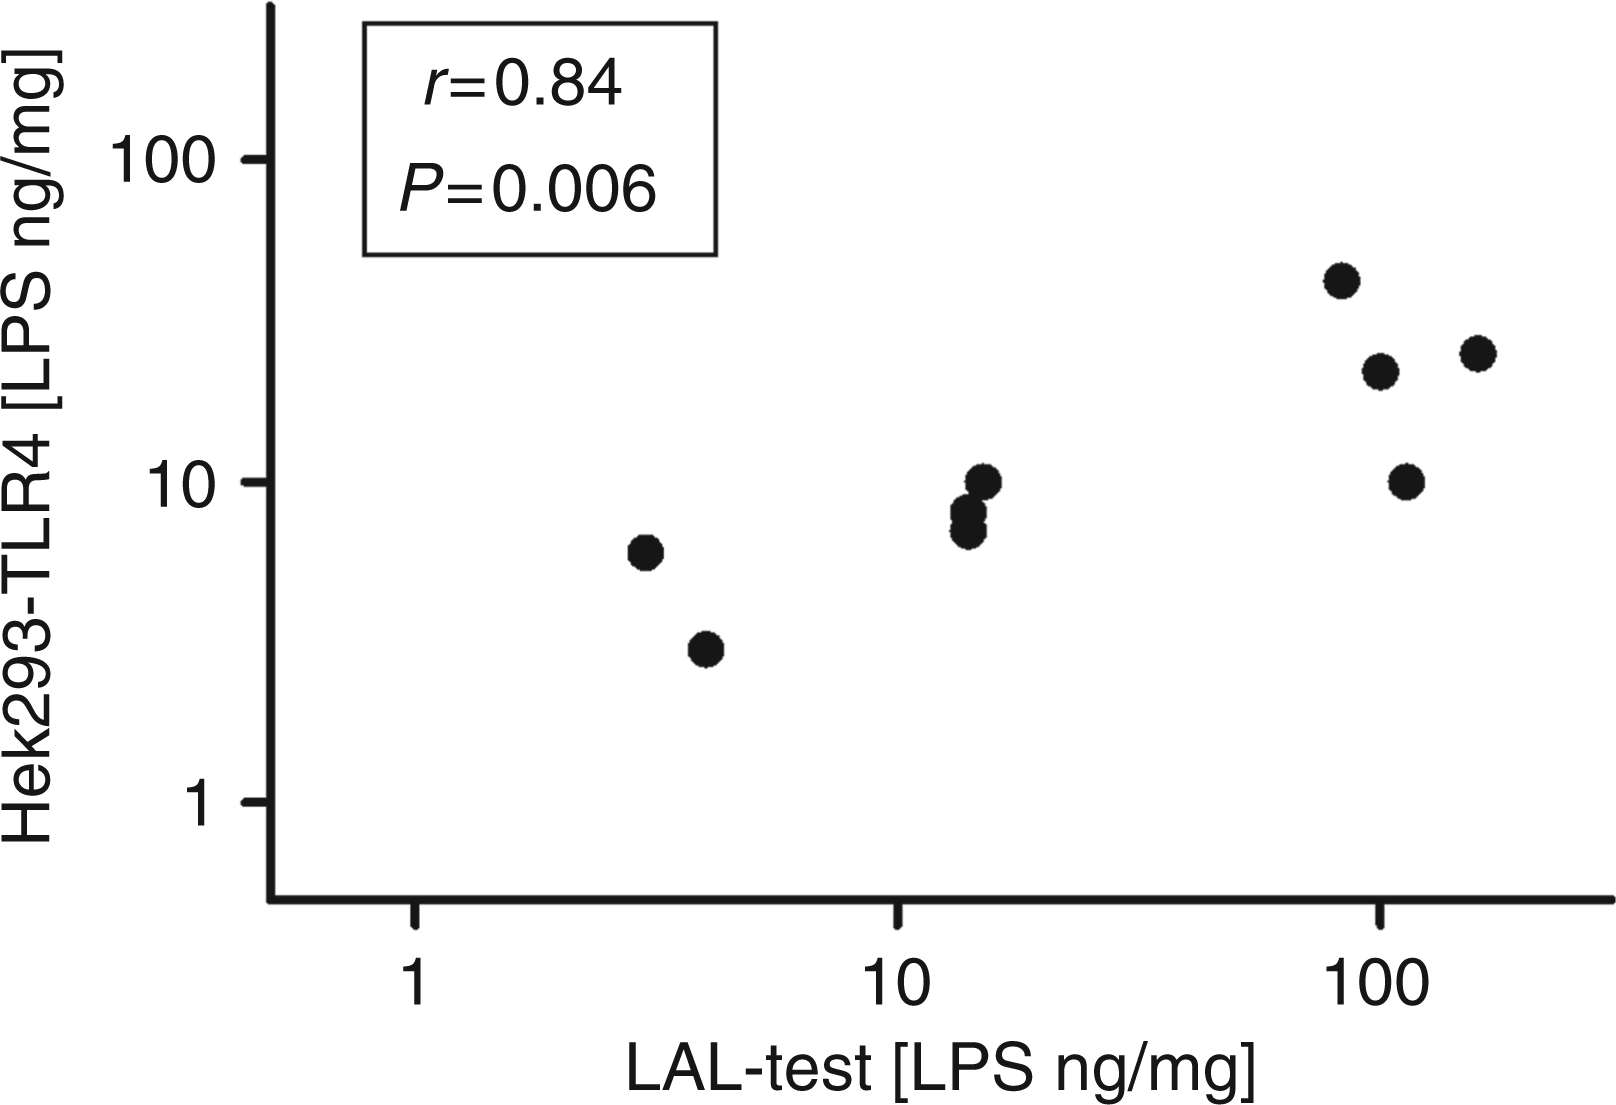
Correlation analysis between the LPS concentration as measured with the LAL test (mean of two independent measurements) or with the TLR4 assay (mean of three independent measurements). Mattress dust was extracted with isotonic NaCl solution. Subsequently, extracts were subjected to either the LAL test or the TLR4 assay. LAL test was carried out as described by the manufacturer. TLR4 assay was done by stimulation of cells for 24 h. Concentration was correlated. Nonparametric Spearman correlation coefficient (r) and the two-tailed P-value are shown.
Discussion
The aim of this study was to develop a sensitive assay for the determination of the concentration of endotoxic LPS in environmental samples with reduced susceptibility to interference by other substances. We present here a reliable assay useful for the sensitive detection of endotoxic LPS in biological fluids and environmental samples.
The widely used LAL test was found to be a valuable tool for measuring LPS in different kinds of samples, for instance in pharmaceutical preparations. However, in more heterogeneous mixtures such as extracts from biological material, it was already shown that some substances interfere with the outcome of the LAL test. One class of substances known to have an influence on the LAL assay are β-glucans.7–10 Presence of these fungal polysaccharides is known to display virtually higher LPS measurements than actually present in the sample as a result of the activation of the clotting cascade of the LAL reagent. As β-glucans are derived from fungal cell walls, these polysaccharides are common in all environmental samples.12,17 This may explain why measurement of LPS in environmental dust extracts by means of the LAL test gives higher concentrations in comparison to measurement with the TLR4-transfected cells. We show here that glucans, and other environmental substances, do not have an impact on LPS determination in the TLR4-ligand assay.
Other tests were developed to detect LPS in various samples. For instance, mononuclear cells were stimulated with LPS followed by the measurement of proinflammatory cytokines. However, this assay also seems to be influenced by substances other than LPS as Kikkert et al. have shown that activation of monocytes with β-(1→3)-
One advantage of the described assay is that LPS is measured selectively, as TLR4 is exclusively bound by LPS. There are only a few reports showing that other substances may interfere with the TLR4 receptor, for example taxol from yew trees. 19 Moreover, there are reports showing that heat shock proteins might activate TLR4. 20 However, these substances are unlikely to be found in environmental extracts as we showed here that environmental extracts depleted of LPS do not lead to TLR4 activation.
However, one must keep in mind that the bioassay described here is not detecting all different kinds of LPS. LPS from Rhodobacter sphaeroides, for instance, is likely to give negative results in this assay as it is known to be a TLR4 antagonistic molecule. 21 Thus, to determine the exact molar concentration of all kinds of LPS in a sample, a GC/MS approach must be used. 14 However, in most instances it is of interest to quantify LPS molecules with endotoxic potential. For this purpose, the TLR4 assay is a suitable option.
We conclude that the described assay is a valuable tool to detect LPS in samples from various origins with marginal interference by other molecules giving the opportunity to make reliable measurements of LPS in environmental samples where these properties are from particular importance.
Footnotes
Funding
This research received no specific grant from any funding agency in the public, commercial, or not-for-profit sectors.
Acknowledgements
We are grateful to Sandra Werner for excellent technical assistance and would like to thank Prof. Ulrich Zähringer (Forschungszentrum Borstel, Germany) for providing us with E. coli LPS. We would also like to thank Dr Verena Liebers (Institut für Prävention und Arbeitsmedizin der Deutschen Gesetzlichen Unfallversicherung Institut der Ruhr-Universität Bochum, Germany) for performing the LAL assay. Mattress dust extracts were provided by the European GABRIEL study consortium. We also thank Prof. Otto Holst (Forschungszentrum Borstel, Germany) for providing us with the extracts.