
Abstract
This study was designed to test the responses of TLR2-knockout mice (TLR2-KO) and wild- type mice (C57/BL-6), and of CD36 deficient spontaneously hypertensive rats (SHR) and their genetic controls [Wistar Kyoto (WKY) rats] to systemic stimulations with the TLR2/6 agonist MALP-2 and the TLR4 agonist LPS. Fever and formation of TNF-α and IL-6 induced by intraperitoneal injections of MALP-2 (1000 µg/kg) were completely blunted in TLR2-KO, while LPS (100 µg/kg)-induced responses were not abolished in these animals. In SHR lacking CD36, a reduction of fever was observed in response to MALP-2 (100 µg/kg), but LPS-fever was even more attenuated in SHR when compared with WKY controls. Concentrations of circulating IL-6 tended to be lower in SHR after stimulation with both pyrogens. However, the IL-6-mediated activation of the transcription factor STAT3 in the brain was identical in both strains, indicating that the brain-controlled inflammatory response to MALP-2 (and LPS) is not impaired in the absence of CD36. In addition, stimulation of peritoneal macrophages with LPS and MALP-2 (10 µg/ml) caused the appearance of similar concentrations of bioactive cytokines in the supernatants from cells of both rat strains. These results demonstrate that TLR2 is essential for the manifestation of MALP-2, but not LPS-induced inflammatory responses. A moderate participation of CD36 in MALP-2-induced sickness- and cytokine-responses can not be ruled out but is unlikely as LPS-induced inflammatory responses were also attenuated in SHR.
Introduction
TLRs recognize conserved pathogen-associated molecular patterns (PAMPs) from diverse microorganisms. 1 For example, LPS from Gram-negative bacteria, the most frequently used agent to induce experimental fever, is recognized by TLR4,2,3 and it has recently been shown that all phases of LPS-induced fever depend on TLR4 signaling. 4 Bacterial lipopeptides, on the other hand, are recognized via TLRs 1, 2 and 6, which can form functional pairs for pattern recognition to evoke a full cellular response to such molecules including MALP-2, which is the natural component of the wall-less bacterium Mycoplasma fermentans. 5 – 9 Within the last few years, evidence for substantial therapeutic capacities of MALP-2 has accumulated. The substance is useful as a mucosal adjuvant, especially for intranasally administered vaccines.10,11 It further accelerates the healing of skin wounds, 12 and injections of MALP-2 into pancreatic tumors appear to have beneficial effects in human patients. 13 A detailed analysis of how a treatment with MALP-2 affects the organism is therefore warranted, especially because of the fact that treatment of human patients with this substance caused septic shock-like states with cardiac arrest or hypovolemia in single individuals. 13 In previous studies, we investigated the manifestation of brain-controlled nonspecific illness responses of rats injected systemically, 14 or locally,15,16 with MALP-2 to characterize possible side-effects of therapeutic treatments. With regard to the cellular mechanisms responsible for the observed responses in vivo, some interesting data have been published within the last years. On the one hand, the formation of heterodimers of TLR2 with TLRs 1 or 6 appears to be involved in the discrimination between diacyl and triacyl lipopeptides by the innate immune system. 1 In addition, it was shown that a mutation, and thereby inactivation, of the scavenger receptor CD36 made murine macrophages much less sensitive to a stimulation with MALP-2. 17 The authors of this, and of another, study 18 suggested a critical role for CD36 as a sensor of diacylglycerides, such as MALP-2, which associates with the respective TLRs and may be required for the MALP-2-induced signal transduction.
Based on these observations, the specific goals of this study can be summarized as follows: (i) using TLR2-deficient mice, we aimed to prove whether TLR2 is essential for a full manifestation of brain-controlled illness responses (i.e. fever) after stimulation with MALP-2; (ii) using CD36-deficient, spontaneously hypertensive rats (SHRs),19,20 we tried to characterize the postulated role for CD36 in the manifestation of MALP-2-induced responses in vivo; And, (iii) we further tested the responses of TLR2-KO mice and SHRs and their respective genetic controls to systemic stimulation with LPS, as LPS-induced fever has not yet been investigated in these strains of experimental animals. We show that MALP-2-induced responses in vivo are completely abolished by TLR2-deficiency. On the other hand, the in vitro observation that MALP-2-mediated cellular activation strongly depends on CD3617 could not be confirmed in vivo. Surprisingly, the LPS-induced responses of SHRs were more attenuated than MALP-2-induced fever or cytokine formation in the CD36-deficient animals.
Materials and methods
Animals
The first series of experiments was performed in wild-type (C57/BL-6, purchased from Charles River Laboratories, Sulzfeld, Germany) and TLR2-deficient (TLR2-KO) mice ninefold backcrossed towards the C57/BL-6 genetic background. 21 Male mice with a body weight of 23–28 g were used for the experiments. After surgery (see below), the mice were individually housed in a temperature- and humidity-controlled climate chamber (Typ 10’US/+5 − +40 DU, Weiss Umwelttechnik GmbH, Reiskirchen, Germany) at an ambient temperature of 30°C and 50% humidity. Animals had constant access to water and were fed with standard lab chow ad libitum.
The second series of experiments were performed in CD36-deficient, SHRs (obtained from an in-house breeding colony in the Department of Physiology, University of Giessen, Faculty of Medicine) and their genetic controls [Wistar Kyoto (WKY) rats obtained from Charles River Laboratories]. Male rats with a body weight of 200–230 g on the day of surgery (see below) were used for the experiments. Again, the animals were individually housed in the climatic chamber (Weiss Umwelttechnik GmbH), which was adjusted to 25°C and 50% humidity for this species. The rats had constant access to water and were fed with powdered, standard lab chow ad libitum, which was required for telemetric measurement of cumulative food intake (see below).
Artificial lights were on from 07:00 to 19:00. Body weight was determined once on a day (∼09:00 to 09:30). The animals were surgically prepared for telemetric measurement of body temperature (see below) at least one week before the experiment. The experiments were carried out in accordance with the local ethics committee (ethics approval number GI 18/2 – Nr. 15/2007).
Substances
The biologically active R stereoisomer of MALP-2 was kindly provided by Prof. Mühlradt. It was synthesized and purified by HPLC as previously described. 8 MALP-2 was donated as a sterile, lyophilized, endotoxin- and pyrogen-free powder, which was then diluted in 10% Cremophor® EL—90% sterile PBS. Cremophor® EL is a non-ionic solubilizer and emulsifier designed for in vivo use in the human and veterinary pharmaceutical industry. Cremophor® EL was a kind gift from BASF Aktiengesellschaft (Ludwigshafen, Germany). For rats, MALP-2 was used at a dose of 100 µg/kg body weight, as described in a previous study. 14 Control experiments were performed with 10% Cremophor® EL in 90% PBS (solvent). For mice, pilot experiments were performed to find a pyrogenic dose of MALP-2. Tests with doses of 10, 100 and 1000 µg/kg MALP-2 revealed that a dose of 1000 µg/kg was required to induce a significant elevation of body temperature in mice.
LPS derived from Escherichia coli (serotype O111:B4, Sigma Chemicals, Deisenhofen, Germany) was suspended in sterile PBS. For mice and rats, a dose of 100 µg/kg LPS was used, which is a fever-inducing dose in both species investigated.22,23
Measurement of body temperature
The abdominal temperature of rats was measured using biotelemetry transmitters (battery powered VM-FH-discs for rats and XM-FH-discs for mice; Mini-Mitter, Bend, OR, USA) implanted into the abdominal cavity at least one week before the experiment. Before the surgery, mice and rats were anesthetized with 100 mg/kg ketamine hydrochloride (Albrecht, Aulendorf, Germany) and 5 mg/kg xylazin (Bayer Vital, Leverkusen, Germany). The output (frequency in Hz) was monitored by a receiver placed under each cage (RA 1000, Mini-Mitter). A data acquisition system (Vital View, Mini-Mitter) was used for automatic control of data collection and analysis. Body temperature was continuously recorded at 5-min intervals. For analysis and graphical documentation, temperature data at time intervals of 15 min were used.
Measurement of food and water intake
In rats, food intake and drinking behavior was telemetrically monitored at 5 min intervals by use of special cages equipped with water bottles and food supply dishes placed on balances, which, in turn, were connected via a DietScan analyzer to a personal computer (AccuScan Instruments, Columbus, OH, USA). The AccuDiet software package (AccuScan Instruments) was used to record, and later to transfer, the data for graphical and statistical analysis. Cumulative food and water intake per 5 min were combined into cumulative measures of food and water intake over a 24-h period. 14 Therefore, the final data represent cumulative food and water intake in grams per 24 h. The equipment for recording food and water intake was not applicable for the experiments performed with mice.
Measurement of blood pressure
In two groups of SH and WKY rats, systolic arterial blood pressure and heart rate were measured by use of a computerized microprocessor-based non-invasive blood pressure monitoring system on the tail of the conscious rat with the aid of a pressure cuff (TSE-Systems Inc., Midland, MI, USA; courtesy of Prof. K.D. Schlüter, Department of Physiology, Justus-Liebig-University of Giessen, Faculty of Medicine). The TSE system consisted of pulse transducers, pressure cuffs with pressure tubing, an animal restraining device and a control unit with integrated temperature control. All rats were repeatedly accustomed to the measurement procedure for 5–6 consecutive days prior to the final measurement.
Cytokine bioassays
Cytokine analysis was performed with plasma samples from mice or rats or supernatants from peritoneal macrophages stimulated either with MALP-2, LPS or the respective control vehicles (10% Cremophor® EL in 90% PBS for MALP-2, PBS for LPS). Determination of TNF-α was achieved by a bioassay based on the cytotoxic effect of TNF-α on the mouse fibrosarcoma cell line, WEHI 164 subclone 13. 24 The assay was performed in sterile, 96-well microtiter plates. Serial dilutions of biologic samples or different concentrations of a murine TNF-α standard (code 88/532, National Institute for Biological Standards and Control, South Mimms, UK) were incubated for 24 h in wells that had been seeded with 50,000 actinomycin D-treated WEHI cells. The number of surviving cells after 24 h was measured by use of the dimethylthiazol-diphenyl tetrazolium bromide (MTT) colorimetric assay. 25 Plasma samples were pre-diluted so that serial dilution of samples and standard dilution curves were parallel. The detection limit of the assay, after considering the dilution of samples into the assays, was 6 pg/ml TNF-α.
Determination of IL-6 was achieved by a bioassay based on the dose-dependent growth stimulation of IL-6 on the B9 hybridoma cell line. 26 The assay was performed in sterile, 96-well microtiter plates. In each well, 5000 B9 cells were incubated for 72 h with serial dilutions of biologic samples or with different concentrations of a human IL-6 standard (code 89/548, National Institute for Biological Standards and Control). Plasma samples were pre-diluted so that serial dilution of samples and standard dilution curves were parallel. The number of cells in each well was measured by use of the MTT assay (see above). The detection limit of the assay, after considering the dilution of samples into the assays, was three international units (I.U.) IL-6/ml.
PGE2-ELISA
PGE2 was determined by use of a commercially-available enzyme immunoassay (Assay Designs, Ann Arbor, MI, USA). The assay is based on the competitive-binding technique in which PGE2 in a sample competes with a fixed amount of alkaline phosphatase-labeled PGE2 for sites on a mouse mAb. During incubation, the mouse mAb was bound to a goat anti-mouse Ab that coated the wells of a microplate. After the sample was washed once to remove excess conjugate and unbound sample, a substrate solution was added to the wells for determination of the bound enzyme activity. Immediately after color development, absorbance was read at 405 nm on a microplate reader (Digiscan, Asys Hightech, Eugendorf, Austria). The color intensity inversely correlated with the PGE2 concentration in the sample. According to the manufacturer’s product information, the sensitivity of the PGE2 assay was 8.3 pg/ml.
STAT3 immunohistochemistry
In order to obtain information about the MALP-2/LPS-induced and IL-6 mediated inflammatory brain activation in SHRs and WKY rats, we analyzed the nuclear translocation of the transcription factor ‘signal transducer and activator of transcription 3’ (STAT3) in brain sites with an incomplete blood-brain-barrier, i.e. the organum vasculosum laminae terminalis (OVLT), the subfornical organ (SFO), the median eminence (ME) and the area postrema (AP). To detect STAT3 signals in the brain, free-floating brain sections were incubated with a rabbit anti-STAT3 Ab (sc-482, Santa Cruz Biotechnology, Heidelberg, Germany). Coronal 40 -µm brain sections were cut on a freezing microtome (model 1205, Jung, Heidelberg, Germany). Tyramide amplification was performed with a commercial amplification kit (NEL700, NEN Life Science Products, Cologne, Germany). Sections were placed into 10% normal horse serum containing 0.3% Triton X-100 for 1 h at room temperature (22°C). Sections were then transferred into 0.5% blocking powder to block the unspecific tyramine binding sites. Primary STAT3 Ab incubation (dilution 1:12000) was performed for 36–48 h at 4°C. The STAT3 Ab was then detected with a secondary biotinylated anti-rabbit Ab (1:200, Vector BA-1000, Linaris Biologische Produkte, Mannheim, Germany) for 1 h at room temperature. After amplification, the immunohistochemical processing was finished with an avidin biotin HRP complex (Vector Elite Kit, Linaris Biologische Produkte), which was visualized by diaminobenzidine hydrochloride (DAB, Sigma Chemicals) reaction in the presence of hydrogen peroxide. Finally, sections were counterstained with cresyl violet and cover-slipped with Entellan (Merck, Darmstadt, Germany) for light microscopic analysis. Controls for STAT3 immunoreactivity included processing sections without the primary Ab, or incubating sections with rabbit pre-immune serum instead of rabbit anti-STAT3 antiserum. In both cases, no STAT3 immunoreactivity was found in any brain area. Finally, the specificity of the STAT3 immunohistochemistry was proven by pre-adsorbing the primary Abs with the antigen.27,28 Sections were analyzed by use of an Olympus BX50 light microscope (Olympus Optical, Hamburg, Germany). Digital images were taken with an Olympus Camedia C-3030 camera and the Olympus Camedia Master 2.0 software package.
The numbers of STAT3-immunoreactive cell nuclei were quantitatively evaluated in both rat strains for the aforementioned structures (the OVLT, the SFO, the ME and the AP), 120 min after systemic intraperitoneal treatment with MALP-2 or cremophor, LPS or PBS, respectively. This time point was chosen according to previous studies in which LPS- or MALP-2-induced nuclear STAT3 translocation in brain cells reached maximal values 2 h after the respective stimulation.15,23 For each investigated animal, three sections of each brain structure were evaluated. A microscopic counting grid (200 µm × 200 µm) was used at × 400 magnification to determine the number of STAT3-positive cell nuclei per section within the OVLT, the SFO, the ME and the AP. Therefore, the quantitative data finally represent the means (three sections from each structure per individual animal) of the means (animals of a given group; n = 3 for each group).
Preparation and cultivation of peritoneal macrophages
SHR and WKY were deeply anesthetized with a mixture of ketamin/xylazin (see above). Peritoneal macrophages were harvested by injecting 20 ml of sterile PBS into the abdominal cavity, which was gently massaged for 15 min thereafter. Then, the abdominal cavity was opened, the lavage solution collected with a syringe and immediately centrifuged for 5 min at 4°C. The pellet was incubated for 2 min with red blood cell lysis-buffer (160 mM NH4Cl, 12 mM NaHCO3, 100 µM EDTA, pH 7.3) to remove traces of erythrocytes. The cells were then washed twice with 10 ml PBS and re-suspended in 5 ml RPMI medium containing 10% fetal calf serum, 200 nM glutamine, 100 U/ml penicillin and 0.1 mg/ml streptomycin. This solution was centrifuged once more and the cells were re-suspended in 1 ml RPMI medium. After cell counting, a solution of 106 cells/ml was adjusted with medium, and 350 µl of this solution was put into each well of sterile, 24-well microplates according to data from several series of pilot experiments. Until the evening, the cells adhered and the medium was changed. On the following day, the wells were exposed to fresh medium containing LPS, MALP-2 or the respective solvents (see ‘Substances’, above).
Experimental protocols
Experiment 1 (mice)
Four groups of TLR2-KO and another four groups of C57/BL-6 mice (n = 7–10 per group) were injected i.p. at ∼09:00–09:30 (at least 2 h after start of the ‘light on’ period) with 1000 µg/kg MALP-2, 100 µg/kg LPS, or the respective solvent (Cremophor or PBS). Abdominal body temperature (Tb) was recorded and evaluated from 07:00 on the day of injection until the end of the ‘light on’ period.
Experiment 2 (mice)
Separate groups of mice (n = 5 per group) were treated as described in the protocol for Experiment 1. Ninety minutes after the respective injection, blood from the systemic circulation was collected. Briefly, the mice were anesthetized about 5 min prior to the scheduled sampling time with ketamine/xylazine (see above). Blood was collected by cardiac puncture and immediately centrifuged. Plasma was stored at −70°C for later determination of TNF-α and IL-6. Pilot experiments had shown that both cytokines are present in the circulation in high amounts at the selected time for collection of blood.
Experiment 3 (rats)
Four groups of SHRs and another four groups of WKY rats (n = 9–12 per group) were injected i.p. at ∼09:00–09:30 (at least 2 h after start of the ‘light on’ period) with 100 µg/kg MALP-2, 100 µg/kg LPS or the respective solvent (Cremophor or PBS). Tb, food and water intake, as well as changes in body weight, were recorded and evaluated from 07:00 on the day of injection for the following 48 h. Values for body weight, food and water intake were also measured for the 24-h period prior to the respective injection.
Experiment 4 (rats)
Separate groups of rats (n = 4–5 per group) were treated as described in the protocol for Experiment 3. At selected time intervals (60, 120 and 180 min after injection of LPS or PBS, and 60 and 120 min after injection of MALP-2 or cremophor), blood from the systemic circulation was collected as described above and later analyzed for bioactive cytokines.
Experiment 5 (rats)
Separate groups of SHRs and WKY rats (n = 3 per group) were treated as described in Experiment 3. The brains of all animals were prepared for STAT3 immunohistochemistry 2 h after injection. The rats were deeply anesthetized with sodium pentobarbital (60–100 mg/kg, Narcoren, Merial GmbH, Hallbergmoos, Germany) and transcardially perfused with 400 ml 0.9% NaCl solution followed by 500 ml of fixative containing 4% paraformaldehyde in 0.1 M phosphate buffer (pH 7.2). The brains were removed and post-fixed in the same fixative for 1 h at room temperature. The tissue was cryoprotected in 20% sucrose in phosphate buffer overnight at 4°C. Brain tissue was cut the following day.
Experiment 6 (rats)
Peritoneal macrophages were prepared from separate groups of SHRs and WKY rats (n = 5 per group). Macrophages from each rat were exposed to medium containing LPS or MALP-2, at concentrations of 10 µg/ml, or the respective solvent. These doses were chosen according to pilot experiments in which different doses and cell numbers were tested for their capacity to release bioactive TNF-α and IL-6 into the supernatant. The dose, which we used to evaluate the capacity of peritoneal macrophages of SHRs and WKY rats to release cytokines into the supernatants, did not represent threshold doses, but rather corresponded to the concentrations of LPS or MALP-2 to which we exposed the abdominal cavity of rats in our in vivo experiments. Supernatants were collected 1 h and 2 h after the start of the exposure to the respective stimuli (LPS, MALP-2 or the respective vehicles).
Evaluation and statistics
In graphs of the thermal responses of mice or rats to injections of MALP-2, LPS or the respective solvent, the mean abdominal temperatures were plotted against time and expressed as means ± SEM at each time point. Abdominal temperatures were compared between different groups over time by two-way repeated-measures ANOVA followed by an all pairwise Bonferroni’s multiple comparison post hoc test. A statistical significance was accepted for P < 0.05. For a detailed analysis of the febrile responses of mice, the body temperature changes (relative changes to the pre-injection temperatures) were calculated owing to differences in the baseline temperatures between some groups of mice to be compared. In addition to the comparison of temperature data points, we also evaluated the integrated time curves—the fever index (F.I.). The mean F.Is, the integrated areas between thermal responses of febrile and normothermic animals, were expressed as a product of degrees Celsius and hour (for 9 h after the respective injection). The mean of all temperatures, measured at 15-min intervals over the 2-h period before the injection, was calculated as the baseline temperature. Concentrations of bioactive cytokines in blood or supernatants and data on food and water intake, heart rate and systolic blood pressure, as well as the numbers of nuclear STAT3 signals within a given brain structure were compared by one-way ANOVA followed by Scheffe’s post hoc test. Because the values for circulating cytokine concentrations are not normally distributed, a log-transformation of the cytokine values was performed prior to the statistical calculation. All data were analyzed using StatView software 4.57 (Abacus Concepts, Berkeley, CA, USA).
Results
Experiments with TLR2-KO and C57/BL-6 mice
TLR2-KO and C57/BL-6 mice were injected i.p. with 1000 µg/kg MALP-2 or cremophor (solvent). The injection caused a transient elevation of Tb in all groups of mice for 60–75 min. Thereafter, Tb of MALP-2-treated TLR2-KO mice returned to its baseline value (Figure 1A), while C57/BL-6 mice developed a moderate fever (Figure 1B). Both groups of mice injected with cremophor showed the stress-induced increase of Tb and returned to their baseline temperature thereafter. A detailed analysis revealed that the MALP-2-induced increase of Tb in C57/BL-6 mice was significant from 90–330 min after the injection when compared with the respective values of TLR2-KO mice (F = 11.1; P = 0.0037; Figure 1C).
MALP-2-induced changes of Tabd in TLR2-KO and C57/BL-6 mice. Mice were injected i.p. with 1000 µg/kg MALP-2 or vehicle (Cremo) at time ‘0’. Abdominal body temperature changes (ΔTabd) in response to the respective injections are shown as means ± SEM. Those time intervals are labeled with horizontal significance bars at which the tested dose of MALP-2 caused a significant elevation of ΔTabd (P < 0.05) in comparison with mice treated with solvent (B), or at which differences between TLR2-KO and C57/BL-6 mice were observed (C). MALP-2 did not evoke any increase of ΔTabd in TLR2-KO mice (A). The mean absolute values of Tabd prior to the time of injection were 36.8°C in TLR2-KO mice treated with MALP-2 (n = 10), 36.75°C in TLR2-KO mice treated with vehicle (n = 9), 36.52°C in C57/BL-6 mice treated with MALP-2 (n = 9) and 36.3°C in C57/BL-6 mice treated with vehicle (n = 7).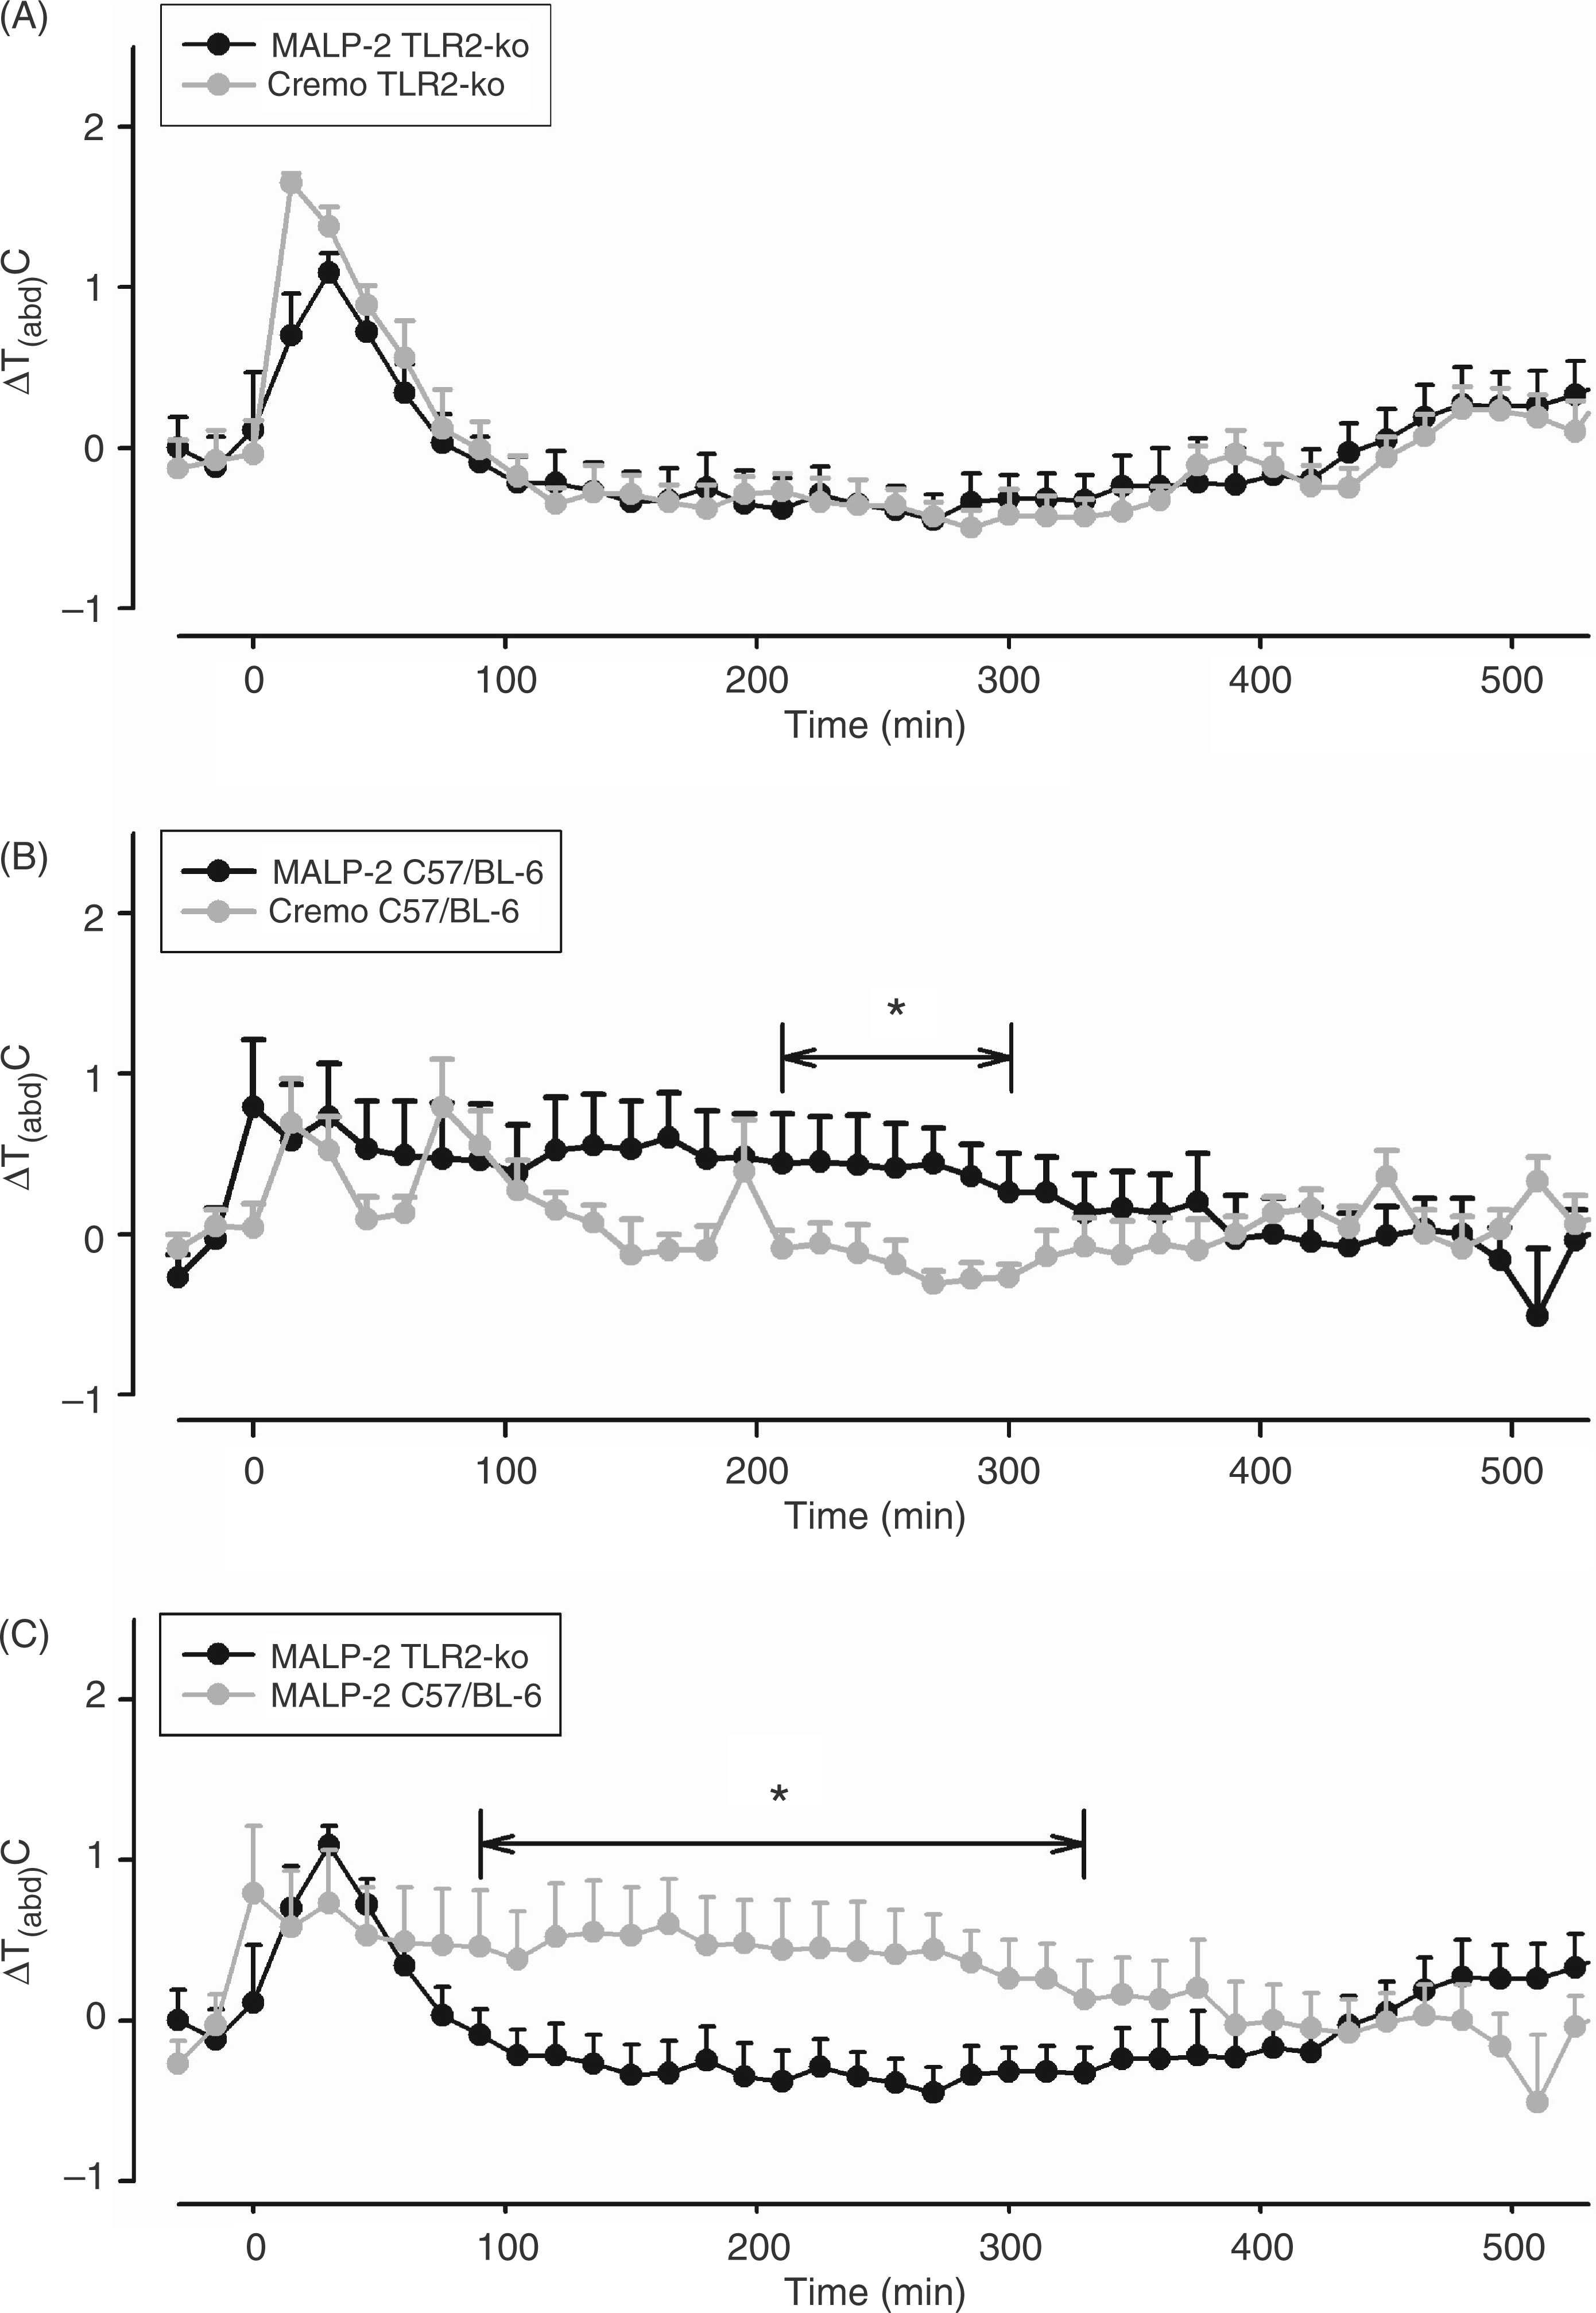
Plasma levels of TNF-α and IL-6 were measured 90 min after injection of MALP-2 or cremophor. Bioactive TNF-α was exclusively present in the plasma of MALP-2-treated C57/BL-6 mice with a mean value of 71.2 ± 17.3 ng/ml (not shown). In mice of both strains injected with cremophor, and in TLR2-KO mice stimulated with MALP-2, bioactive TNF-α could not be detected in blood plasma. Bioactive IL-6 was detected in all groups of mice (Figure 2). Injection of MALP-2 caused a significant elevation of IL-6 in the plasma of C57/BL-6 mice (2300 ± 1050 I.U./ml; P = 0.0015: MALP-2 vs vehicle in C57/BL-6 mice), while the corresponding levels measured in TLR2-KO mice remained at the baseline (90–190 I.U./ml), which was observed in both strains of mice 90 min after injection of cremophor. The MALP-2-induced amount of IL-6 in plasma was significantly higher in C57/BL-6 compared with TLR2-KO mice (P = 0.0005).
MALP-2-induced circulating IL-6 in TLR2-KO and C57/BL-6 mice. Mice were injected i.p. with 1000 µg/kg MALP-2 or vehicle (Cremo) and plasma samples were collected and analyzed 90 min after the respective injections. All columns are means ± SEM (n = 5 in each group). Any columns with the same letter are not significantly different from each other, while any columns with different letters are significantly different (P < 0.05; differences between groups). MALP-2 did not evoke any increase of circulating IL-6 in TLR2-KO mice.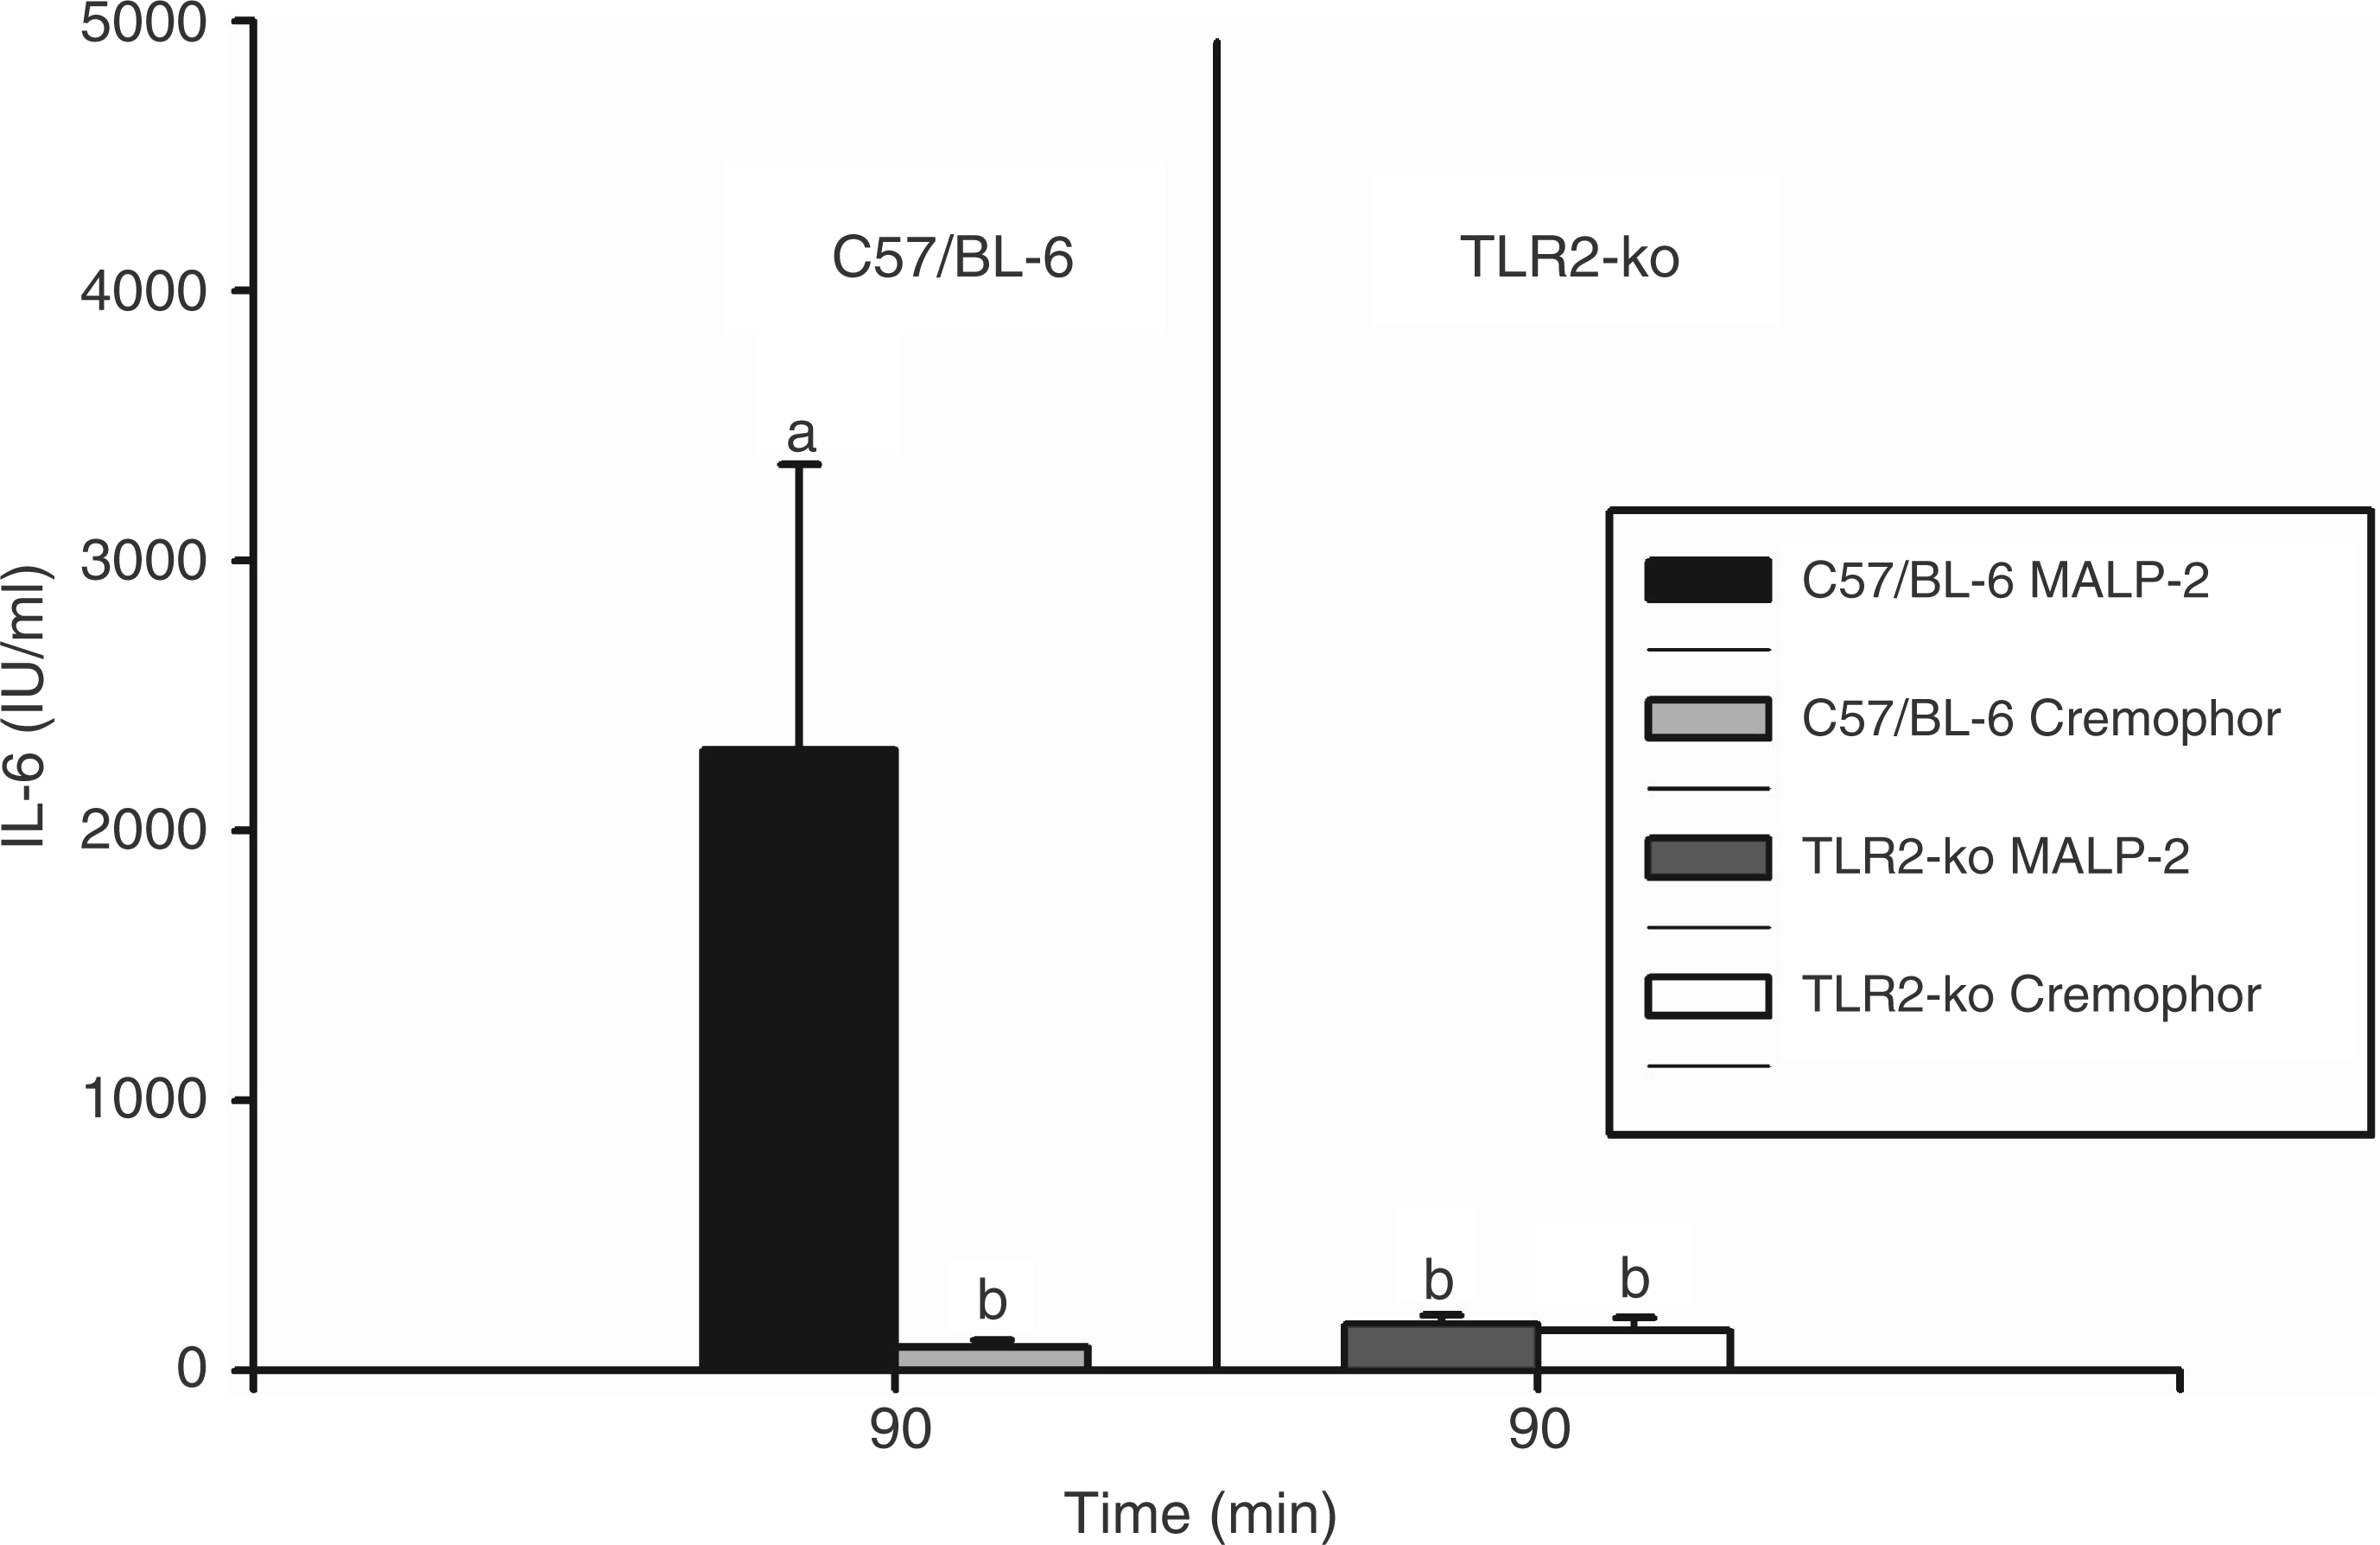
In the next experiment, we tested the responses of TLR2-KO and C57/BL-6 mice to i.p. injections of 100 µg/kg LPS. During the day of LPS injection, both strains of mice developed a moderate fever, while Tb of mice treated with solvent (PBS) returned to the baseline levels after its transient stress-induced rise (Figure 3A, B).
LPS-induced changes of Tabd in TLR2-KO and C57/BL-6 mice. Mice were injected i.p. with 100 µg/kg LPS or vehicle (PBS) at time ‘0’. Abdominal body temperature changes (ΔTabd) in response to the respective injections are shown as means ± SEM Those time intervals are labeled with horizontal significance bars at which the tested dose of LPS caused a significant elevation of ΔTabd (P < 0.05) in comparison with mice treated with the vehicle (A, B) or at which differences between TLR2-KO and C57/BL-6 mice were observed (C). LPS evoked a moderate increase of ΔTabd in both TLR2-KO and C57/BL-6 mice. The absolute values of Tabd prior to the time of injection were 36.62°C in TLR2-KO mice treated with LPS (n = 10), 36.95°C in TLR2-KO mice treated with vehicle (n = 8), 36.5°C in C57/BL-6 treated mice with LPS (n = 9) and 36.4°C in C57/BL-6 mice treated with vehicle (n = 7).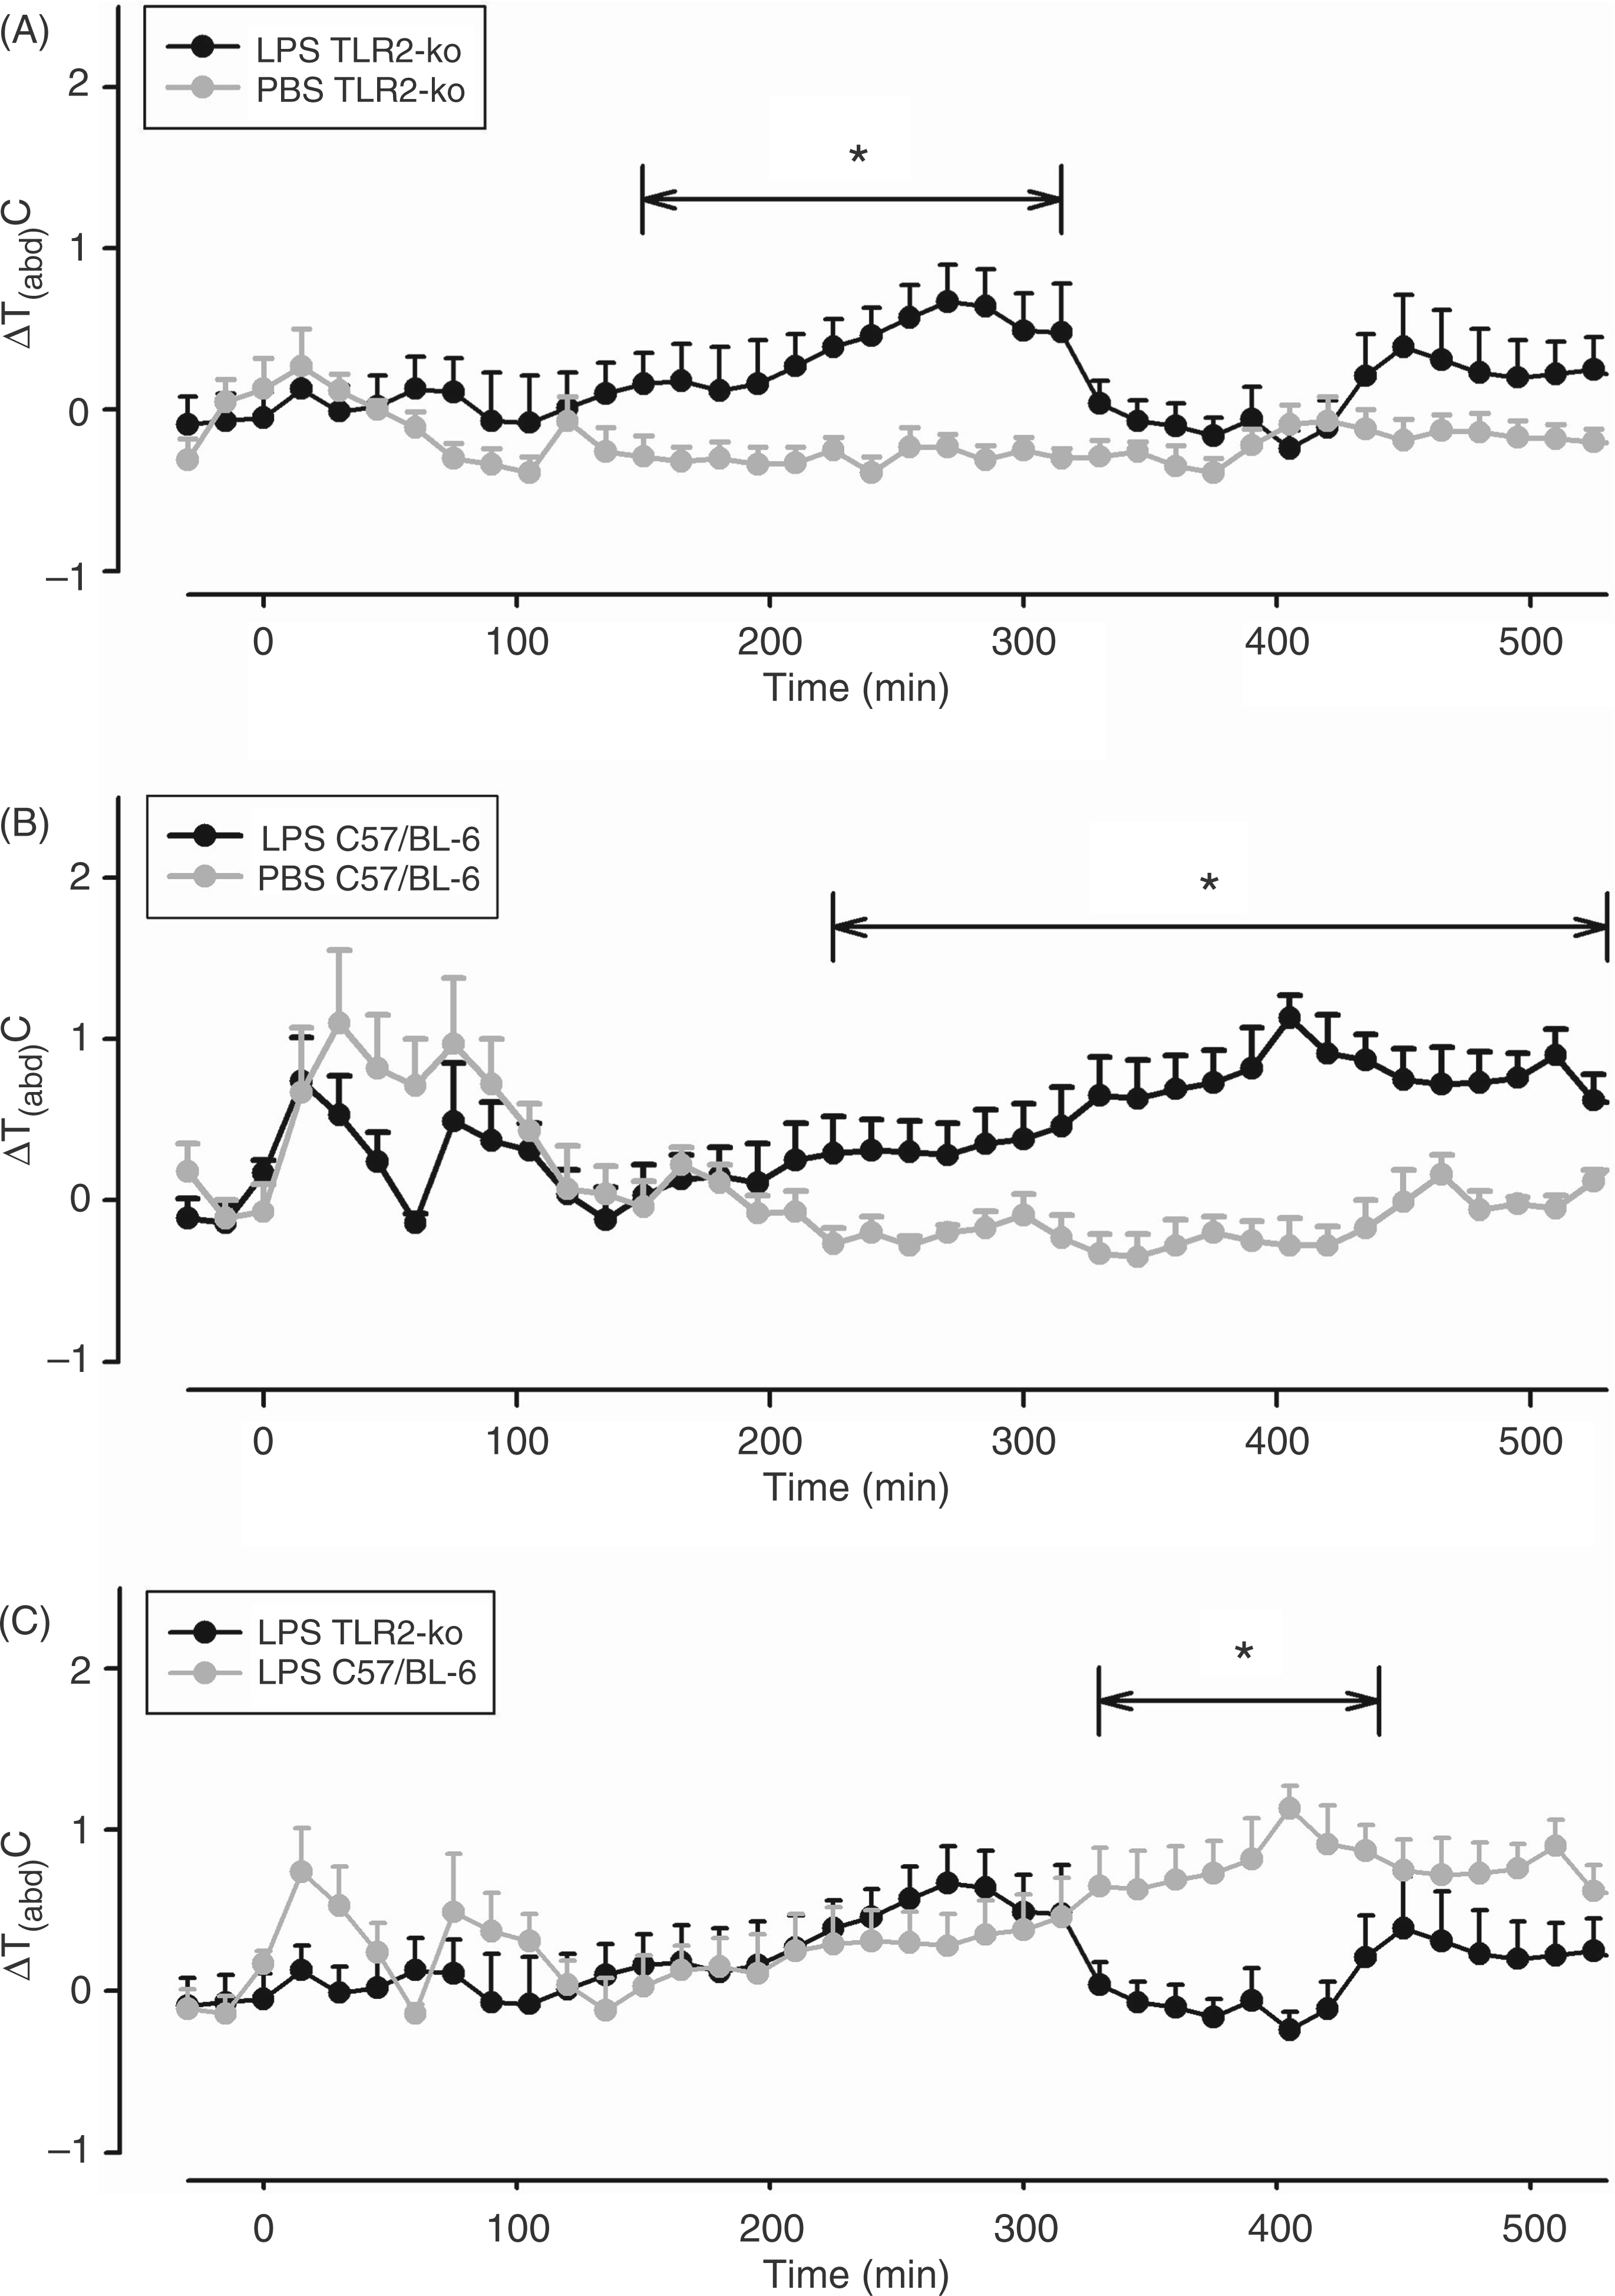
The febrile response of the C57/BL-6 mice developed a bit later, but was longer lasting than in TLR2-KO mice. A detailed analysis revealed that the LPS-induced increase of Tb in C57/BL-6 mice was significantly higher from 330–440 min after the injection when compared with the respective values of TLR2-KO mice (F = 13.4; P = 0.0024; Figure 3C).
Ninety minutes after injection of 100 µg/kg LPS, 84.2 ± 29.9 ng/ml TNF-α were measured in the plasma of TLR2-KO mice; 107.1 ± 31.1 ng/ml were detected in C57/BL-6 mice with no significant difference between both strains (not shown). In no case was bioactive TNF-α observed after the injection of solvent. The LPS-induced increase of bioactive IL-6 in plasma was almost identical in both mice strains (14350 ± 3900 I.U./ml in TLR2-KO vs 13470 ± 5430 I.U./ml in C57/BL-6 mice; Figure 4).
LPS-induced circulating IL-6 in TLR2-KO and C57/BL-6 mice. Mice were injected i.p. with 100 µg/kg LPS or vehicle (PBS) and plasma samples were collected and analyzed 90 min after the respective injections. All columns are means ± SEM (n = 5 in each group). Any columns with the same letter are not significantly different from each other, while any columns with different letters are significantly different (P < 0.05; differences between groups). LPS evoked almost identical increases of circulating IL-6 in TLR2-KO and C57/BL-6 mice.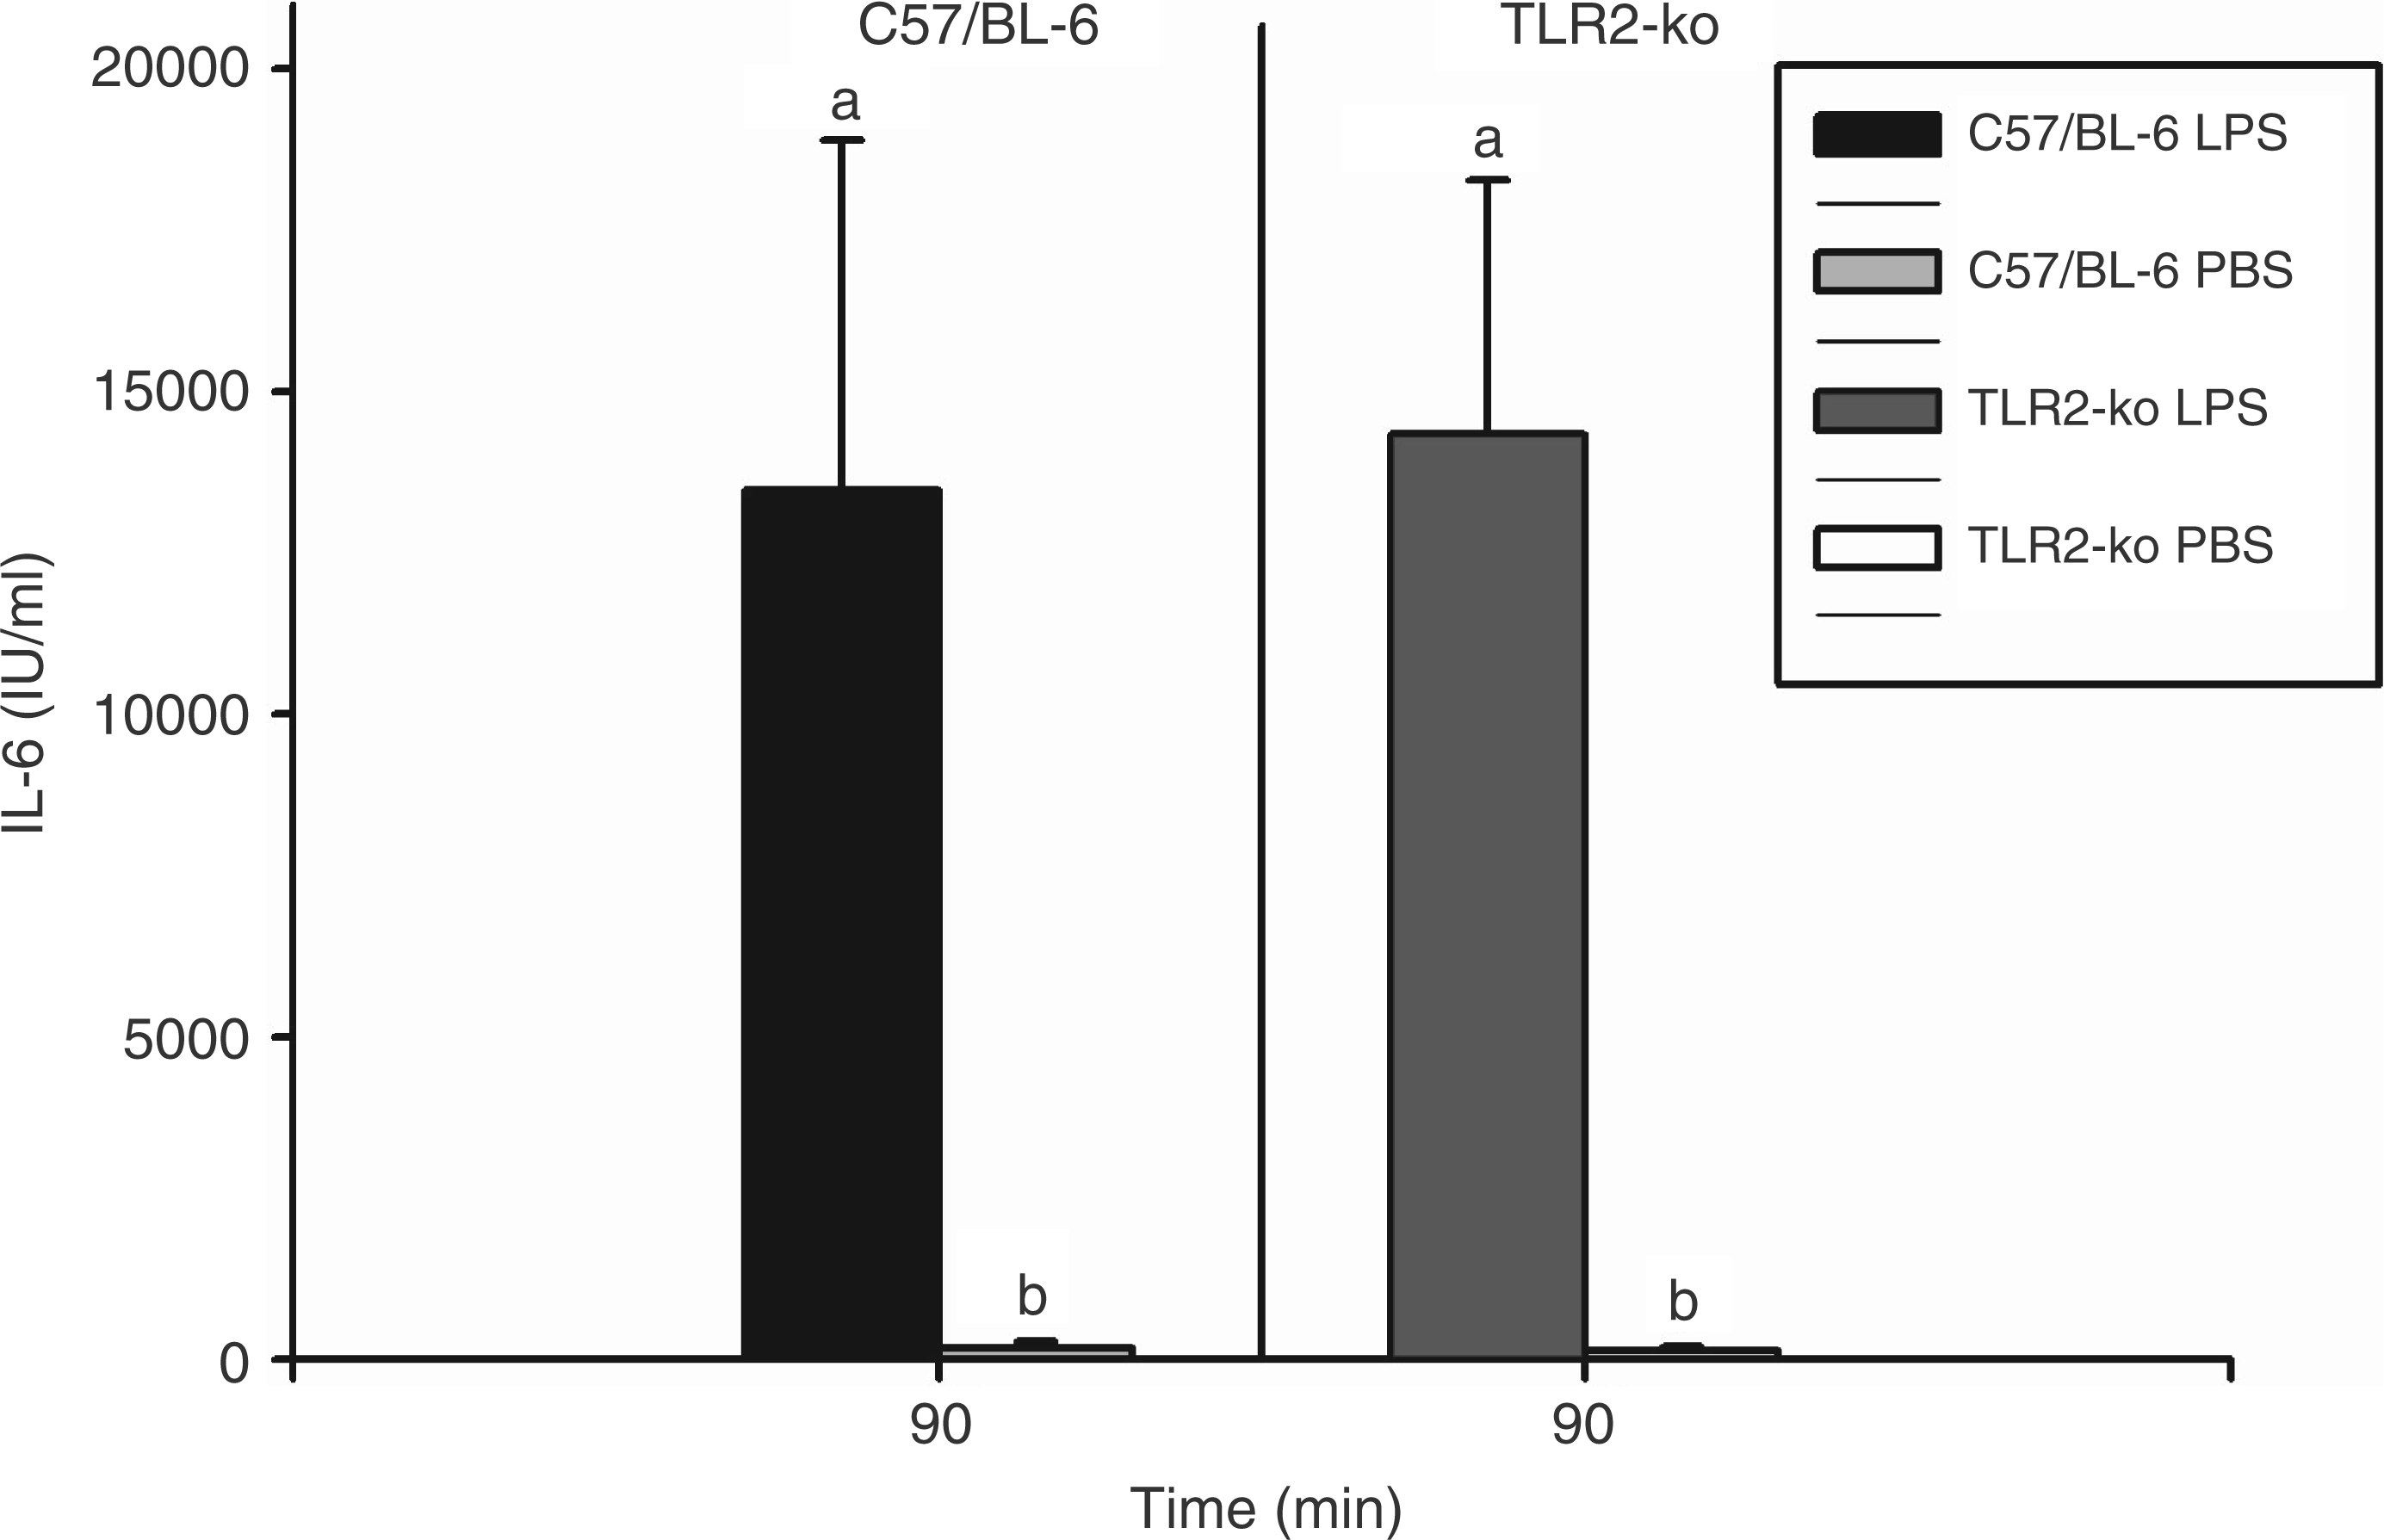
The integrated fever responses, i.e. the areas under the respective thermal response curves, were calculated for each experiment performed with TLR2-KO and C57/BL-6 mice. The results of these calculations are summarized in the Supplementary Figure S1 (A, B). The TLR2-KO mice showed a smaller stress-induced rise in body temperature owing to the injection procedure when compared with the stress response of the C57/BL6 mice. Over the daytime, the abdominal temperature of mice is at its minimum. Both of these reasons, and the lack of response to MALP-2, caused the negative fever- or thermal-response indexes of TLR2-KO mice in response to injections of MALP-2, cremophor and PBS. Interestingly, the integrated fever response to LPS was also lower in TLR2-KO compared with C57/BL-6-mice, although circulating cytokines were as high as in the control animals. The high thermal response of C57/BL-6 mice to the injection procedure compensated the low daytime temperatures so that the thermal-response index of these mice to cremophor and PBS reached positive values, which were not different from each other.
In summary, with regard to fever and the formation of cytokines, both strains of mice could respond to LPS, with higher fever in the C57/BL-6 controls. In contrast, all these responses were completely abolished in TLR2-deficient animals after stimulation with MALP-2, showing that TLR2 is essential for any kind of reactivity to this PAMP.
Experiments with SHRs and WKY rats
The systolic blood pressure of SHRs was, on average, 175 mmHg and significantly higher than in their genetic controls, the WKY rats (138 mmHg; F = 72.6; P < 0.0001), while both strains showed almost identical heart rates (342 vs 346 beats per min, n = 8 in both groups).
Intraperitoneal injections of 100 µg/kg MALP-2 induced fever in SHRs and WKY rats (Figure 5A, B), with the response of SHR being significantly smaller from 165 to 435 min after administration of the pyrogen (F = 7.4; P = 0.0121; Figure 5C). Also, the mean F.I. was significantly lower in MALP-2-treated SHRs compared with WKY rats (4.94 ± 0.22 vs 5.95 ± 0.25°C x h; P < 0.05; see Supplementary Figure S1C).
MALP-2-induced changes of Tabd in SHRs and WKY rats. Rats were injected i.p. with 100 µg/kg MALP-2 (SHRs: n = 12; WKY rats: n = 12) or vehicle (Cremophor; SHRs: n = 11; WKY rats: n = 10) at time ‘0’. Mean abdominal body temperature in response to the respective injections is shown as mean ± SEM Those time intervals are labeled with horizontal significance bars at which the tested dose of MALP-2 caused a significant elevation of Tabd (P < 0.05) in comparison with rats treated with solvent (A, B) or at which differences between SHRs and WKY rats were observed (C). MALP-2 evoked fever in both rat strains—the response of WKY rats being significantly higher from 170–435 min after injection.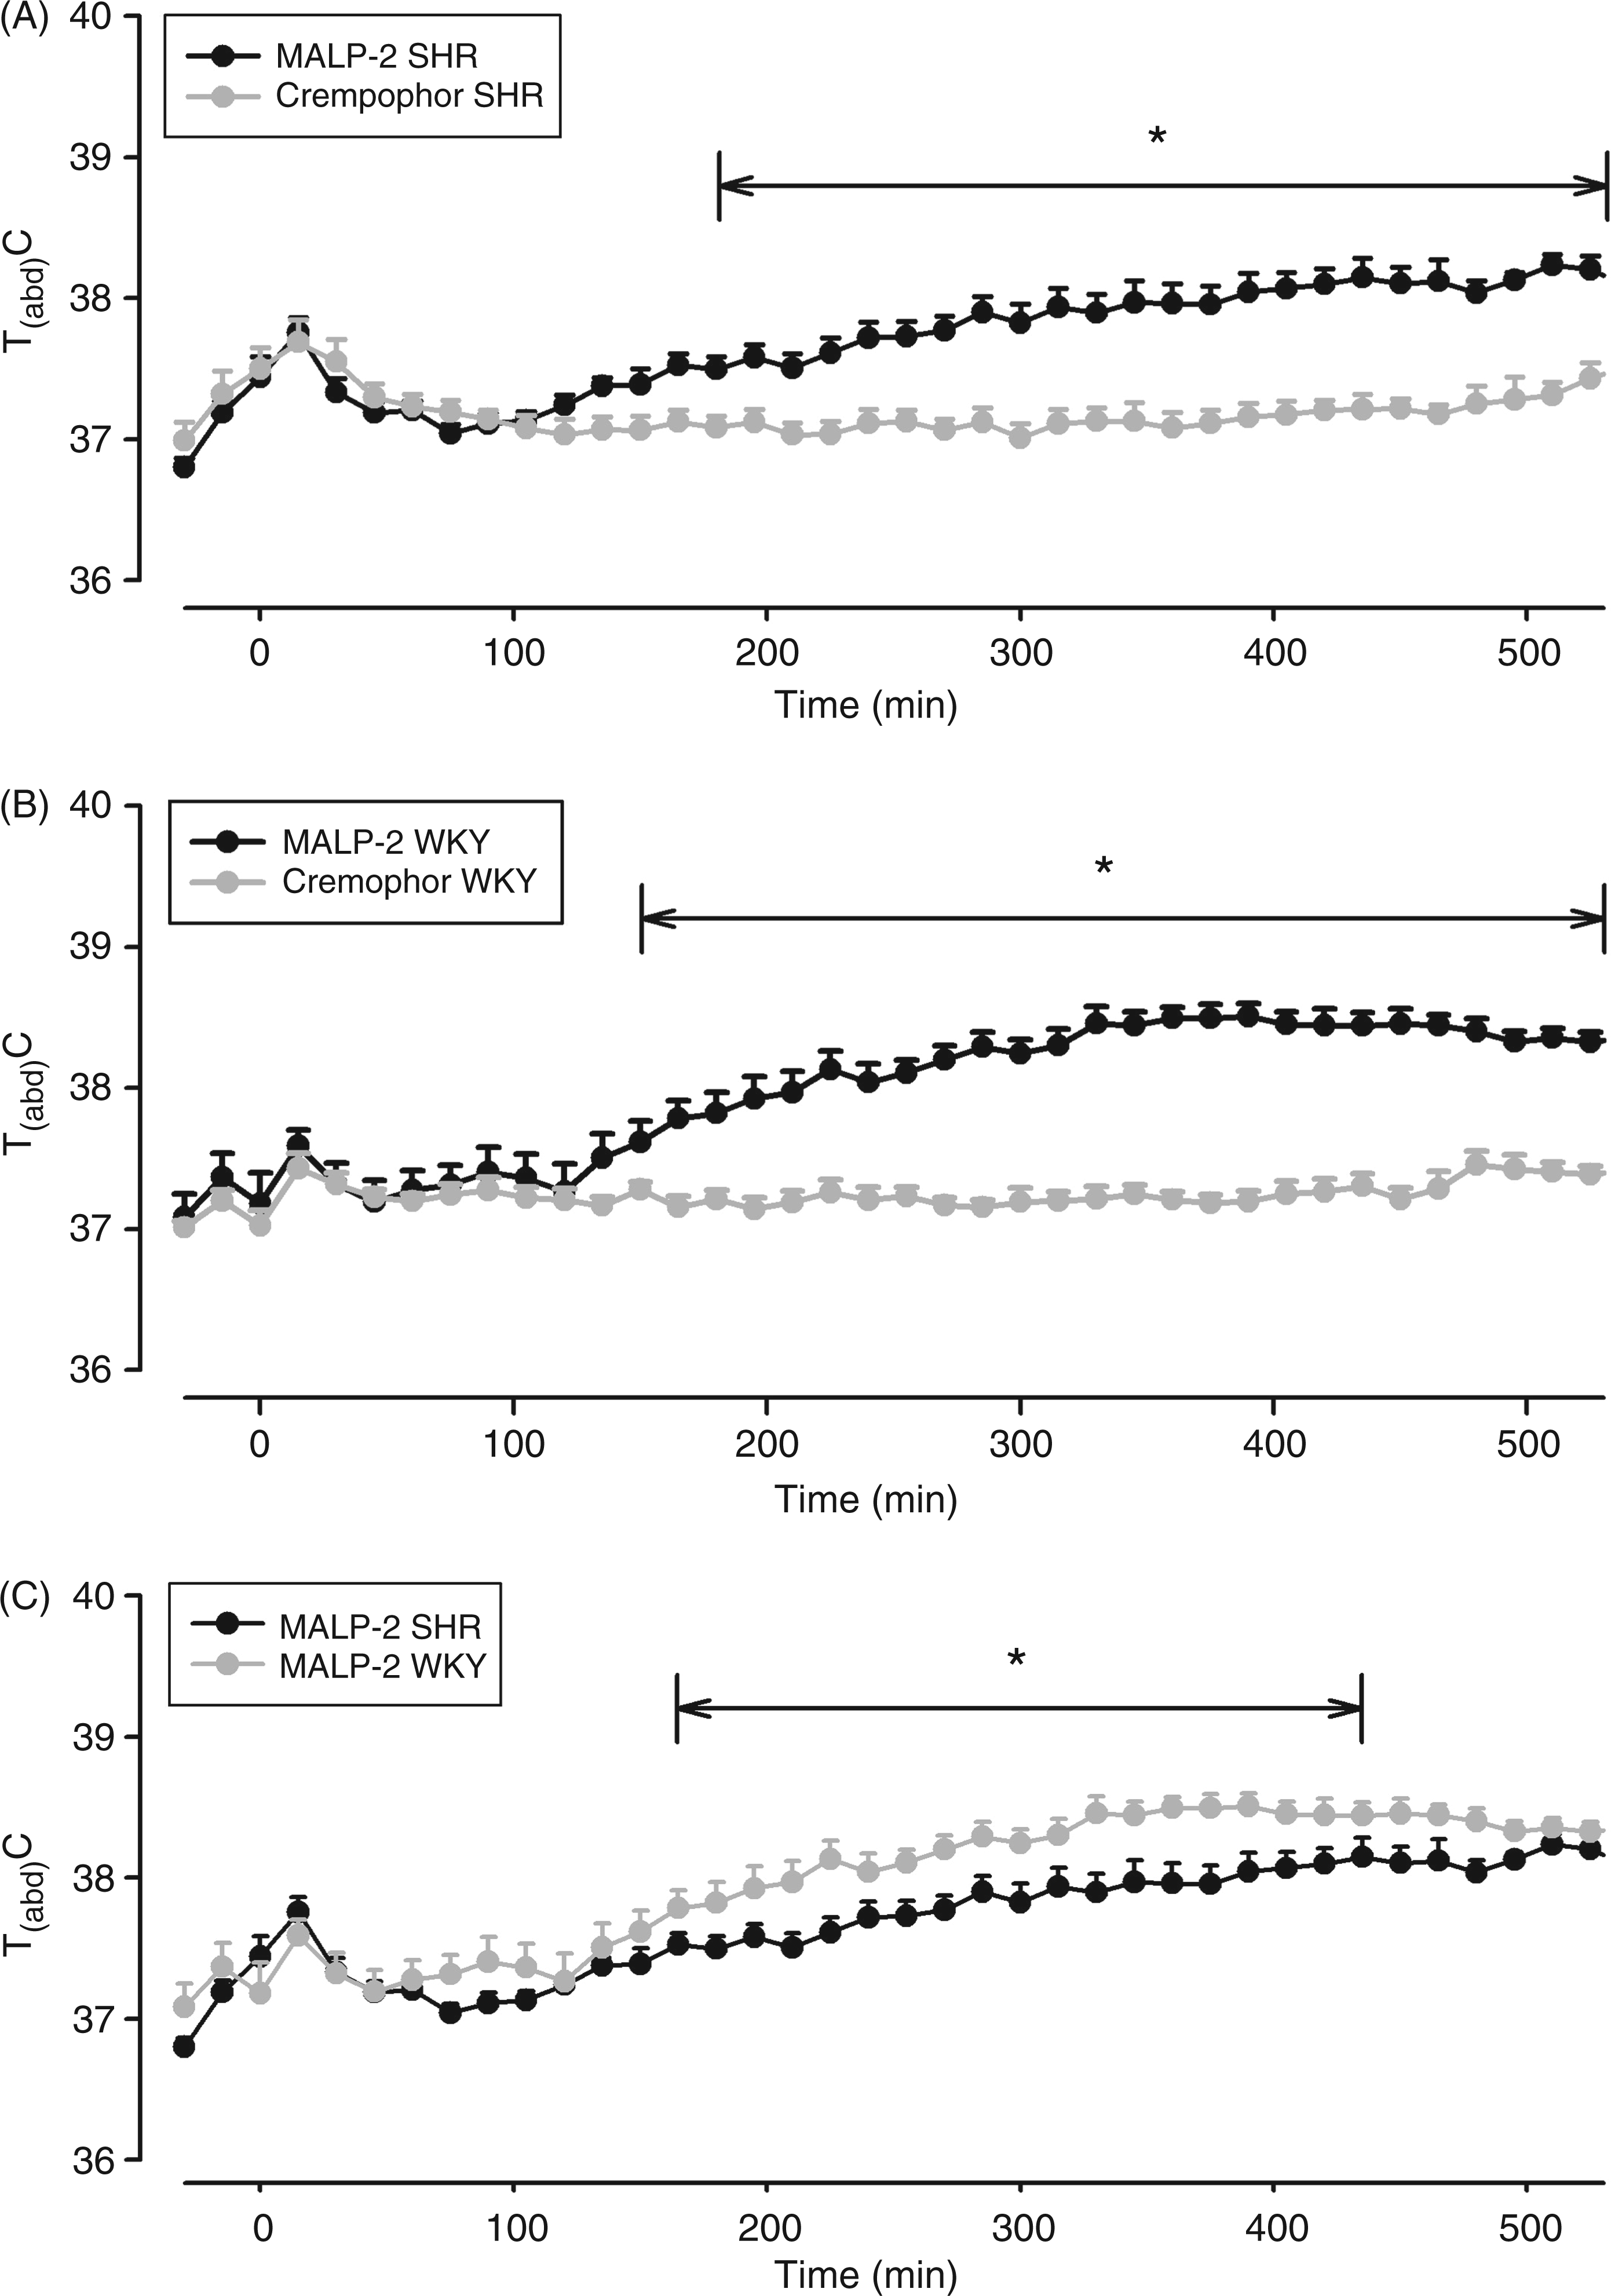
Within the 24 h before the respective injections, the mean food intake was almost identical in all four groups of rats (19–22 g/d, no significant differences between groups). MALP-2 caused a strong, and significant, reduction in the consumption of food on the day of injection in both rat strains (10 ± 1.5 g/d in SHRs vs 6 ± 1.4 g/d in WKY rats, no significant difference). On the second day, food intake in SHRs returned to normal (19 ± 1.2 g/d), while WKY rats still showed signs of anorexia (12 ± 0.7 g/d; P = 0.0015, SHRs vs WKY rats). Injections of MALP-2 further caused a reduced consumption of drinking water from 25 ± 14 g/d to 13 ± 1.6 g/d in SHRs and from 26 ± 0.8 to 11 ± 2.0 in WKY rats (no significant difference between both strains). On the second day, consumption of drinking water was completely normalized in both rat strains.
One hour after injection of MALP-2, about 25–30 ng/ml TNF-α were measured in the plasma of SHRs and WKY rats with no significant difference between both strains (Figure 6A). Also, the decrease to about 4–5 ng/ml TNF-α within the following hour was similar in SHRs and WKY rats. In no case was bioactive TNF-α observed after injection of solvent.
MALP-2-induced circulating cytokines in SHRs and WKY rats. Rats were injected i.p. with 100 µg/kg MALP-2 or vehicle (Cremo) and plasma samples were collected and analyzed for bioactive TNF-α (A) or IL-6 (B) 60 and 120 min after the respective injections. All columns are means ± SEM (n = 4–5 in each group). At a given time, any columns with the same letter are not significantly different from each other, while any columns with different letters are significantly different (P < 0.05; differences between groups; n.d.: not detectable, below the detection limit of the assay).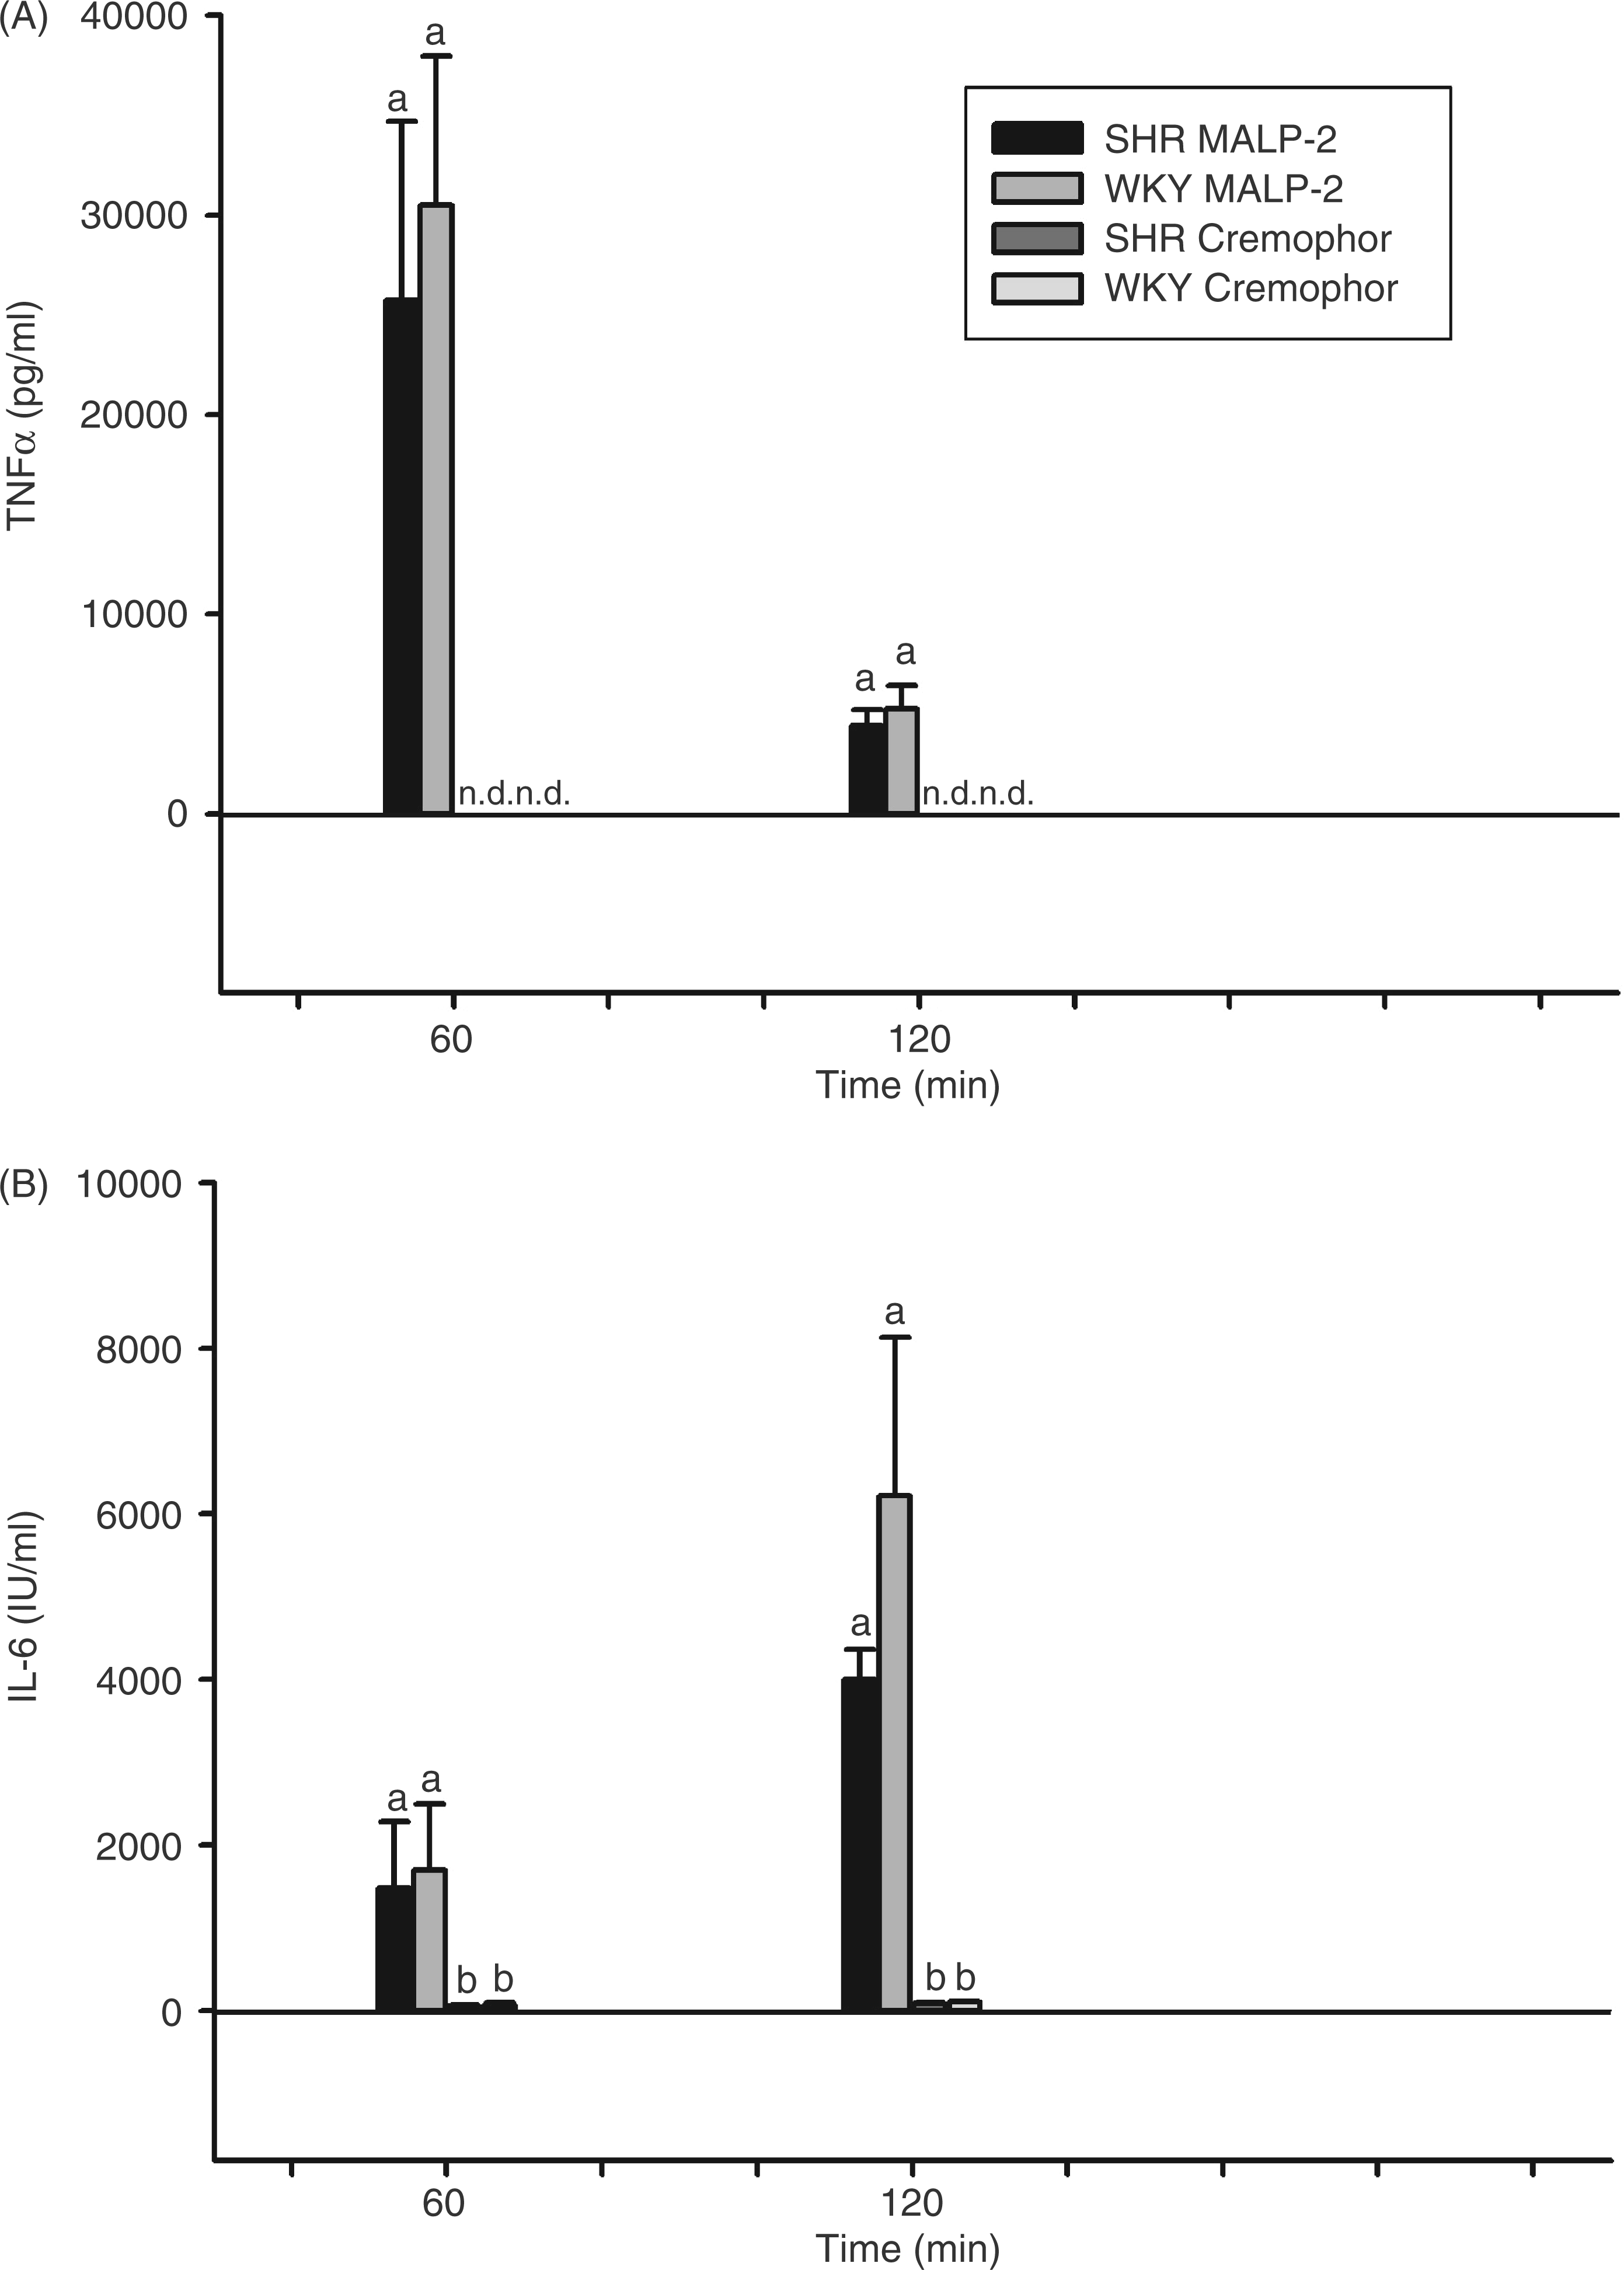
In both strains, IL-6 in plasma rose from about 1500 I.U./ml to 4000 ± 360 I.U./ml in SHRs and even to 6220 ± 1900 I.U./ml in WKY rats (Figure 6B). This tendency to a reduction in MALP-2-induced circulating IL-6 in SHRs was not significant statistically.
In the next set of experiments, we tested the responses of SHRs and WKY rats to LPS. Intraperitoneal injections of 100 µg/kg LPS caused fever in both rat strains (Figure 7A, B). The response of SHRs was significantly smaller from 270–510 min after administration of the pyrogen (F = 7.0; P = 0.0163; Figure 7C). In agreement with the temperature data, the F.I. of LPS-injected SHRs was also significantly lower compared with the integrated fever response of WKY rats (3.72 ± 0.3 vs 6.1 ± 0.87°C x h; P < 0.05; see: Supplementary Figure S1D).
LPS-induced changes of Tabd in SHRs and WKY rats. Rats were injected i.p. with 100 µg/kg LPS (SHRs: n = 11; WKY rats: n = 10) or the vehicle (PBS; SHRs: n = 10; WKY rats: n = 9) at time ‘0’. Mean abdominal body temperature in response to the respective injections is shown as mean ± SEM Those time intervals are labeled with horizontal significance bars at which the tested dose of LPS caused a significant elevation of Tabd (P < 0.05) in comparison with rats treated with PBS (A, B), or at which differences between SHRs and WKY rats were observed (C). LPS evoked fever in both rat strains—the response of WKY rats being significantly higher from 270–510 min after injection.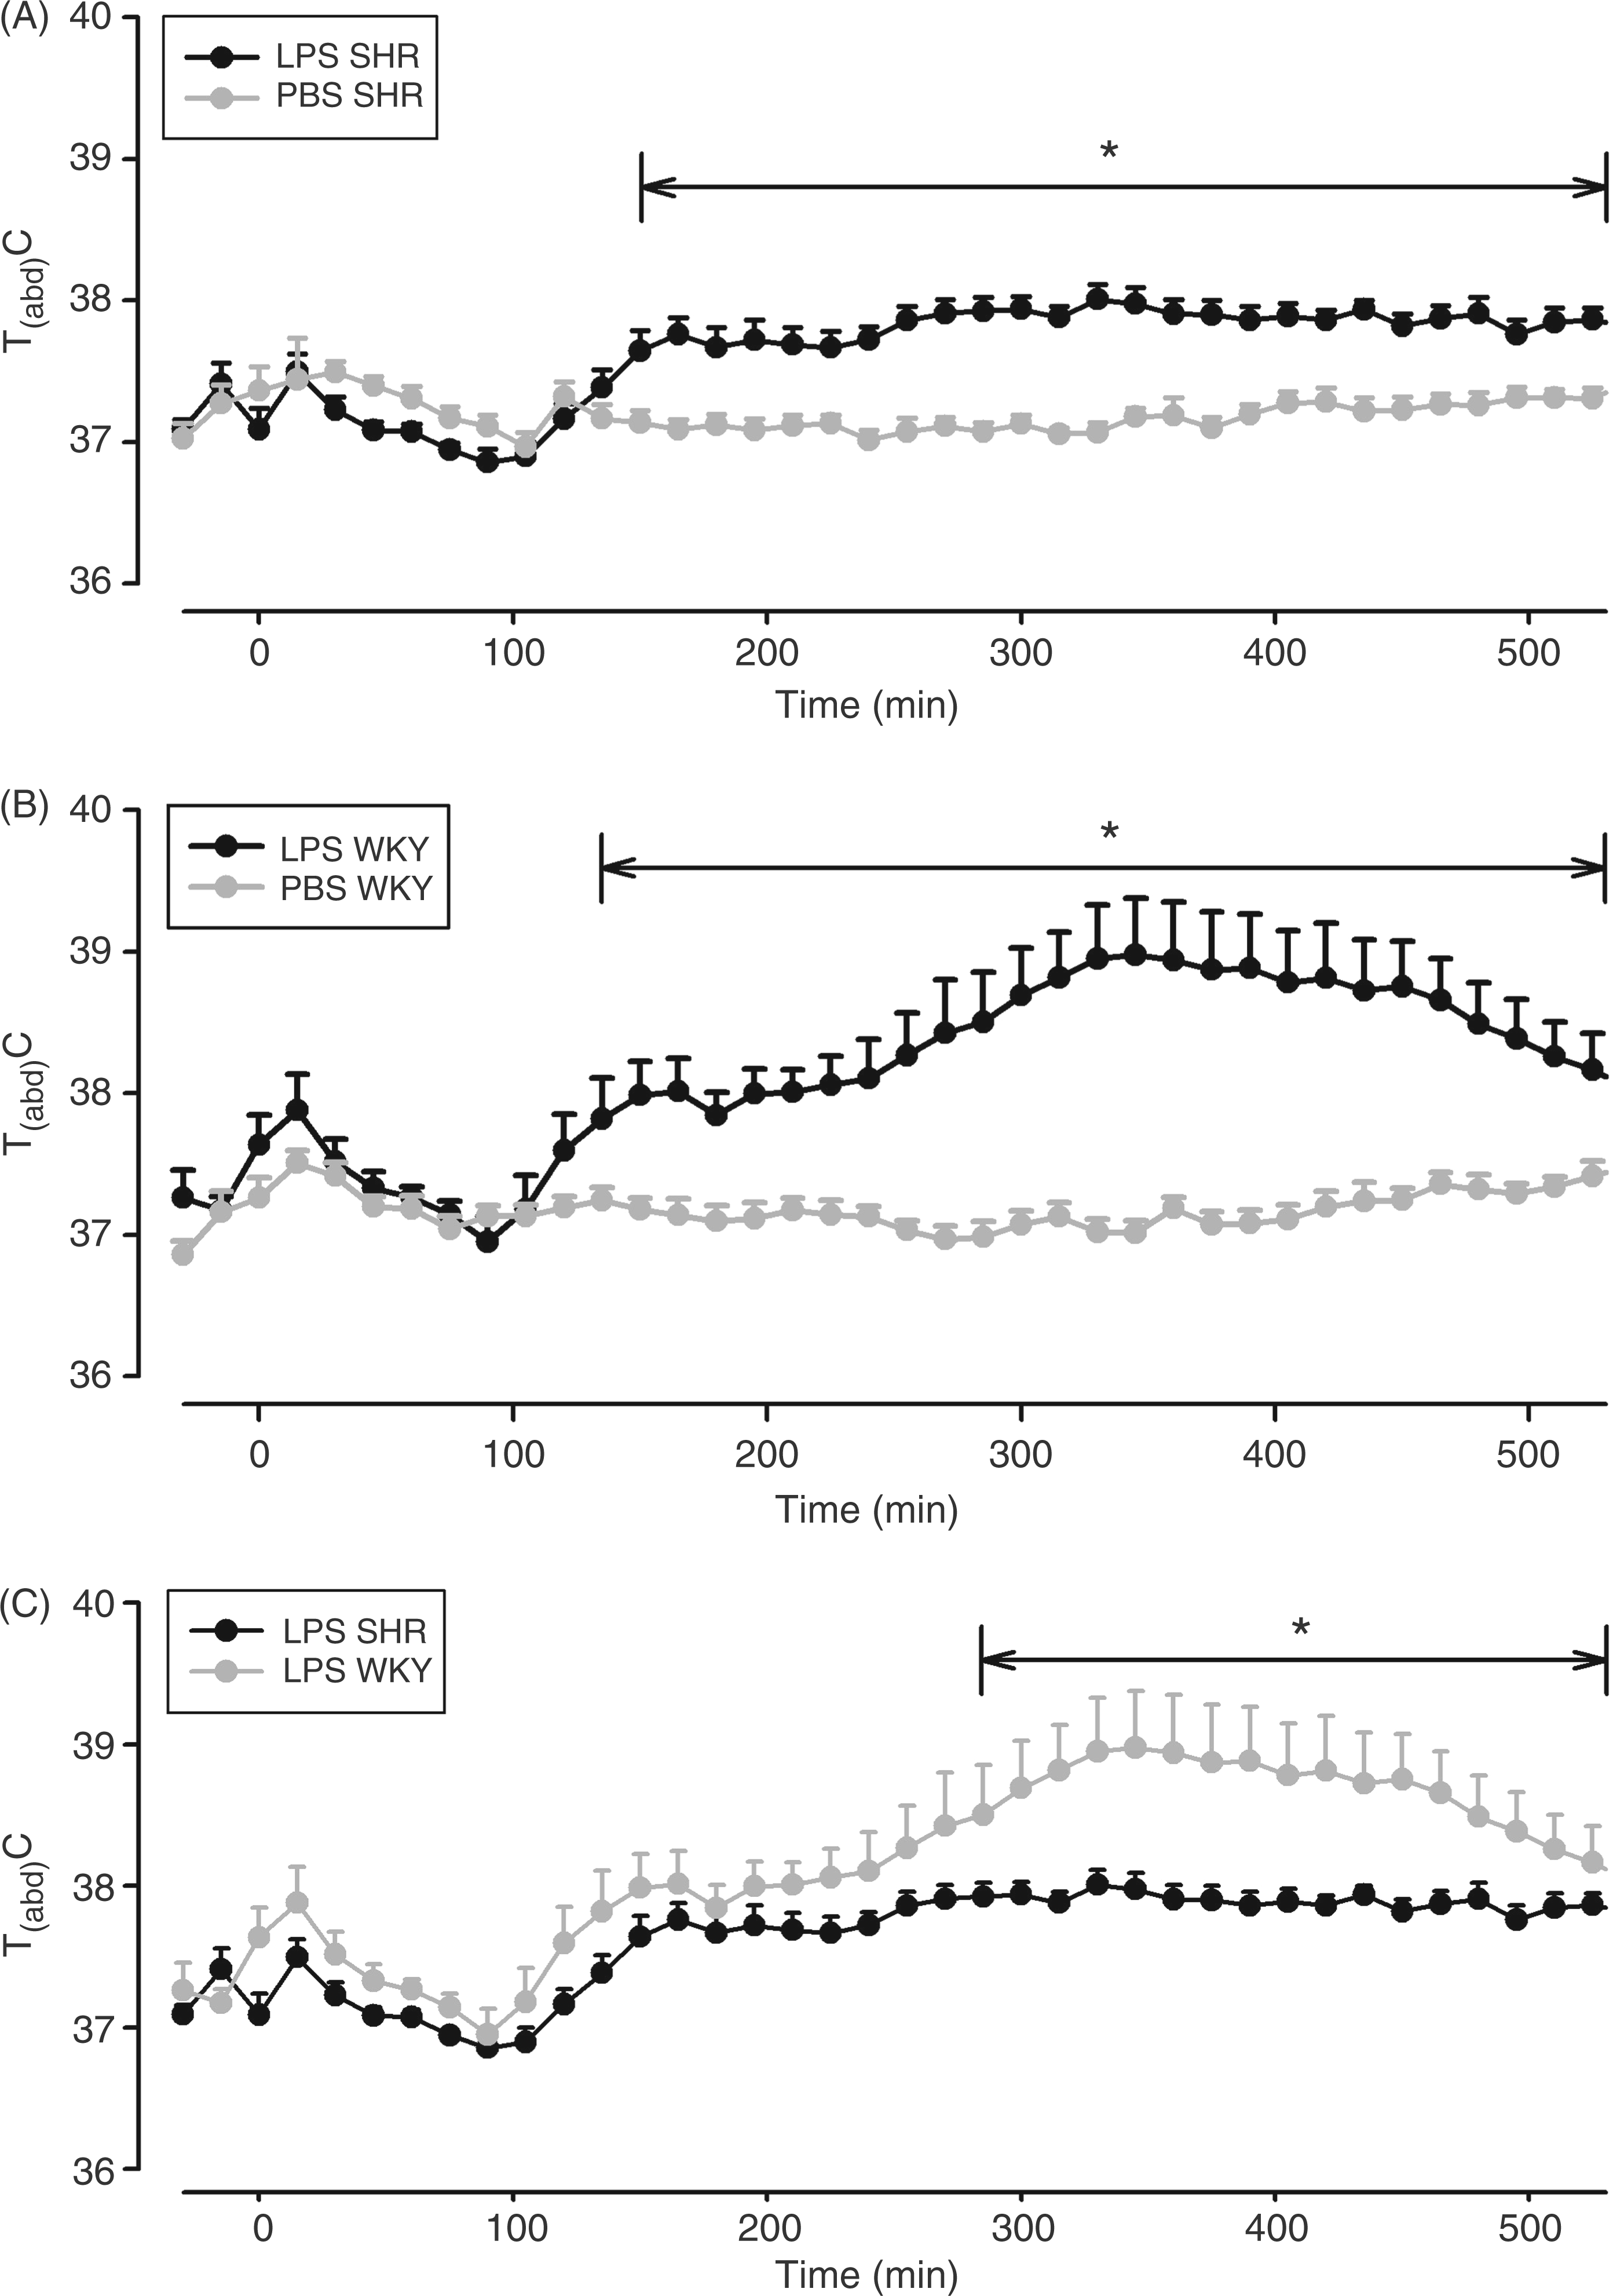
The LPS-induced reduction of food intake from 21.6 ± 0.75 to 8.2 ± 1.8 g/d was more pronounced in WKY rats when compared with SHRs (24 ± 1 to 16 ± 1.6 g/d), within the first 24 h after LPS-injection (P = 0.0013, SHRs vs WKY rats). On the second day, no significant differences in food consumption between both strains were calculated—the absolute values being normalized to almost 20 g/d. Measurements of consumed amounts of drinking water provided similar results: a significant decrease on the day of LPS-injection, which was stronger in WKY rats (P = 0.0085), and a complete normalization on the second day.
The kinetics of circulating TNF-α was similar in both rat strains with a peak of about 65 (SHRs) or 97 (WKY rats) ng/ml occurring 1 h after the administration of LPS (Figure 8A).
LPS-induced circulating cytokines in SHRs and WKY rats. Rats were injected i.p. with 100 µg/kg LPS or vehicle (PBS) and plasma samples were collected and analyzed for bioactive TNF-α (A) or IL-6 (B) 60, 120 or 180 min after the respective injections. All columns are means ± SEM (n = 4–5 in each group). At a given time, any columns with the same letter are not significantly different from each other, while any columns with different letters are significantly different (P < 0.05; differences between groups; n.d.: not detectable, below the detection limit of the assay).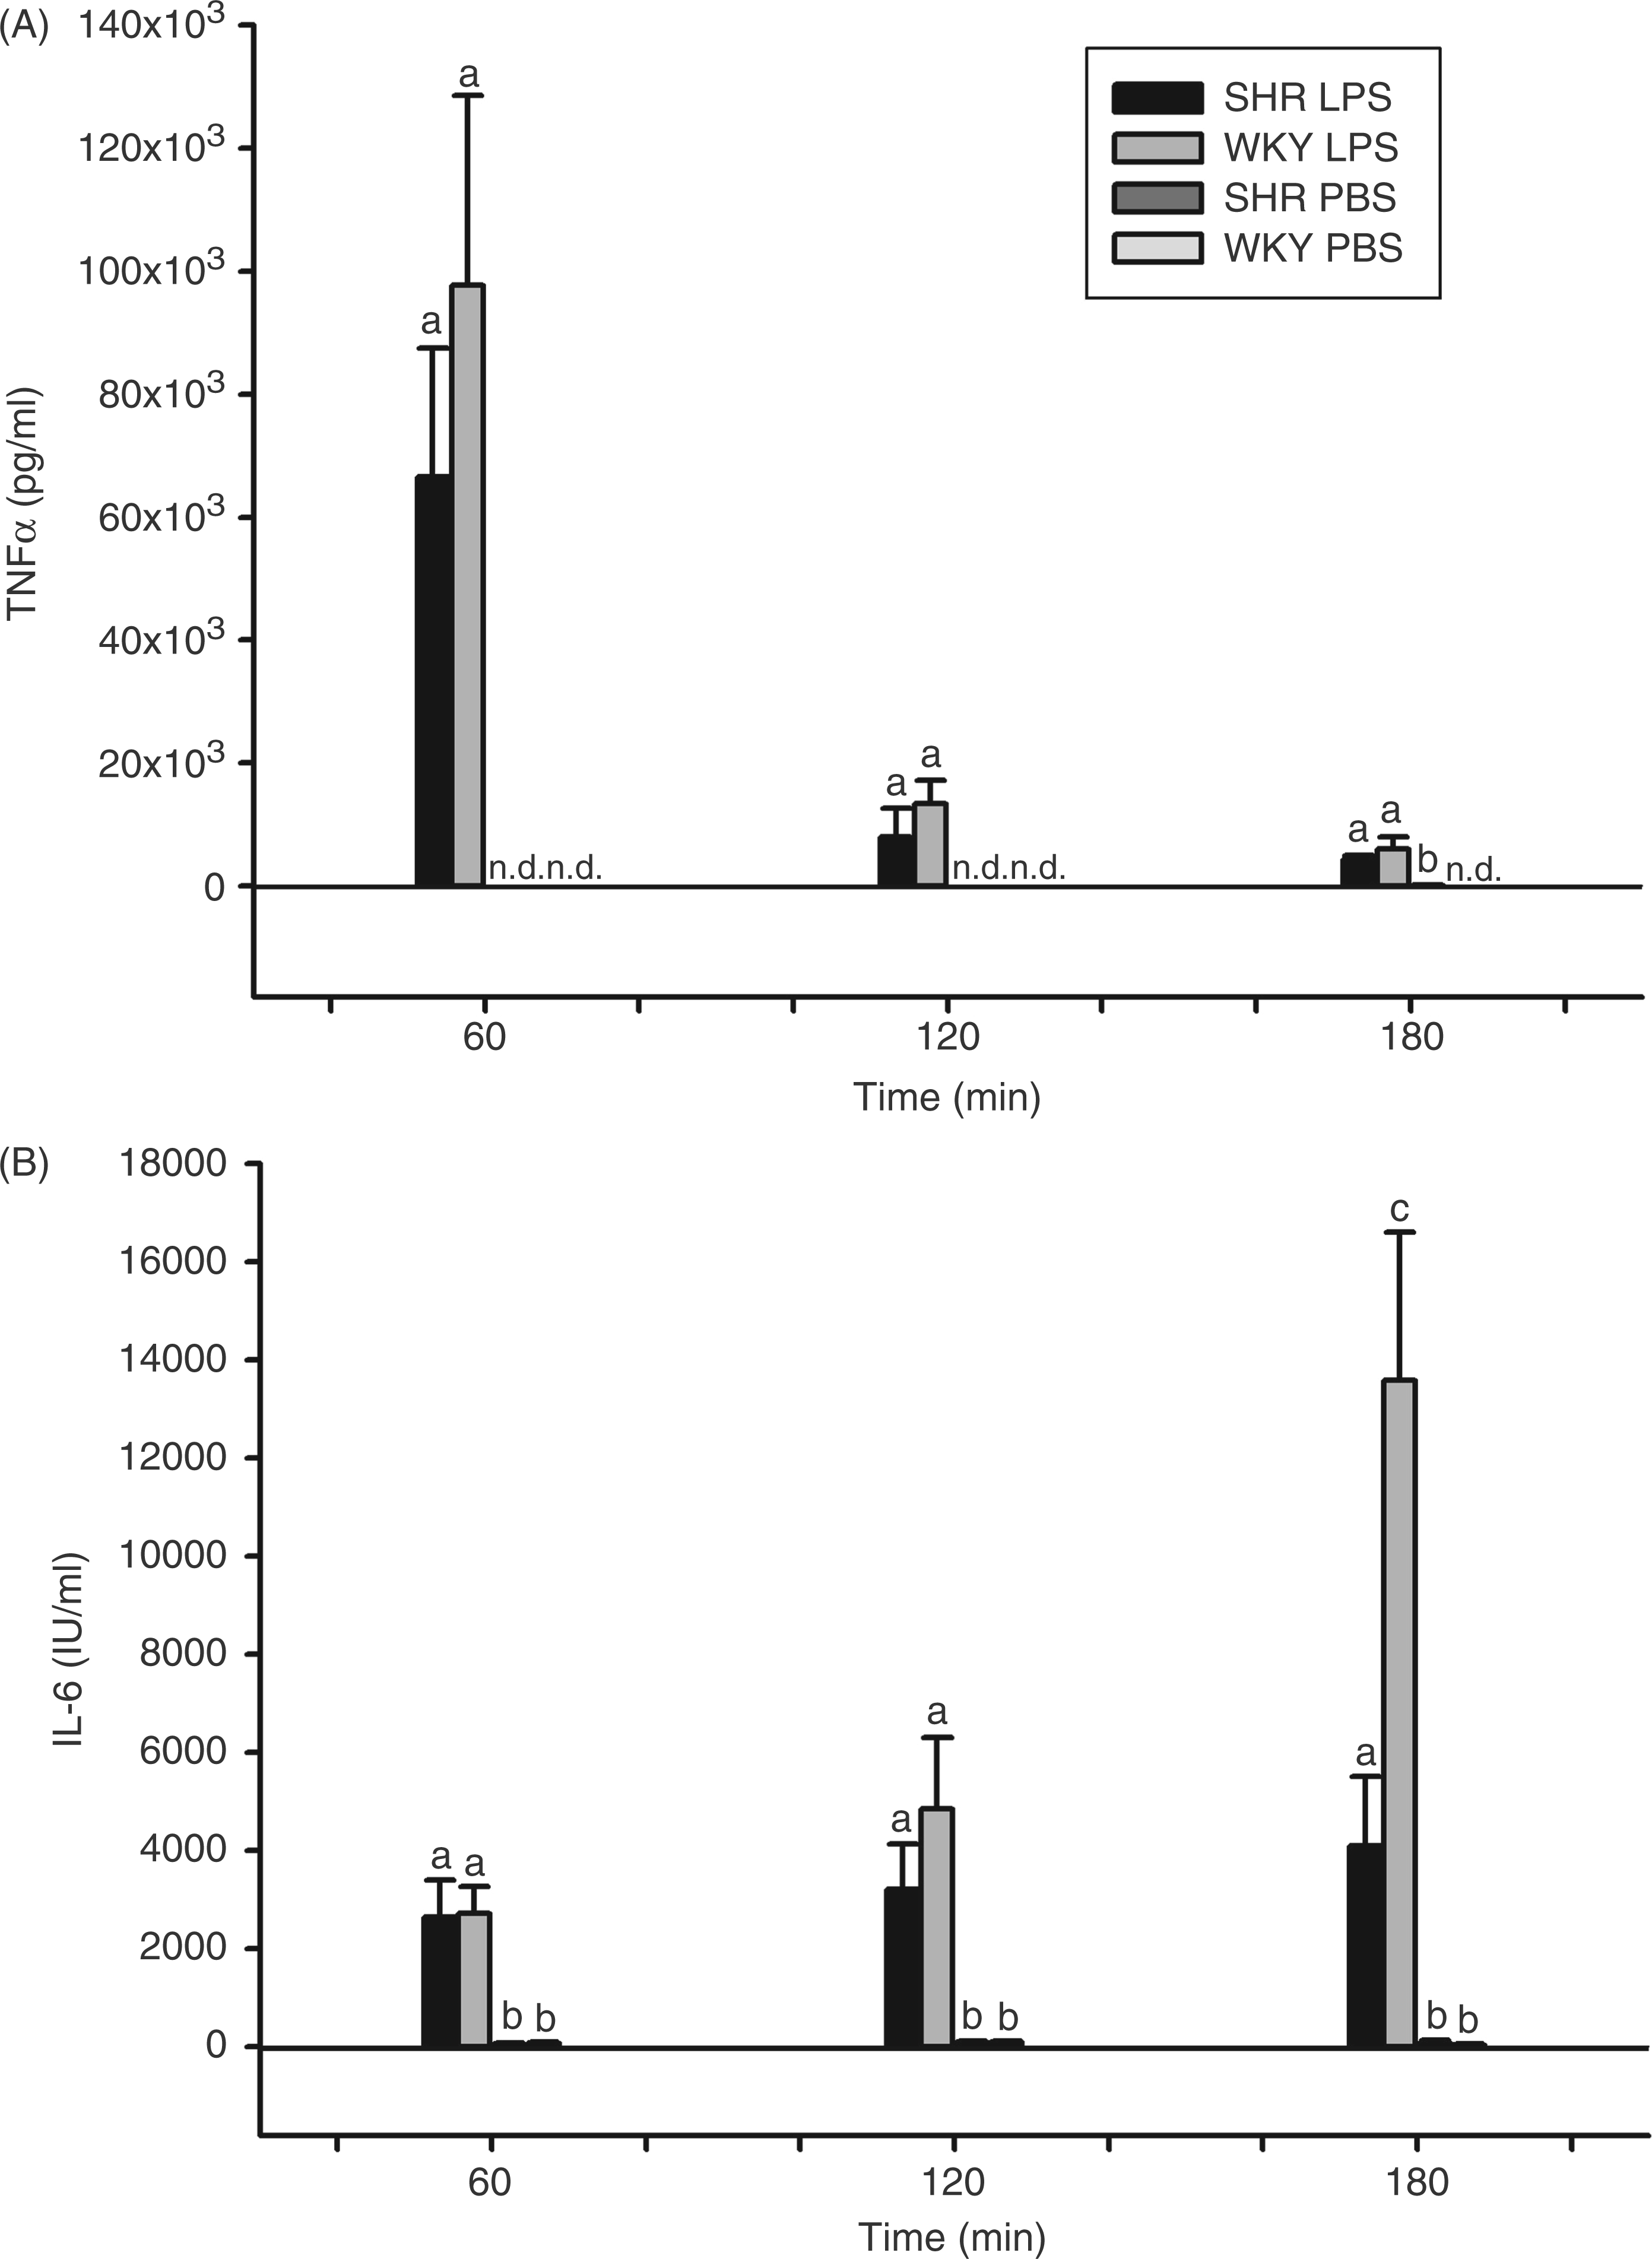
Thereafter, we observed a rapid decline of TNF-α in plasma which was very similar in SHRs and WKY rats. There was, however, a difference in the IL-6-response to LPS-treatment between SHRs and WKY rats (Figure 8B). In both strains, circulating IL-6 rose to about 2700 I.U./ml within 1 h. The subsequent increase during the following 2 h was much stronger in WKY rats compared with SHRs. At 180 min from the time of LPS-injection, the level of IL-6 in plasma was significantly higher in WKY rats when compared with SHRs (13,500 vs 4100 I.U./ml; F = 8.0; P = 0.0297). To test whether the reduced fever of SHRs was related to circulating PGE2, we measured PGE2 in plasma.
Basal levels of PGE2 in the range of 40–100 pg/ml were detected in both rat strains. Injections of MALP-2 and LPS caused a two- to fourfold increase of PGE2 concentrations in the blood. These values tended to be higher in WKY rats (compared with SHRs) and in response to LPS (compared with MALP-2), but, because of individual variations, these differences were not significant (not shown).
This observation, that IL-6 was the only putative circulating mediator of fever, for which we observed a significant difference between SHRs and WKY rats, at least in response to LPS (Figure 8B), provided the rationale for the next experiment.
In this experiment, we therefore tested whether there were differences in the IL-6-mediated inflammatory activation of brain sites without a tight blood-brain-barrier. For that purpose, we quantified the degree of nuclear translocation of the transcription factor STAT3 within these brain areas by counting nuclear STAT3 signals. The results of this evaluation are summarized in Figure 9.
Numbers of STAT3-positive cell nuclei in selected brain structures of MALP-2- or LPS-treated SHRs and WKY rats. Two hours after i.p. injections of 100 µg/kg MALP-2 (A), 100 µg/kg LPS (B) or the respective solvent (cermophor or PBS), the numbers of STAT3-immunoreactive cell nuclei were counted in the organum vasculosum laminae terminalis (OVLT), the subfornical organ (SFO), the median eminence (ME) and the area postrema (AP) prepared from SHRs and WKY rats. The columns represent means of the means ± SEM (n = 3 in each group, 3 brain section from each animal and each brain structure). In rats treated with cremophor or PBS, hardly any nuclear STAT3 signal was detected (see Supplementary Figure as a representative example). The identical letters above the columns indicate that there were no significant differences in MALP-2 or LPS-induced nuclear STAT3 activation between both rat strains in any brain structure investigated.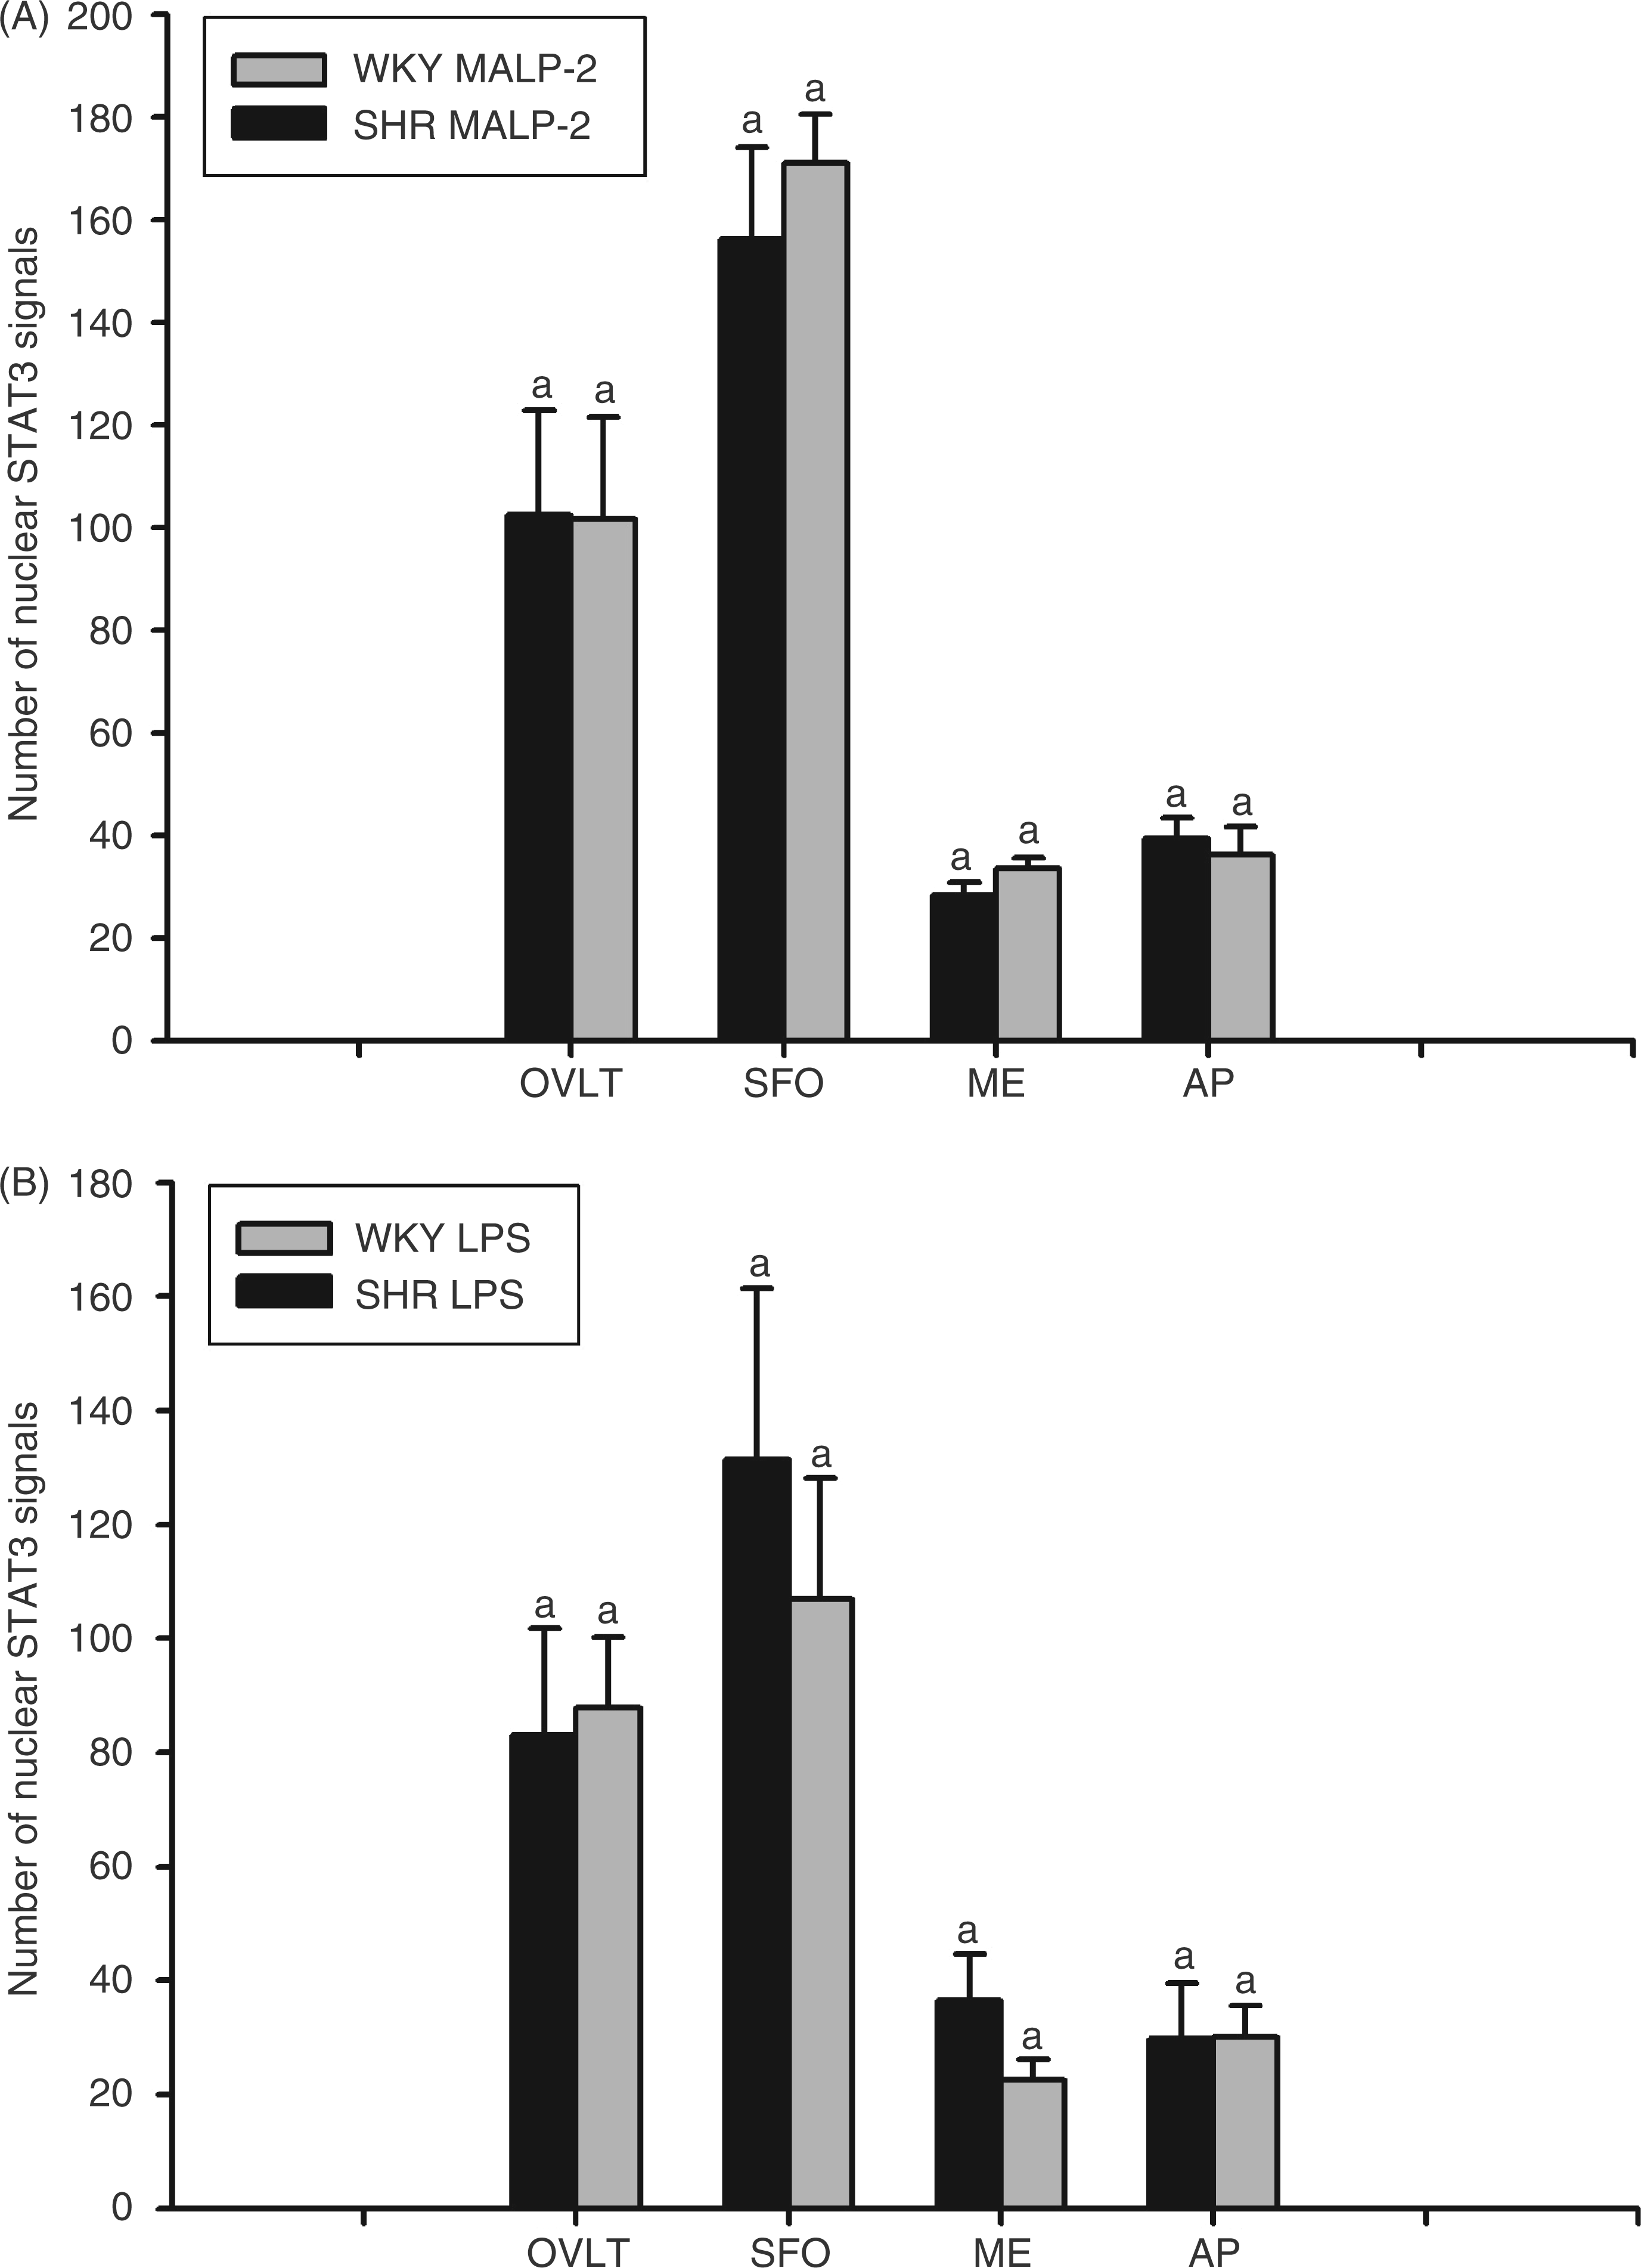
Hardly any nuclear STAT3 signal was observed in brain sections from OVLT, SFO, ME and AP in both control groups (i.p. injections of cremophor or PBS; see Supplementary Figure S2, showing examples of STAT3 immunohistochemistry performed in this study). In none of the four investigated brain sites prepared from MALP-2 (Figure 9A) or LPS-treated animals (Figure 9B), could we detect any significant differences in numbers of STAT3- positive cell nuclei between the two rat strains (see the brown reaction product as a result of diaminobenzidine hydrochloride conversion in Supplementary Figure S2). In OVLT and SFO, mean numbers of STAT3 positive cell nuclei ranged from 80 to 180 per section. Nuclear STAT3 activation in ME and AP was less pronounced (20–40 STAT3 positive nuclei per section). The strength of nuclear STAT3 activation was similar, irrespective of the injected pyrogen, suggesting that a threshold level of IL-6 sufficient to cause comparable brain activation was reached in all pyrogen-treated SHR and WKY rats. The observed differences between SHR and WKY with regard to fever, anorexia or adipsia can thus not fully be explained by impaired formation of cytokines (i.e. IL-6) in the SHR strain. In addition, our data suggest that the CD36 deficiency of SHR does not blunt the responses of these animals to MALP-2, as it has been observed under in vitro conditions in cultured cells.17,18
Experiments with peritoneal macrophages from SHR and WKY rats
In the final experiment, we tested the capacity of peritoneal macrophages collected from SHRs and WKY rats to respond to stimulations with LPS and MALP-2 with the release of bioactive cytokines into the culture medium. The results of these measurements can be summarized as follows (Figure 10).
MALP-2- and LPS-induced cytokines in supernatants of peritoneal macrophages from SHRs and WKY rats. Peritoneal macrophages (five cell preparations from different SHRs or WKY rats; 350,000 cells per well) were stimulated with MALP-2 or LPS at concentrations of 10 µg/ml or the respective solvent (cermophor or PBS) and bioactive cytokines were measured in the supernatants. All columns are means ± SEM; there were no significant differences at any time point between the two rat strains.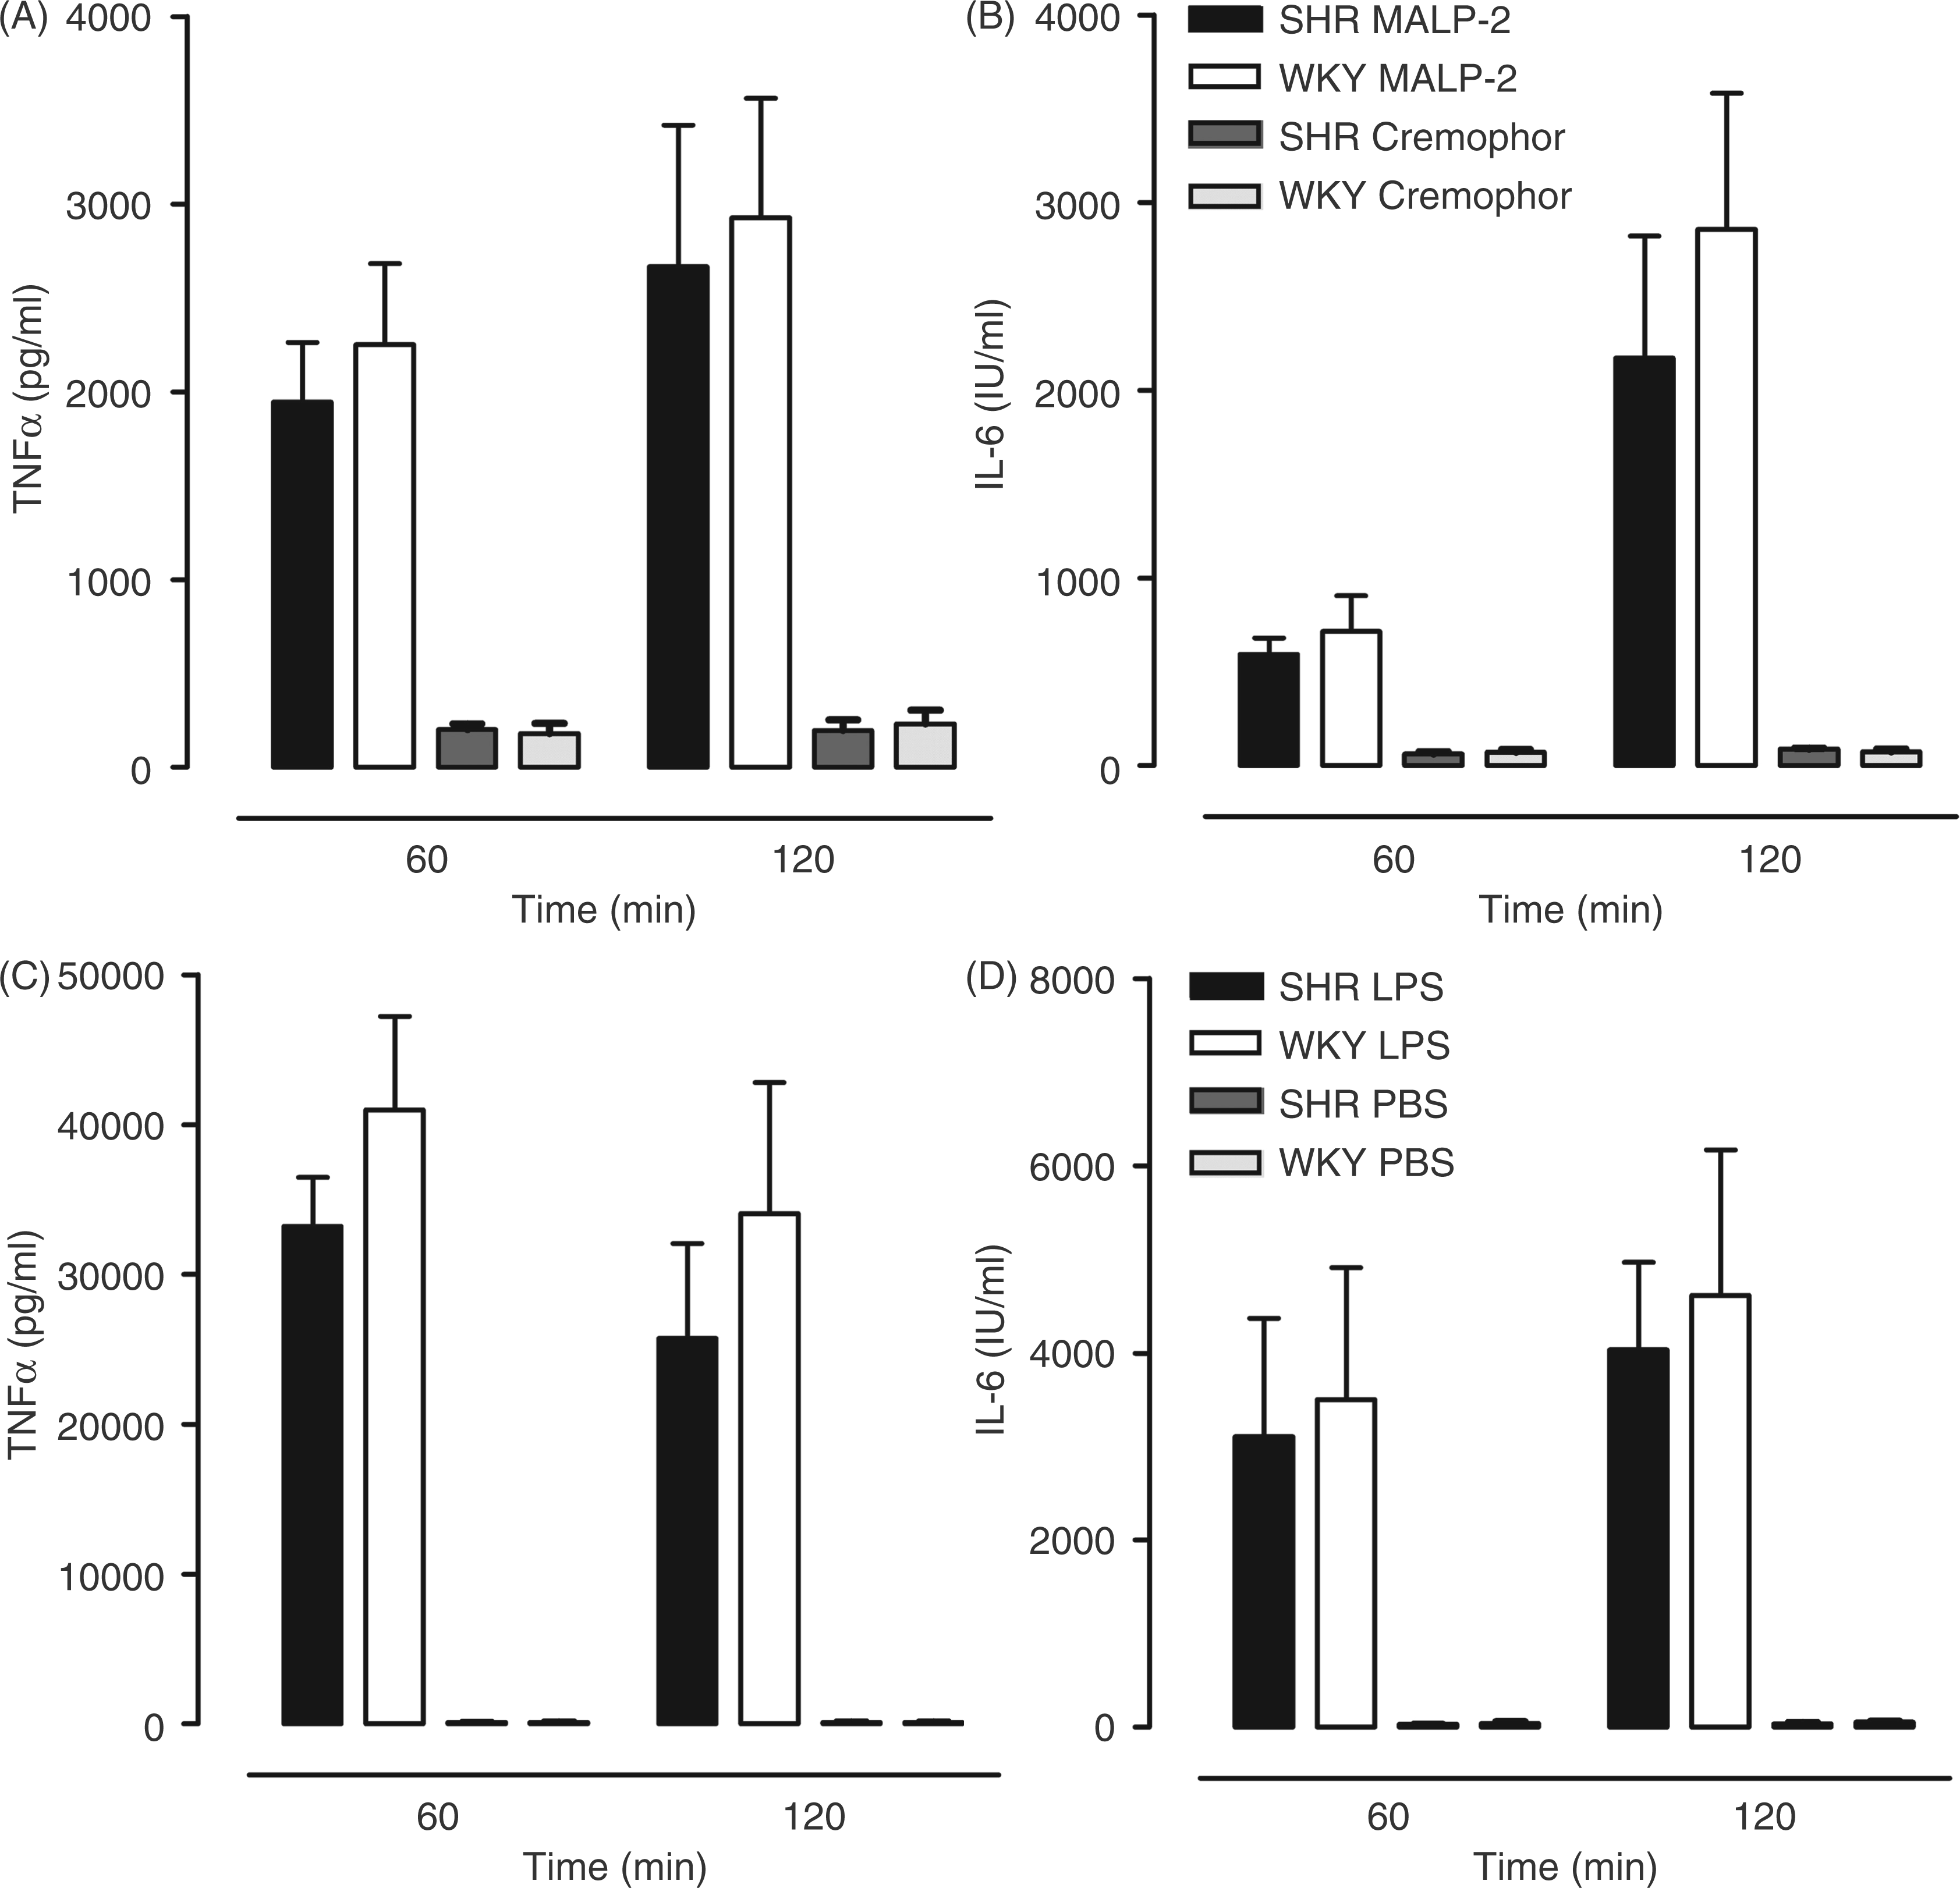
At a dose of 10 µg/ml, LPS (Figure 10C, D) caused a 15 (TNF-α) or 2–4 times (IL-6) stronger release of bioactive cytokines into the supernatant when compared with MALP-2 (Figure 10A,B). At both time points investigated, the concentrations of IL-6 and TNF-α in the medium of LPS- or MALP-2-treated cells were significantly higher than in the supernatants of macrophages stimulated with PBS or cremophor. The respective values tended to be higher for cells from WKY rats, but there was no significant difference for both cytokines at any time point. Interestingly, the exposure of peritoneal macrophages to cremophor had a significant effect (P < 0.05) on the concentrations of TNF-α or IL-6 in the supernatants when compared with the respective stimulation with PBS. A moderate inflammatory effect of the vehicle, cremophor, is thus likely, but it was not significant under in vivo conditions.
Discussion
Responses of TLR2 KO and C57/BL-6 mice to MALP-2 and LPS
The capacity of MALP-2 to induced fever in mice has not yet been tested. In the first part of the present study, we demonstrated that MALP-2 fails to induce fever in TLR2 KO mice as opposed to C57/BL-6 mice. This indicates that TLR2 is essential for MALP-2-mediated fever and that TLR6 alone is not able to induce a functionally-relevant MALP-2-induced signal transduction in vivo. Corresponding to these observations, TLR2-deficiency is accompanied with non-responsiveness to MALP-2 challenge in respect to TNF-α and IL-6 release. The results of our experiments are not natural per se owing to the fact that TLR2 alone is sufficient to recognize other bacterial lipopeptides in vitro, meaning that a functional pair formed by two TLRs is not required for all bacterial lipopeptides. 6 The structural details responsible for this discrepancy have been elaborated and it has been shown that recognition of microbial lipopeptides carrying only two fatty acids, such as MALP-2, requires co-expression of TLRs 2 and 6. 8 In our experiments, MALP-2 caused a rather moderate fever of about 6 h that followed the rise of deep body temperature caused by the injection procedure. The failure of TLR2-KO mice to produce fever in response to MALP-2 cannot be explained by a general lack of capacity to develop a fever-response because of the fact that they readily become febrile after an appropriate LPS-challenge. The shape and duration of LPS-fever in mice depend on the dose and ambient temperature. 29 At the ambient temperature of 30°C, which is close to thermoneutral in this species, 29 the febrile responses to LPS were significantly lower in TLR2-KO mice compared with C57/BL-6 mice, despite of the fact that the LPS-induced concentrations of circulating TNF-α and IL-6 were almost identical in both mouse strains. This observation is of interest in so far as it has previously been argued that TLR2 can confer responsiveness to LPS, at least under in vitro conditions, 30 although the expression of TLR2 is not essential for mammalian responses to endotoxin. 31 Not only LPS-fever, but also the rise of body temperature caused by the injection procedure was diminished in TLR-KO mice so that they developed a negative FI in response to administration of cremophor or PBS. One way of explaining this observation is that TLR2-KO mice display reduced thermogenesis, at least under stimulated conditions. This question requires further investigation. A second way of possibly explaining the reduced febrile response to LPS in TLR2-KO mice relates to the aforementioned presence of TLR2-activity in the LPS-preparation that we used for our experiments. Our data on reduced LPS-fever in these mice are in agreement with earlier observations that TLR2 confers responsiveness to LPS,30,31 although it has also been reported that all components of the febrile and thermoregulatory responses to LPS are mediated via TLR4 signaling and not by lipoprotein contaminants that might signal through TLR2. 32
In conclusion, it is thus likely that fever and cytokines induced by i.p. injections of LPS were, at least, predominantly mediated via stimulation of TLR4 not only in TLR2-KO mice but also in C57/BL-6 mice, while a significant contribution of TLR2 activity to LPS-fever cannot be ruled out.
Responses of SHRs and WKY rats to MALP-2 and LPS
Hoebe et al. 17 transfected HEK-293 cells to express CD36 in combination with TLR2 and/or TLR6, as well as NF-κB and stimulated the distinct cell populations with MALP-2. In these experiments, MALP-2 caused NF-κB activation when cells expressed TLR2, whereas transfection with either CD36 or TLR6 alone did not support activation by MALP-2. Interestingly, the response to MALP-2 was highly augmented when either CD36 or TLR6 were co-expressed with TLR2. In the same study, it was shown that a mutation of the CD36 caused an immunodeficiency in mice with reduced responsiveness of the animals’ macrophages to MALP-2. 17 The authors of this study concluded that CD36 acts as a sensor of microbial diacylglycerides that signal via TLR2 or the TLR2/6 heterodimer. Another study on human monocytes and transfected HEK-cells demonstrated that secretion of TNF-α in response to MALP-2 was strongest in presence of TLRs 2 and 6 in combination with CD36. 18
One of the diverse abnormalities of the SHR is a chromosomal deletion event that occurred at the CD36 locus during the evolution of this rat strain. 19 Interestingly, it has been reported that the deficiency of CD36, which participates in outer segment phagocytosis by the retinal pigment epithelium, leads to age-related photoreceptor degeneration and chorodial involution via down regulation of cyclooxygenase-2 (COX-2) in SHR and CD36-KO mice. 20 This study indicates that the induction of pro-inflammatory genes, including COX-2, may be impaired in the CD36-deficient SHR. Thus, the SHRs seemed to represent an appropriate animal model to investigate a possible reduced in vivo responsiveness to MALP-2 caused by a lack of CD36. With regard to fever, the response of SHR was significantly lower from 170–435 min after injection of MALP-2 when compared with their genetic controls, the WKY rats. However, the reduction of the febrile response was not dramatic. Differences in MALP-2-induced formation of cytokines were even less pronounced between SHRs and WKY rats; circulating IL-6 just tended to be lower in SHR at 2 h after the MALP-2 was administered. In the case that these small differences were caused by the lack of CD36, one would expect that LPS-induced responses were not impaired in the SHR strain. However, we obtained the opposite results. The reduction of LPS-induced fever and LPS-induced release of cytokines (i.e. IL-6) in SHRs was even more pronounced when compared with the respective MALP-2-induced responses. A significant contribution of CD36 in MALP-2-induced fever and cytokine responses is, thus, rather unlikely. Some support for our finding is given by a recent study in CD36-KO mice. 33 In this study, activators of TLR2/6 [fibroblast-stimulating lipopeptide-1 (FSL-1)], TLR2/1 [palmitoyl-S-dipalmitoylglyceryl (Pam3)] or LPS were injected intracerebroventricularly into wild-type or CD36-KO mice, and inflammatory gene expression was assessed in the brain. Interestingly, only the inflammatory response to Pam3, but not to FSL-1 or LPS, was suppressed in CD36-KO mice. 33 FSL-1 is a substance that shares many properties with MALP-2 and both evoke similar responses in vivo. 14 –16,34,35 Thus, it seems that the impaired effects of MALP-2 on special CD36-deficient cells17,18 cannot fully be transferred to in vivo conditions. We thus tried to obtain information about the responsiveness of peritoneal macrophages of SHRs and WKY rats to stimulations with MALP-2 or LPS. Although there was a tendency for reduced formation of MALP-2-induced cytokines in macrophages from SHRs, this effect was not significant and it also occurred in response to LPS (Figure 10). Our observation may be related to the doses of MALP-2, which we tested to obtain pronounced effects in our in vitro experiment. In addition, a moderate participation of the solubilizer cremophor in the MALP-2-induced activation of macrophages cannot be ruled out because of to the fact that cremophor alone had a small, but significant, stimulatory effect on the formation of cytokines in vitro. However, at least for the in vivo experiments with MALP-2 reported in our study, additive effects of cremophor on the parameters, which we investigated, were small-to-negligible. We cannot exclude the possibility that there are synergistic effects of cremophor with LPS or the water-soluble diacylated lipopeptide, FSL-1. A detailed investigation of interactions of cremophor with LPS or FSL-1 may merit another study on this question.
We further wondered whether the observed reduction of MALP-2 -, and especially of LPS-, induced production of IL-6 in SHRs may have had any impact at all on the inflammatory activation of the brain. Circulating IL-6 is regarded as an afferent signal to the brain that contributes to the manifestation of fever.23,36– 38 The inflammatory activation of the brain by circulating IL-6 and some other cytokines can be quantified by the degree of the nuclear translocation of the transcription factor STAT3 in brain sites with an incomplete blood-brain-barrier and it has been shown that LPS-induced activation of STAT3 in the brain depends, to a very high degree, on circulating IL-6. 39 The numbers of nuclear STAT3 signals were almost identical in both rat strains in response to both pyrogens. Our interpretation of this finding is that a critical threshold of IL-6, sufficient for an appropriate nuclear STAT3 activation in brain sites with an open blood-brain-barrier, was reached in both rat strains after stimulation with MALP-2 or LPS. Given that the afferent pyrogenic signaling via IL-6 or other mediators was strong enough to cause similar, or even identical, inflammatory activation of the brain, then the question of why the febrile response to MALP-2 and LPS was smaller in SHRs when compared with WKY rats arises. One possible way of explaining this phenomenon relates to the fact that we used i.p. injections of MALP-2 or LPS to induce fever in SHRs and WKY rats. Intraperitoneal injections of LPS, and possibly also of MALP-2, may cause a localized formation of inflammatory mediators in the abdominal cavity, for example IL-1β. It is known that IL-1β has the capacity to stimulate afferent fibers of the vagus nerve via their receptors on glomus cells of vagal paraganglia. 40 Such an inflammatory stimulation of vagal nerve fibers contributes to the manifestation of fever, as long as the i.p. route of administration is used. 40 Thus, it will be worthwhile investigating whether local formation of IL-1β within the abdominal cavity is impaired in the SHR strain. On the other hand, it was reported that CD36 deficiency can be accompanied by down-regulation of COX-expression. 20 In the hypothalamus, expression of COX-2 after appropriate peripheral inflammatory stimulation is regarded as a crucial step in the manifestation of fever,38,40 although there are some fever pathways that are independent of intrahypothalamic formation of prostaglandins. 41 An analysis of intrahypothalamic expression of COX-2 in MALP-2 - and LPS-treated SHRs and WKY rats would thus merit further study on this subject.
Physiologic situations that are accompanied by reduced fever despite similar afferent pyrogenic signaling to the brain are known. 37 Intrahypothalamic injections of prostaglandin E2 also result in smaller fevers in SHRs compared with WKY rats 42 and this experimental fever model does not depend on peripherally-derived pyrogenic signals. The strength of fever strongly depends on the balance between endogenous pyrogenic and antipyretic systems.43,44 There are some endogenous antipyretic substances of which the formation and/or secretion seem to be higher in SHRs than in WKY rats, including vasopressin and adrenocorticotropic hormone (ACTH).45,46 It was also reported that the expression of IL-10, which is an antipyretic cytokine, 22 is stronger in bacterially-infected SHRs compared with WKY rats. 47 Taken together, these data from literature suggest that there are several possibilities to explain the reduced fever of SHRs seen in our experiments, in addition to the moderate reduction of circulating IL-6. We are unable to decide which one of the proposed mechanisms is the strongest operator for the attenuation of fever in SHR, but a significant participation of the lack of CD36 is, in our eyes, rather unlikely.
Final conclusions
The ability of TLRs to initiate and propagate inflammation makes them attractive therapeutic targets. TLR2, for example, is required for innate host defense to infections with pathogens carrying numerous lipopeptides. 48 TLR2 alone can be activated by some of these microbial ligands, or heterodimers with TLR1 and TLR6 are formed for effective cellular stimulation. Although CD36 can act as a sensor of microbial lipopeptides, the quantitative role of this scavenger receptor in the manifestation of responses to diacylated lipopeptides, such as MALP-2 seems to depend on the respective experimental model and situation.17,18,33 Our data show that CD36-deficiency of SHRs has a merely insignificant inhibitory effect on MALP-2 driven inflammation in vivo. The observation that LPS-induced effects are more attenuated than MALP-2-induced effects in SHRs compared with WKY rats suggests that the complex SHR-sickness syndrome can not solely be explained by CD36-deficiency in this rat strain. Our results indicate TLR2 and TLR4 as target candidates for therapeutic interference with inflammatory pathology and neurologic malfunction upon infection and disqualify CD36 as such.
Footnotes
Acknowledgements
The authors thank Dr Peter F. Mühlradt for providing MALP-2 and for his helpful comments on the manuscript. Skilful and expert technical assistance from Daniela Ott with the preparation and cultivation of peritoneal macrophages is gratefully acknowledged.
Funding
This research received no specific grant from any funding agency in the public, commercial, or not-for-profit sectors.
References
Supplementary Material
Please find the following supplemental material available below.
For Open Access articles published under a Creative Commons License, all supplemental material carries the same license as the article it is associated with.
For non-Open Access articles published, all supplemental material carries a non-exclusive license, and permission requests for re-use of supplemental material or any part of supplemental material shall be sent directly to the copyright owner as specified in the copyright notice associated with the article.