
Abstract
Toll-like receptors play an important role in endothelial inflammation; however, little is known on the mechanisms regulating their expression. Differential promoter DNA methylation is an increasingly recognized mechanism that determines a switch between gene silencing and gene transcription. We hypothesized that epigenetic mechanisms are involved in the regulation of endothelial TLR2 expression because of the localization of the TLR2 promoter on a CpG-island. Resting human umbilical vein endothelial cells (HUVECs) displayed rather low TLR2 mRNA expression, while a strong expression increase occurred under inflammatory conditions. We examined the TLR2 promoter methylation pattern in resting HUVECs and compared it to cells treated either with the inflammatory cytokine TNF-α or the DNA-demethylating agent 5-azacytidine. DNA bisulfite conversion was followed by either genomic sequencing or single nucleotide primer extension (SNuPE) HPLC. Results of both techniques showed a low- or non-methylated TLR2 promoter in resting HUVECs and no alteration of the methylation pattern under inflammatory conditions. Whereas 5-azacytidine significantly increased the mRNA expression of the epigenetically regulated gene H19, TLR2 expression was not affected. Taken together, employing different methodological approaches, our data show no implication of methylation pattern changes in inflammatory induction of TLR2 expression in human endothelial cells.
Introduction
Toll-like receptors represent a family of pattern recognition receptors that serve as detectors for infectious agents, whereby TLR2 and TLR4 are the most important receptors for bacterial cell wall components. 1 It is well established that TLR-initiated inflammatory activation plays a key role in the development of atherosclerosis (for review, see Erridge 2 ). This was especially shown for TLR2 and TLR4 by genetic studies on mice harbouring a specific TLR deletion.3,4 Also for humans there is evidence for TLR2- and TLR4-dependent inflammatory activation in atherosclerotic lesion endothelial cells (ECs) and macrophages. 5 Despite the high expression of TLR2 and TLR4 in atherosclerotic lesions, basal expression levels in ECs seem to depend on the localization of ECs. Different vessel types express distinct patterns of TLRs6,7 and some authors report a rather low basal expression of TLR2 for human coronary arterial ECs (HCAECs) 8 and human umbilical vein ECs (HUVECs).9,10 Contrarily, also a high basal TLR2 expression and responsiveness towards TLR2 ligands in both primary arterial (HCAECs)11,12 and venous ECs (HUVECs)13,14 has been suggested.
Both up- and down-regulation of TLR2 and TLR4 have been reported by treatment of ECs with inflammatory mediators: in HUVECs, TLR2 as well as TLR4 expression are up-regulated by LPS, and TLR2 is inducible by TNF-α. 15 Satta et al. 10 reported no effect of LPS on TLR4 expression. Also, conflicting data are presented by Yang et al. 16 showing no effect of LPS on TLR2 expression in HUVECs.
Little is known on how the low basal TLR2 expression in resting cells and the high inducibility in some ECs may be mediated. Shuto et al. 17 showed, for human bronchial epithelial cells, a low TLR2 expression in normal cells that was up-regulated in cystic fibrosis epithelial cells. This elevated expression was caused by a TLR2 promoter hypomethylation, which induced a methylation-sensitive, Sp1-mediated transcriptional activity. 18 Besides the proximal promoter, also exon I and parts of intron I of the human TLR2 gene are situated in a CpG rich region. 19
CpG methylation is not only involved in long-term gene silencing and processes like genomic imprinting. There is increasing evidence that it is involved in tissue-specific gene repression20,21 and stimulus-dependent gene activation or repression.22,23
Cell-type specific differences in TLR2 promoter methylation have been reported for primary cells versus cell lines and promoter methylation has been discussed as a possible mechanism to down-regulate gene expression. 19 The aim of our study was to clarify the role of promoter methylation in the regulation of TLR2 expression in HUVECs, primary human cells that are frequently used for elucidation of inflammation-dependent signalling pathways involved in the development of atherosclerosis.
Materials and methods
Chemicals
Tumor necrosis factor-α, Escherichia coli LPS and 5-azacytidine and other chemicals were purchased from Sigma-Aldrich if not mentioned otherwise. Oligonucleotides were synthesized by Eurofins MWG Operon.
Cell culture
Human umbilical vein endothelial cells were isolated from umbilical cords by digestion with 0.01% collagenase A (Roche) solution and grown in ECGM with supplement mix (Promocell) containing penicillin 100 U/ml, streptomycin 100 µg/ml, kanamycin 50 µg/ml, and 10% FCS (PAA) as described. 24 For experiments, cells were used in passages 3 or 4.
The human epitheloid cervix carcinoma cell line HeLa was cultured in RPMI 1640 medium containing penicillin 100 U/ml, streptomycin 100 µg/ml and 10% FCS (PAA). The epithelial cell line 16HBE14o- was provided by Dr Gruenert (University of California San Francisco, USA) and cultured essentially as described. 25
Real-time quantitative RT-PCR
Total RNA isolation, DNase digestion and reverse transcription was done as described. 26 The cDNA quantification was performed with the iQ5 real-time PCR detection system (Bio-Rad). Real-time PCR for TLR2, TLR4, H19, TNF-α and the housekeeping gene β-actin was performed using Taqman probes or the DyNAmo™ Flash SYBR® Green qPCR Kit (Biozym) essentially as described (see Supplementary Table 1 for sequences). 26 – 28 Serial cDNA dilutions or standards of the corresponding PCR product (80–140 bp), cloned into pGEM-T Easy (Promega), were run alongside the samples to generate a standard curve. All samples and standards were analysed in triplicate.
Nuclear protein extraction
Nuclear protein extracts were prepared essentially as described.
29
Human umbilical vein ECs were washed once with ice-cold PBS, scraped and centrifuged in 1 ml PBS at 500 g for 5 min. The pellets were resuspended in 400 µl cold hypotonic cell lysis buffer (10 m
Electrophoretic mobility shift assay
Nuclear proteins (1–3 µg) were incubated for 20 min at room temperature (20–22°C) in a 20 µl reaction volume containing 2 µg poly (dI-dC; Sigma), 10 m
CpG methylation analysis
See Supplementary Material for detailed protocol.
Purification of DNA and bisulfite modification
For preparation of HUVEC DNA, the cell pellet was lysed and digested with proteinase K. The DNA was purified using phenol/chloroform/isoamyl alcohol and spectrophotometrically quantified. Its integrity was confirmed using agarose gel electrophoresis. Sodium bisulfite treatment was performed essentially as described. 30 For cloning and single nucleotide primer extension (SNuPE) analysis, bisulfite-treated genomic DNA was amplified by PCR.
Cloning and sequencing
The PCR products were checked on agarose gels, extracted using Nucleospin® Extract II (Machery-Nagel) and cloned into pGEM-T Easy (Promega) according to the manufacturer’s instructions. Plasmids were transformed into E. coli TOP 10. Inserts from single clones were amplified by colony PCR and products were cleaned using PCR DNA Fragments Extraction Kit (AveGene). Analysis of the following sequencing reaction was performed on a Beckman Coulter sequencer.
Single nucleotide primer extension
The PCR product from bisulfite-treated genomic DNA was cleaned with ExoSAP (USB) prior to SNuPE reaction. For calibration, a reaction was performed with ddTTP only and another with ddCTP only. The extended primers were separated on a DHPLC WAVETM system from Transgenomic.28,31
Transfection of Sp1 decoy
Human umbilical vein ECs were cultured until 90% confluence in 6-well plates. Then, 87.5 µl Opti-MEM, 0.1 µg partially phosphorothioated modified decoy or scrambled oligonucleotides (Supplementary Table 3) and 1 µl SuperFect transfection reagent (QIAGEN) were mixed and incubated for 10 min at room temperature. Culture medium (600 µl) was mixed with the oligonucleotide suspension and added to the cells. Human umbilical vein ECs were incubated for 4 h at 37°C, 5% CO2 prior treatment.
Statistical analysis
Statistical analyses were performed using Origin Pro 8.1 software from OriginLab Corporation. All results are summarized as mean ± SEM and compared using a two-sample t-test. Statistical significance was set as indicated.
Results
Expression of TLR2 and TLR4 in resting HUVECs
Due to the reports on differential expression profiles in endothelial cells from different species and vessels,
7
we aimed to quantify TLR2 and TLR4 expression levels in the most commonly used model of primary endothelial cells, i.e. HUVECs.
32
A real-time RT-PCR method using cloned standards for quantification was used.
26
Our data indicate a rather low abundance of TLR2 mRNA while TLR4 displays a high transcript level: TLR4 mRNA levels are 56 times higher than those of TLR2 (Figure 1).
Basal TLR2 and TLR4 mRNA expression in HUVECs. Toll-like receptor 2 and TLR4 mRNA expression were quantified using real-time RT-PCR and values were normalized to β-actin. Diamonds show values from 12 donors for TLR4 and from 18 donors for TLR2. Squares show mean ± SEM of these experiments.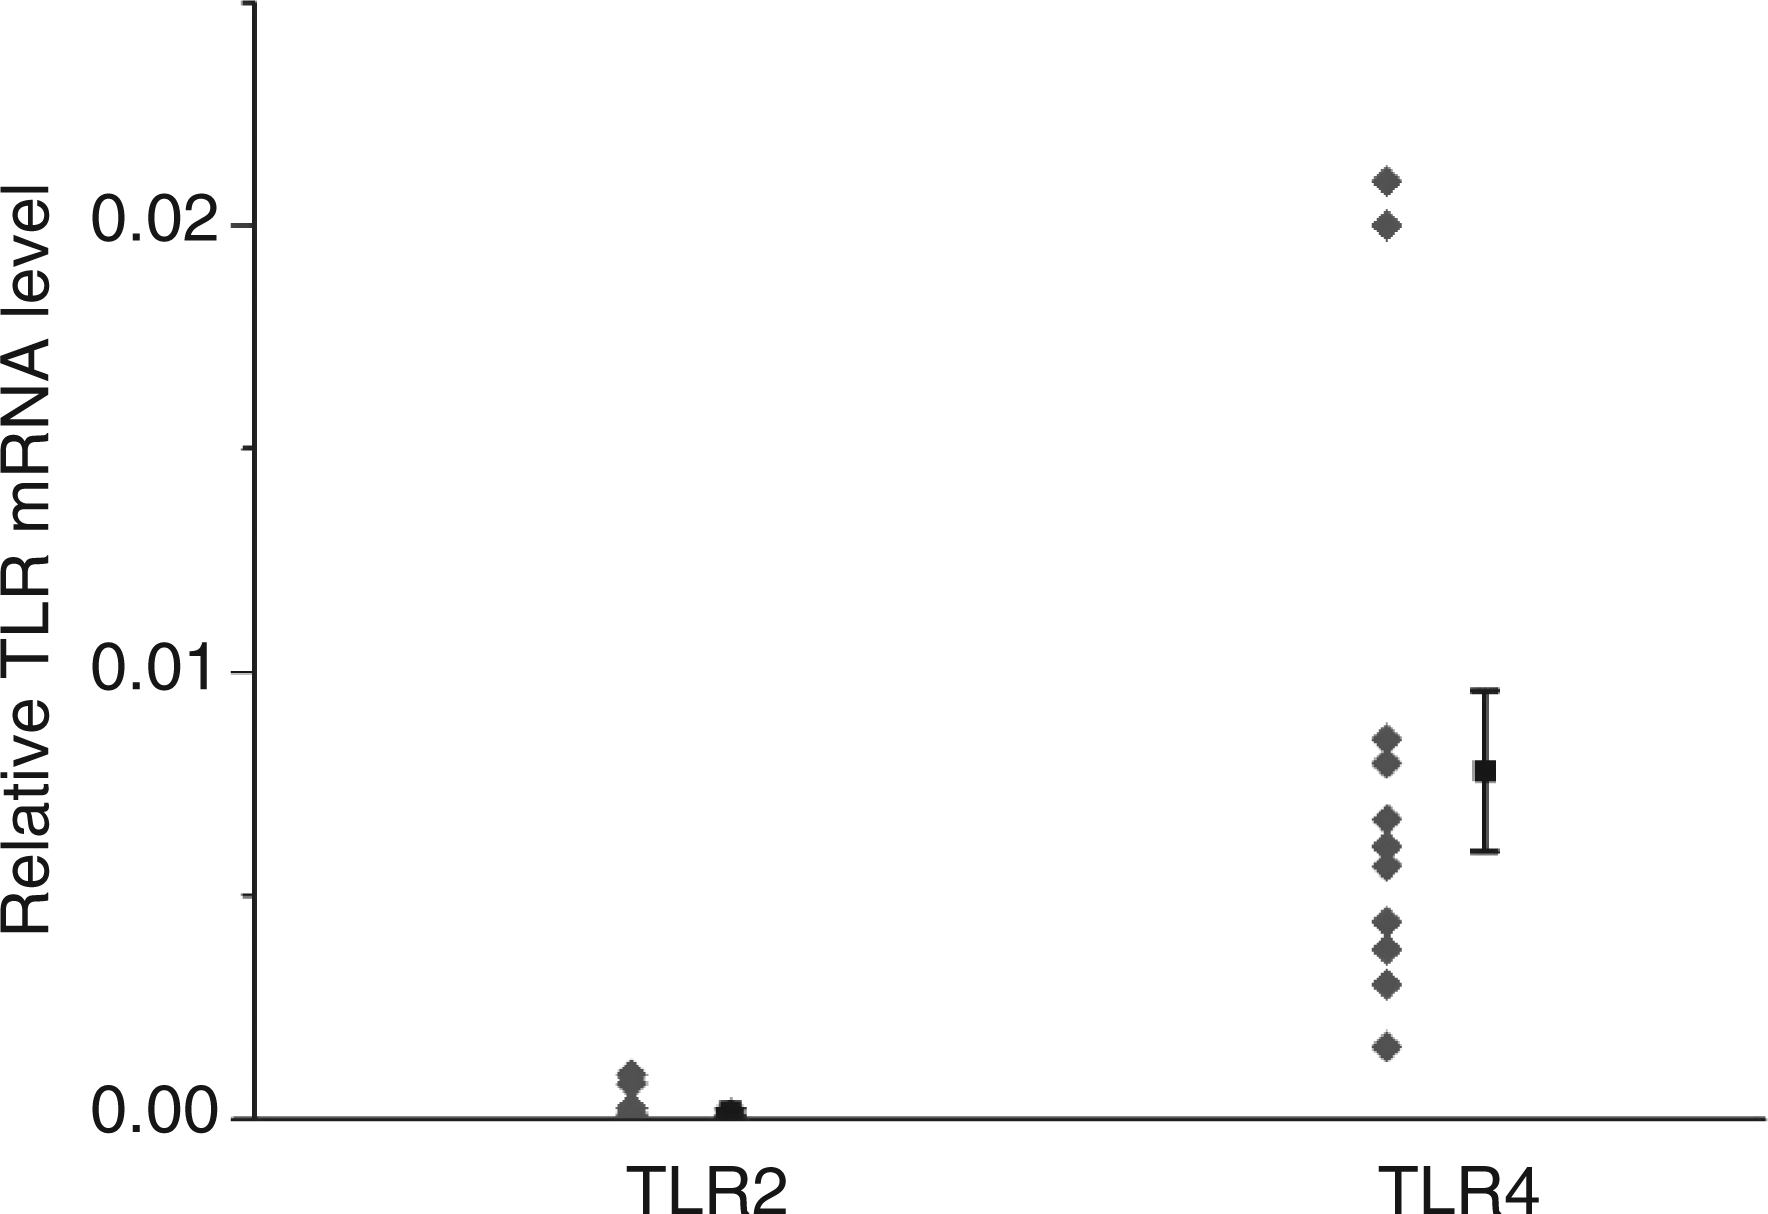
Expression of TLR2 and TLR4 changes under inflammatory conditions
We investigated the effect of inflammatory conditions on TLR2 and TLR4 mRNA expression by treating cells with the pro-inflammatory cytokine TNF-α as well as with the TLR4 agonist LPS. Employing real-time RT-PCR, we determined the transcript levels of both genes at 2, 4, and 8 h of treatment (Figure 2). Our results indicate a strongly up-regulated TLR2 mRNA expression in TNF-α-stimulated HUVECs (up to 80-fold; Figure 2a) as well as a slight, but significant, TNF-α-induced TLR4 mRNA down-regulation (Figure 2b). The LPS-mediated effect on TLR2 expression was comparable to the one induced by TNF-α regarding both the time scale as well as the extent of TLR2 up-regulation. In contrast, LPS-treated HUVECs displayed no significant changes in TLR4 expression. Since treatment of HUVECs with inflammatory mediators only showed a minor effect on TLR4, further analyses focused on TLR2 expression regulation. Furthermore, we focused on TNF-α-induced inflammation because both mediators induce similar endothelial gene expression profiles.
33
Expression of TLR2 and TLR4 changes after TNF-α and LPS challenge in HUVECs. Toll-like receptor 2 (a) and TLR4 (b) mRNA levels were quantified after 2, 4, and 8 h of TNF-α (10 ng/ml) or LPS (100 ng/ml) treatment employing real-time RT-PCR and normalization to β-actin. Data are expressed as x-fold compared to untreated controls (0 h) and show mean ± SEM of three independent experiments from different donors. *P < 0.05 compared to untreated control (0 h).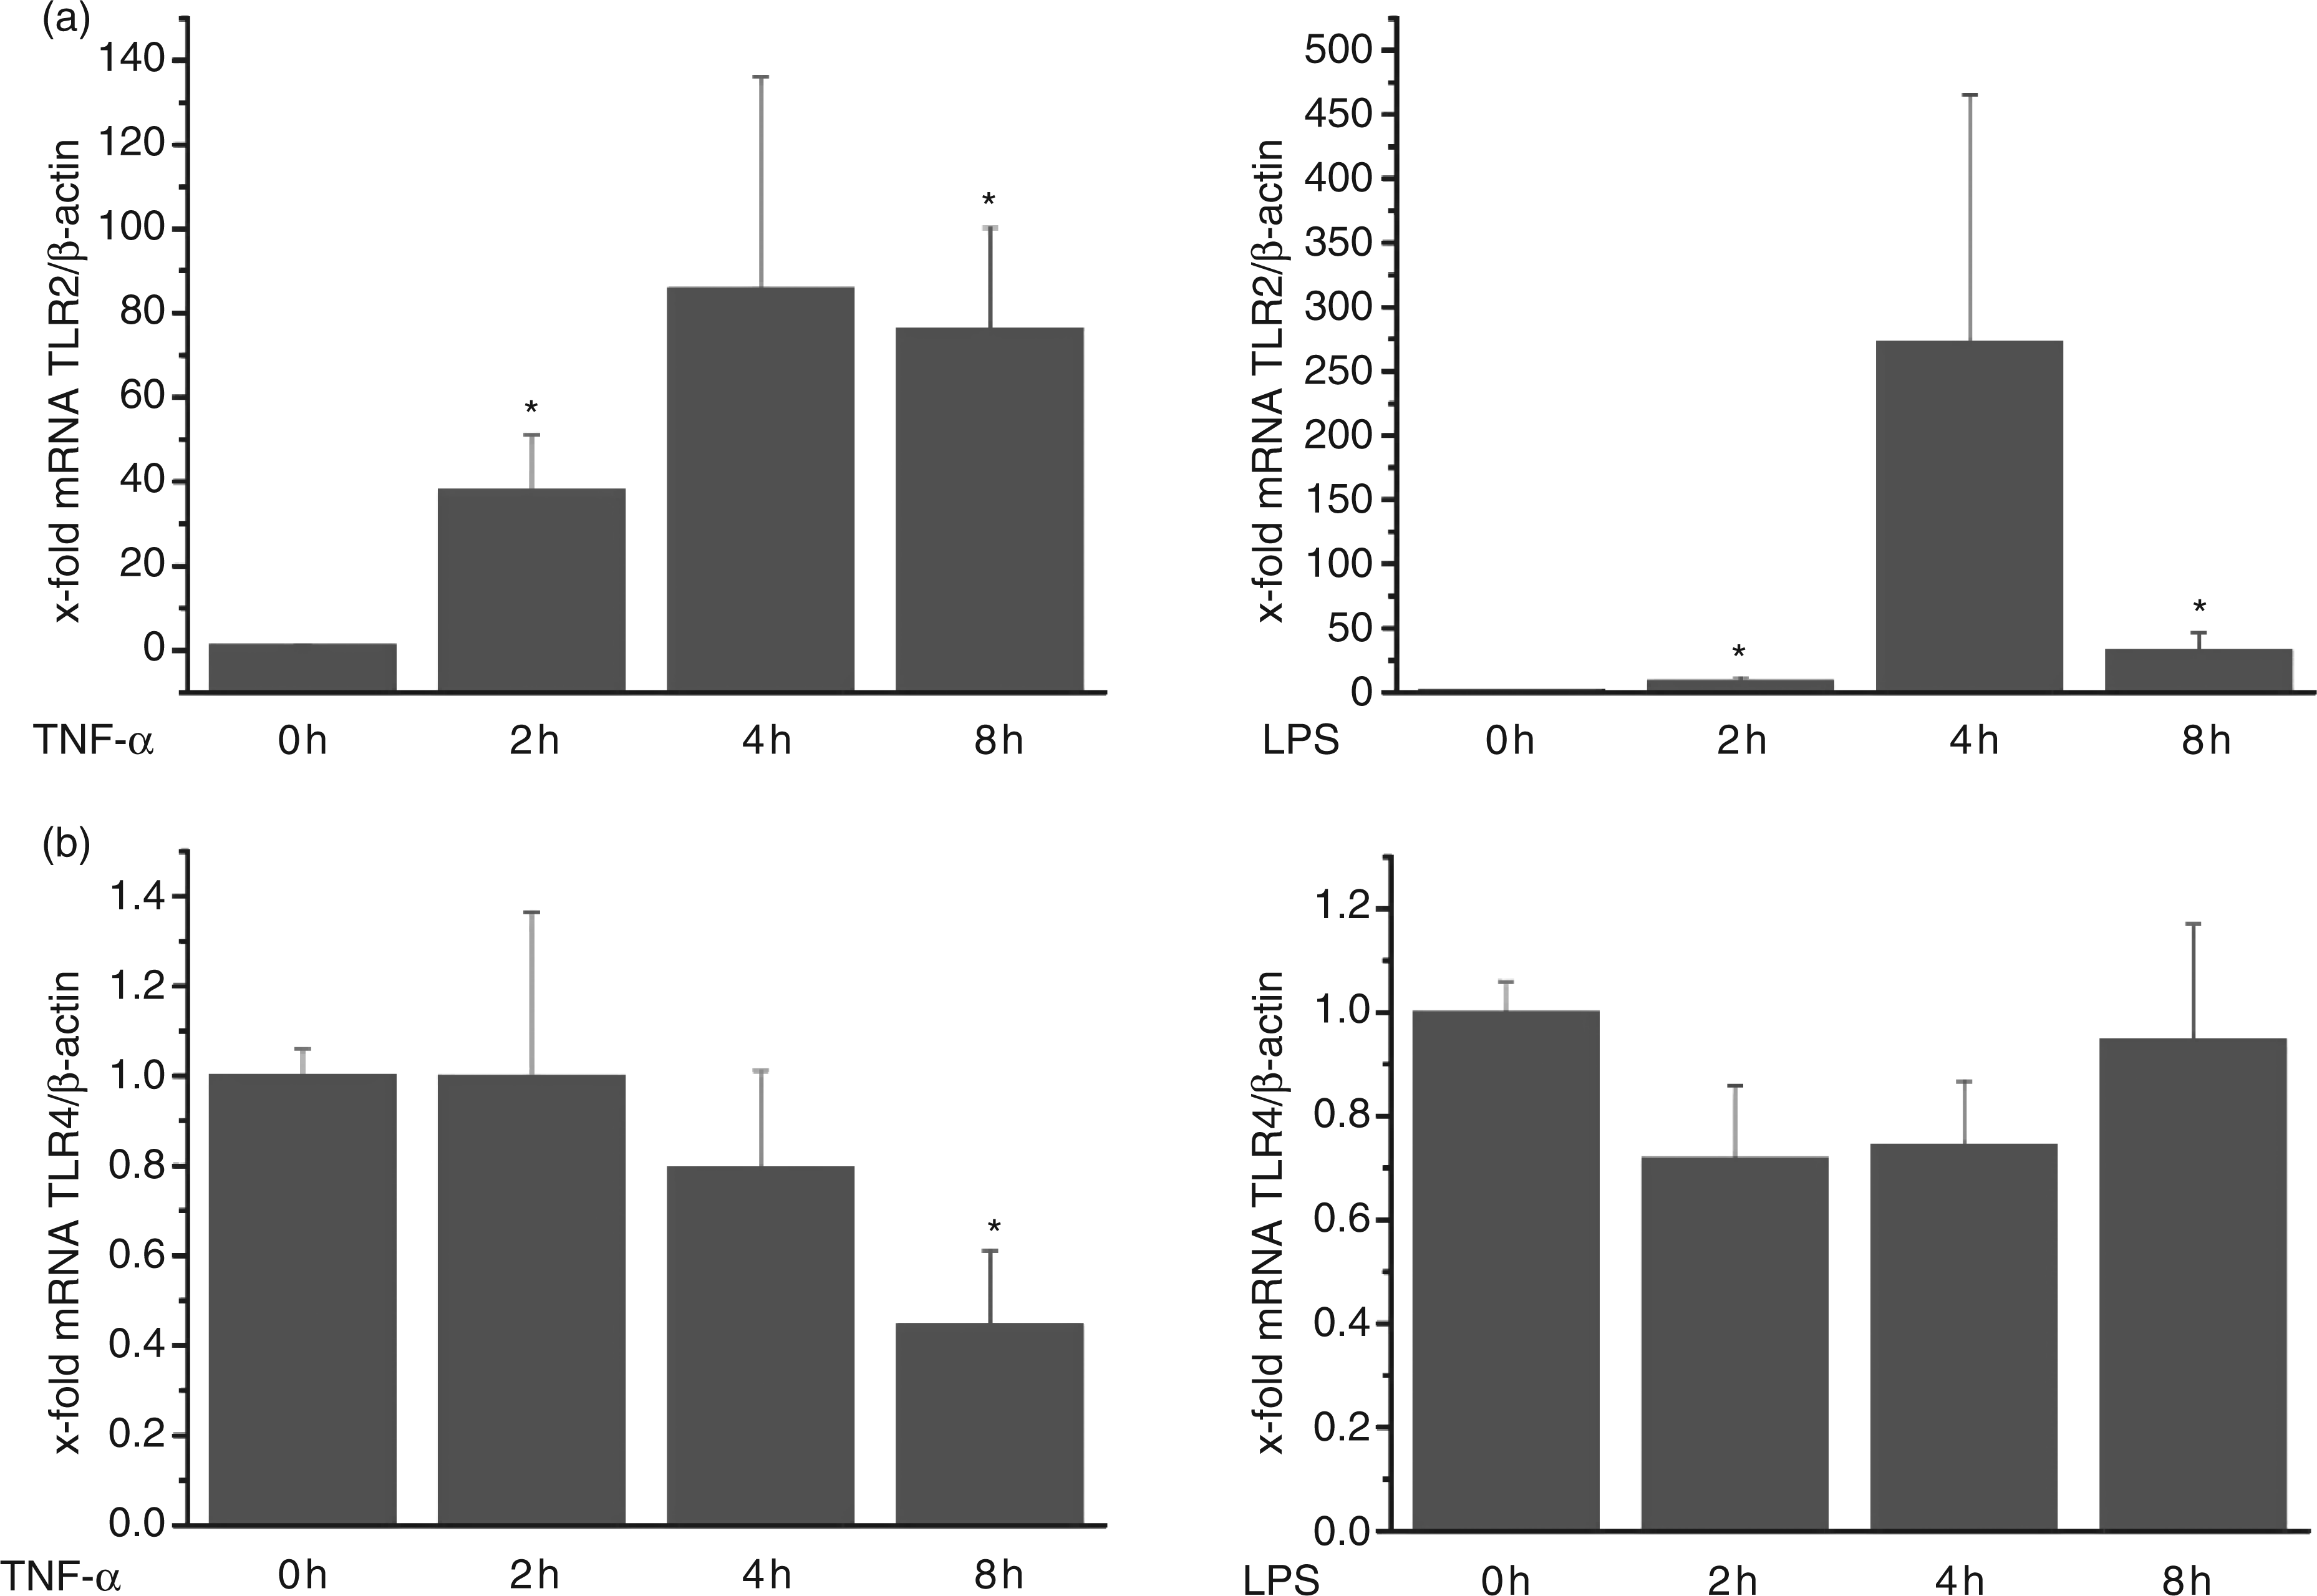
Methylation state of the TLR2 promoter in HUVECs
The TLR2 promoter region, exon 1, and a part of intron 1 is a CpG dinucleotide high density region (Figure 3).
19
Due to the low basal expression level of TLR2 in HUVECs, we hypothesized that TLR2 transcription might be suppressed by hypermethylation of its promoter. Since TNF-α has been reported as a regulator of DNA methylation,
22
a respective regulatory action was also suggested for TLR2 transcriptional control. In order to determine TLR2 promoter region methylation pattern, we performed sodium bisulfite sequencing of genomic HUVECs DNA. This analysis comprised 35 CpGs upstream and 20 CpGs downstream of the transcription start site (630 bases). The results revealed both a hypomethylated promoter region (total methylation <2%; Figure 3b) as well as a hypomethylated region downstream of the promoter (total methylation ∼0.5%; Figure 3c). Only nine positions of the 55 examined CpGs were partially methylated (<15% methylation). These results indicated that a global methylation of the TLR2 promoter region is not involved in the low transcription level of this gene in HUVECs. However, five CpG positions, i.e. positions −35, −30, −26, −23, and +3 evidenced more than 10% methylation. Since the CpG positions −26 and −23, showing about 11% and 15% of methylated cytosines, are located on Sp1 binding sites (Figure 3a), which have been reported to be critical in TLR2 transcriptional control,
18
we further investigated these sites by SNuPE analysis.
Promoter region sequence and its methylation state in HUVECs. (a) Promoter, first exon, and a part of the first intron of the TLR2 gene. The putative promoter sequence of the TLR2 gene is underlined. Grey boxes represent putative Sp1-binding sequences. Light grey letters display the first exon. Numbers indicate the CpG positions relative to the transcription start (TS). (b) Methylation state of the TLR2 promoter in HUVECs. Methylation state of cytosines in CpG positions −1 until −35 was examined by bisulfite genomic sequencing of 29 clones. (c) Methylation of the exon 1 and parts of intron 1 of the TLR2 gene (CpG positions +1 until +20). Methylation state of cytosines was examined by bisulfite genomic sequencing of 19 clones. Numbers represent CpG positions to transcription start.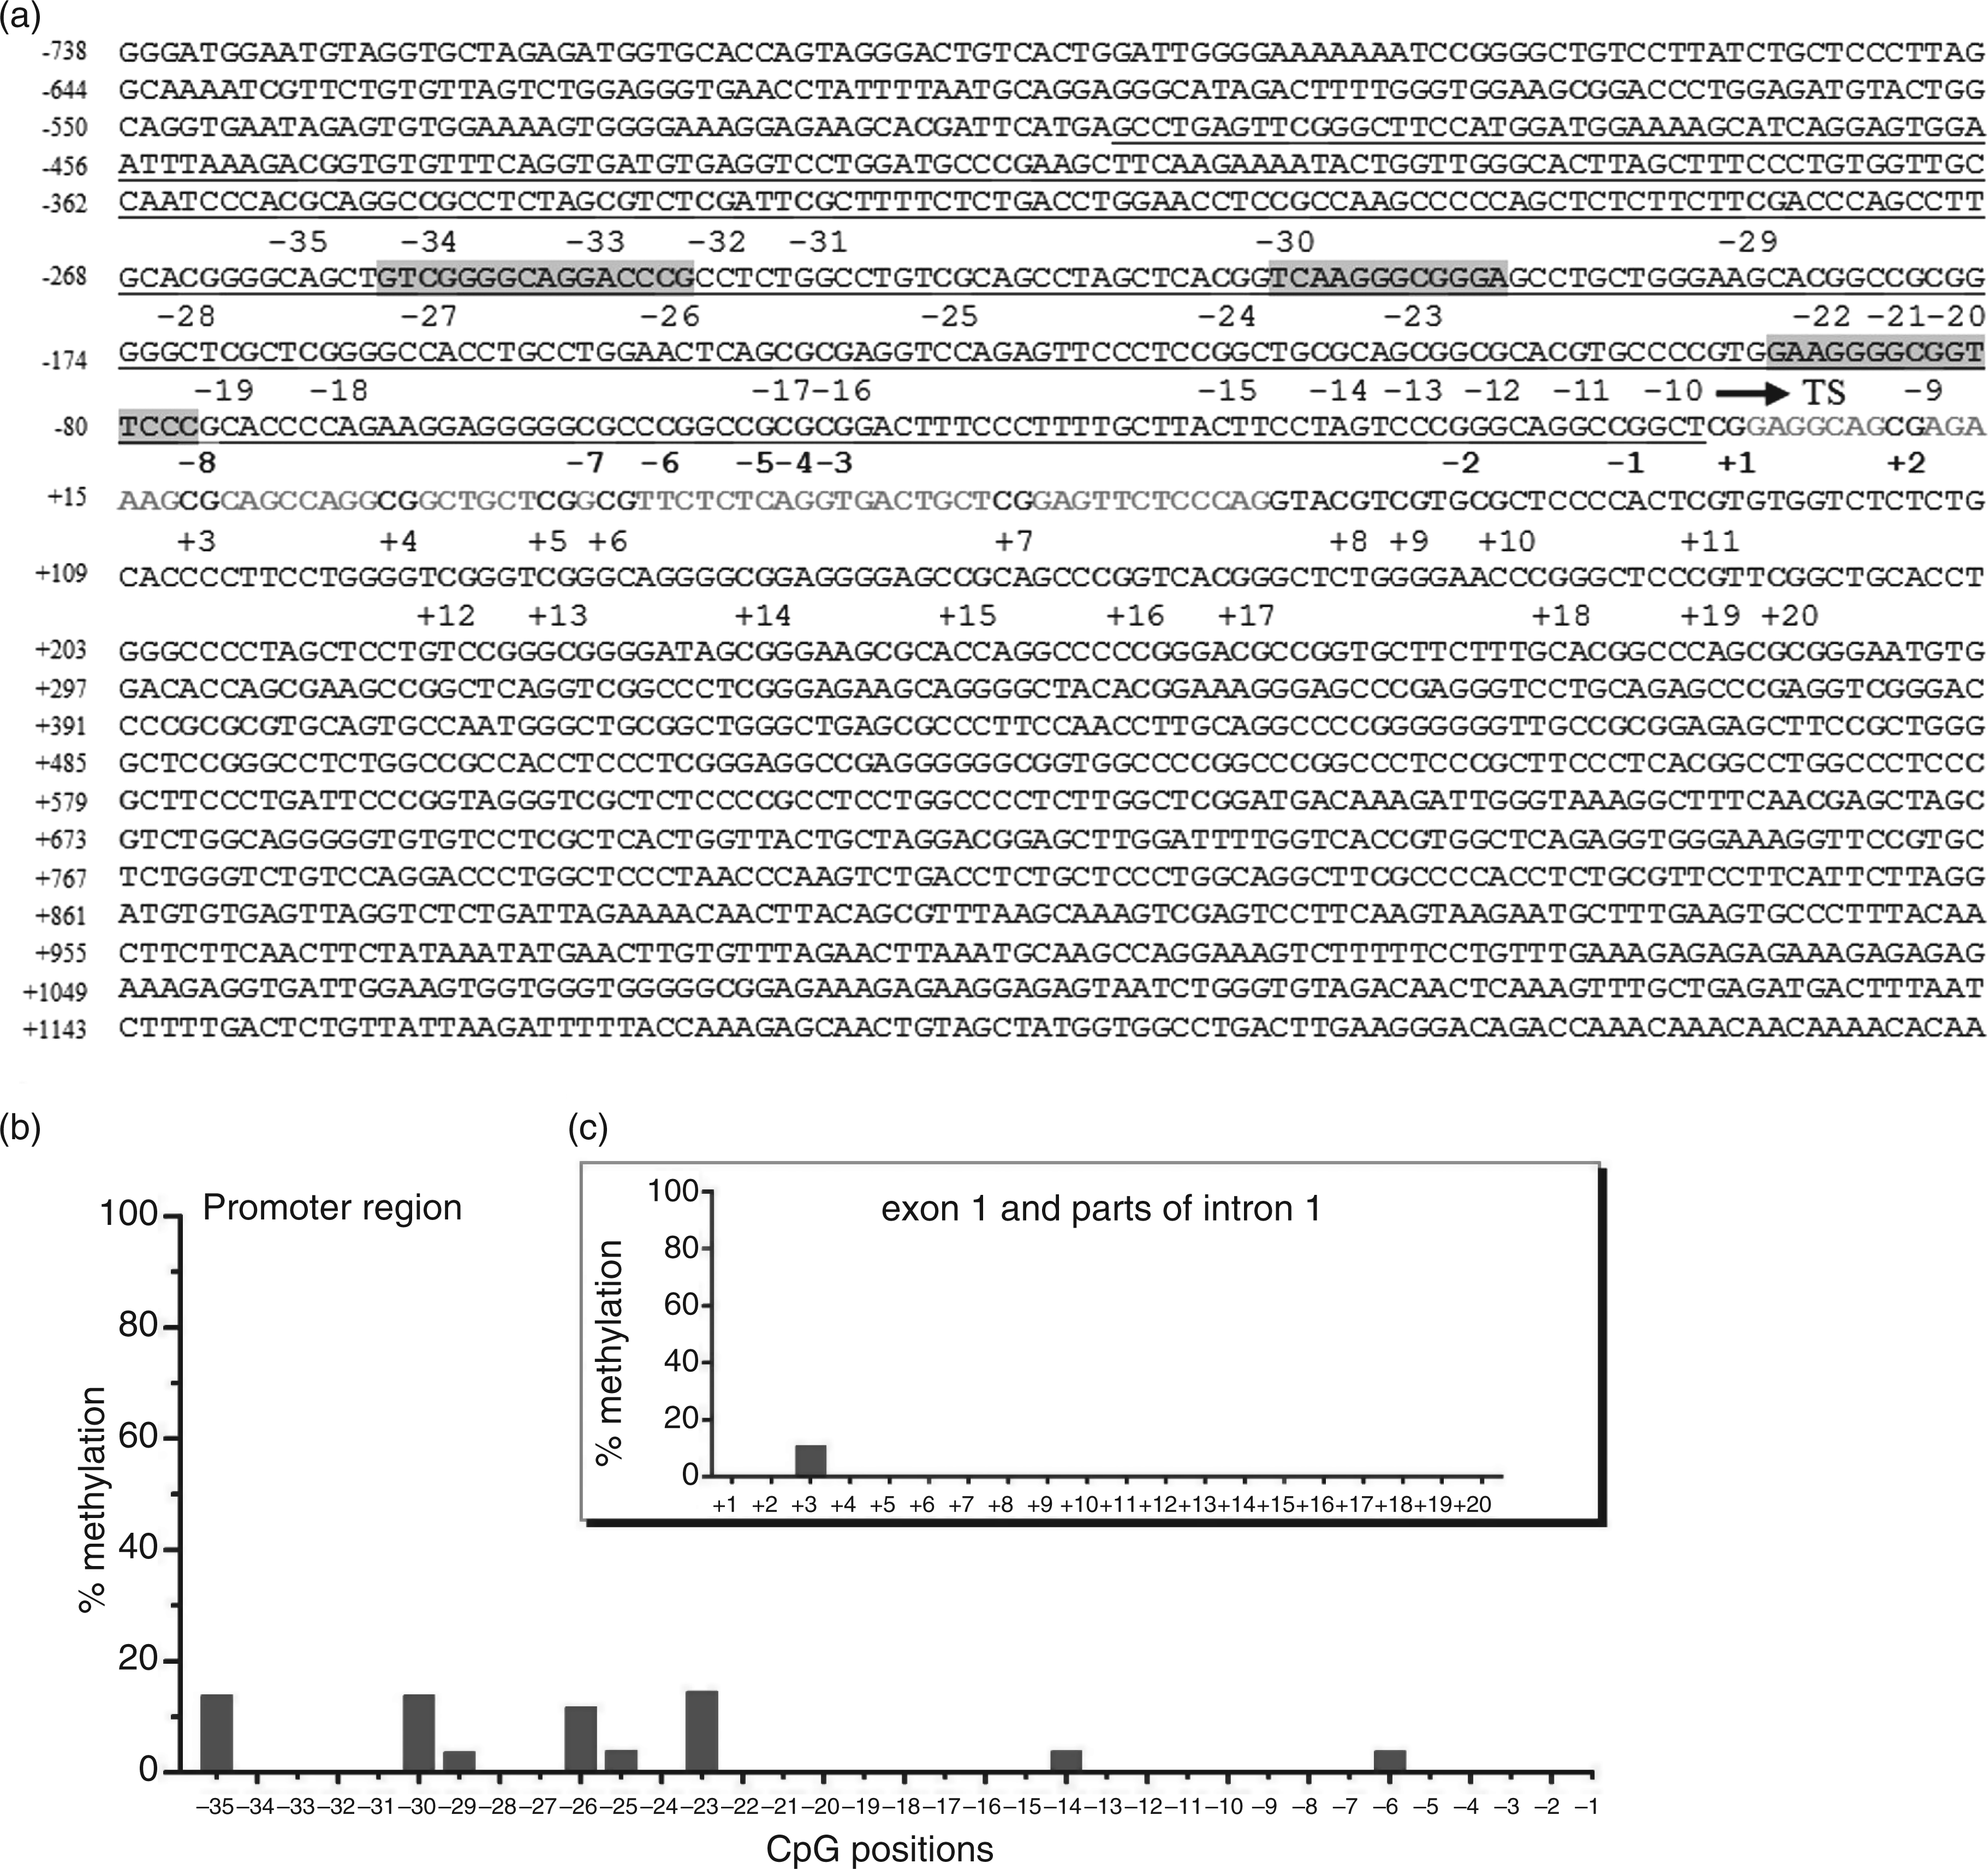
Single nucleotide primer extension analysis of TLR2 promoter methylated CpG positions and effects of TNF-α and 5-azacytidine
The SNuPE analysis allows a complete screening of PCR products for a single CpG position. Moreover, compared to the sequencing procedure, this method allows the exclusion of a cloning bias. Single nucleotide primer extension analyses of CpG positions were done for the two Sp1-connected sites −26 and −23 in cells from three different donors. Also two positions were analysed, which had shown no methylation in bisulfite sequencing reactions (−22 and −17) as a control for the SNuPE reaction.
In order to determine whether TNF-α induces a modulation of the TLR2 promoter methylation pattern, the same positions −26 and −23 were investigated in TNF-α-treated cells and also the demethylating agent 5-azacytidine was employed. Cells from three different donors were either left untreated or treated with TNF-α for 4 h, or 5-azacytidine for 48 h. The results showed very low methylation levels for the four examined CpG positions −26, −23, −22 and −17 (Figure 4 shows representative HPLC chromatograms for CpG position −26): the methylation rate was too low to be quantified. These observations indicate that the methylation rate of 10–15% as observed by sequencing was probably due to a cloning bias.
Single nucleotide primer extension assay used to determine the methylation state of the CpG position −26 in untreated, TNF-α-treated, and 5-azacytidine treated HUVECs. (a) Non-template control; (b) control reaction with only ddTTP representing the signal for an unmethylated cytosine; (c) control reaction with only ddCTP representing the signal for a methylated cytosine; (d) untreated cells; (e) 5-azacytidine treated cells; and (f) TNF-α treated cells. UE, unextended primer; M, methylated cytosine; UM, unmethylated cytosine. This experiment is representative of three independent analyses performed with cells from different donors.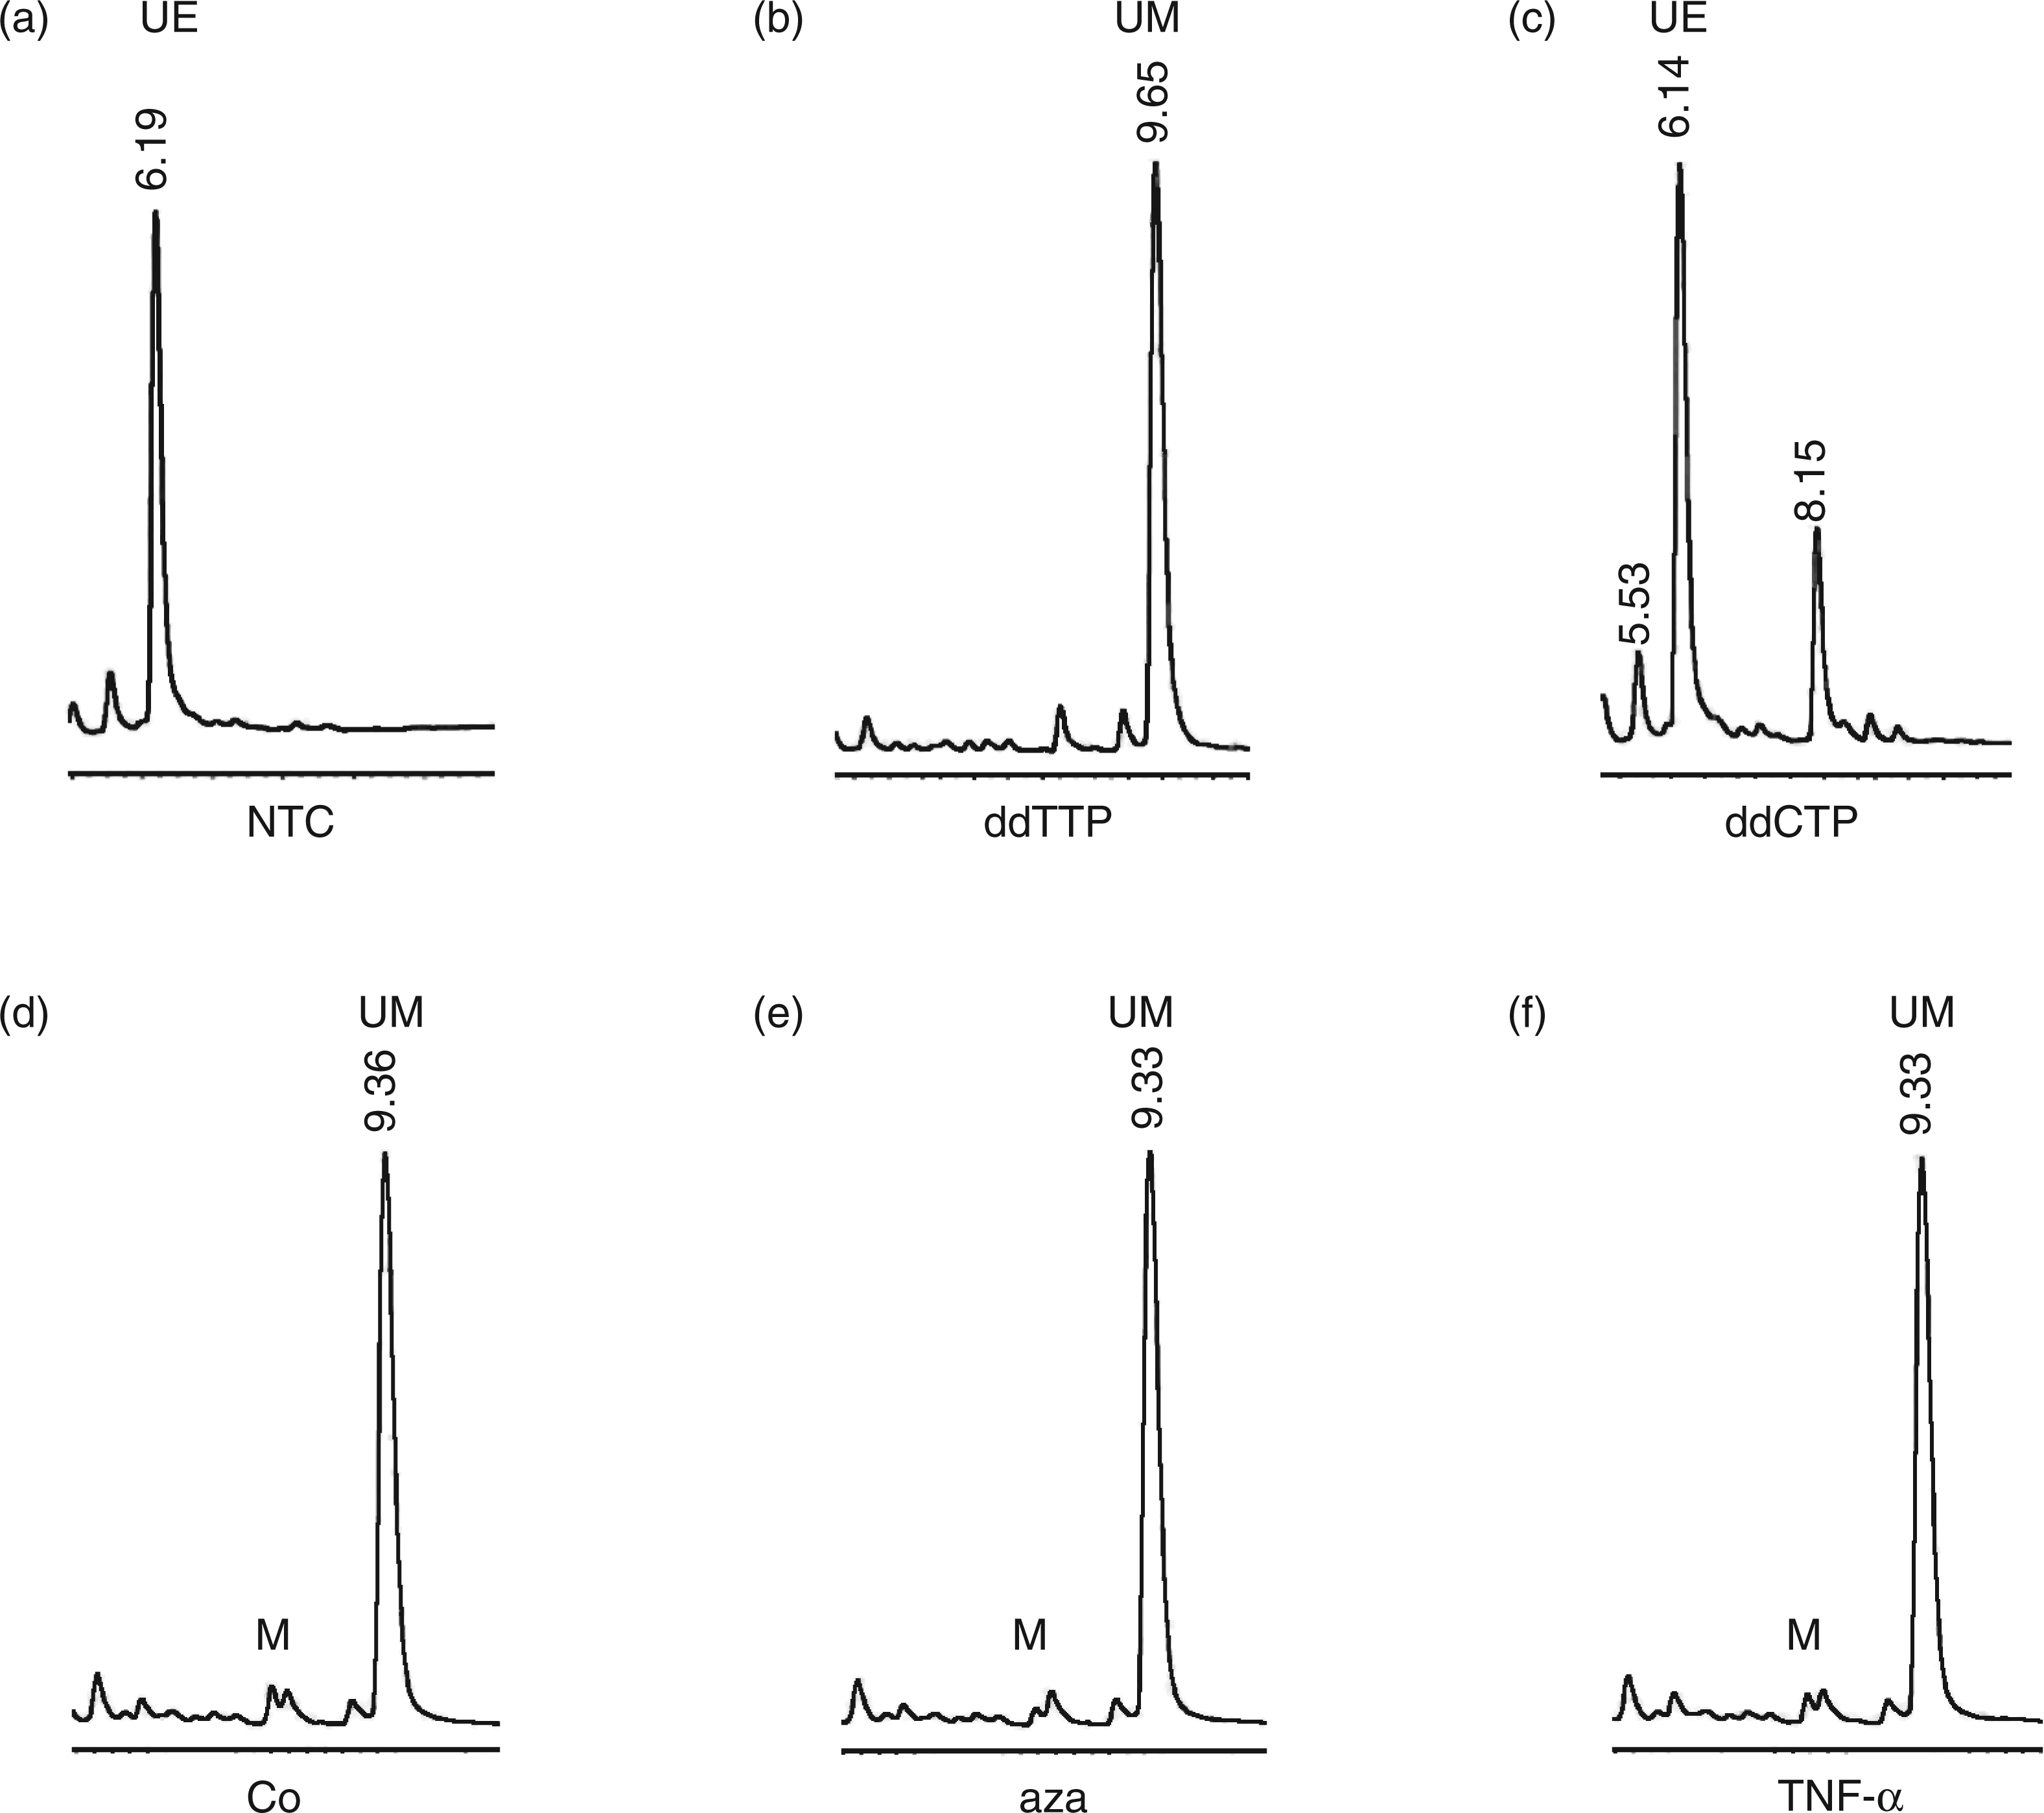
Impact of the DNA methyltransferase inhibitor 5-azacytidine on TLR2 expression
Both bisulfite sequencing as well as SNuPE analyses indicated a hypomethylation of the TLR2 promoter. In order to check the role of DNA (de-)methylation in TLR2 expression functionally, we investigated the effect of the DNA methyltransferase inhibitor 5-azacytidine on TLR2 mRNA expression in HUVECs using real-time RT-PCR. Consistently, our results indicated no significant change of TLR2 expression upon 5-azacytidine treatment in cells from seven different donors (Figure 5). As a control, we determined the effect of 5-azacytidine on the imprinted gene H19: the maternal allele of this gene is transcribed while the paternal is silenced by DNA methylation.
34
For this reason, a DNA methyltransferase inhibitor can induce the transcription of this gene.
17
In fact, the significant increase of H19 expression after 5-azacytidine treatment confirmed the successful DNA demethylation by 5-azacytidine in HUVECs. In parallel, the treatment of the epitheloid cell line HeLa, where a 100% methylation rate of the TLR2 promoter has been described,
19
resulted in a significant up-regulation of both TLR2 and H19 (Figure 5). Our approach was further validated by employing 16HBE14o- cells, for which Furuta and co-workers already have shown an elevated TLR2 expression after 5-azacytidine (Figure 5).
18
Effect of 5-azacytidine on TLR2 and H19 expression in HUVECs, epithelial HeLa, and 16HBE14o-cells. Cells were treated with 2 µ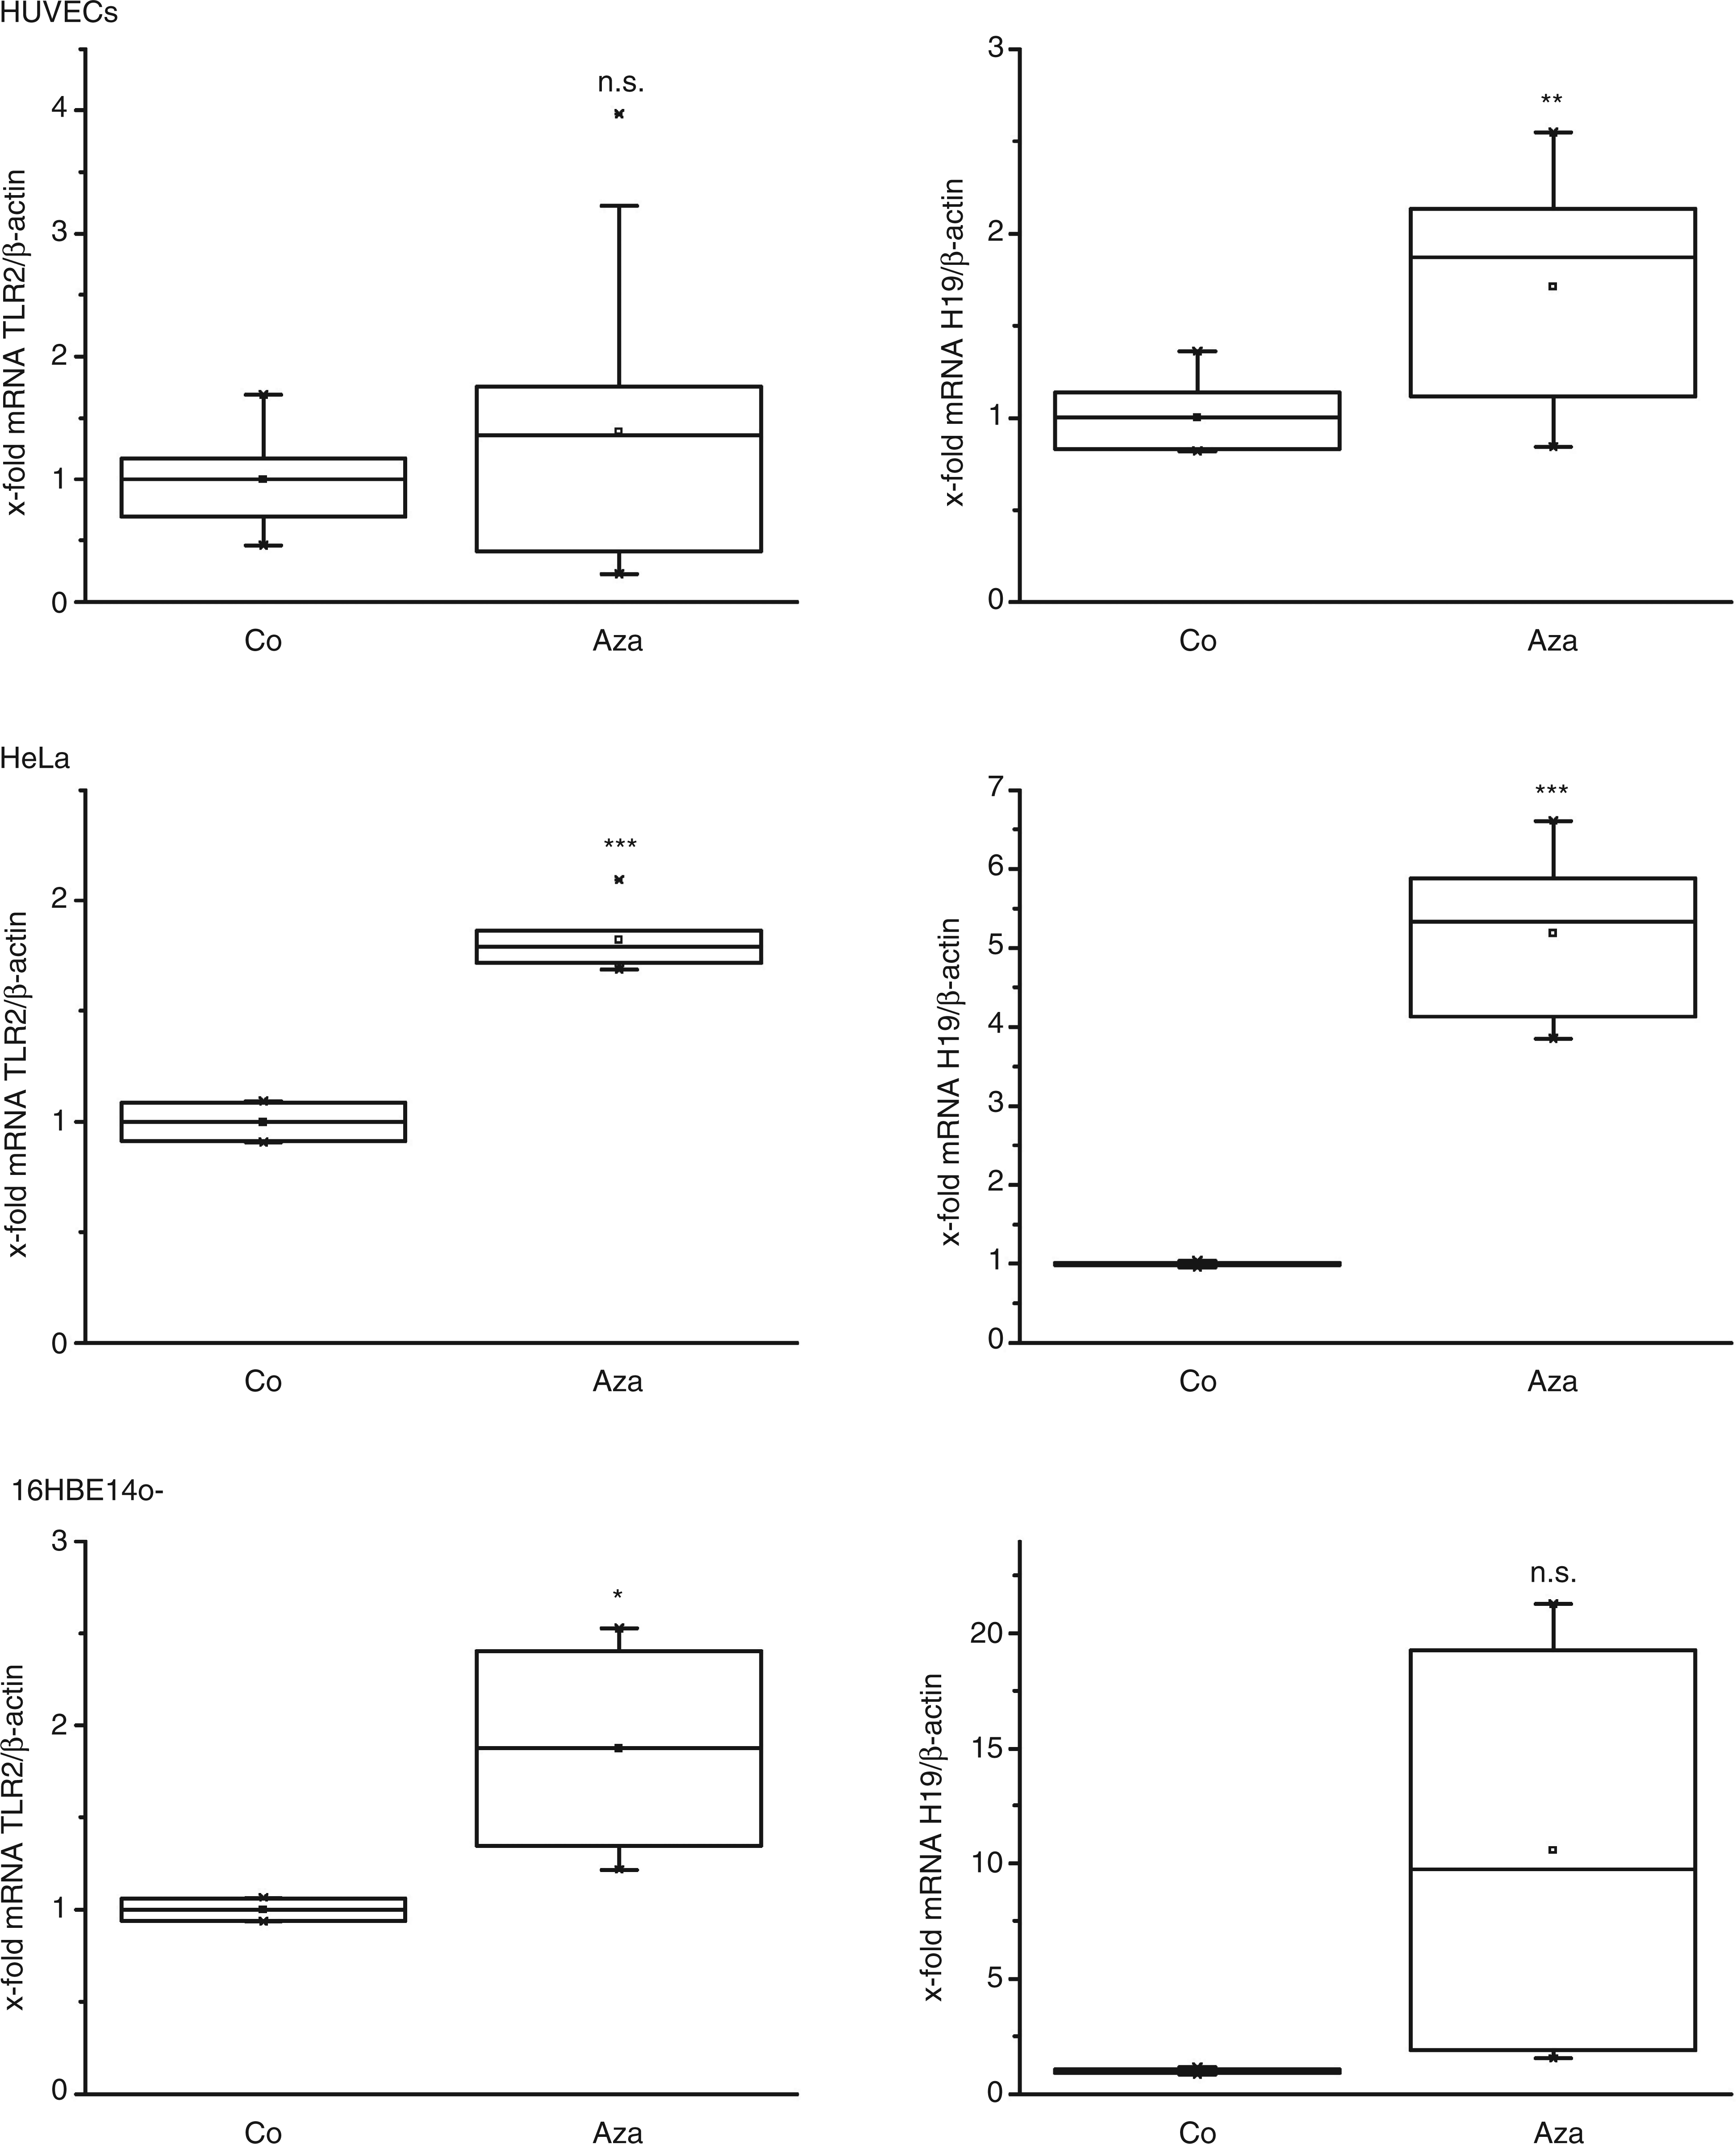
Role of Sp1 transcription factor in endothelial TNF-α-induced TLR2 expression
After examination of the 600 bp predicted TLR2 promoter region using genomatix software, we could distinguish three Sp1 binding sites (Figure 3). Sp1 is a ubiquitous transcription factor, which binds to GC box promoter elements. Binding of this protein to the TLR2 promoter was reported to be important in TLR2 gene expression in monocytic THP-1 cells.
19
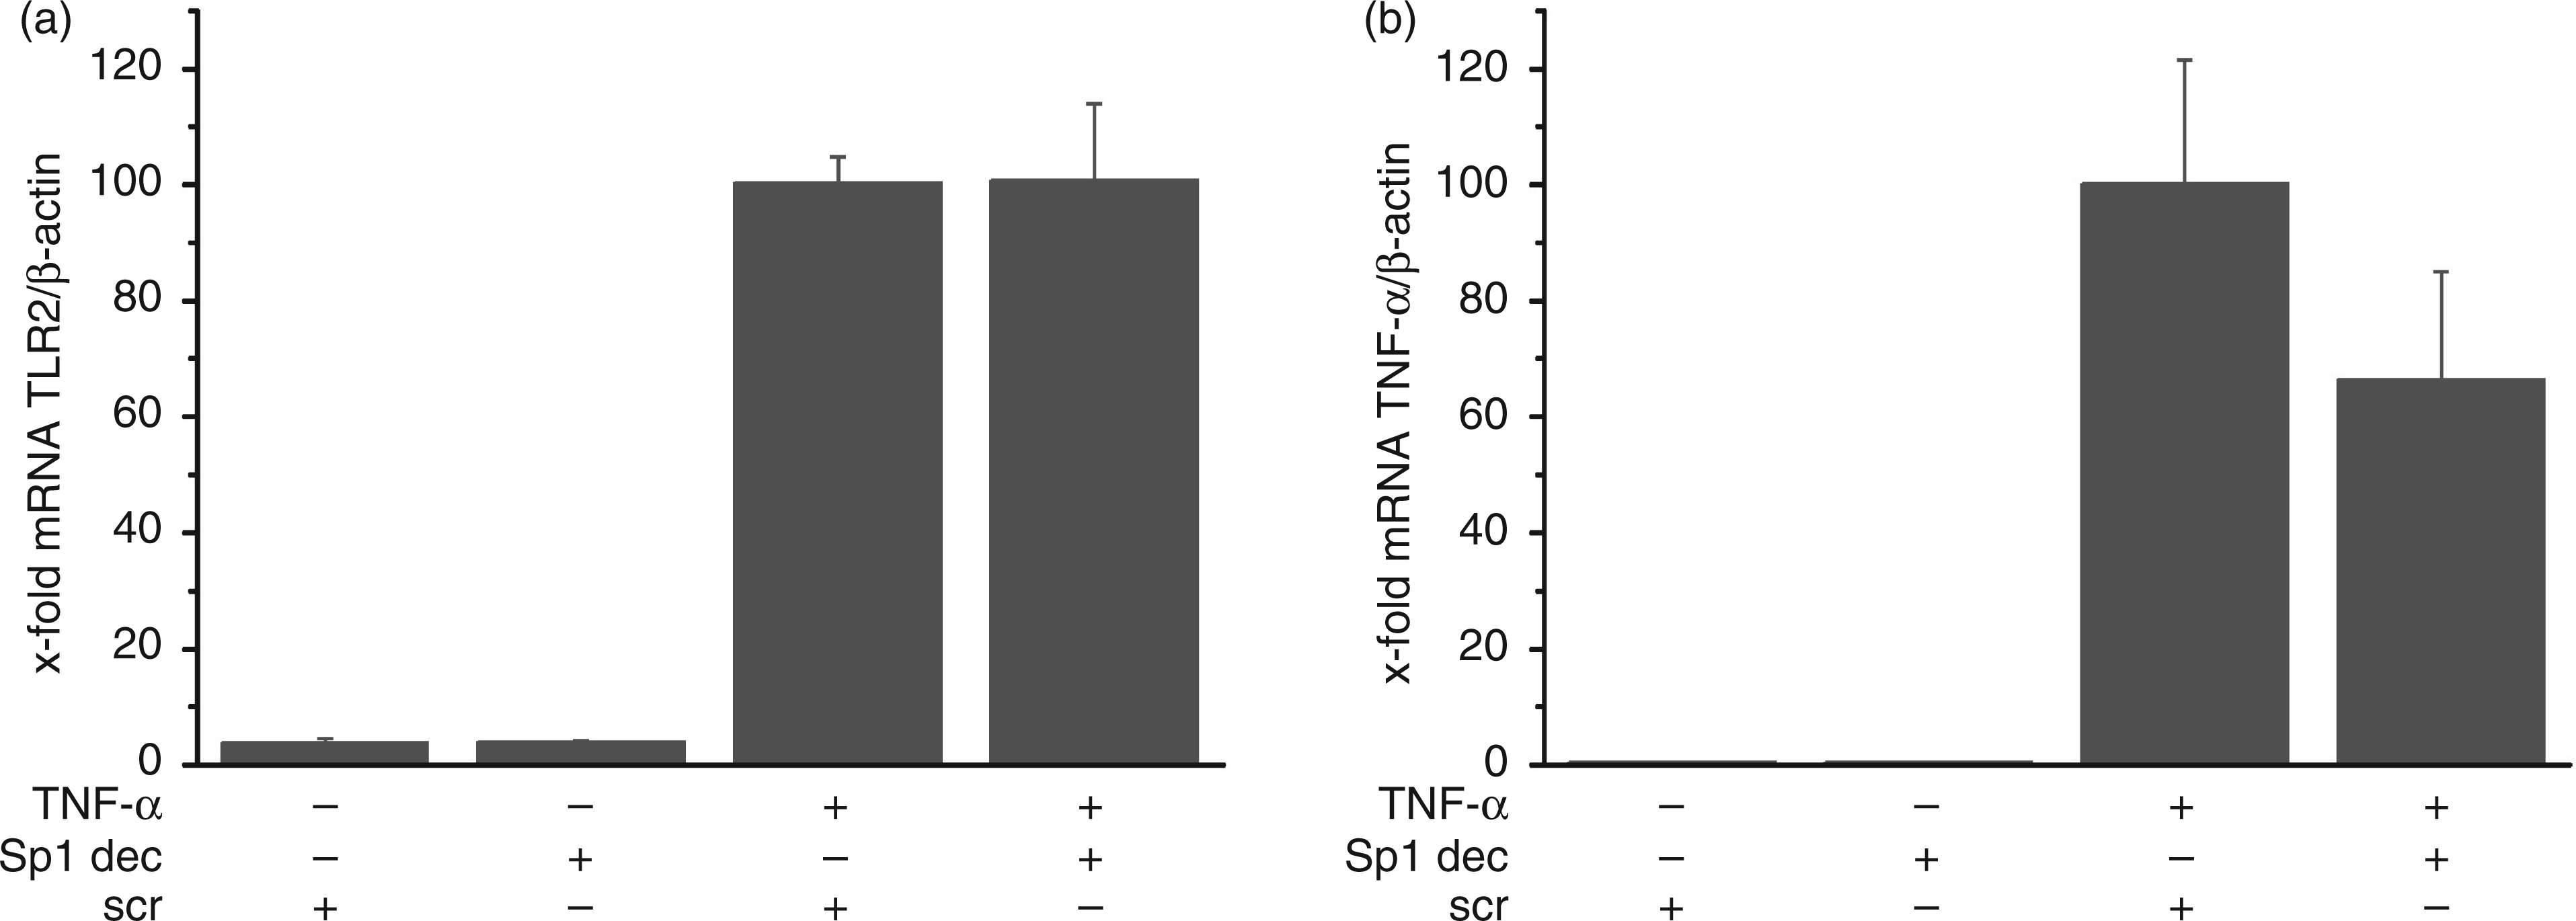
Since the methylation state of CpG dinucleotides within and close to Sp1 binding sites have been reported to be important for the binding of Sp1 to respective DNA promoter regions,18,35 we aimed to determine the role of Sp1 in the TNF-α-induced TLR2 expression by performing Sp1 decoy experiments. There was an increase of Sp1 binding activity in TNF-α stimulated HUVECs (Figure 6a), and supershift analyses confirmed specificity of the binding reaction (Figure 6b). Sp1 specific decoy oligonucleotides but not scrambled sequences inhibited Sp1 binding activity successfully under basal as well as TNF-α-induced conditions (Figure 6c). Quantifying TLR2 mRNA expression in Sp1 decoy-treated cells, our results suggest that this transcription factor is not involved in TNF-α-induced TLR2 expression (Figure 7a). In contrast, the up-regulation of the known Sp1 target gene TNF-α was diminished by Sp1-decoy treatment as described previously (Figure 7b).
36
Tumor necrosis factor-α-induced Sp1 activation and inhibition by Sp1 decoy oligonucleotides. (a) TNF-α induces nuclear Sp1 DNA-binding activity. (b) Sp1 shift (S) and supershift (SS) with HUVECs nuclear extract using Sp1 or p50 antibody. (c) Decrease of Sp1 DNA binding activity by treatment with Sp1 decoy oligonucleotides (Sp1 dec) but not by treatment with scrambled oligonucleotides (scr). Effect of Sp1 inhibition on TLR2 mRNA expression using Sp1 decoy oligonucleotides. Human umbilical vein ECs were exposed to Sp1 decoy (Sp1 dec) or scrambled (scr) oligonucleotides for 4 h and subsequently left untreated or treated for 4 h with TNF-α (10 ng/ml). The TLR2 mRNA (a) or TNF-α (b) levels were measured using real-time RT-PCR and normalized to β-actin mRNA level. Data are expressed relative to scrambled decoy-, TNF-α-treated cells and show mean ± SEM of five or three independent experiments performed in duplicate.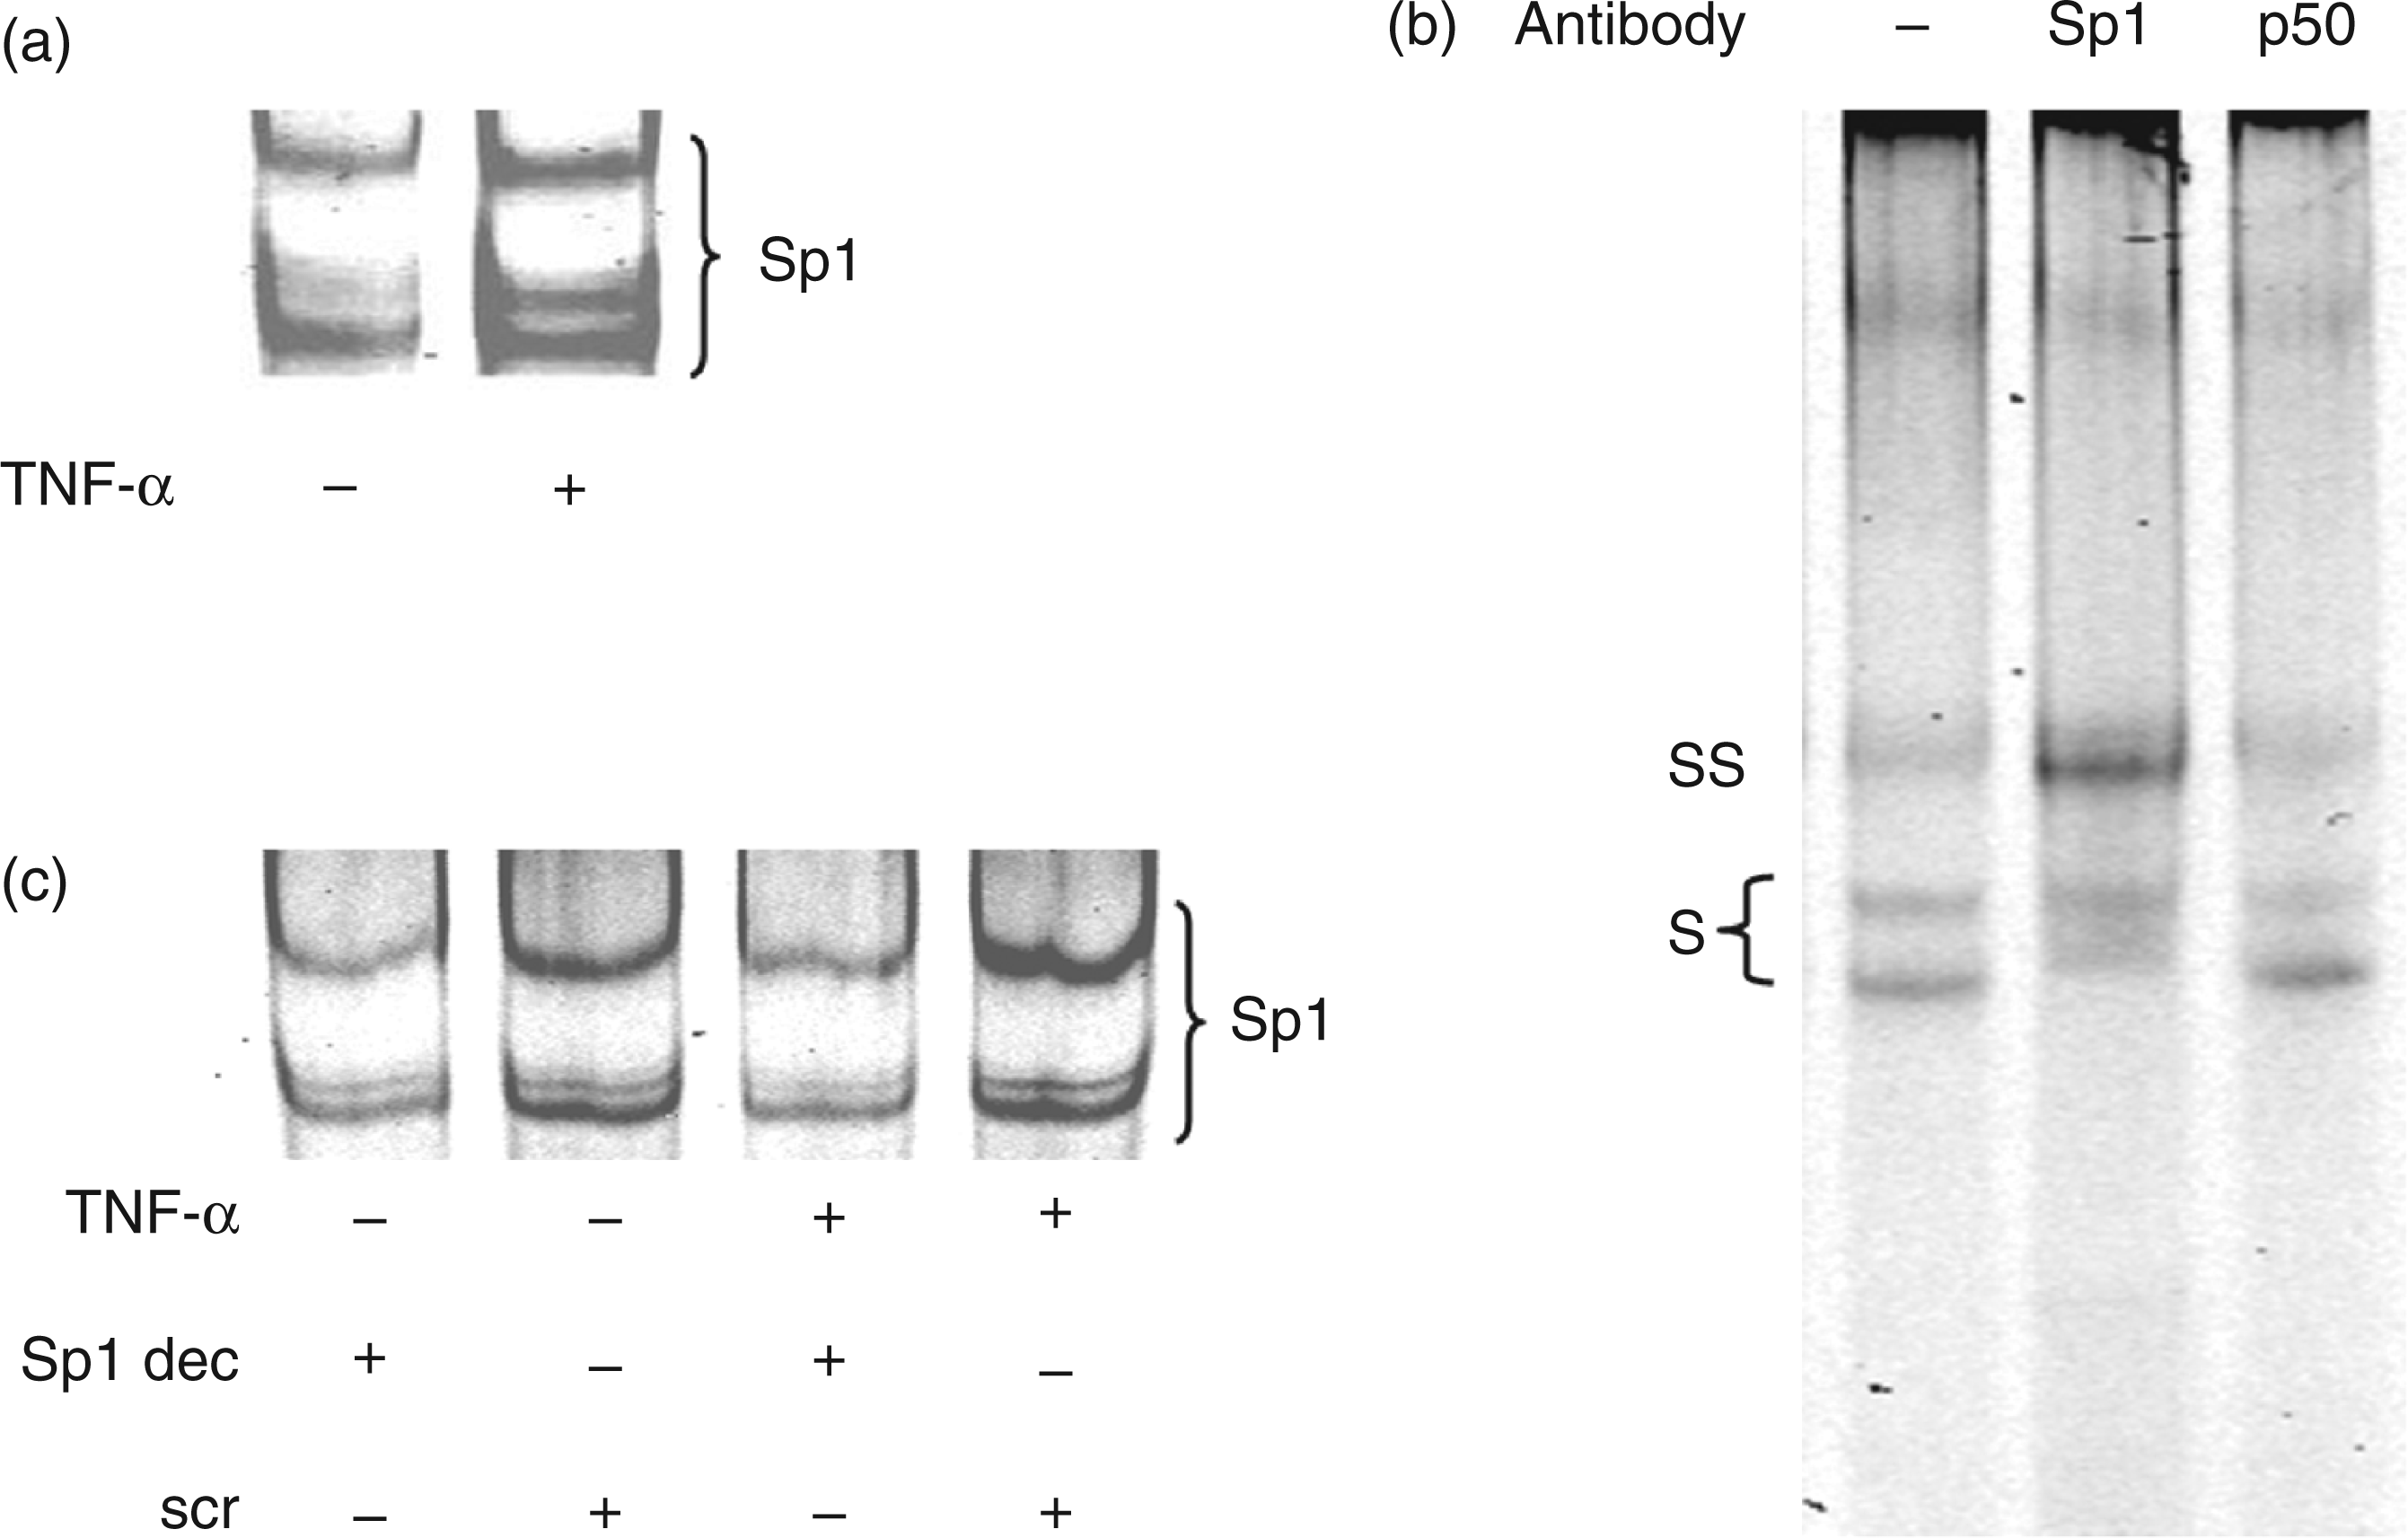
Discussion
Due to the important role of TLRs in atherosclerosis, 2 we aimed to clarify regulatory mechanisms of TLR2 mRNA expression in HUVECs, primary human cells that are frequently used for elucidation of inflammation-dependent signalling pathways. 32
A quantitative real-time RT-PCR analysis revealed a low TLR2 expression level whereas there was a much higher (56-fold) basal TLR4 transcript level. This confirms earlier reports done by various semiquantitative methods on very low basal TLR2 levels and a low responsiveness to TLR2 ligands, paralleled by a higher TLR4 expression in HUVECs.7,9,10,16 There was no evidence for a higher, constitutive expression of TLR2 in resting HUVECs, as determined before by conventional RT-PCR. 14 The concept of a basal low TLR2 expression in venous ECs contrasting with a higher basal TLR2 expression in arterial cells reflects the lower probability of developing atherosclerosis in venous cells compared to coronary arteries.7,12
In order to clarify the effect of different inflammatory conditions on TLR2 and TLR4 expression, we treated HUVECs with the pro-inflammatory cytokine TNF-α and the TLR4 agonist LPS. Expression of TLR2 was highly inducible by the inflammatory stimuli, i.e. these results are consistent with previous findings in HUVECs.10,15 Lipopolysaccharide also induces TLR2 expression in mouse lung vascular ECs. 37
Conflicting data are presented by Yang et al., 16 who reported no effect of LPS on TLR2 expression in HUVECs. This may be due to different culture conditions or source of LPS.
In contrast to TLR2, TLR4 expression seems not to be inducible to such a high extent in ECs. Whereas there exist reports on an inducibility of TLR4 by LPS in HUVECs,15,16 Satta et al. 10 reported no TLR4 induction, neither by TNF-α nor by LPS in HUVECs. Similar results on a low TLR4 inducibility were also reported for HCAECs, human microvascular ECs (HMECs) and primary human dermal microvascular ECs.6,11 Our findings support this lack of TLR4 inducibility in HUVECs: TLR4 expression was not influenced by its agonist LPS. There was even a significant down-regulation of TLR4 mRNA expression after TNF-α treatment. First hints on a fast TLR4 down-regulation have been described before after LPS treatment for murine microglial cells on the cell surface 38 and for human iris endothelial cells on mRNA level. 39
Due to the known role of TLR4 in atherosclerosis, one might be surprised that inflammatory cell activation either has no effect or down-regulates TLR4 mRNA expression. In this context, it should be mentioned that TLR4 expression in atherosclerosis seems to be localized in cell types other than ECs. Xu et al. 40 reported a hardly detectable TLR4 expression in normal human arteries and an enhanced TLR4 expression in macrophages of lipid-rich human plaques, suggesting that macrophages are the main players in TLR4-dependent atherosclerotic pathogenesis. Also Vink et al. 41 report human adventitial fibroblasts and macrophages as the main players in TLR4-dependent development of intimal lesions.
The regulation mechanisms of TLR4 expression seem to differ between primary ECs and endothelial cell lines: in contrast to HUVECs, there is an increased TLR4 mRNA expression after LPS challenge in a human microvascular endothelial cell line. 15 Also, other cell types exhibit differential regulatory mechanisms of TLR expression. In aortic smooth muscle cells, there is an increase of TLR4 expression after LPS challenge. 42 A lot of work has been done on TLR2 and TLR4 expression regulation in monocytes: in human monocytes, TLR4 can be induced by LPS and TNF-α and also TLR2 is induced upon LPS treatment.19,43– 45 Upon differentiation into macrophages, however, the extent of TLR2 inducibility seems to be lower than in monocytes.19,43,46,47 This is in contrast to murine monocytic cells, where there is an up-regulation of TLR2 but not TLR4 by LPS and TNF-α. 48 In fact, the promoters of mice and humans show no significant homology and TLR2 expression is regulated differently in human and murine cells. 19
Loss of methylation can be a mechanism for tissue-specific gene transcription in healthy human cells. 49 Epigenetic mechanisms are increasingly thought to also take an active part in inflammatory signalling. 50 It has also been demonstrated that the inflammatory factor TNF-α can reduce the promoter methylation level of a DNA promoter region of SPAK (Ste 20 like proline-/alanine-rich kinase) leading to enhanced gene transcription in intestinal cells. 22
The human TLR2 promoter is localized on a CpG island. 19 A study in bronchial epithelial cells in the context of cystic fibrosis demonstrated a direct relationship between elevated TLR2 expression and TLR2 promoter demethylation. 17 Furthermore, the methylation-sensitive transcription factor Sp1 is involved in TLR2 expression regulation in HCAECs, epithelial cells, and monocytic cells.11,18,19,51
Employing bisulfite sequencing, Haehnel et al. 19 reported differences in the methylation state of the TLR2 promoter region of primary cells and cell lines, with cell lines having in general a highly methylated TLR2 promoter, corresponding to a lower TLR2 expression. One exception is the endothelial cell line HMECs with only two methylated CpGs out of 20. Since no information exists on the methylation of the TLR2 promoter in primary ECs, we performed genomic bisulfite-sequencing analysis for HUVECs. We extended the region previously investigated in HMECs (−220 bp) on a 350 bp region 5′-upstream from the transcriptional start and additionally a downstream region, being also part of the CpG-island. Our analysis revealed a low methylation of this extended TLR2 promoter CpG-island in primary human endothelial cells (i.e. HUVECs). The overall methylation rate was 0.5–2% with only five positions out of 55 displaying a low, but detectable, methylation. Interestingly, position −26 was detected to be also methylated in the microvascular EC line HMECs by Haehnel et al., 19 where the position was numbered #2. In contrast, however, position #13, which has been reported to be methylated in the microvascular EC line in the same paper, did not show any methylation in our primary EC system (position #15). Furthermore, we determined an additional third putative Sp1 binding site in the TLR2 promoter covering the partly methylated CpG −26. Additionally to −26, also position −23 displayed a low, but detectable, methylation in HUVECs by bisulfite sequencing and it is localized on an Sp1 binding site.
Independent of the low general promoter methylation rate, a methylation of the Sp1 binding position may have an impact on transcriptional regulation.18,19 In order to verify methylation of these important positions and to examine the possibility that TNF-α may lead to a demethylation of these partially methylated positions, we determined their methylation state with the SNuPE method. We detected very low to non-quantifiable methylation rates in these four examined CpG-positions, both in untreated as well as in TNF-α treated cells. The lower methylation rate observed by SNuPE compared to bisulfite-sequencing results may be explained by a possible cloning bias during the bisulfite-sequencing procedure. 52 Consistent with methylation data, treatment of HUVECs with the DNA methyltransferase inhibitor 5-azacytidine did not increase TLR2 mRNA levels, whereas it increased the methylation-dependent expression of H19.28,34
Taken together, these results underline the different regulation of TLR2 in cells from different origins: in contrast to endothelial cells, Shuto et al. 17 determined a clear methylation-dependent expression of TLR2 in epithelial cells. Also in epithelial cells, the transcriptional activity of Sp1 was shown to be determined by the methylation state of its DNA binding site in the TLR2 promoter. 18 This is confirmed by our own experiments showing that 5-azacytidine treatment results in an up-regulation of TLR2 in 16HBE14o- cells confirming data from the literature as well as in the human epitheloid cell line HeLa. The latter cell line has been shown before to have a highly methylated TLR2 promoter and no detectable TLR2 mRNA. 19 In monocytic cells, harbouring an unmethylated TLR2 promoter, Sp1 has been shown to be critical for TLR2 mRNA expression. 19 Sp1 is suggested to also influence flow-dependent TLR2 expression in HCAECs, 11 but there is no information on TLR2 promoter methylation in this cell type. Contrarily to monocytic cells, we observed in HUVECs a TNF-α-induced increase of Sp1 binding activity that is not dependent on promoter demethylation. This increase has no functional relevance on TLR2 expression as we show by Sp1 decoy experiments.
Conclusions
We determined a hypomethylated TLR2 promoter region in HUVECs, indicating that the low basal TLR2 expression is not due to a promoter hypermethylation. Consistently, an active demethylation of the TLR2 promoter after inflammatory stimulation is not involved in the high inducibility of TLR2 in endothelial cells. Still, other epigenetic regulatory mechanisms are possible. Toll-like receptor 2 expression might still be regulated by DNA methylation in CpG-rich regions elsewhere in the gene body 53 or by histone modifications. 49 Additionally other transcription factors, most importantly NF-κB, seem to be the main players of inflammation-dependent enhancement of TLR2 expression.
Footnotes
Funding
This work was supported by the Deutsche Forschungsgemeinschaft (DFG, KI 702/10-1) and the Deutsche Krebshilfe (#107751).