
Abstract
Background:
The English National Health Service (NHS) is a publicly funded system, however significant disparities in provision exist. Whereas the national picture of the distribution of Intensive Care Unit (ICU) beds has increased over time, less is understood about the regional variation in the rate of growth in ICU services and whether this is related to population growth. The aim of this study was to describe the national variation in the supply of ICU beds in England and evaluate whether there has been a narrowing of the regional disparities in providing ICU beds over time.
Methods:
Population-based panel analysis of ICU bed supply over a 10-year period, 2012–2021. Data were obtained from publicly available national resources. Descriptive analyses were summarised and trends examined. Disparity gap of ICU beds were calculated for each region. A fixed-effect panel data regression model was used to see the effect of unobserved variables on ICU bed supply for a particular region compared to the country average. Sub-group analysis was done for those 65 years and over.
Results:
Overall, ICU beds increased by 9.9%, resulting in a 2.2% increase in ICU beds per 100k population and a decrease by 5.1% in those aged 65 years and over. Between regions, ICU beds per capita varied over time, with a decrease in the South East but an increase in all other regions. In the population aged 65 years and over, the variation of a decrease in ICU beds was more pronounced, with the largest impact in the South East. To increase regional ICU bed capacity to the same as London, which was the region with the highest per capita, for total population, an uplift of 29% to 109% of ICU beds is required and 104% to 246% in those 65 years and over. The unobserved variables have the highest positive impact in ICU bed supply in London and the highest negative impact in the Midlands.
Conclusion:
ICU bed supply showed significant regional variations across England. We did not identify any significant narrowing of the regional disparities in provision of ICU beds over time. Further research should focus on better understanding the policy framework that underlies the regional supply of healthcare.
Keywords
Introduction
As a universal healthcare system, the principles of the English National Health Service (NHS) are to ensure a comprehensive service is available to all individuals that is based on clinical need, 1 with a key priority of ensuring everyone can access services equitably. 2 Unequal access creates inefficiencies in the supply of healthcare, where patients have unmet need in some regions and oversupply in others, which is difficult to discern from aggregated data.
England is one of the most regionally unequal countries amongst the world’s high-income countries in terms of GDP per capita, productivity and disposable income. 3 Regional disparities of, and access to, health and care services in England have previously been reported. Cross sectional studies have been conducted to examine the narrowing of the disparity gap in the supply of health resources. These studies have focused on community services and outpatient services.4 –6 We add to this literature by focusing on inpatient care, more specifically on intensive care unit (ICU) services which provide life-supporting treatment and require time critical access. With the general population projected to grow in England by 3.5% between 2020 and 2030, 7 along with the prevalence of diseases and comorbidities increasing with age and longer life expectancies, the demand on existing and future ICU services is expected to rise.8 –12 In response to the coronavirus disease 19 (COVID-19) pandemic, a rapid expansion in ICU bed capacity was needed both in absolute numbers as well as per capita, highlighting the importance of having equitable provision of these services. 13
Variability in ICU beds per capita internationally
ICU bed supply is an important determinant of utilisation and can be used as a proxy for the supply of ICU services in general. Whilst the international variation in ICU bed supply has been previously described,14 –18 the literature on within country regional variation is sparse. Much of this literature is focused on North America.19 –21 Wallace et al., 20 analysing the geographical distribution and growth of ICU beds in the USA concluded that national trends in changes to regional ICU bed supply did not correlate with population growth. A national cross-sectional study in Canada, found ICU bed supply to range between 6 and 19 beds per 100,000 population. 22 Within China, an evaluation of ICU bed supply and population trends over 15 years also identified significant regional differences in the distribution of ICU beds. 23 These studies were done in health systems where infrastructure decisions are taken by state, territorial, provincial health authorities or private providers. In contrast the English NHS is centrally commissioned by a single payer.
In the last decade, the total number of ICU beds in England has grown by 4.6% (174 beds), 24 however the regional variation in growth is unclear. Given the paucity of information, a careful analysis of ICU bed supply, its change over time and regional variations in these trends may provide insight into the equality of resource distribution.
The objective of this study is to describe, over a 10-year period of significant financial pressure to the NHS, the regional differences in the distribution of ICU beds per capita in England and whether the gap in disparity of providing ICU beds has narrowed over time.
Materials and methods
Study design and setting
This was a panel data analysis looking at adult ICU bed supply in all NHS acute care providers in England, between 2012 and 2021. NHS acute care providers are government funded hospitals, which provide secondary/tertiary health services within the English NHS. Currently there are 210 NHS acute care providers in England 25 and all were included. Beds from the following areas were excluded from data collection: private healthcare providers, specific hospital beds for maternity service, mental illness and learning disability, neonatal and paediatric ICU beds.
The population of interest was adults over 18 years of age. Data were collected for population estimates and ICU beds at both national and regional level.
Data sources
Both population data and ICU bed supply information are publicly available national resources. Population estimates were obtained from the Office for National Statistics, which were split into age groups. 26 Available data were divided into nine regions for England. Since administrative boundaries were different to the NHS England (NHSE) regions, the population estimates were aggregated and mapped to the seven NHSE regions, as geographical units for analysis (see Figure 1). The time point used for each year was the mid-year point of 30th June as per the data available through the Office for National Statistics.

The seven NHS England healthcare regions.
All hospital bed data were obtained from the statistics publications provided by NHSE 27 which collect data on behalf of all acute care providers. Data are collected monthly from all NHS organisations for ICU beds. ICU beds were defined as all beds for critically ill patients in an ICU or High Dependency Unit (HDU) setting providing level 2 or level 3 care. Full definitions are shown in the online Supplementary File. Data were aggregated and divided into the seven NHSE regions. Where available data were split into different geographical areas compared to the defined seven NHSE regions, these were aggregated either by hospital level or area level and mapped accordingly in order for data to be comparative. For more details, see online Supplementary File, Mapping Process of Data Sources.
To standardise data, the time point used each year for ICU bed numbers was the last Thursday of June (for 2012–2019) or the average ICU beds in June (for 2020–2021), as NHSE changed the method for calculating ICU bed numbers after 2019. The month of June was used as it is a similar time point to when population estimates were published, which was annually on 30th June. ICU beds supply data were linked to the population census estimates for their corresponding year.
Data collection
The primary dependent variable was number of ICU beds by region by year. For hospital beds, counts were obtained for total hospital beds and adult ICU beds available. The independent variable was population estimates. Using population census data, population estimate counts were obtained for all persons over 18 years and for a subgroup of 65 years and over.
Data analysis
Descriptive analysis
Descriptive analyses of bed supply and population groups were summarised, and trends examined nationally and by the seven NHSE regions. A summary of total hospital beds, ICU beds, total adult population, population aged 65 years and over was tabulated. Standardising hospital beds and ICU beds per 100,000 (100k) adult population and population aged 65 years and over were used for comparison. Descriptions were in counts, percentages and proportions as appropriate.
Graphical representation using line plots was used to show the annual direction and magnitude of change in ICU beds over time. In addition, ICU bed counts by region and for the different population groups were also produced.
Descriptive summaries using violin plots were generated and reported to show the median, range and interquartile range for ICU beds and ICU beds per 100k population and population aged 65 years and over by year and region.
In order to describe the disparity gap, the region with the highest number of beds per capita was used as the reference. For each remaining region, the number of additional beds required to reach an equivalent per capita supply was calculated for the total adult population. This was repeated for the sub-population aged 65 years and over, in order to determine whether disparities in bed supply are present when the significantly higher use of ICU bed by older people is taken into account.28,29
Statistical analysis
A fixed effect regression model over the 10-year period was used to calculate the average ‘regional’ fixed effect statistic for each region to see its effect on the ICU bed supply for that region compared to the average for the country. This model takes into account independent variables which may be unobserved (either cannot be measured or are omitted) that vary across regions with the assumption that they are constant over time within a region, for example, demography and local demand characteristics; as well as those independent variables that are applied to all regions at the same time, for example, clinical practice trends or technology innovations. These are known as ‘regional’ and ‘time’ fixed effects respectively. For more details, see online Supplementary File, Statistical Methods.
Subgroup analysis
Age is also a factor in determining the requirement for ICU beds. The 65 years old and over population is an age group with proportionally higher usage of ICU services28,29 as they have greater vulnerability to acute stress and represent a large proportion of hospitalised patients accessing emergency care. They are also 13 times more likely to be hospitalised with sepsis than those younger than 65. 30 We therefore considered to review the ICU bed supply per capita for those aged 65 years and over.
The data management and analyses were conducted using Stata, version 17.0 (StataCorp, College Station, TX) and Microsoft Excel, Version 2309.
This study was deemed exempt from requiring ethics approval by the London School of Economics and Political Science Ethics Committee, Ref: 224386, 31st May 2023. The report of our findings is based on the REporting of studies Conducted using Observational Routinely collected Data (RECORD) statement. 31
Results
National
The characteristics of bed supply and population groups nationally are shown in Table 1. From 2012 to 2021, the number of ICU beds increased by 368 (9.9%), with a net decrease of 7426 (6.8%) in total hospital beds. The proportion of hospital beds categorised as ICU beds increased by 17.6% across the time period. Online Supplementary File, Figure S1 shows the trends in ICU beds.
England hospital beds, ICU beds and population between 2012 and 2021.
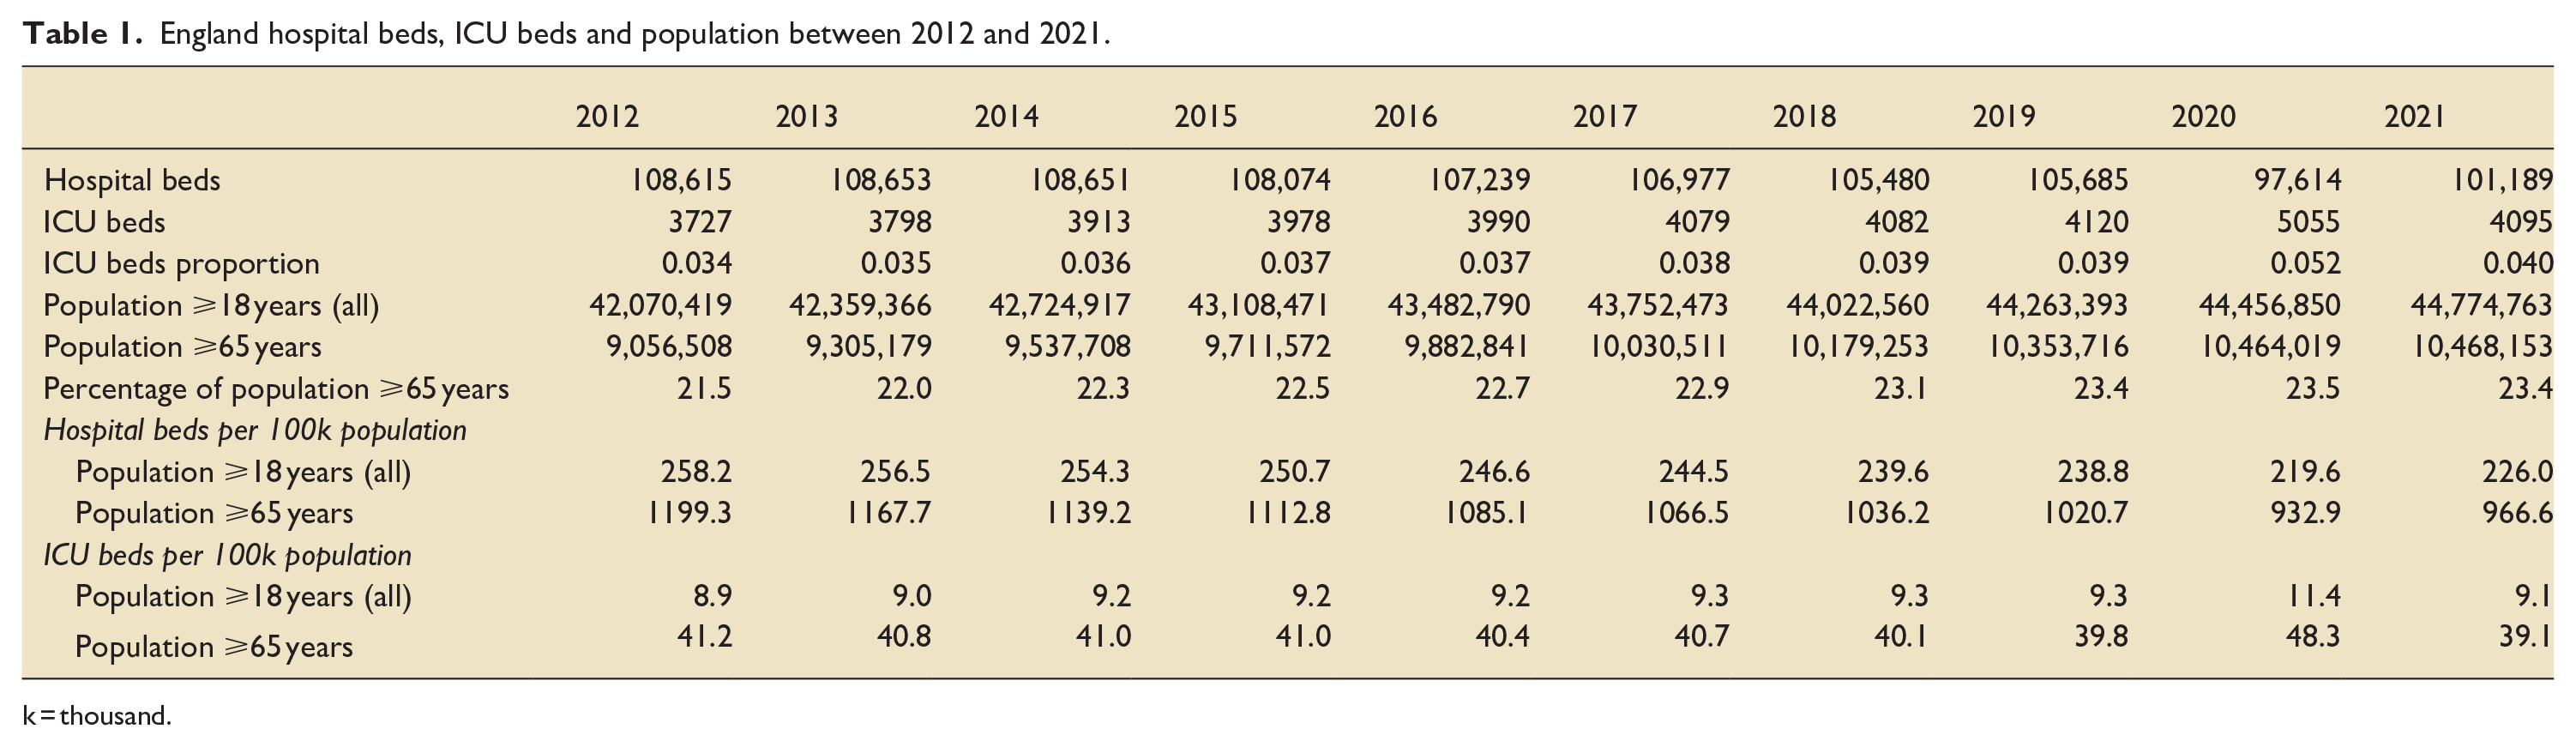
k = thousand.
In 2012, the adult population of England was just over 42 million people, giving 8.9 ICU beds per 100k population. By 2021, the adult population had increased by 6.4%. With the changes to ICU bed supply, this resulted in an increase to 9.1 ICU beds per 100k population (2.2% increase). See online Supplementary File, Figure S2. In contrast, in 2012, the adult population aged 65 years and over was approximately 9 million, giving 41.2 ICU beds per 100k population for this group. By 2021, this cohort increased by 15.6% but ICU beds per 100k population decreased to 39.1, a 5.1% reduction (see Table 1).
The summary statistics for ICU beds by year can be seen in the online Supplementary File, Figure S3. The median number of ICU beds across the seven regions ranged between 532 and 719 beds, with a peak of 1172 beds in 2020. Data available in the online Supplementary File, Table S1.
The summary statistics for ICU beds per 100k total population and per 100k population for those aged 65 years and over for each year can be seen in the online Supplementary File, Figures S4 and S5. The median number of ICU beds per 100k population remained relatively constant at 8 beds. There was more variation in the median number of ICU beds per 100k population aged 65 years and over, ranging from 33 to 36 beds. Data available in the online Supplementary File, Table S2 (A and B).
Regional
The characteristics of bed supply and population groups in each of the seven regions for the same 10-year period are shown in the online Supplementary File, Table S3. East of England was the only region with an increase in hospital beds (188 beds, 1.8%). All other regions saw a decrease in hospital bed numbers. Between regions there was a wide variation in the changes to the ICU bed count. Whereas ICU beds increased in all regions, London saw the highest count increase by a total of 91 beds (10.9% increase), responsible for about 25% of all the additional ICU beds in England. ICU bed numbers elsewhere increased between 10 beds (2.6%) in the South East to 87 beds (14.3%) in the Midlands. See online Supplementary File, Figure S6 for the regional trends in ICU bed count. Table 2 compares the hospital beds and ICU beds in the regions at the beginning and end of the study period.
Comparison of the hospital beds and ICU beds between regions.
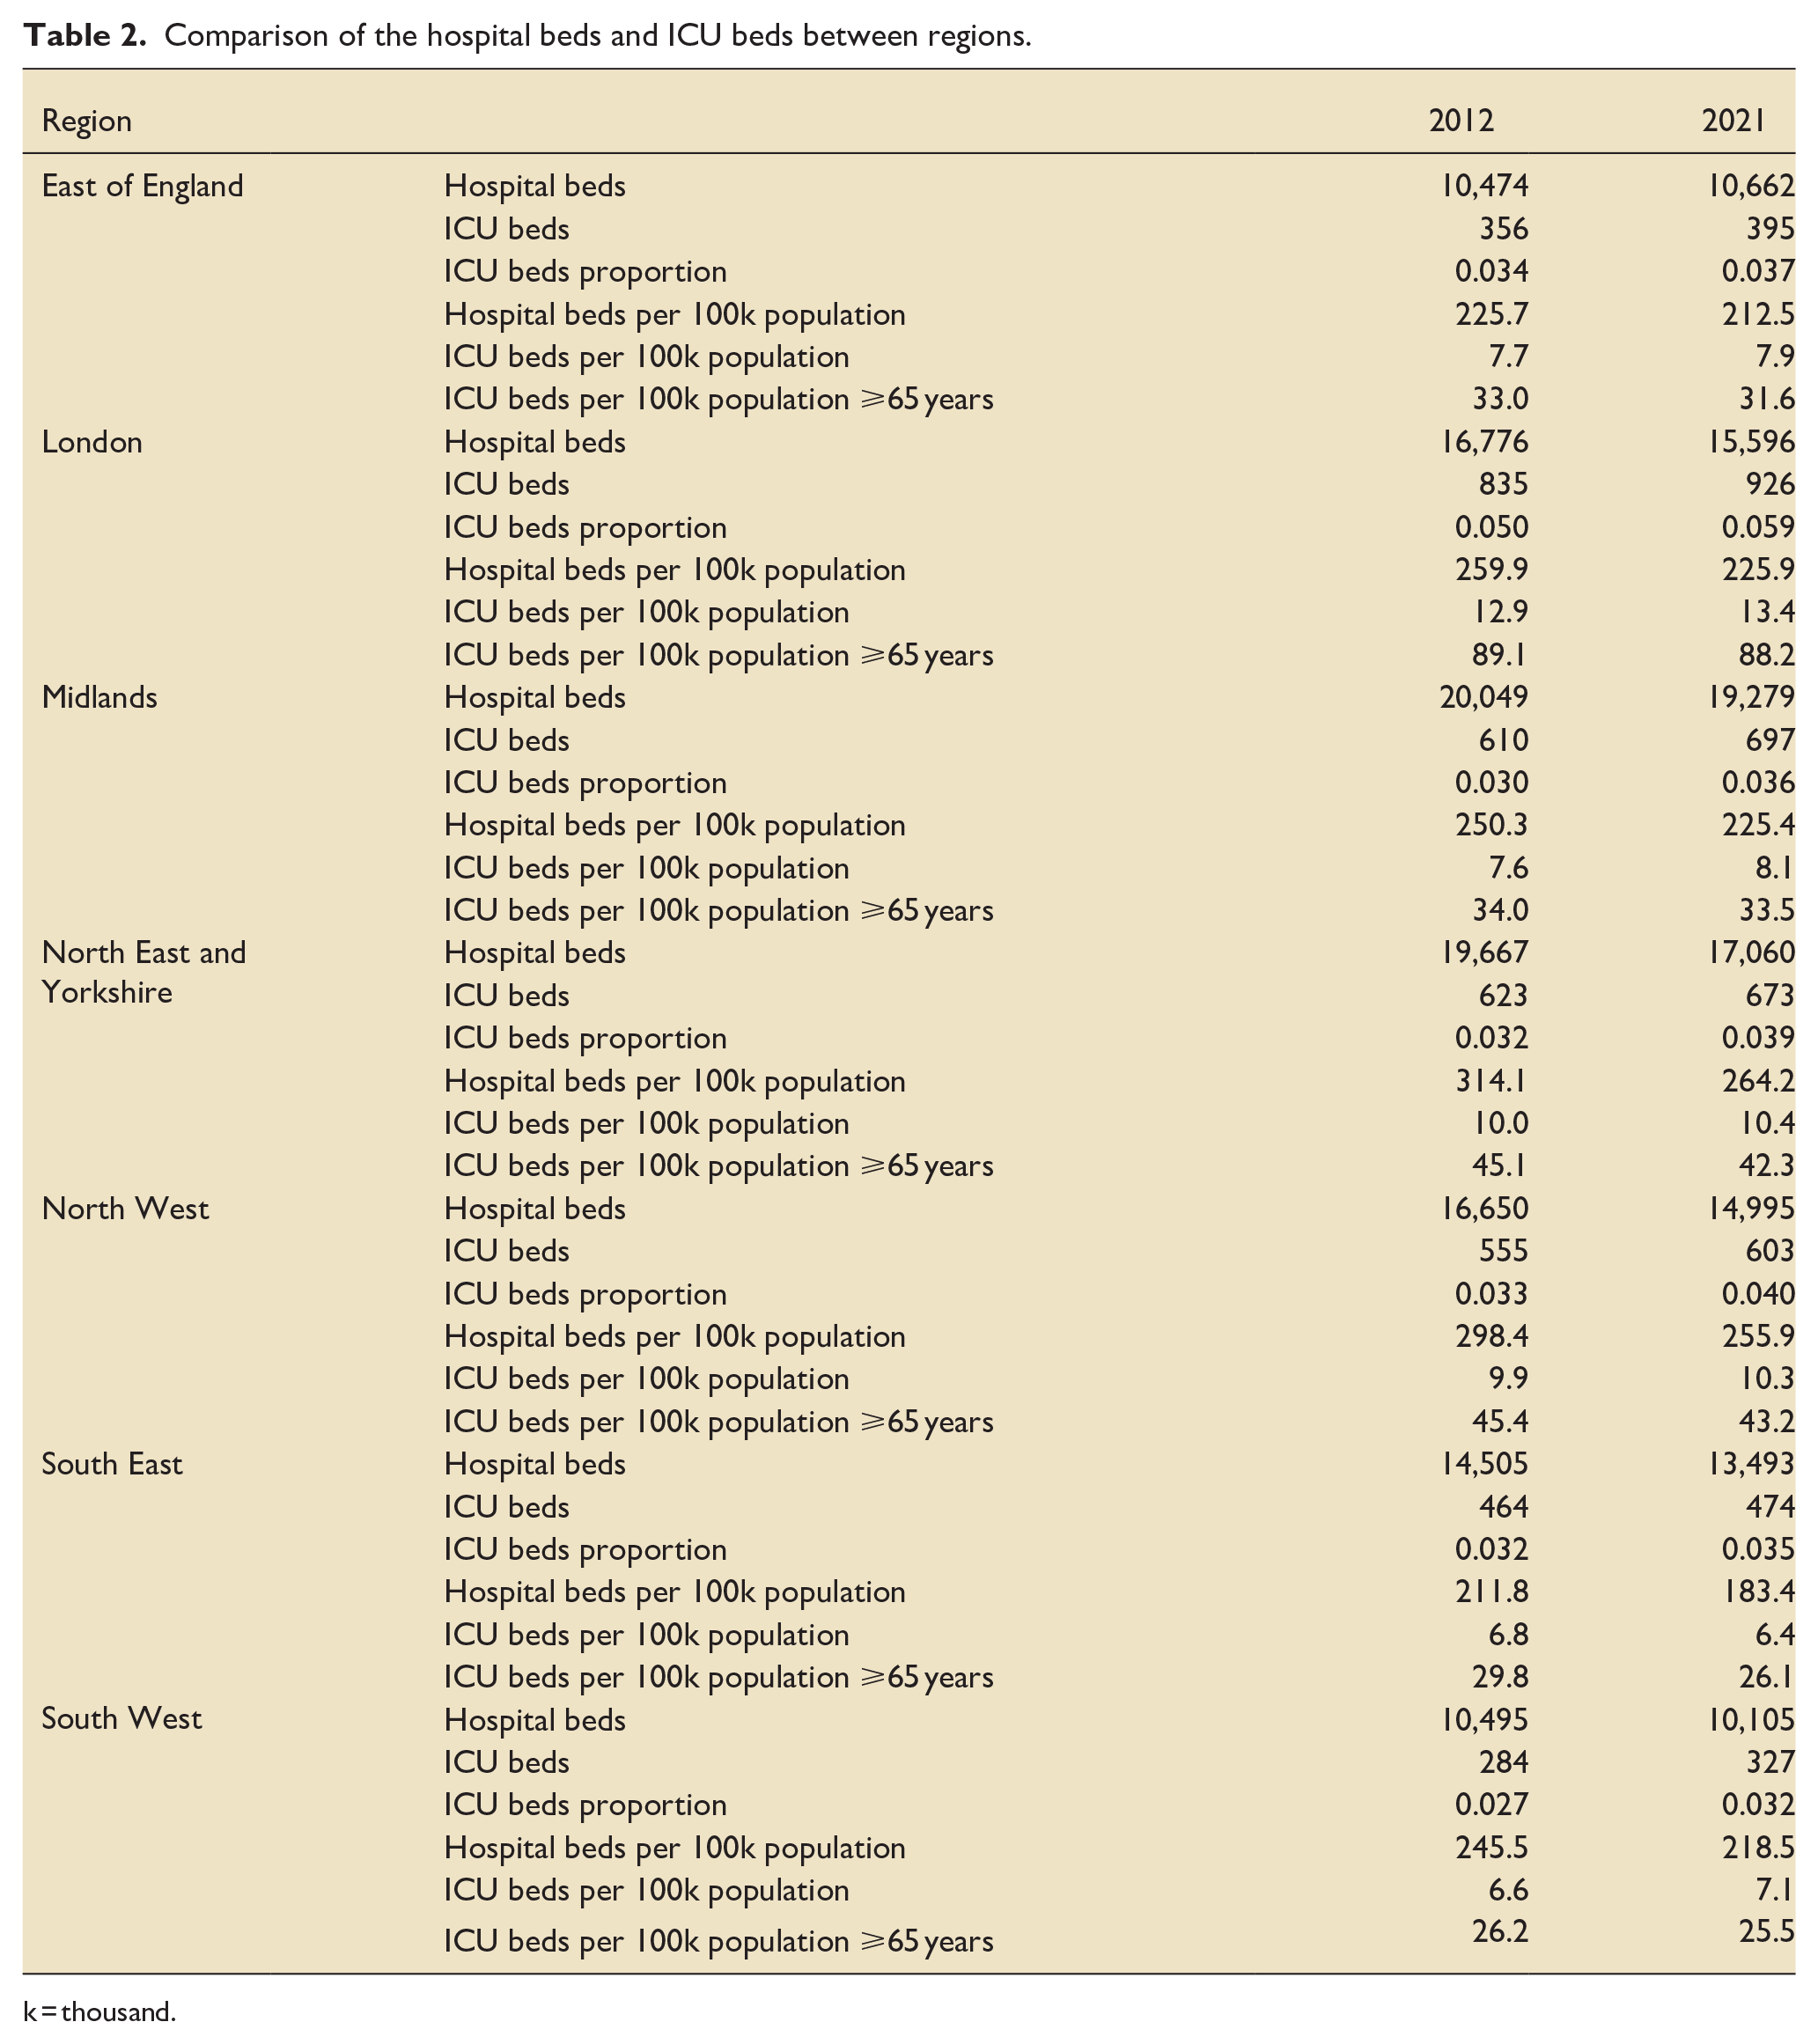
k = thousand.
ICU beds per 100k population also varied between regions over the same period. This ranged from a decrease in the South East by 0.4 to an increase in the Midlands, London and the South West by 0.5 beds per 100k population. See the online Supplementary File, Figure S7 for the regional trends.
ICU beds per 100k population aged 65 years and over decreased in all regions, between 0.5 beds in the Midlands to 3.7 beds in the South East. The region with the largest discrepancy between population growth and ICU beds per capita was South East where the population aged 65 years and over grew by 16.6% whereas the ICU beds per capita reduced by 12.4%. See the online Supplementary File, Figure S8 for the regional trends.
The 10-year summary statistics for ICU beds per 100k population and per 100k population for those aged 65 years and over for each region can be seen in the online Supplementary File, Figures S9 and S10. The overall median was 9 beds, with a range of 7–14 across the different regions. The median variation was more prominent in the 65 years and over age group, ranging from 25 to 92. In both population groups, London had the highest median number of ICU beds per capita. Data available in the online Supplementary File, Table S4 (A and B).
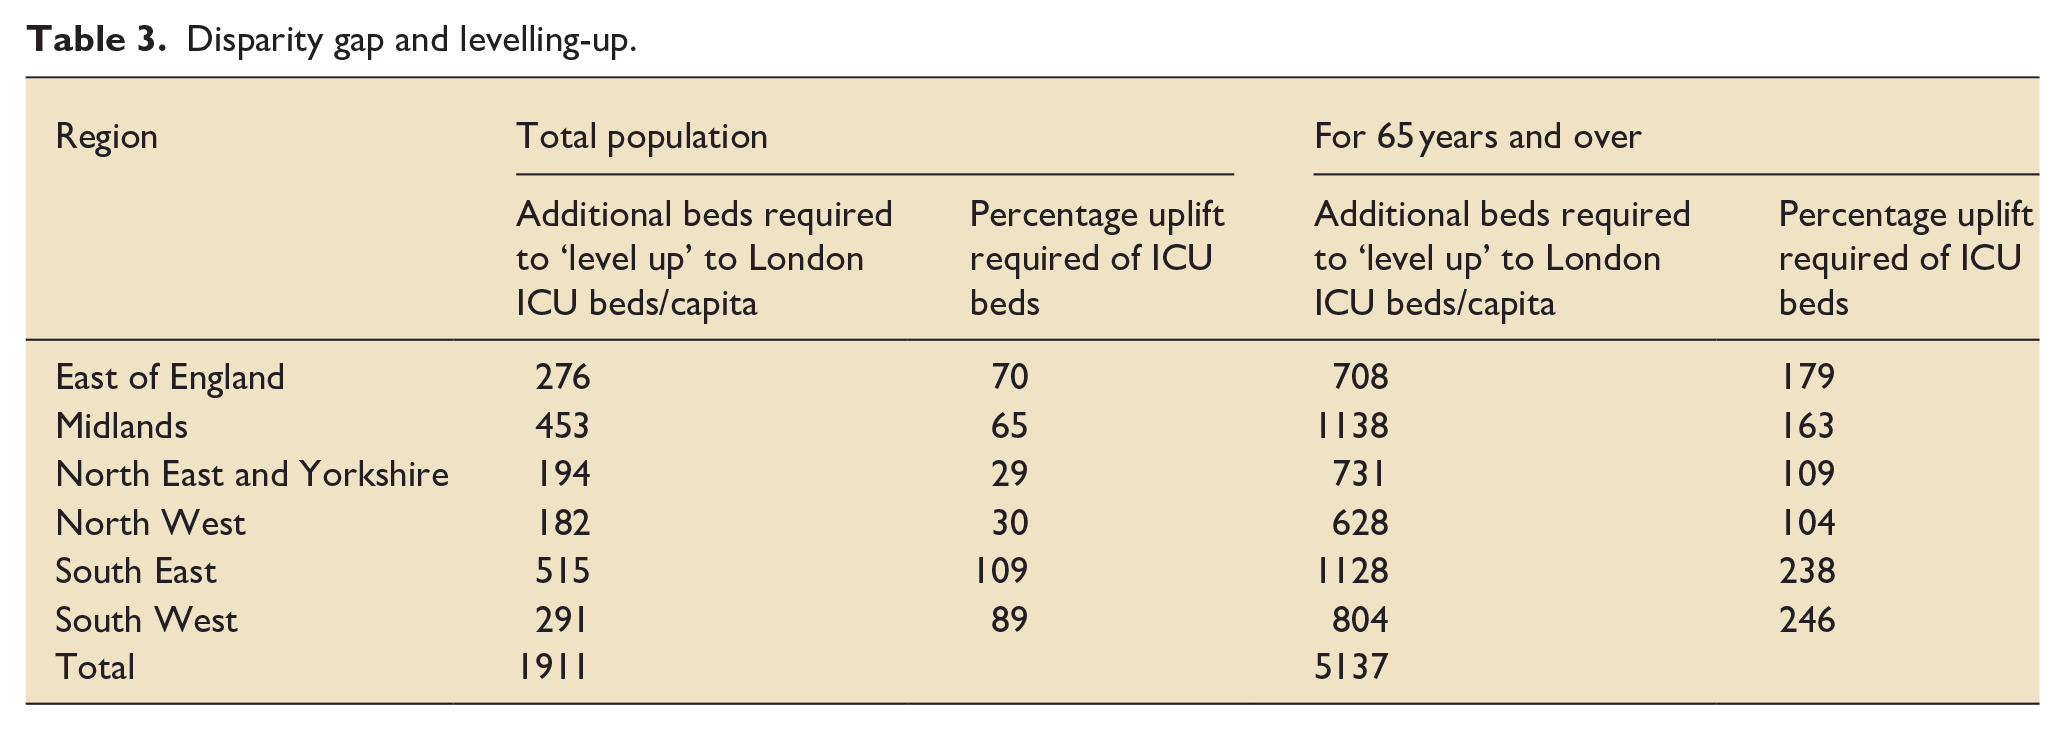
London was deemed the reference region in 2021, with 13.4 ICU beds per 100k total population and 88.2 beds per 100k population in the 65 years and over age group. Table 3 shows the additional beds required in each region to close the disparity gap.
Disparity gap and levelling-up.
The average unobserved ‘regional’ fixed effect statistic for each region was calculated. The variation between regions are shown in Figure 2 below. Regions with a positive statistic, that is, above the average line of zero, have unobserved regional fixed effects that have caused ICU bed supply to be higher than the national average ICU bed supply. Those with a negative statistic have unobserved regional fixed effects that cause ICU bed supply to be lower than the average. Variables responsible for these fixed effects are unknown, therefore they cannot be explained. These unobserved regional fixed effects have the highest positive impact in ICU beds supply in London and the highest negative impact in the Midlands.
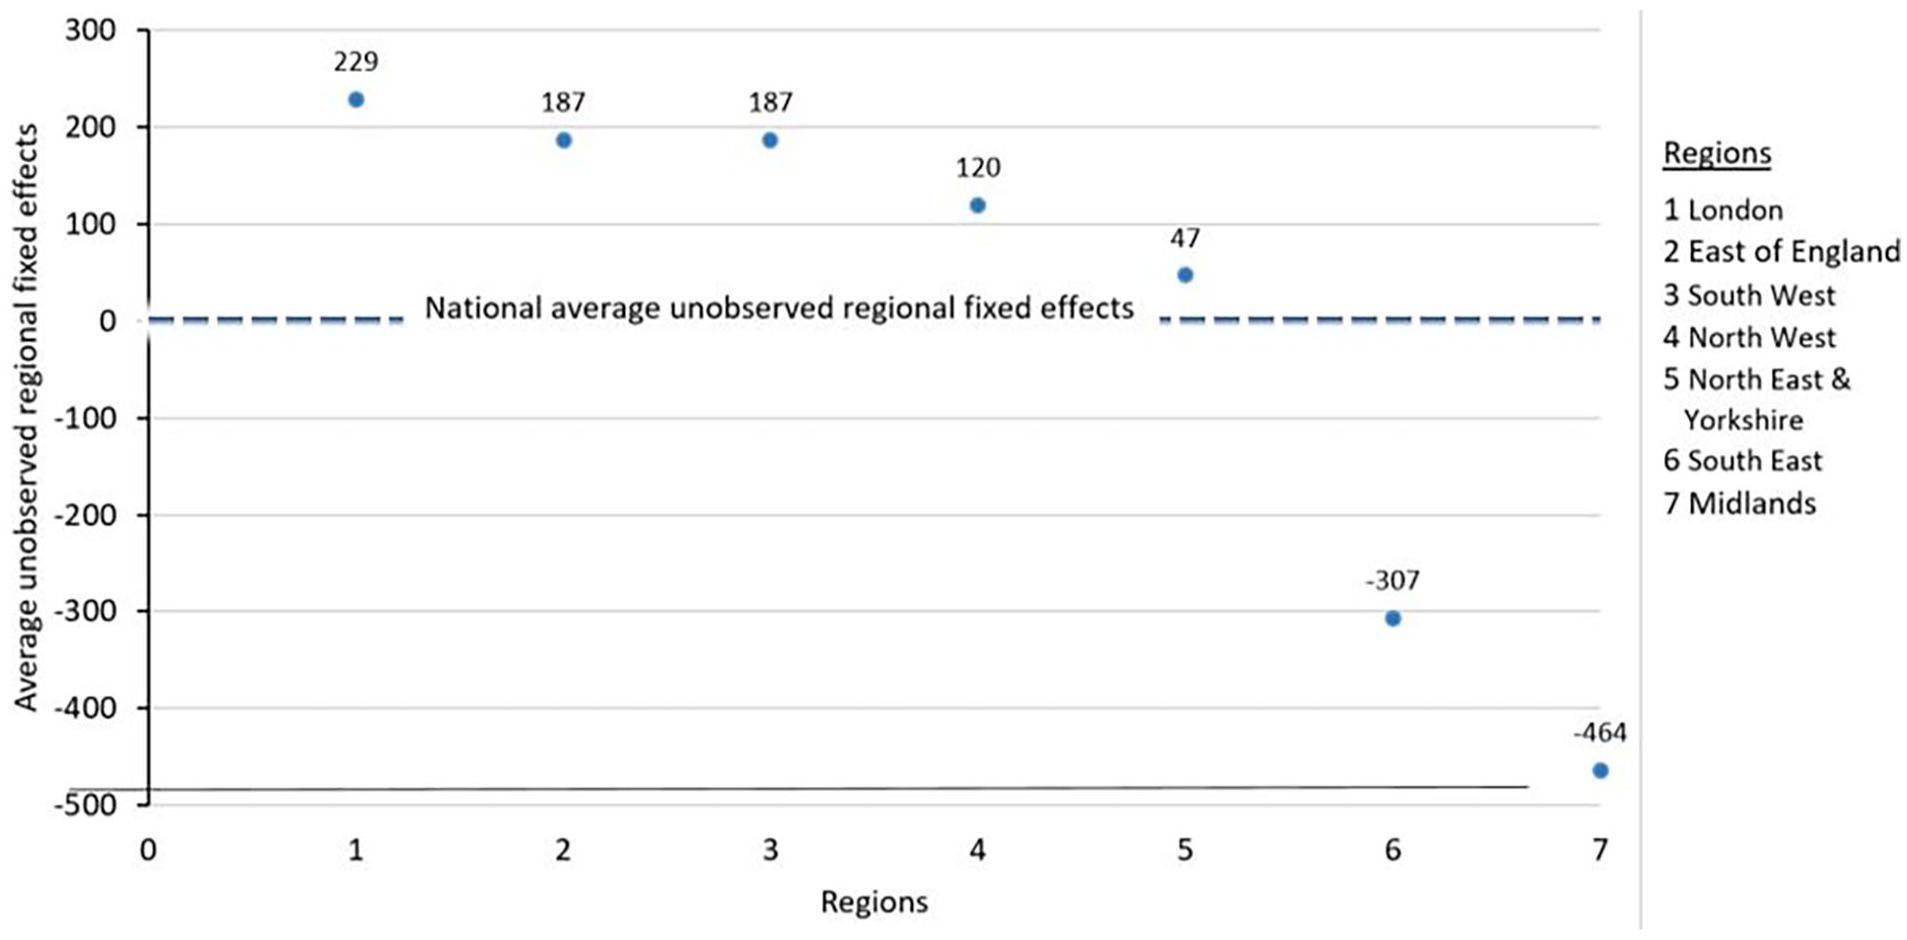
The unobserved regional fixed effects in comparison to the average for England.
Discussion
This panel data study has shown that during 2012–2021 there was a wide disparity in the per capita supply of ICU beds between the seven regions. London as a region over time showed a consistently higher number of ICU beds per capita, with nearly twice as many beds per capita than the South West. For the population aged 65 years and over, the difference is even more marked. The bed count changes have also increased the disparity in ICU beds per capita for people aged 65 years and over, with the greatest impact in the South East region, where changes in ICU beds per capita occurred out of proportion with population growth. Therefore, regional differences in ICU bed numbers per capita which existed in 2012, have continued a decade later, despite changes in both the population and ICU bed counts.
The COVID-19 pandemic had a significant impact on the number and proportion of ICU beds in 2020, as demonstrated in Table 1. There was a marked increase in ICU bed availability to address the surge in critical care demand. However, this surge was short-lived; by 2021, the number of ICU beds and their proportions largely reverted to 2019 figures. This implies that the pandemic-induced adjustments were largely temporary and there was no long-term policy decision to change the ICU bed supply. Generalised yearly fluctuations not explained by population changes is also accounted for in the fixed effect regression model.
Our study findings are consistent with the previous work describing regional variation in the supply of ICU beds that does not respond to population growth.19 –21,23 Within the USA, potential contributing factors to variability could be due to healthcare being provided by private sector healthcare facilities where planning occurs at individual hospital perspective and lacking coordination of intensive care capacity planning across regions.19 –21
Despite the government’s 2014 ‘Five Year Forward Plan’ 32 and the 2019 ‘NHS Long term plan’ 33 publications, with the aim to ensure the public have equal access to services and outcomes, thereby reducing health inequalities, regional variations in ICU beds per capita have persisted over time. In particular, all regions lag behind London, where population demographics show the lowest percentage of population aged 65 years and over (<20%), yet the largest gain in ICU beds. For regions to increase ICU bed capacity to the same level as London for the total adult population, this would require an increase of between 182 and 515 beds, depending on the region. This increases to between 628 and 1138 beds at a regional level if the population aged 65 years and over is used as a reference.
The precise regional causes for driving changes in ICU bed numbers are unclear, but there are a number of hypotheses. These range from population characteristics, specialist ICU services at regional level and local or regional financial resourcing.17,18
Apart from an ageing population, other factors such as income disparity, co-morbidity patterns, health index, race and socio-economic status of the regional population may influence healthcare resource demands and ultimately lead to health inequalities.34,35
Improving the efficiency of ICU services requires aligning the supply of ICU beds with the population in need. The structure of operational delivery networks (ODNs) within regions 36 means that ICU bed supply has consequences for a range of services within the region. This includes tertiary specialist services provision such as extracorporeal membrane oxygenation (ECMO) or transplantation services. Each ODN manages inter-hospital transfer of critically ill patients to and from specialist services autonomously. In order to ensure optimal inter-hospital transfers, ODNs should be involved in hospital-level decisions regarding ICU bed capacity.
Information on health care budgets allocated to each region and devolved to acute care providers to provide services is not publicly available due to locally negotiated contracts. A lack of transparency makes it impossible to deduce whether there are inequalities in budget allocation. This is problematic in a centrally governed universal health care system.
One challenge of allocating ICU beds is the lack of a definitive set of criteria for admissions to or discharge from ICU. Patient heterogeneity, medical and nursing staffing restrictions, regional variations in bed supply and capacity inevitably introduce clinician bias and may lead to triaging decisions based on bed and staffing constraints, aside from clinical judgement.37,38 This lack of consistency reduces the ability to identify the reasons for variation and prevents regions building a case for additional capacity for the future. Insufficient bed supply may be associated with poorer patient outcomes including excess mortality,39 –42 but as ICU bed supply may drive demand, some regions may have surplus beds, or beds are not being used efficiently or appropriately. 43
These findings imply that there is much to be done to achieve the aim of the UK government’s 2022 ‘Levelling Up’ white paper. 44 In order for policymakers to meet this promise several steps need to be taken for future planning and finding solutions. These include an in depth understanding of the demands for ICU services in each region based on socio-economic factors and other population health needs with appropriate allocation of ICU bed supply to meet demands. The use of practical, evidence-based frameworks which provide guiding principles to support policy makers to ‘level up’ health across the country should be considered as well. 45 Lastly a defined process and timeline to deliver this.
Strengths and limitations
This study has several strengths. Firstly, its nationwide population-based design in the setting of a universal healthcare system, enabled regional comparisons. Secondly, we use a nationally well established and referenced administrative database, which is monitored and managed at government level. Finally the definition of what constitutes an ICU or HDU bed is universally accepted in the UK, therefore valid comparisons could be made.
There are a number of limitations with our findings. Firstly, the data were aggregated at regional level as opposed to being more granular, such as local authority/hospital level. The reason to only evaluate data at regional level was necessary due to the changes in geographical boundaries over the years. This means that a more granular comparison was not possible. Secondly information from independent hospital providers offering higher level ICU or HDU care services was not accounted for, which means the true number of ICU beds available for adult patients in England would have been under estimated. However, these beds would not have been publicly funded, so equitable access to them would not be considered. ‘Thirdly, population data were collected for adults over 18 years of age but acknowledge at times that adult ICU beds may be utilised by those aged 16–18 years old. These figures are likely to be low as this group is not a significant driver of ICU demand. In addition, these figures were not publicly available’. Finally, the study does not describe utilisation or clinical outcomes. It is possible that there may be over or undersupply of ICU beds.
Conclusion
This is the first study in England that has demonstrated that there are significant geographical and age-related imbalances in relation to ICU bed supply. Although the number of beds required to achieve equality between regions has been reported here, these results cannot help determine what an optimal number of ICU beds in a given region should be.
The findings of this study have potential important policy implications, in as much as they could assist healthcare policy makers in adopting effective strategies to ensure equitable allocation of health care resources.
This study is informative and should hopefully raise further questions than provide answers. In order to reduce inequalities relating to provision and delivery of vital healthcare resources, further research is needed into factors affecting ICU bed supply and how this variation in ICU bed numbers impacts on care delivery and ultimately patient outcomes.
Supplemental Material
sj-docx-1-inc-10.1177_17511437251350808 – Supplemental material for Geographical disparities in adult intensive care beds in the English National Health Service: A retrospective, observational panel data study
Supplemental material, sj-docx-1-inc-10.1177_17511437251350808 for Geographical disparities in adult intensive care beds in the English National Health Service: A retrospective, observational panel data study by Reena Mehta, Raliat Onatade, Savvas Vlachos and Ritesh Maharaj in Journal of the Intensive Care Society
Footnotes
Author contributions
Reena Mehta: Conceptualisation, Data curation, Methodology, Formal analysis, Writing – original draft. Raliat Onatade: Methodology, Formal analysis, Writing – review & editing. Savvas Vlachos: Methodology, Formal analysis, Visualization, Writing – review & editing. Ritesh Maharaj: Conceptualisation, Formal analysis, Methodology, Writing – review & editing. All authors read and approved the final manuscript.
Declaration of conflicting interests
The author(s) declared no potential conflicts of interest with respect to the research, authorship, and/or publication of this article.
Funding
The author(s) received no financial support for the research, authorship, and/or publication of this article.
Supplemental material
Supplemental material for this article is available online.
References
Supplementary Material
Please find the following supplemental material available below.
For Open Access articles published under a Creative Commons License, all supplemental material carries the same license as the article it is associated with.
For non-Open Access articles published, all supplemental material carries a non-exclusive license, and permission requests for re-use of supplemental material or any part of supplemental material shall be sent directly to the copyright owner as specified in the copyright notice associated with the article.