
Abstract
Background
Measuring cardiac output is common in critical care and perioperative medicine. Different monitoring systems are often judged against others in comparative studies. There is no agreed standard or definition on which to base the conclusions of such studies.
Objectives
To review comparative studies of cardiac output monitors using an agreement:tolerability index (ATI) as a measure of monitor precision. To compare the ATI of a monitor with the conclusions of authors regarding agreement and clinical utility.
Design
Systematic review of comparative studies of cardiac output monitoring systems. The precision of each monitor was standardised against an ATI using a tolerability interval based on the normal range for cardiac index. The conclusions of each study were described as positive, neutral or negative, depending on whether authors reported the monitor to be acceptably precise and/or clinically useful. Comparison was made between the precision of a monitor and the likelihood of it being favoured by authors.
Data sources
PubMed was searched up to March 2012.
Eligibility criteria
Studies published in English that compared two or more methods for measuring cardiac output in adult humans.
Results
A total of 213 papers documenting 409 separate comparisons of two methods of measuring cardiac output were included. ATIs for the different comparisons varied from 0.07 to 6.84 (where an ATI < 1 indicates acceptable agreement, 1–2 marginal and >2 unacceptable agreement). Thirty-one percent of authors defined their own terms for acceptable agreement. ATI was only moderately correlated with the conclusions of the authors (Spearman rho = 0.47, P < 0.0001).
Conclusions
Authors should define what constitutes acceptable agreement a priori when reporting comparative studies of cardiac output monitors. The ATI and the tolerability interval may be a useful basis for helping define acceptable precision.
Introduction
Monitors that measure cardiac output can be used both to diagnose states of low, normal or high cardiac output, and to assess the response to therapeutic interventions by continuous or serial measurements. The use of such monitors is common in critical care and is recommended in certain peri-operative situations. 1 Several different monitoring technologies exist. The ‘gold standard’ is normally cited as being a thermodilution technique using a pulmonary artery catheter, which is a common reference standard to which newer methods have been compared. Bland and Altman described a practical way of describing the results of agreement studies in which a particular variable is measured by one method and then compared to measurements from a reference method. 2 The difference between the two methods is expressed as bias (the average difference) and the scatter of differences about the bias as the 95% limits of agreement. Critchley and Critchley reviewed comparative studies of cardiac output monitors in 1999, of which only two new methods were included (Doppler and bioimpedence techniques) and most used thermodilution as the reference. 3 They found that fewer than half of these studies provided any objective criteria by which to accept or reject the new method. Based on the thermodilution method having an assumed accuracy of ±10–20%, Critchley and Critchley recommended that future studies should accept a new method if the limits of agreement between a new and a reference technique were ±30%. (This was based on combining notional errors of 20% from each method, which gives a pooled variance error of 28% or 30%.)
Cecconi et al. have emphasised the fact that Critchley and Critchley recommended acceptability of agreement on the basis of the reference measurement technique being thermodilution with a precision of ±10–20%. 4 They argue that the precision of the reference technique should be measured during any comparative study and that if the reference technique has wider precision than that assumed by Critchley and Critchley, then a limit of agreement of ±30% might not be acceptable. Cecconi and Rhodes have called for a consensus on how such comparative studies are conducted and reported to avoid such misinterpretation, 5 and 10 years previously Critchley and Critchley recommended that these studies should report the mean cardiac output, the bias, the limits of agreement, and the percentage error. 3
Columb has suggested that authors specifically define agreement a priori for the specific clinical scenario by defining a tolerability interval to guide their conclusions on whether the precision of a clinical monitor is acceptable. 6 The tolerability interval is the range of values that are clinically acceptable and would not usually prompt any intervention to alter the variable. This could be a normal range or reference interval, but does not have to be so. The agreement:tolerability index (ATI) expresses the precision of a measuring device in relation to this ‘clinically acceptable’ range. An index greater than 2.0 implies that ‘extreme-to-extreme misclassification’ can be expected to occur as each side of the limits of agreement exceeds the tolerability range and this represents unacceptable agreement. An index between 1.0 and 2.0 implies that although extreme-to-extreme misclassification is unlikely, measurements in the tolerability range may be classified to either extreme so this ‘two-sided misclassification’ represents marginal agreement. An index less than 1.0 implies that at worst, patients in the tolerability range are only likely to be misclassified to an adjacent extreme or ‘one-sided misclassification’ and this represents acceptable agreement. 6
In this model, extreme-to-extreme misclassifications represent the worst level of precision in that the true variable might be below the tolerability range, but the monitor displays a value above that range. For example, setting a tolerability interval as equal to the normal range for cardiac output would mean that an extreme-to-extreme misclassification could result in a patient with cardiogenic shock being recorded by a monitor as having a hyperdynamic circulation. Interventions based on such a misclassification might be directly opposite to what is clinically indicated, and such poor precision from a monitor should not be acceptable. Therefore, we have chosen to derive a tolerability interval for assessing cardiac output monitors from the normal range of cardiac index.
Several new technologies for measuring cardiac output have become available since the review by Critchley and Critchley. 7 We sought to review all studies published to date that have compared two or more methods of measuring cardiac output, focussing on the reported precision of the monitor and conclusions of the authors on whether a monitor performs to a clinically acceptable level.
Materials and methods
A maximum clinical tolerability interval was agreed by the authors of 1.6 L.min−1.m−2 based on the normal range of cardiac index of 2.6 to 4.2 L.min−1.m−2, 8 approximating a ±24% range. We then searched PubMed 9 up to March 2012 using the search strategy in Box 1.
Retrieved abstracts were independently screened by two authors (DN and IC) for papers describing original studies comparing two or more methods of measuring cardiac output (or cardiac index) in adult humans. The full text of all potential papers identified by one or both authors were obtained and reviewed. Papers were excluded at this stage if they did not meet the above inclusion criteria or did not contain sufficient information to allow extraction of the mean difference in cardiac output (or index) and the limits of agreement for a comparison between two methods of measuring cardiac output.
“Cardiac Output/analysis”[Mesh] OR “Cardiac Output/instrumentation”[Mesh] OR “Cardiac Output/methods”[Mesh] OR “Cardiac Output/standards”[Mesh]) OR “Catheterization, Swan-Ganz”[Mesh] OR “Thermodilution/instrumentation”[Mesh] OR “Thermodilution/methods”[Mesh] OR “Thermodilution/standards”[Mesh] OR “Thermodilution/statistics and numerical data”[Mesh] OR “cardiac output monitor” OR “haemodynamic monitor” OR “hemodynamic monitor” OR “flow monitor” Limits: Humans, English, All Adult: 19+ years
For papers reporting comparisons between three or more methods of measuring cardiac output, data on each comparison were extracted separately. Therefore, the unit of analysis was the comparison, not the report. Where necessary, cardiac output data were estimated by measurements from figures or graphs included in the report. The conclusions of the authors of each report were classified as ‘positive’ (suggesting that the new method of measuring cardiac output performed well in comparison to the reference method), ‘neutral’ (if no particular conclusion was reached or if qualifying statements were included that seemed to dilute any general conclusion of rejection or acceptance) or ‘negative’ (suggesting poor performance). These subjective assessments were made by IC and DN independently. Discrepancies were then resolved by joint consideration of the study in question. The Cohen kappa statistic was used to assess agreement between raters.
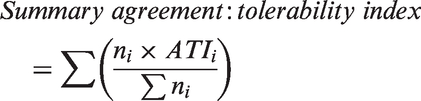
An agreement:tolerability index was calculated for each comparison using equation (1).


Summary agreement:tolerability indices were produced using equation (3) for methods of measuring cardiac output where several separate comparisons had been made.
Confidence intervals for the agreement:tolerability indices were generated as follows. The maximum clinical tolerable interval is an arbitrary constant and so has no associated estimation error. This means that any error in the ATI comes from the limits of agreement and hence from any error in the estimation of the standard deviation of the bias. The standard error of the standard deviation of the bias was calculated using equation (4).

Assuming this error was identical to the standard error of the ATI allowed confidence intervals to be calculated using equation (5).

Where the lower confidence interval boundary would otherwise cross zero, it was truncated to zero as a negative ATI should not be possible. Cochran Q statistics were used due the expected statistical and methodological heterogeneities in the studies. Spearman rho was used to assess the correlation of the ATI with the conclusions of the authors. Statistical significance was defined as P < 0.05 (two-sided). Analyses were carried out in R version 2.11.1. 10 Some custom subroutines were written in C++ and compiled with the MinGW version of the GNU C++ compiler. 11
Results
The literature search results are detailed in Figure 1. Included studies are listed in the Supplementary material table W1, which is only available as online supplementary material due to its size. A total of 409 comparisons reported in 213 papers were ultimately included. Fourteen different methods of measuring cardiac output were employed, each with many variations. These included certain common physical principles such as indicator dilution, pulse contour analysis, Doppler ultrasound, bioimpedence and the Fick principle.
Flow chart of literature search.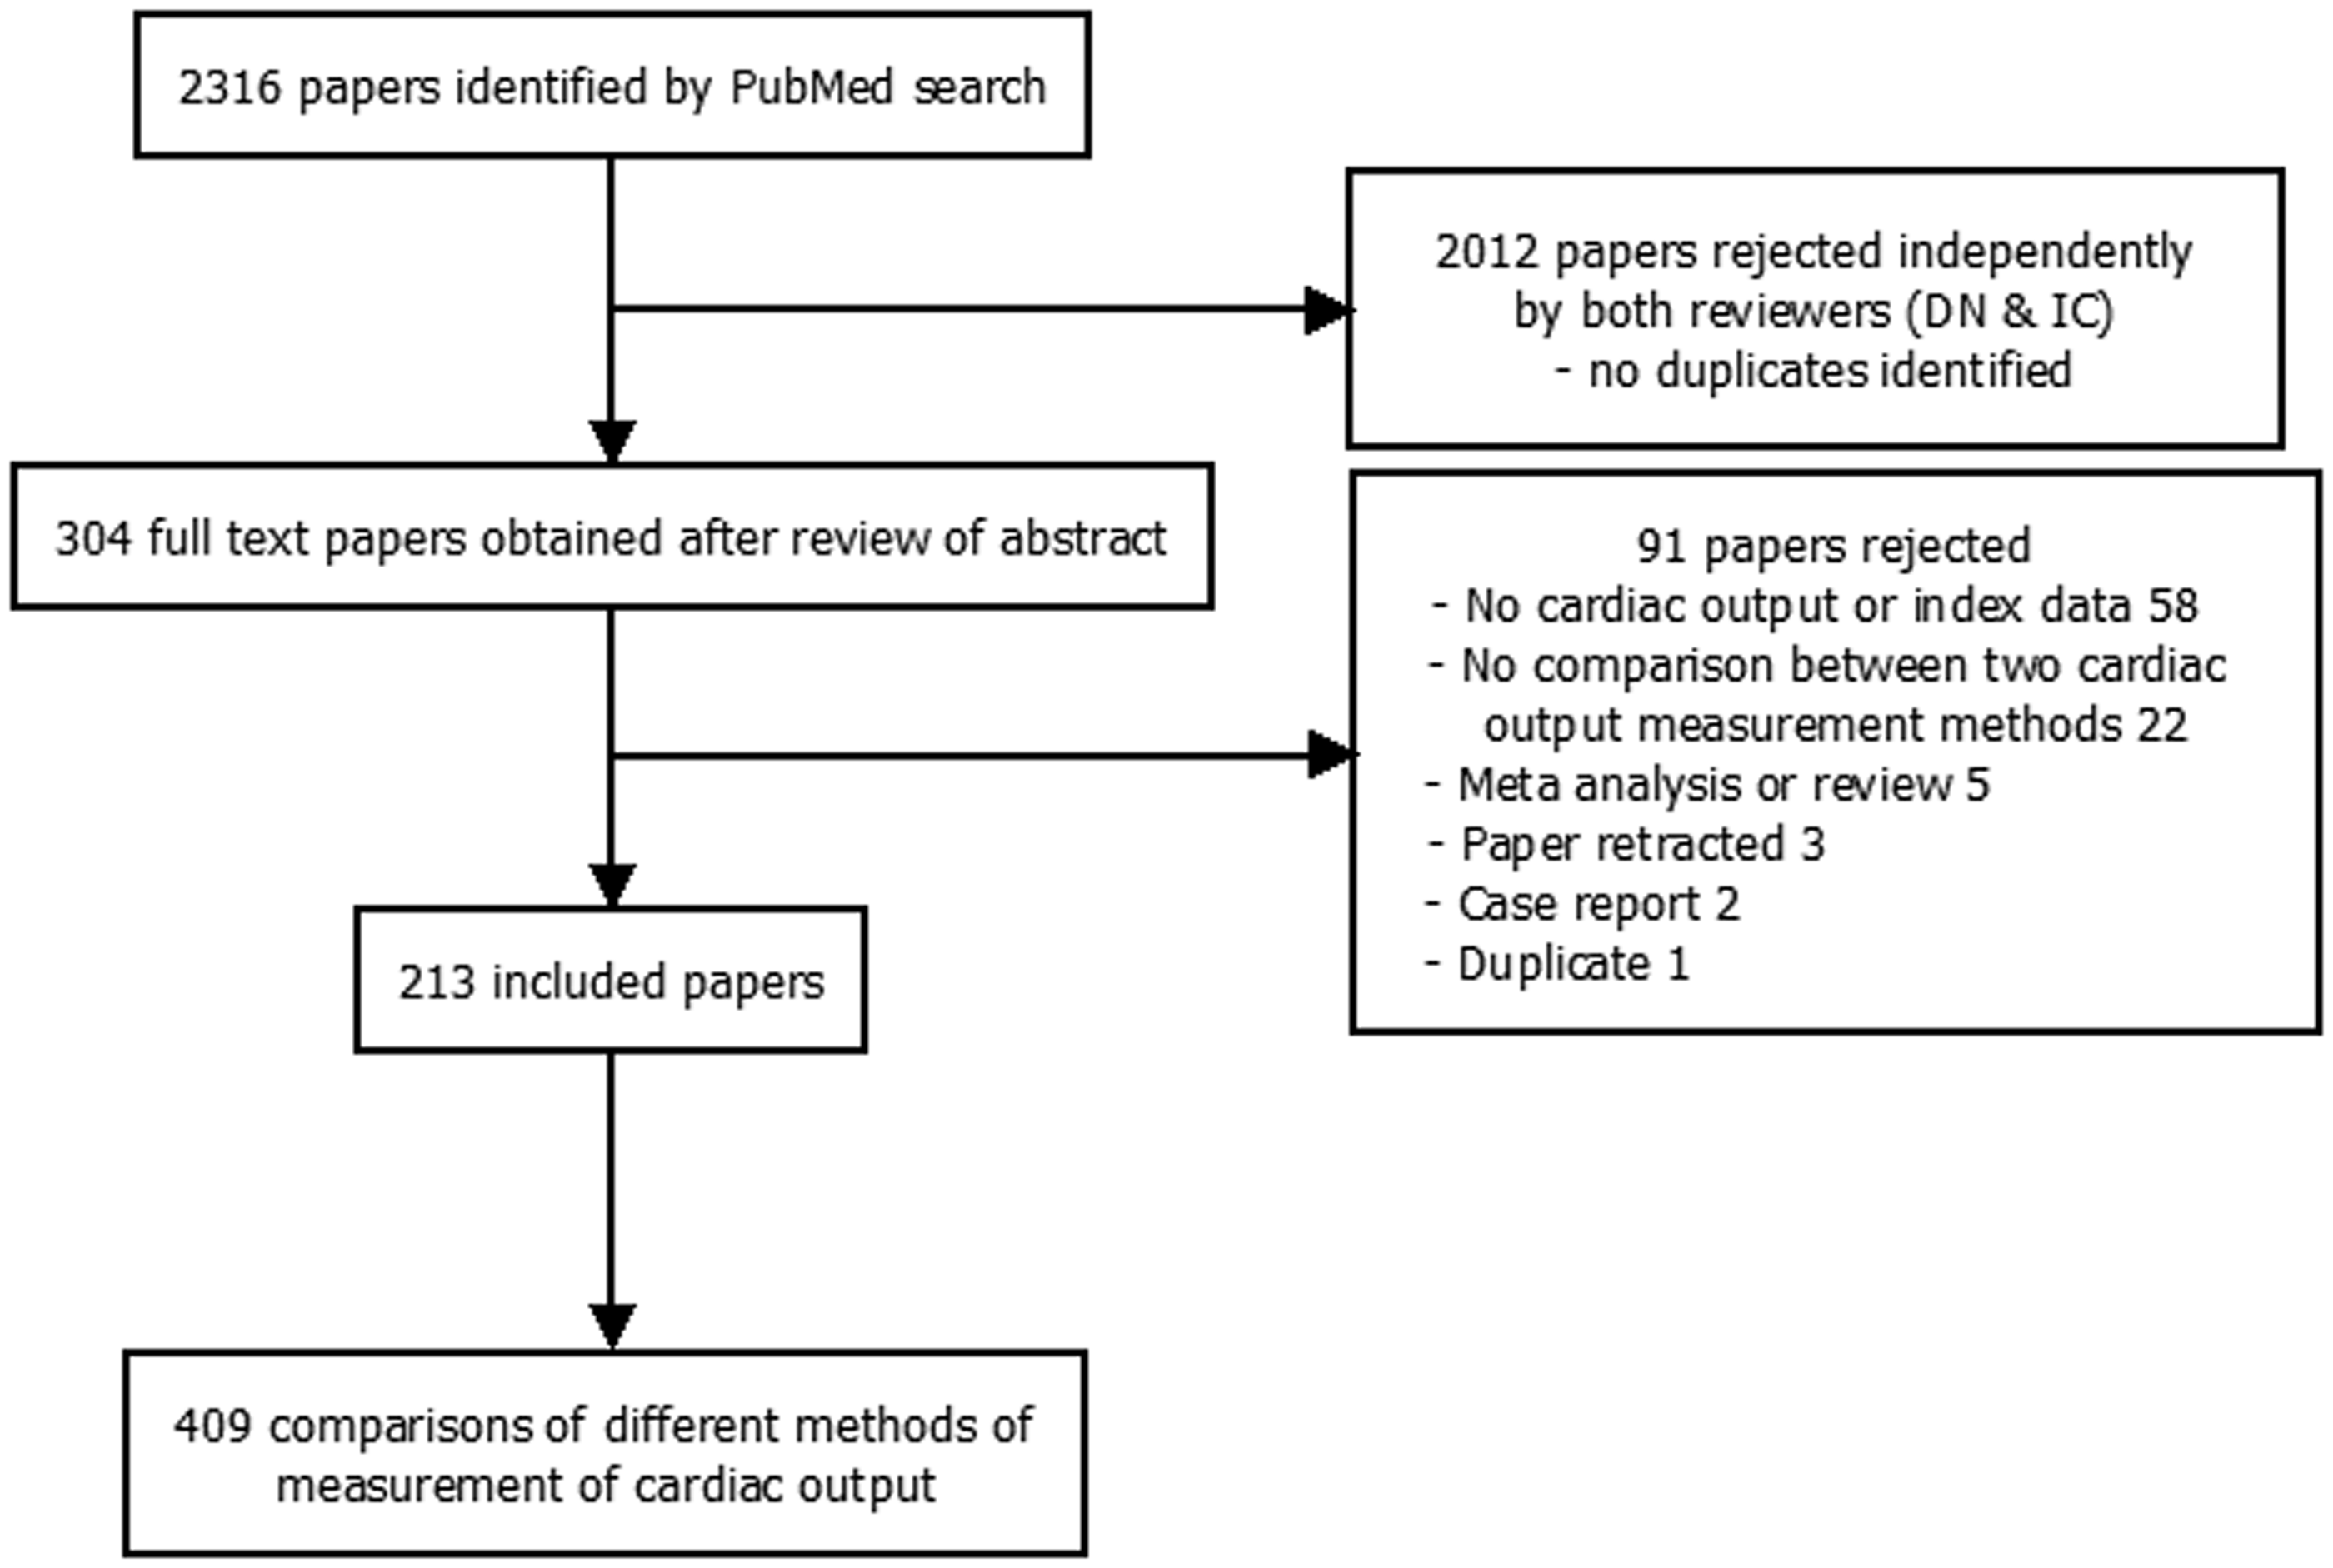
Agreement:tolerability indices for the individual comparisons ranged from 0.07 to 6.84 and there was significant heterogeneity (Cochran Q, P < 0.0001) in the estimates. The indices, conclusions of the authors and years of publication are shown in Figure 2.
Graph of agreement tolerability index against year of report publication.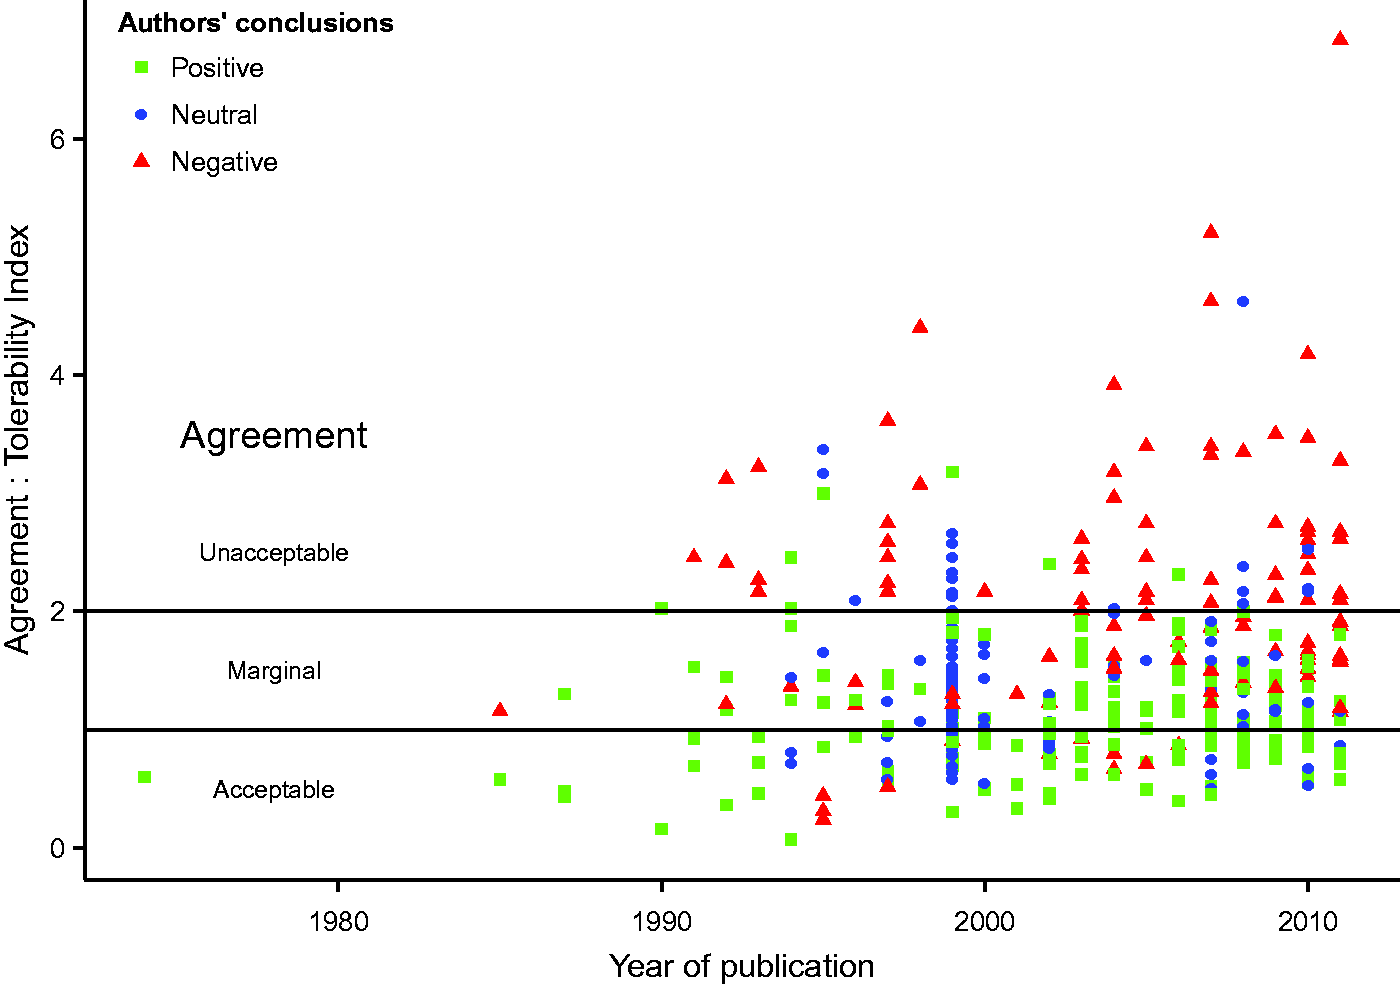
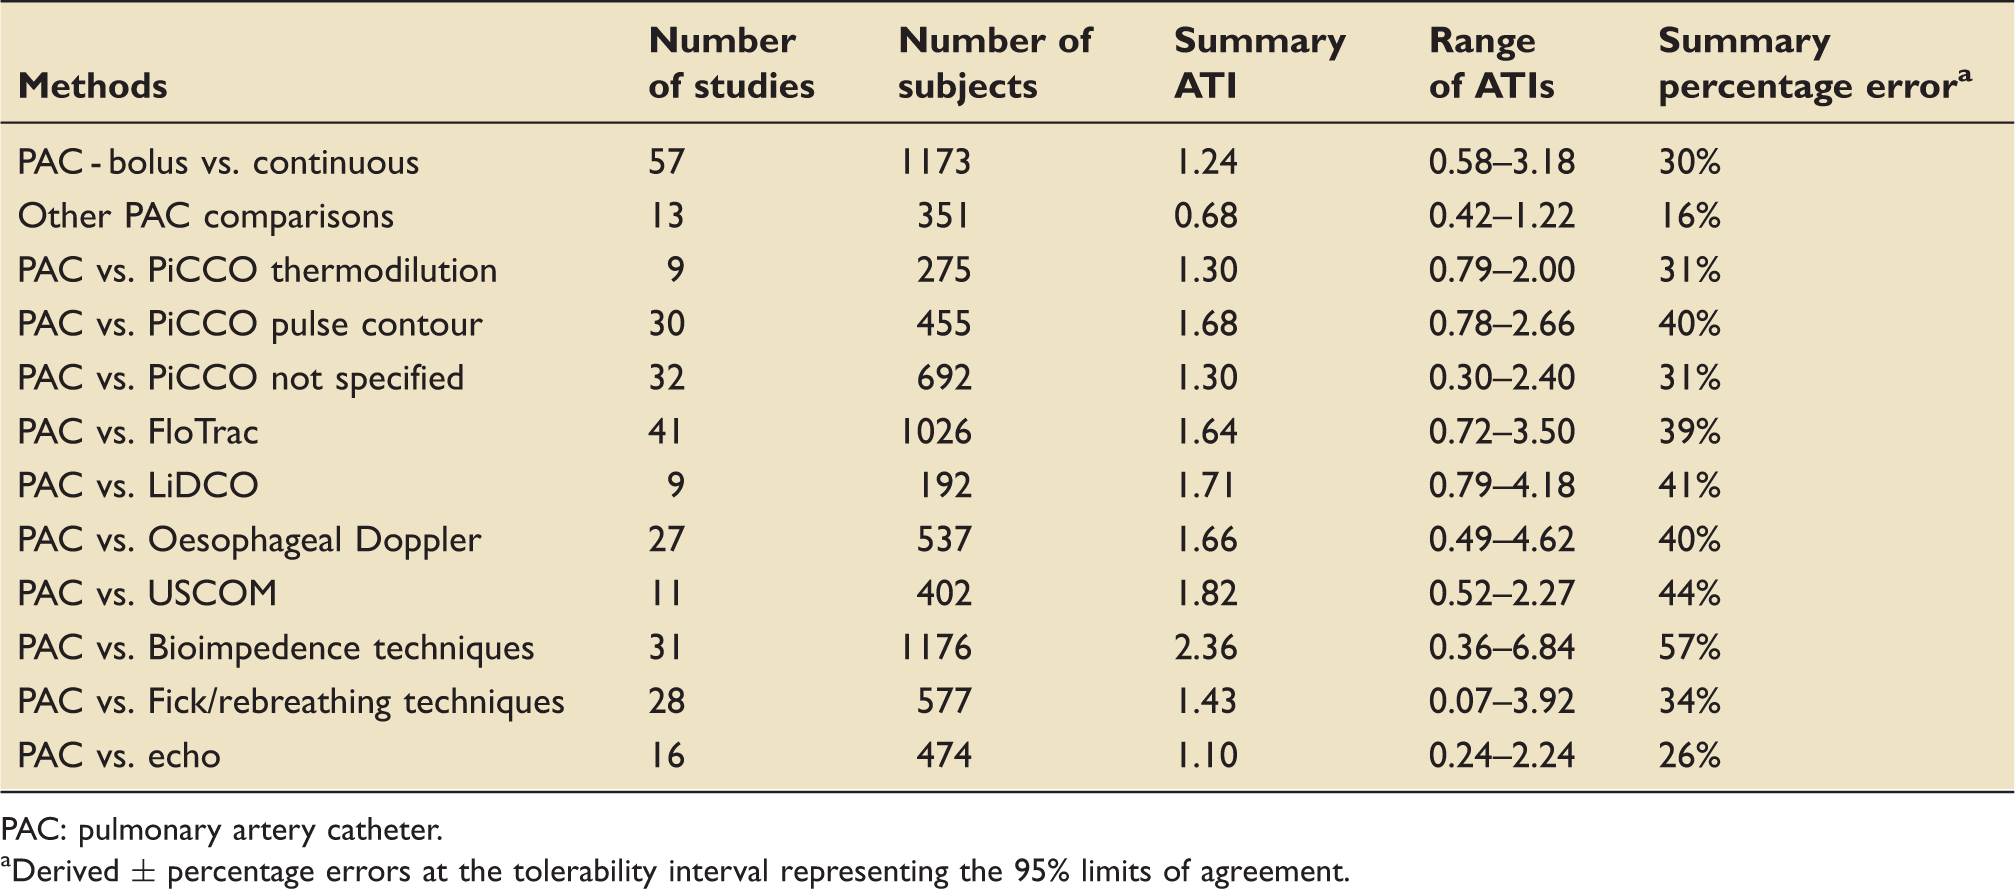
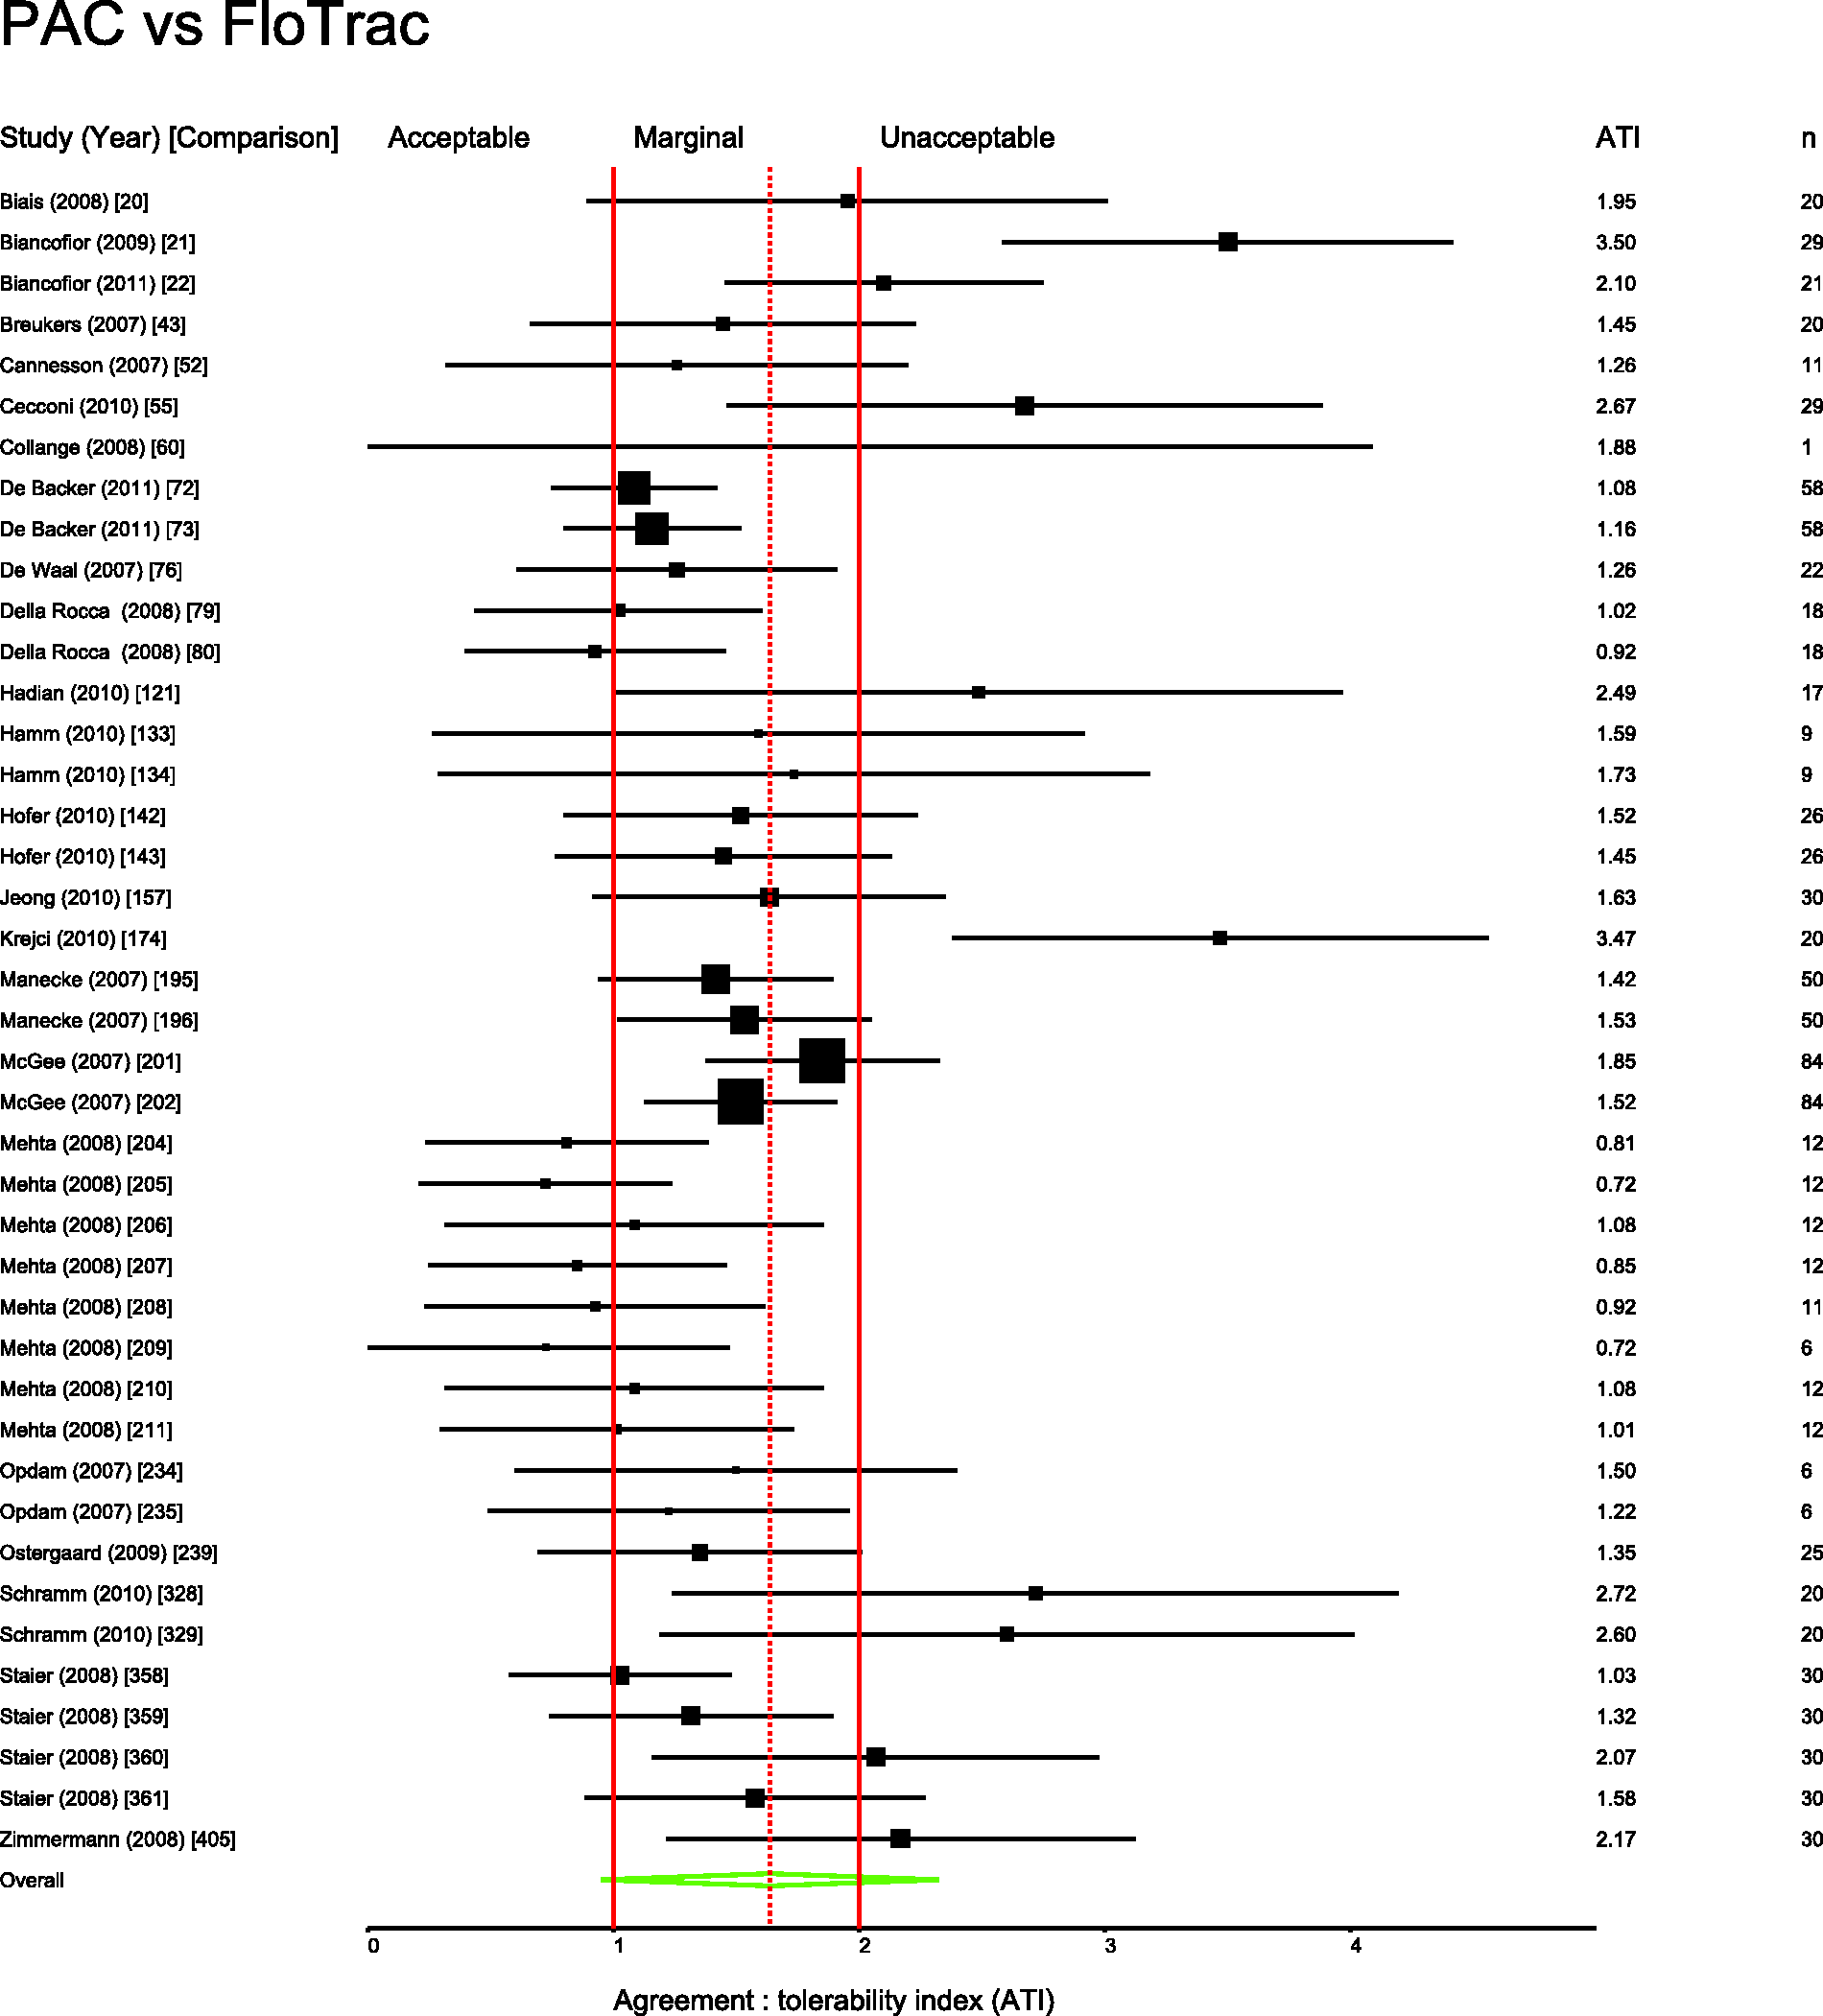
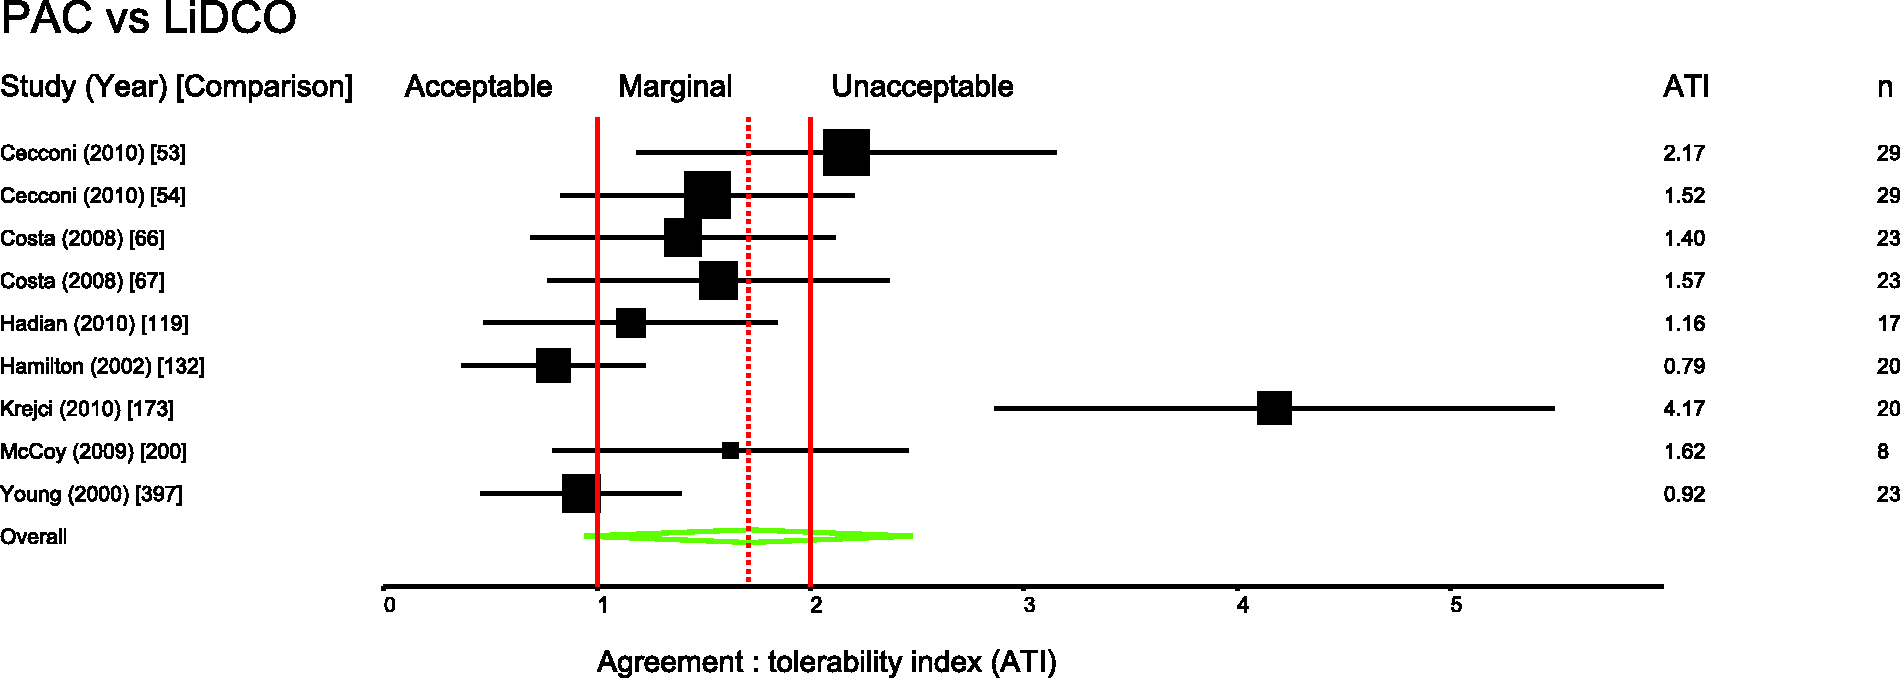
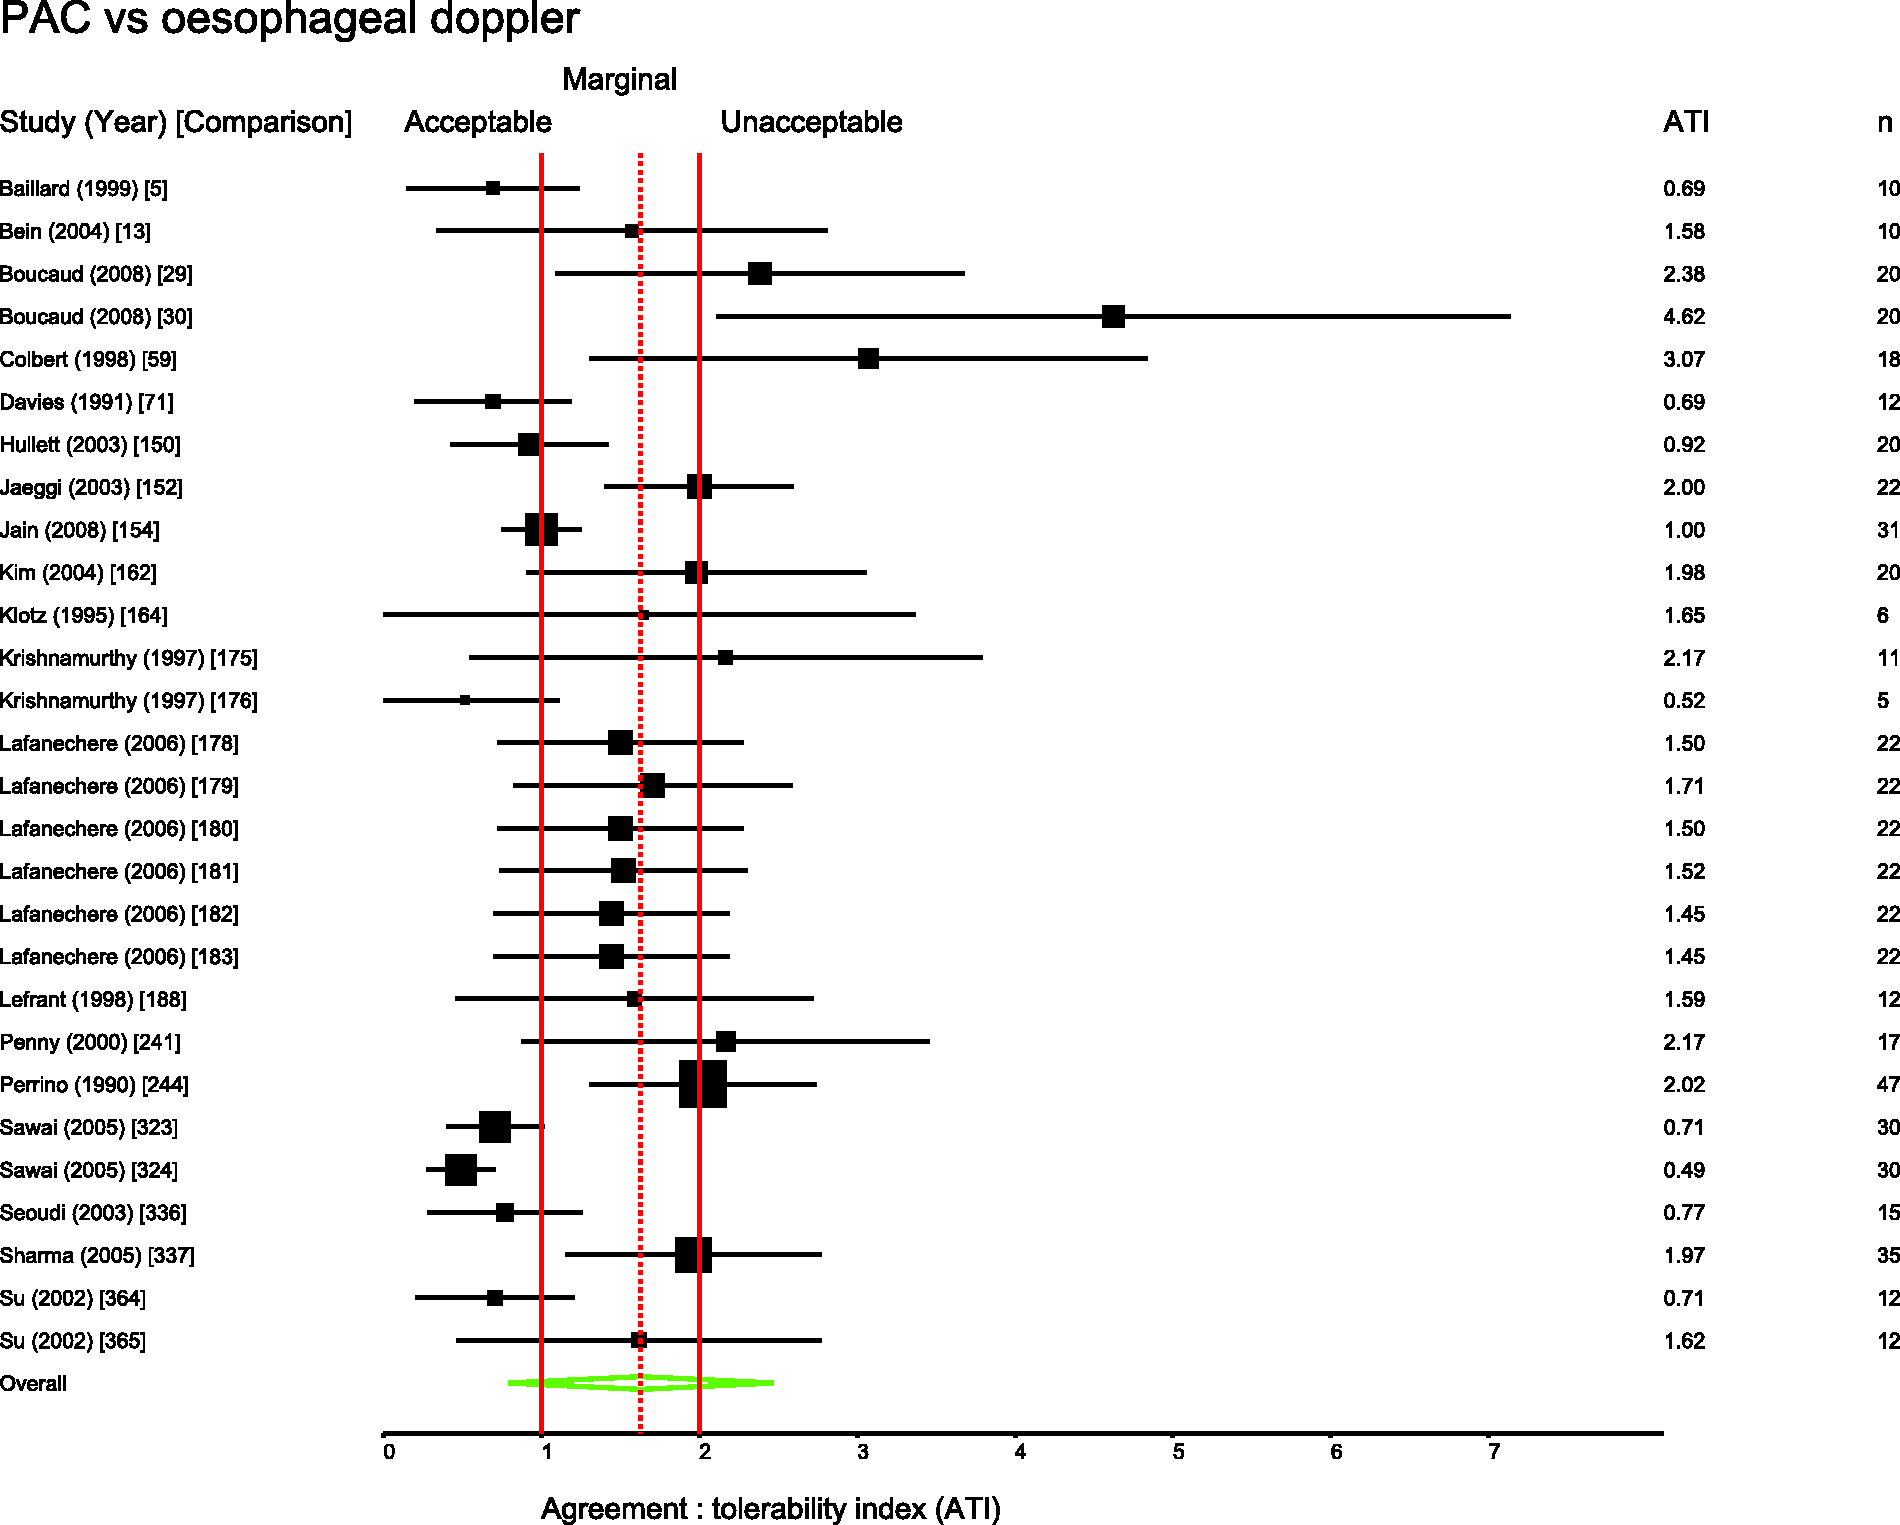
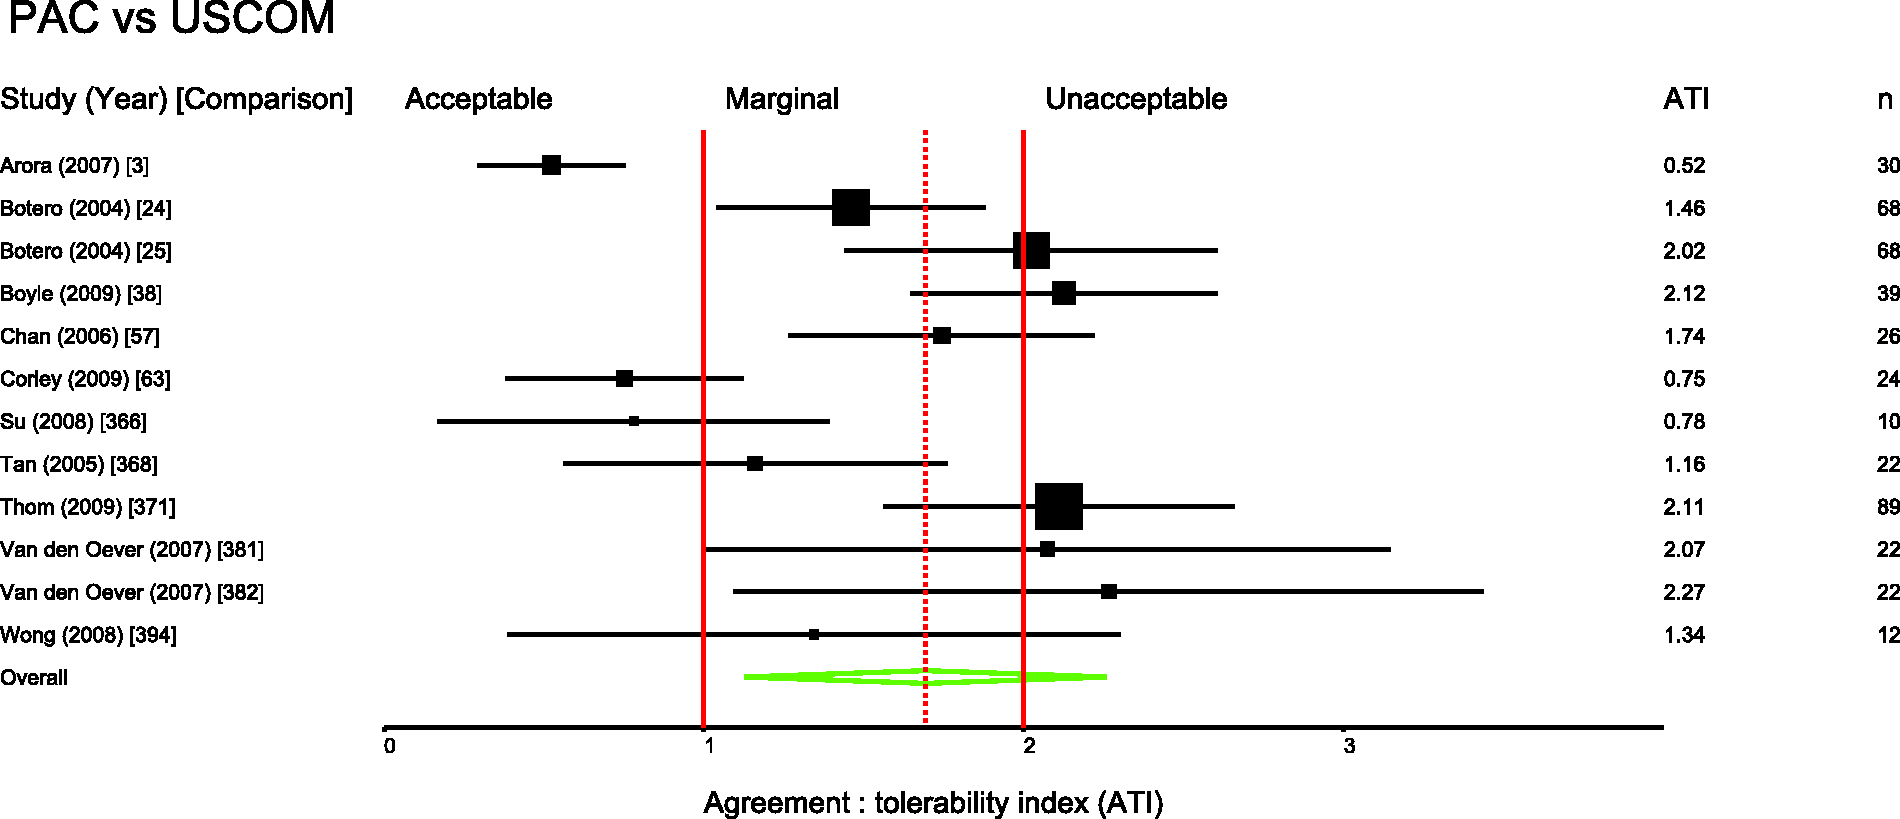
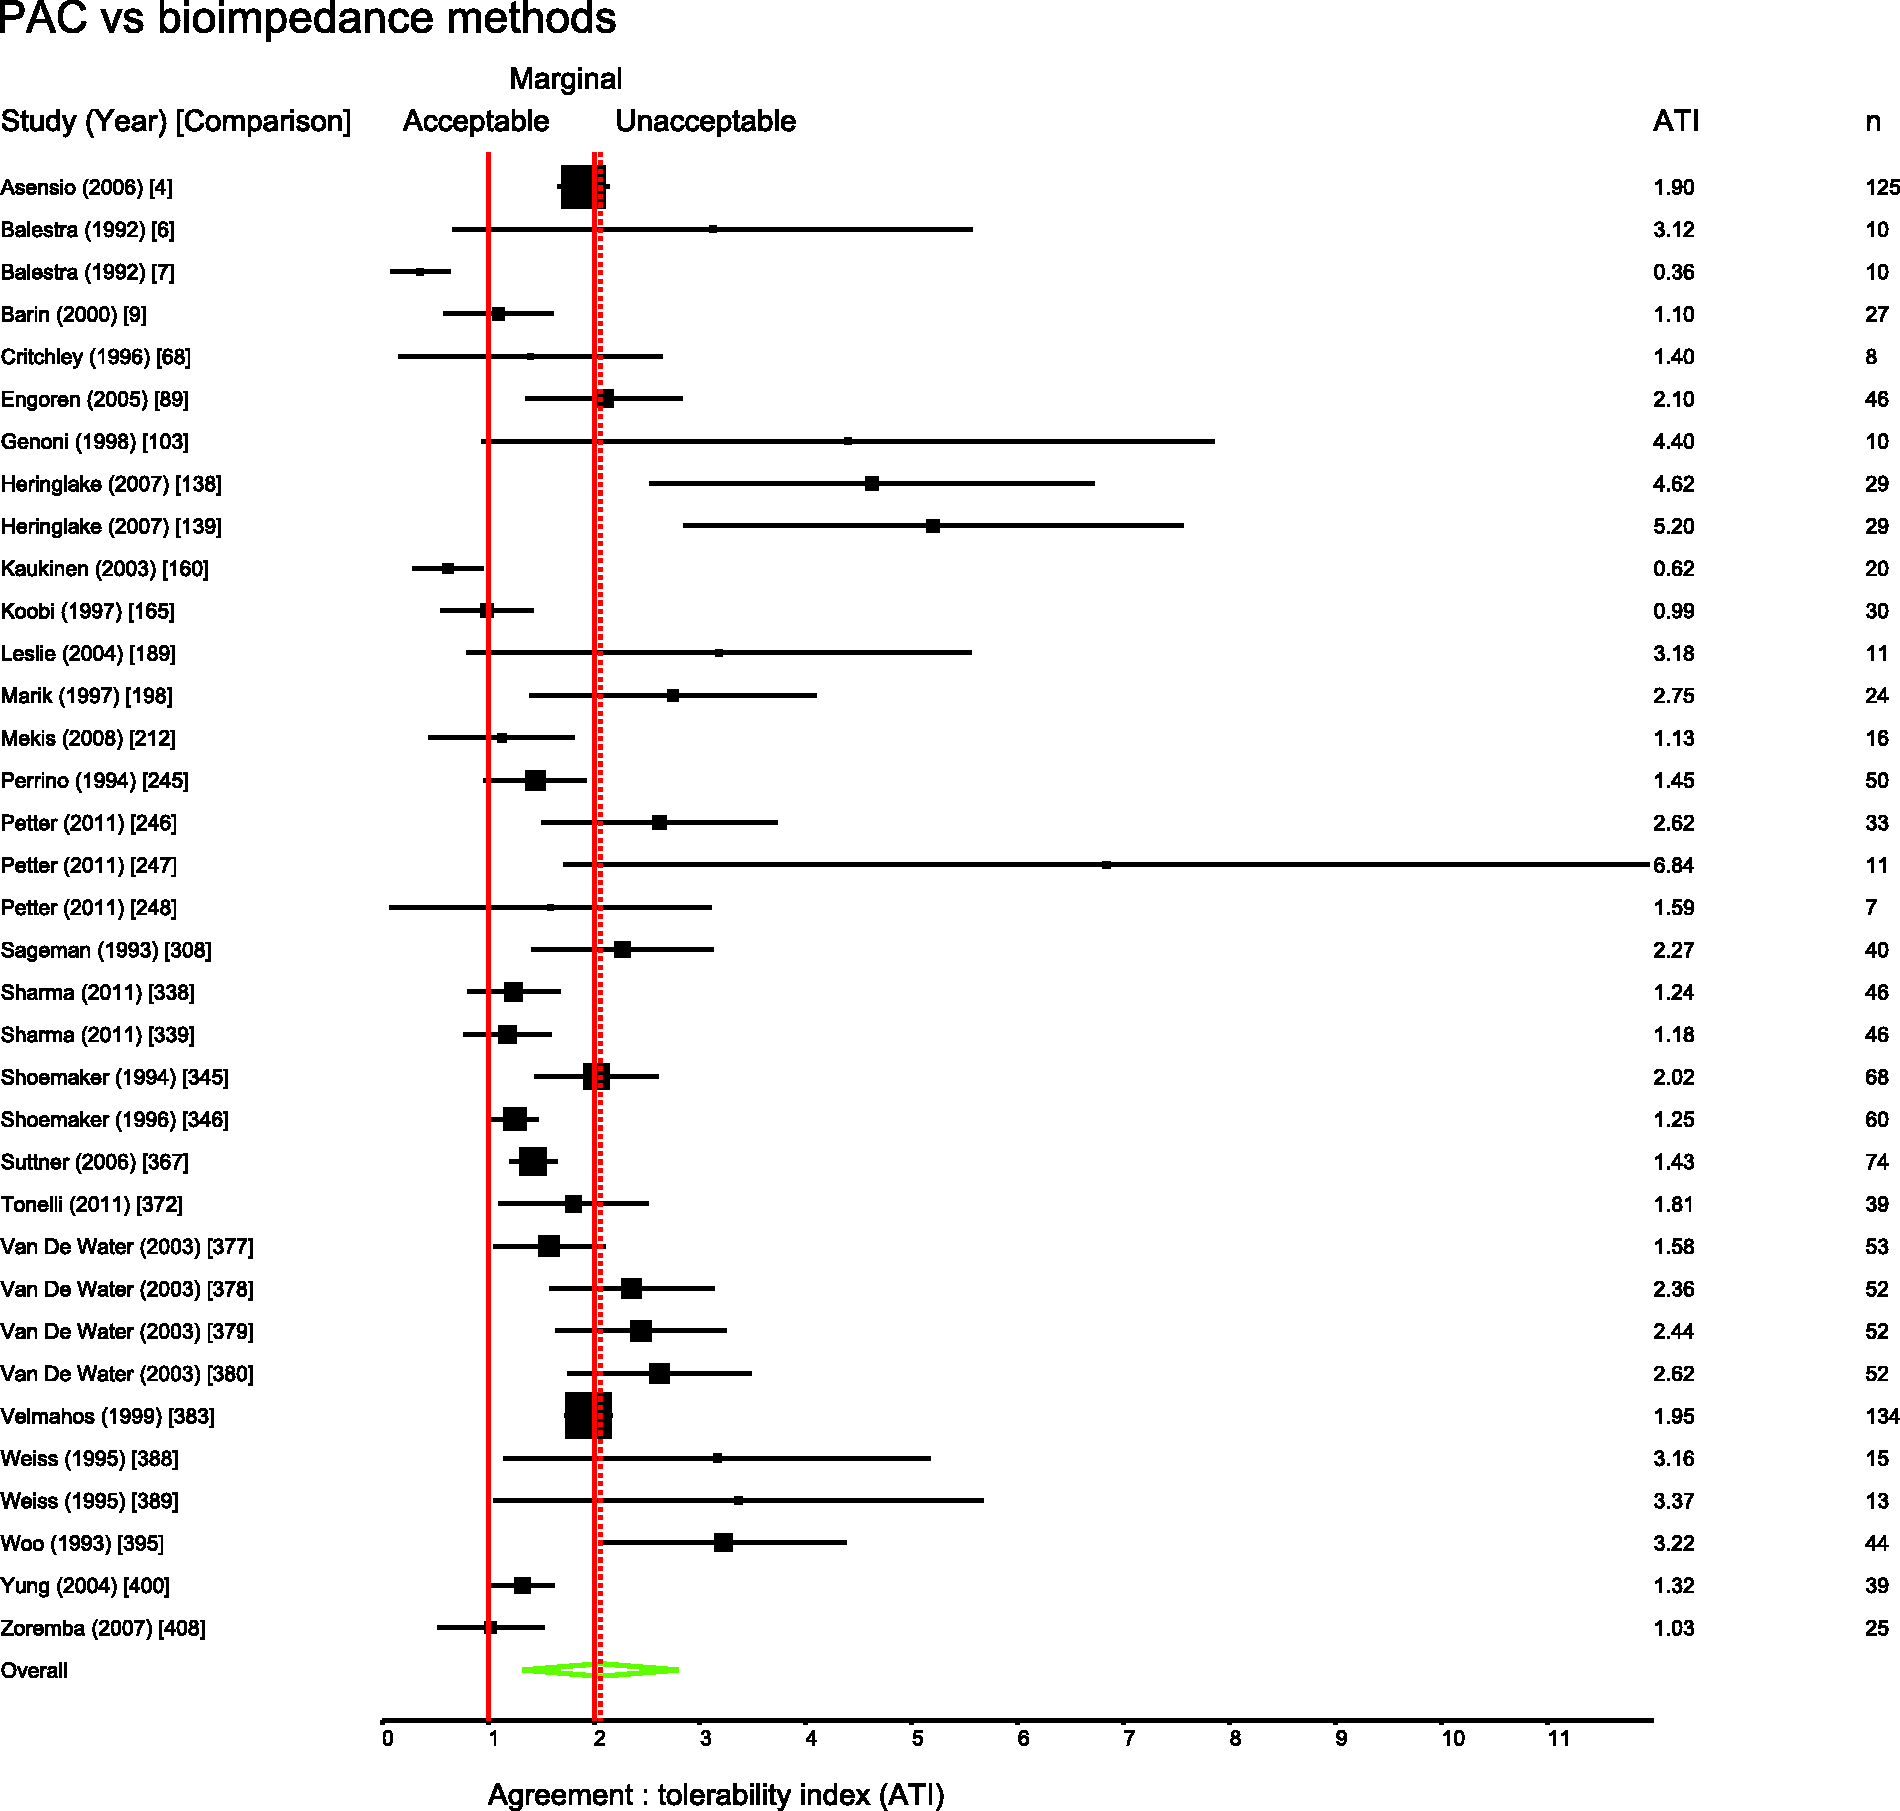
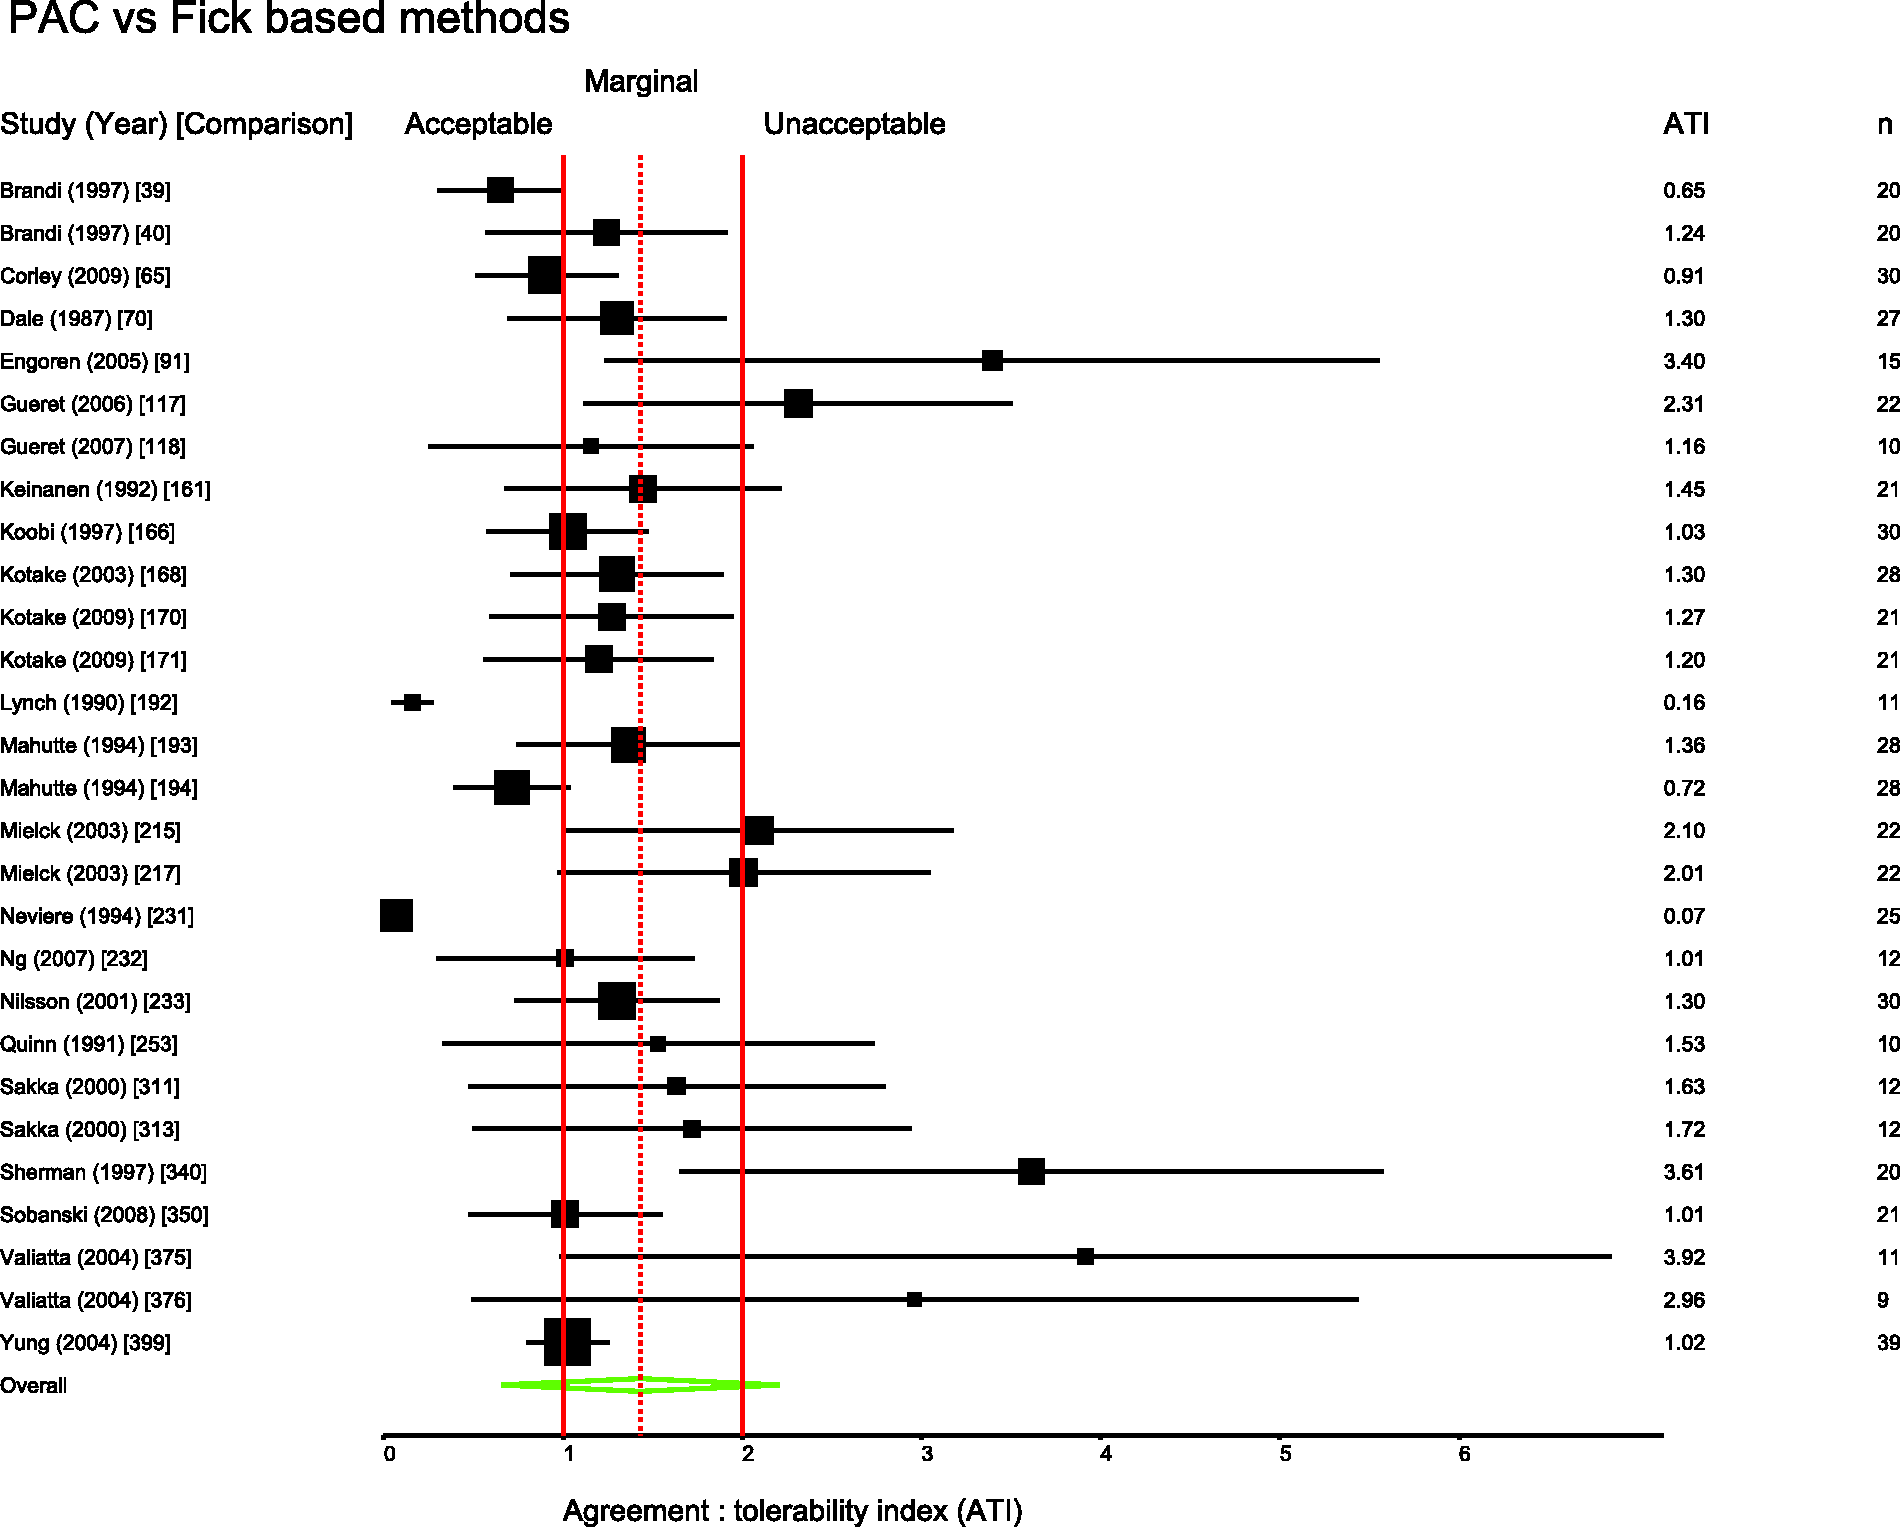
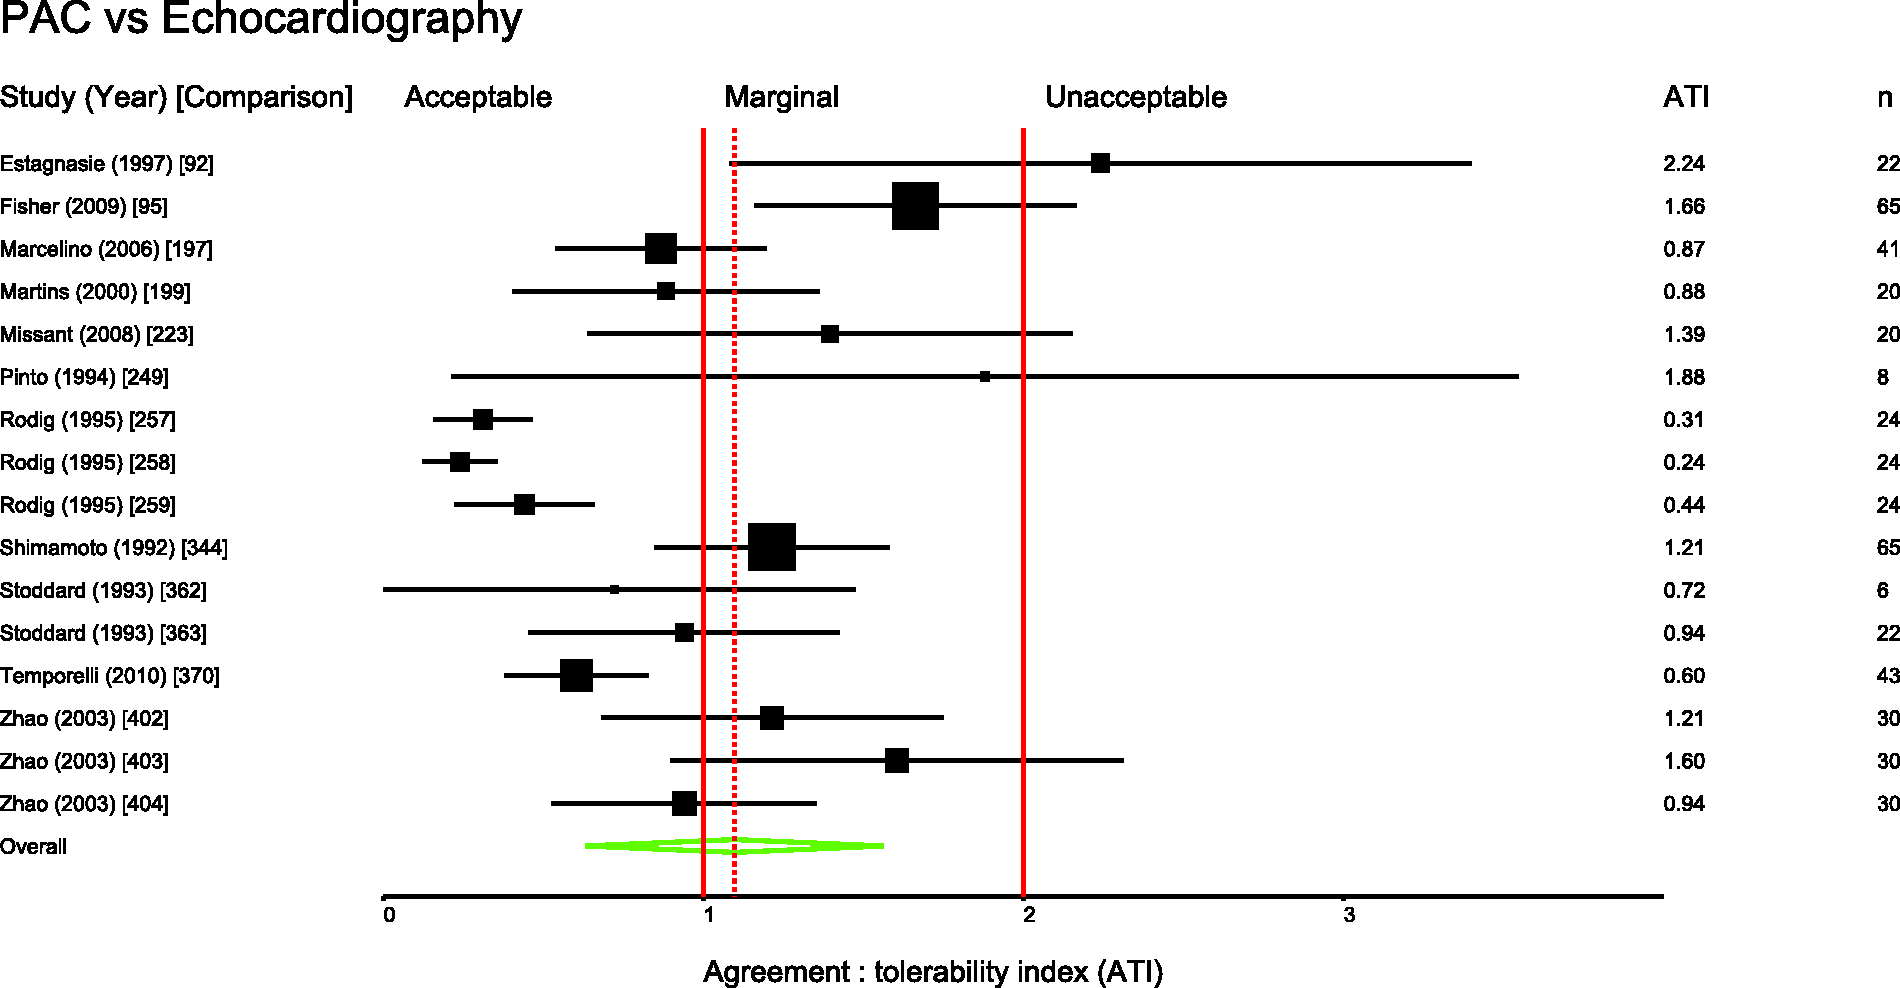
Several pairs of monitoring devices have been frequently compared. Summary ATIs were calculated for 12 of the most common comparisons. These are presented in Table 1. Forest plots for these comparisons are shown in Figures 3 to 11.
Studies comparing bolus and continuous methods of measuring cardiac output via a pulmonary artery catheter. Comparison numbers in square brackets refer to the entry in Table W1 in the supplemental material. Summary agreement:tolerability indices for frequent comparisons. PAC: pulmonary artery catheter. Derived ± percentage errors at the tolerability interval representing the 95% limits of agreement.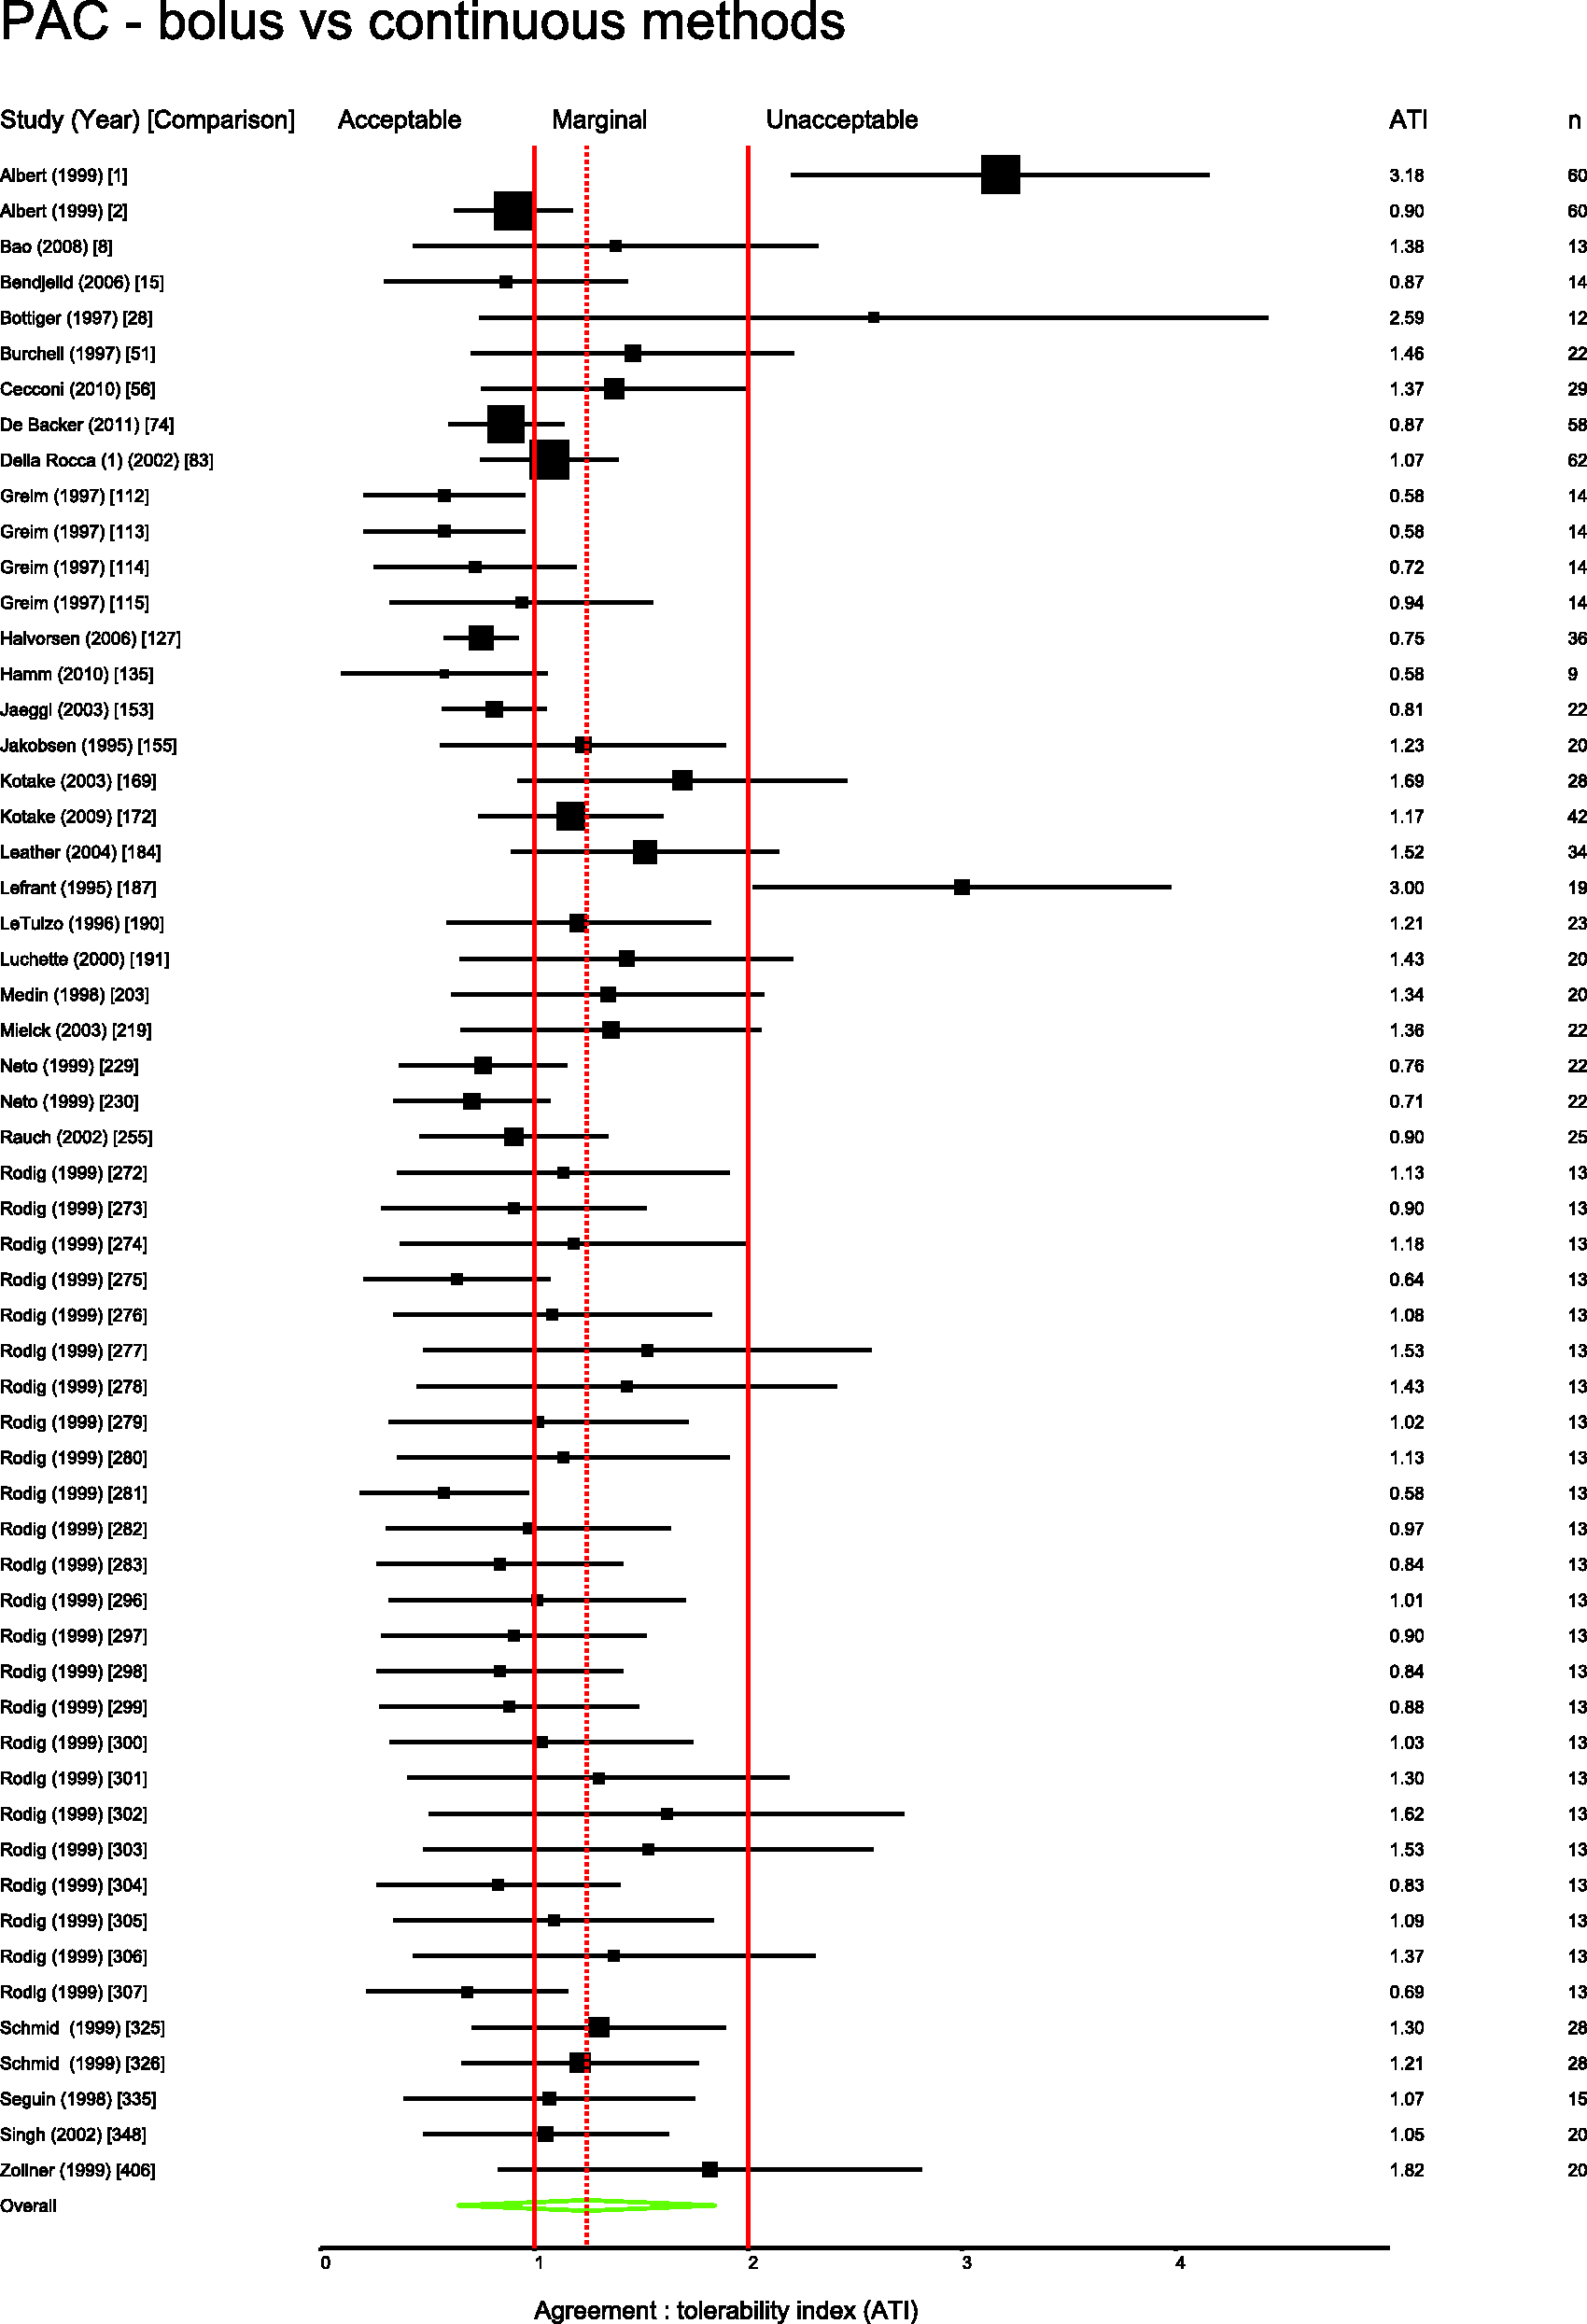
Thirty-one percent of papers (covering 30% of comparisons) gave an a priori definition of agreement. In 188 comparisons, the authors reported positive conclusions, neutral in 111 and negative in 110. The Cohen kappa statistic was 0.89 (P < 0.001) for agreement between the two independent raters of the reported conclusions. ATI was moderately correlated with the conclusions of the authors (Spearman rho = 0.47, P < 0.0001).
Studies comparing PiCCO with PAC. Comparison numbers in square brackets refer to the entry in Table W1 in the supplemental material. Studies comparing FloTrac with PAC. Comparison numbers in square brackets refer to the entry in Table W1 in the supplemental material. Studies comparing LiDCO with PAC. Comparison numbers in square brackets refer to the entry in Table W1 in the supplemental material. Studies comparing oesophageal Doppler with PAC. Comparison numbers in square brackets refer to the entry in Table W1 in the supplemental material. Studies comparing USCOM with PAC. Comparison numbers in square brackets refer to the entry in Table W1 in the supplemental material. Studies comparing bioimpedence techniques with PAC. Comparison numbers in square brackets refer to the entry in Table W1 in the supplemental material. Studies comparing Fick or rebreathing-based techniques with PAC. Comparison numbers in square brackets refer to the entry in Table W1 in the supplemental material. Studies comparing echocardiography with PAC. Comparison numbers in square brackets refer to the entry in Table W1 in the supplemental material.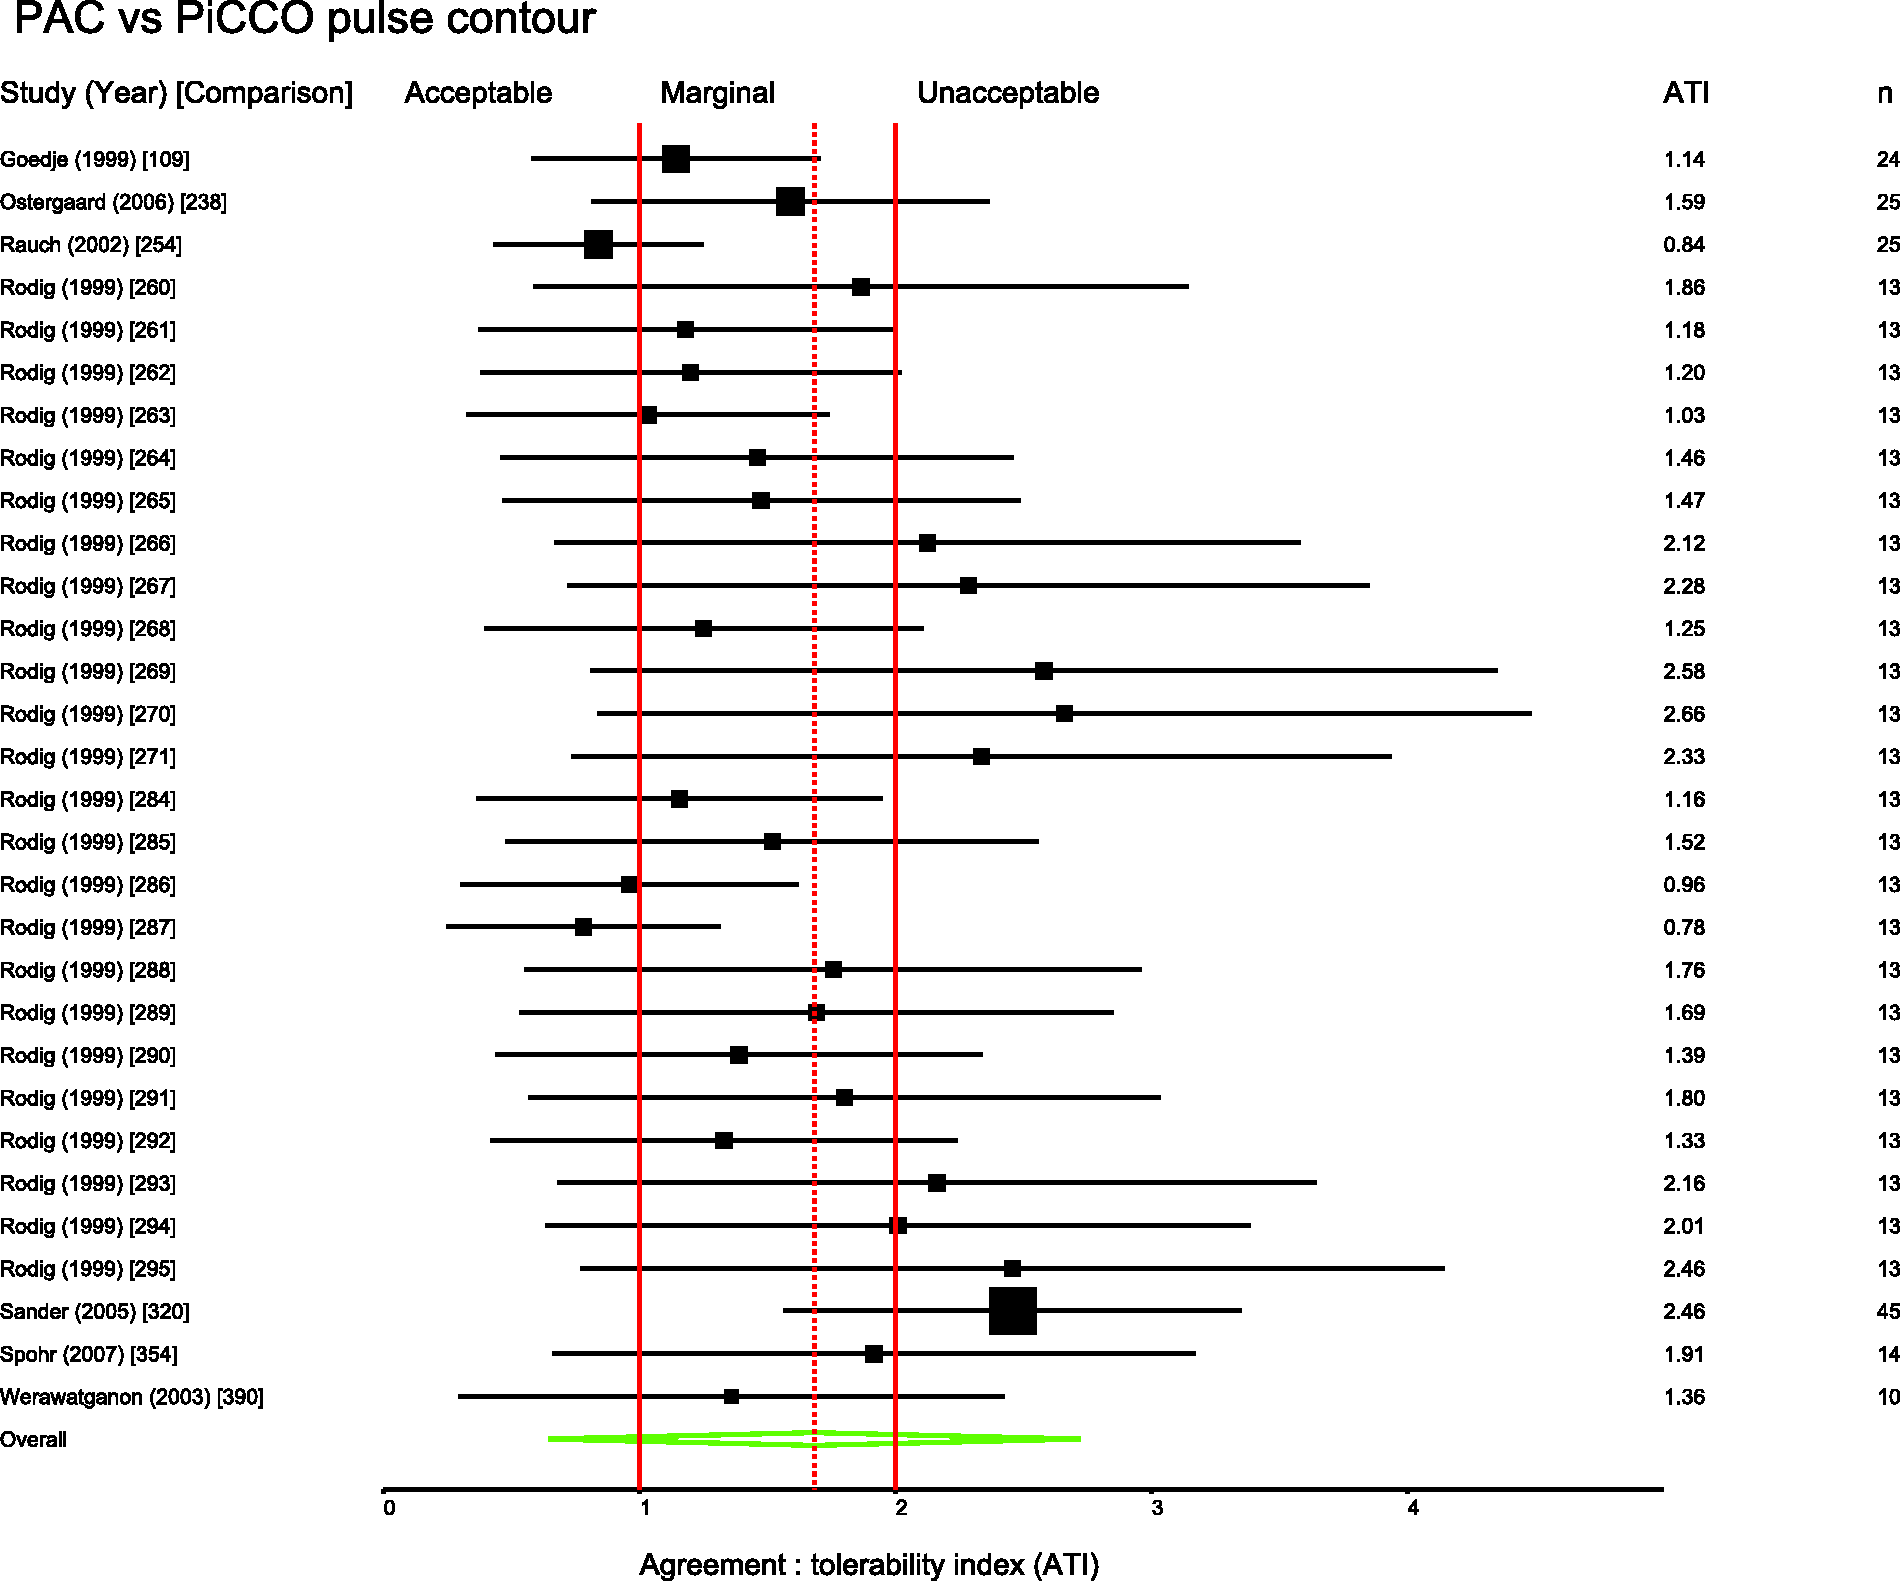
Discussion
Only 31% of authors provide an objective definition of acceptable agreement on which to base their conclusions. This compares to 44% of authors included in the 1999 study by Critchley and Critchley. 3 When the precision of each monitor under study is standardised against a tolerability interval equal to the normal range for cardiac output, there is a high degree of overlap between a monitor considered by authors to be acceptably precise and one that is not. As represented by Figure 2, there is only a moderate correlation (rs = 0.47) between the actual measured precision of a monitor and the likelihood that it will be considered to have clinical utility.
The definition of acceptable precision described by Critchley and Critchley 3 is limited in that it only establishes a new method as having a similar precision to the reference method, without necessarily answering the tricky question of what is required of a monitor when used for guiding clinical decisions. Although their original assumption was that a precision of 20% would be clinically acceptable, this was based on what was seen to be acceptable to ‘most authors at the time’. 12 There is no indication of what level of precision is acceptable to most authors or clinicians today. Peyton and Chong have suggested that a precision of ±45% would be ‘a more realistic expectation of achievable precision in clinical practice’. 13 We suggest that a monitor with precision as low as ±45% would approximately equate to an agreement:tolerability interval of 1.9; at best marginal agreement and closer to the unacceptable threshold that risks extreme-to-extreme misclassifications. As shown in Figure 2, some authors make favourable conclusions regarding monitors that could describe a patient with low cardiac output as having high cardiac output (or vice versa), which seems difficult to justify.
Cecconi et al.
4
have proposed the following for future comparative studies of cardiac output monitors:
The reference technique should be as accurate and precise as possible. The precision of the reference technique should be measured within the study. The bias and limits of agreement between the two techniques should be quoted. The precision of the new tested technique should be calculated.
They also propose that the desired precision of the new technique should be described a priori. We agree with these recommendations and further recommend the definition of acceptable precision as described by Columb
6
where it can be described based on a tolerability interval.
Figures 3 to 11 are forest plots of those studies that used a reference technique of thermodilution via a pulmonary artery catheter. Each figure is categorised by similar modalities or techniques. Table 2 shows a summary statistic for these different categories of monitoring technique, and perhaps suggests a hierarchy of precision. Summing results from a mix of papers with differing study protocols in differing patient populations in this way may not produce a valid assessment of which method performs best in practice and readers should be cautious not to over-interpret these data.
Some clinicians limit their interpretation of cardiac output data to analysis of trends, i.e. paying more attention to changes over time than the absolute values produced. However, although this approach may minimise the effect of bias, it might still be corrupted by low precision. Apparently temporal changes may simply reflect poor precision in measuring physiology that in reality is static. Consensus is limited on the ideal statistical method for assessing a monitor’s performance as a ‘trend-o-meter’. 14 There may also be an argument for using cardiac output monitors as a tool to predict a likely outcome from an intervention. For example, indices used to predict ‘fluid responsiveness’ might give a range of probabilities that an intravenous fluid bolus will result in an increase in cardiac output; 15 low precision of the monitor would contribute to lower predictive value.
The questions ‘what is a monitor for?’ and ‘how well must a monitor perform to be clinically useful?’ still need to be answered in the conduct and analysis of any such study. Ultimately, the ideal study design to assess the utility of a monitor would use a measure that has intrinsic value i.e. a clinically important outcome. Studies such as those demonstrating improved outcomes with the intra-operative use of oesophageal Doppler 16 or pulse contour analysis as part of a goal directed therapy, 17 to some extent, avoid the problems of comparative statistics that we describe. They can recommend the monitor as being successful of itself and not merely in reference to another. However, when reporting studies that seek to compare one cardiac output monitor with another (rather than report clinically significant end-points), authors should define and justify their terms for assessing agreement.
Our study has several important limitations. We have made subjective interpretations of the conclusions of each group of authors, distilling their discussion into a simple label of ‘positive’, ‘neutral’ or ‘negative’. Despite an effort to make unbiased interpretations of the papers, this subjectivity might be a source of error, relying as it does on an individual’s interpretation of another individual’s language. However, the Cohen kappa statistic at 0.89 suggests good concordance between the raters. Our ‘normal range’ definition of an acceptable tolerability interval could also be criticised for being arbitrary. At its most basic, it merely acts as a standard by which to compare the relative precision of monitors. We have also applied a reference range that pertains to a normal resting state, which might not be applicable to some of the clinical situations in the reviewed studies. However, we think it makes some sense that the reference range be considered in any measurement of a physiological variable. Although many authors seem to rely on finding an acceptably small bias, it is the scatter of the differences, as manifested by the 95% limits of agreement, that needs to be formally considered in assessing agreement. A systematic bias can be corrected by simple recalibration. So for the purposes of this report, and simplicity, the bias in the studies has been ignored and only the 95% agreement interval used to assess the agreement. We acknowledge that there will be some relevant data that has not been gathered through the process of the literature search; so, as our search was limited to English language reports only, our conclusions can only apply to these. However, we suggest that there are enough data to be broadly representative.
It was not practical to formally check that variance was constant across the range of included cardiac outputs in each study as the raw data would be required to verify and to transform as required. If variance is not constant for a particular study, then the ATI, being an average measure, may conceal poorer performance of the monitor at extreme values (particularly low values) of cardiac output. Many included studies took several readings of cardiac output from each subject with each method of measuring cardiac output. This can also result in a lower variance in the study than would have been the case if all the readings with a particular monitor came from different individuals. In an attempt to adjust for this, we used a weighting system based on the number of study participants to produce the summary ATIs, rather than the more conventional random effects model based on the inverse of the variance. In addition, as expected there was considerable methodological and statistical heterogeneity in the studies, as can easily be observed in the forest plots. So although we have presented summary weighted ATIs for various comparisons, these are presented for guidance only.
Conclusion
Comparative studies of cardiac output monitors are still not universally providing an a priori definition of acceptable precision on which to base conclusions and a tolerability interval approach may be useful. There is only a moderate correlation between the precision of cardiac output monitors and the opinions of the authors regarding clinical agreement.
Footnotes
Acknowledgement
Parts of this review were presented as poster presentations at 12th EBPOM: Congress in Evidence-Based Perioperative Medicine, 3–4 July 2013, London.
Declaration of conflicting interests
The authors declared no potential conflicts of interest with respect to the research, authorship, and/or publication of this article.
Funding
The authors received no financial support for the research, authorship, and/or publication of this article.