
Abstract
Traditionally, assessment of the cardiac output has been limited to theatre or the intensive care unit. However, non-invasive cardiac output estimation is now readily available, and its application may have wider benefit in the emergency setting. The non-invasive ultrasonic cardiac output monitor (USCOM) was investigated to determine its learning curve and inter-rater reliability. Four trainee operators each performed stroke volume measurements on 25 volunteers, compared to an experienced operator pre- and post-passive leg raise. Inter-rater reliability was then assessed on 24 acute emergency in-patients. Mean percentage difference in stroke volume decreased from 19% (95% confidence intervals 14–23) across volunteers 1–5, to 6% (4–8) for the last 5 volunteers scanned. Consequently, on acute emergency in-patients, excellent inter-rater reliability (Lin’s concordance correlation coefficient (ρc) 0.96 (0.92–0.98)) and agreement of a change ≥10% in stroke volume following passive leg raise on 23/24 cases were found. Following a training period of less than 5 h, USCOM stroke volume measurements demonstrated excellent inter-rater reliability.
Introduction
Basic haemodynamic parameters (such as blood pressure), examination, imaging (chest X-ray), functional measures of organ perfusion (such as urine output) and the central venous pressure are routinely used to guide therapy, but do not accurately predict volume status or responsiveness.1–3 Given that injudicious fluid usage leading to volume overload is associated with increased morbidity and mortality,4,5 measures that may prevent this should be explored. Titrating fluid resuscitation guided by stroke volume (SV) changes reflects physiological response.1,3,6 Using such a goal-directed approach has been shown to reduce morbidity and hospital length of stay in patients undergoing surgery, 7 though recent trials have raised questions around the approach.8–11 Non-invasive cardiac output (CO) devices are now available that may have wider utility. For instance, in the first few hours of hospital attendance, when managing haemodynamic instability may be of greatest importance, or on a ward without access to invasive devices.
The Doppler equation has been applied to measure blood flow for over half a century. The Ultrasonic Cardiac Output Monitor (USCOM 1A, Uscom Ltd., Sydney, NSW, Australia) is a non-invasive continuous wave (CW) Doppler ultrasound device. CW Doppler has an accuracy measured by Doppler string phantoms of ±2.3%. 12 Placed in the supra-sternal notch, the USCOM measures Doppler flow at the aortic valve and determines this over a cardiac cycle (the velocity time integral (VTI)). SV is calculated by multiplying the VTI by an estimate of valve cross-sectional area, determined by applying height-indexed regression equations (if the valve area is known this can be manually imputed). 13 USCOM has been compared positively with the gold standard measurement of CO, the aortic flow probe, in animals14,15 and in externally driven artificial hearts in orthotopic transplantation with the pulmonary artery catheter. 16 For such a device to be useful clinically, it must be accurate, precise, detect significant directional changes and be reliable. 17
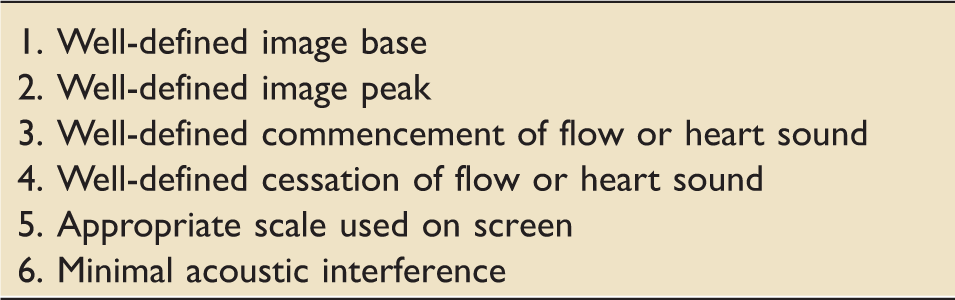
Freemantle criteria (out of six) to assess image quality using the USCOM device from Dey & Sprivulis. 22
The two objectives of this study were to document the learning curve for the USCOM device for novice operators (doctors in training), assessed against an experienced operator, using volunteers (including a PLR); secondly to assess inter-rater reliability, whilst performing a PLR, on acute hospital patients.
Methods
This observational single-centre study was conducted at a District General Hospital in the UK. A favourable opinion was received from the North West Preston Ethics Committee (REC reference 13/NW/0437). Informed written consent was obtained. Patients were excluded if under 18 years, or if they had a history of valvular disease or significant dysrhythmias. The two-part nature of the study is outlined in Figure 1.
Study flow chart. Part A: learning curve assessed with n = 4 trainees, n = 25 volunteers. Part B: inter-rater reliability on 24 in-patients.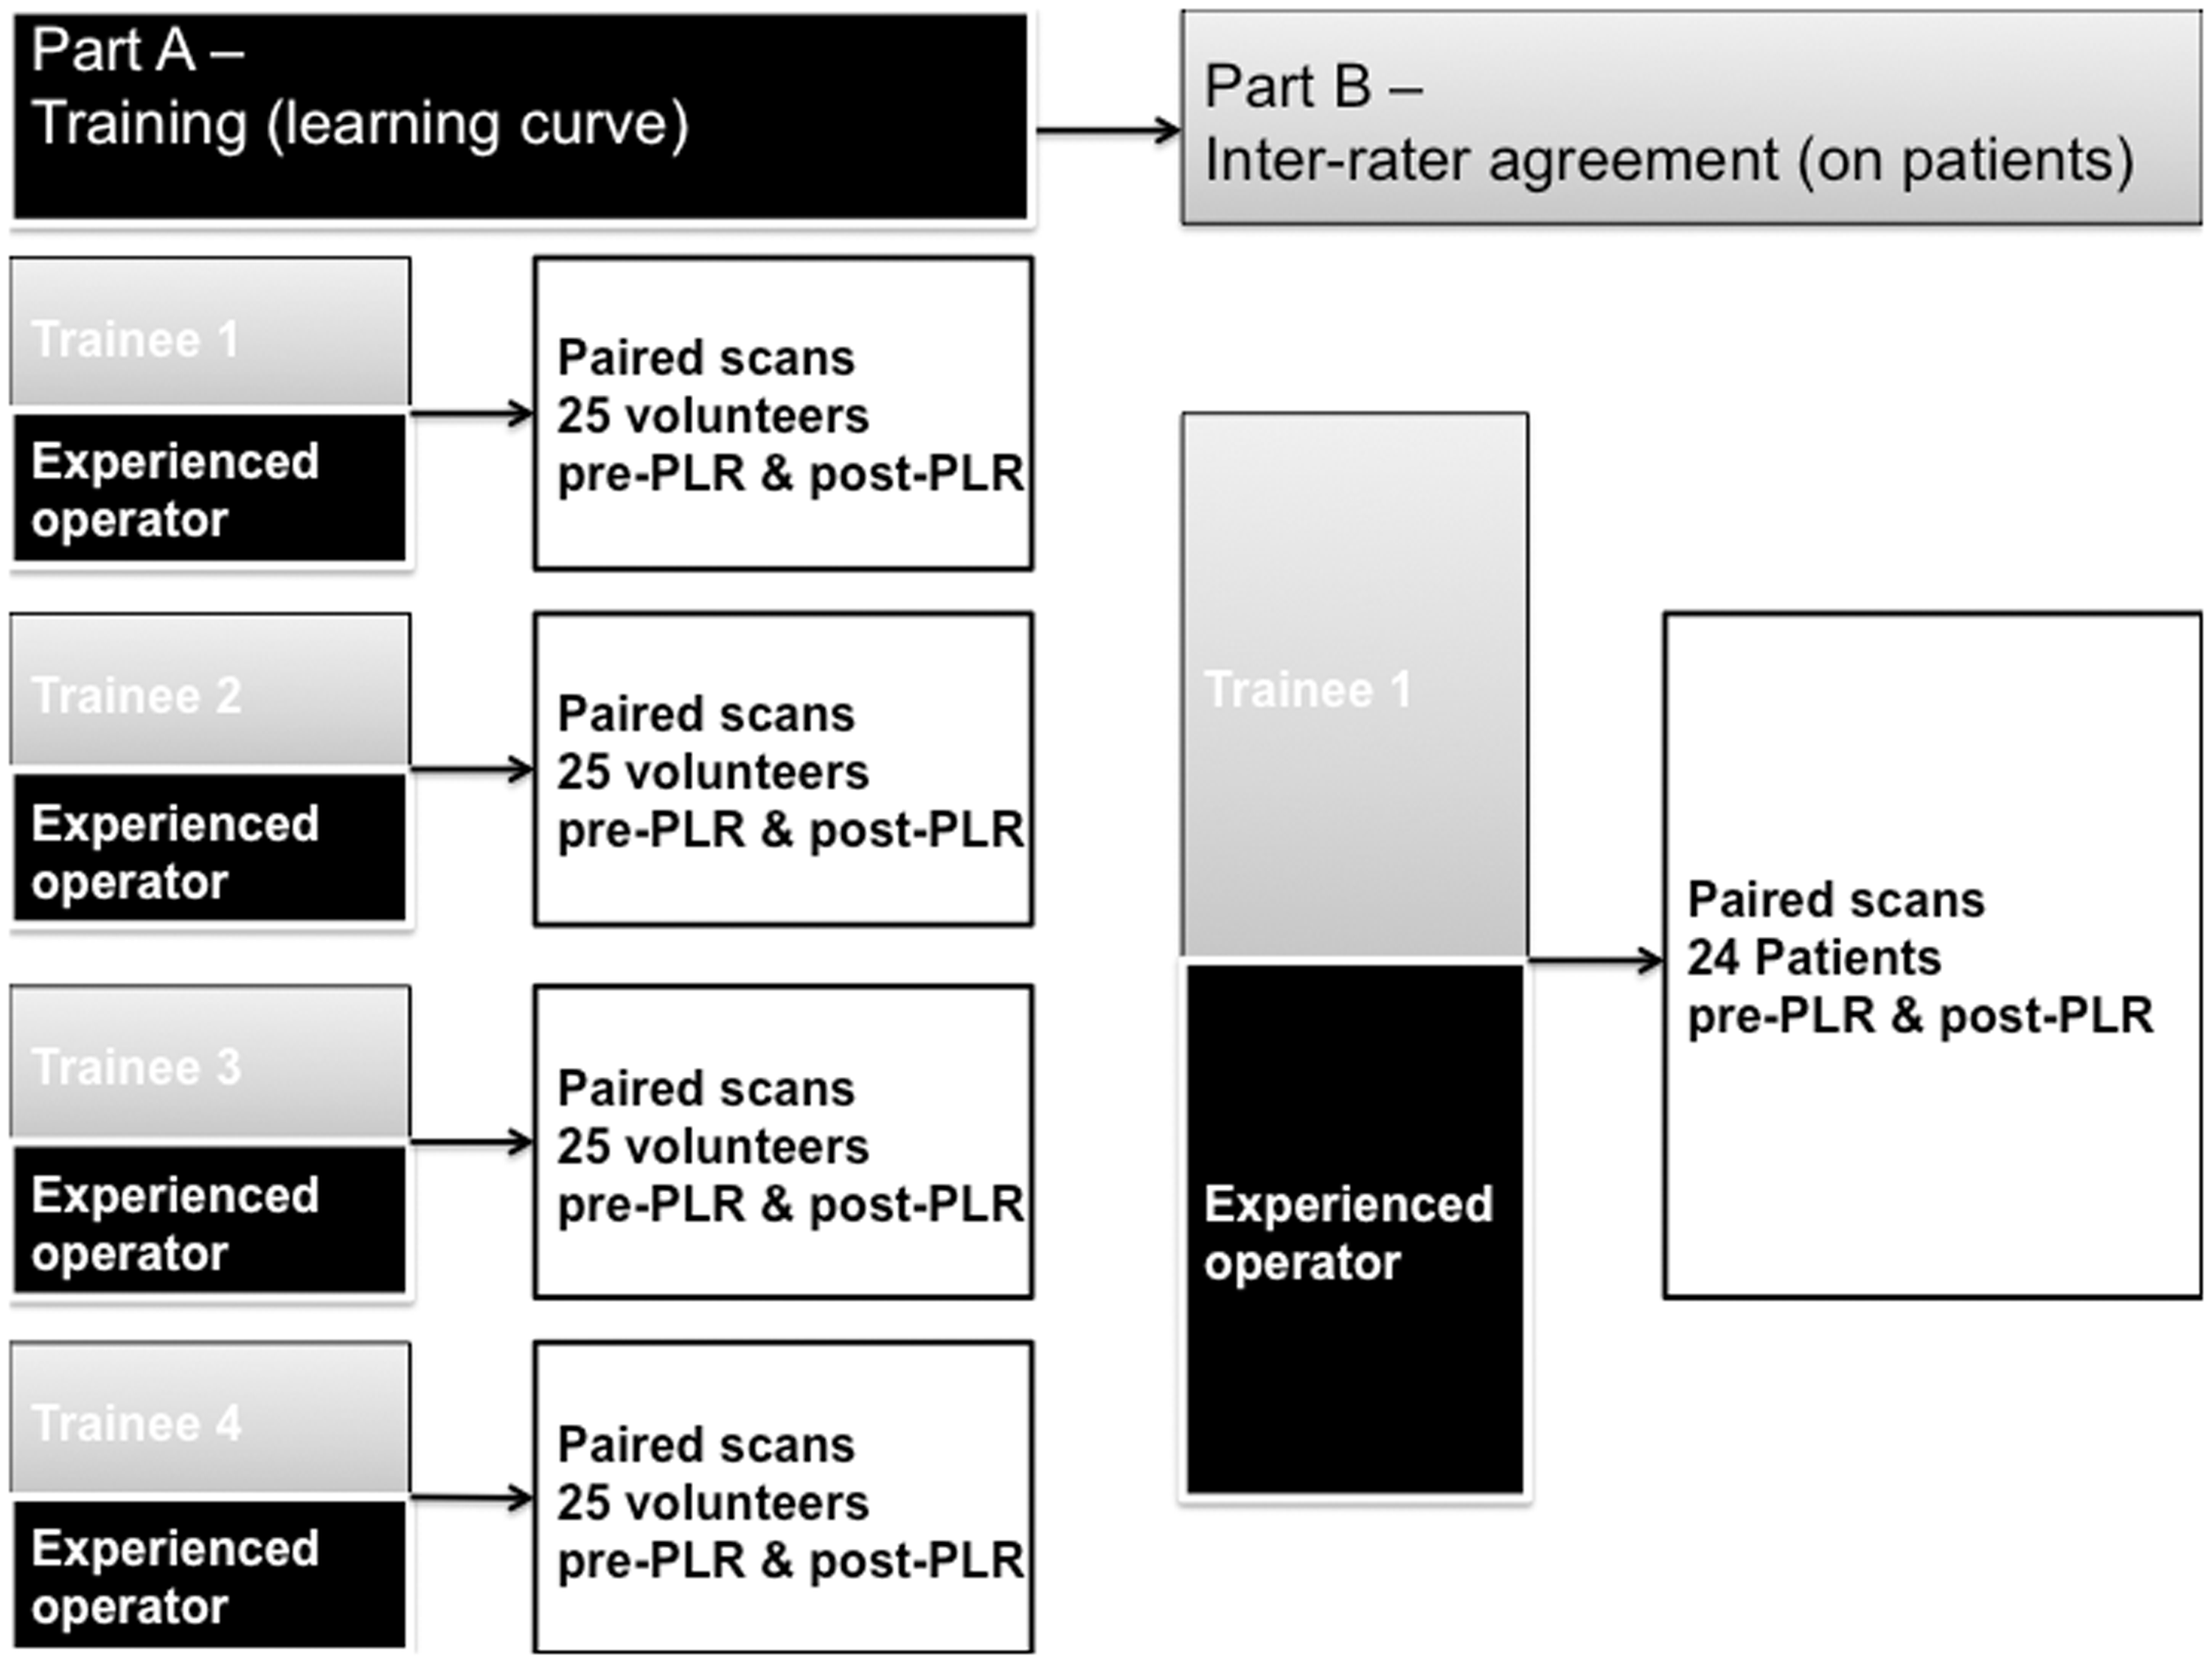
Learning curve
The learning curve was assessed using four trainee operators (4–6 years post-medical qualification), who were initially given a 30-min lecture of how to use the device, including a review of the basic physics of ultrasound and the CW Doppler technique. A priori, for clinical usefulness, an inter-rater difference of 5% was felt to represent acceptably close agreement, taking into account normal beat-to-beat changes in SV. Each trainee gained SV values pre- and post-PLR on healthy volunteers (n = 100, mean age 40, range 18–65), in a stepwise, blinded fashion, alongside an experienced operator (>200 scans performed). Sample size was based on the previous documentation of a learning curve of 20 scans 21 – as the study also involved a PLR, it was decided to enlist 25 volunteers for each novice operator, to provide in total 50 scans (25 pre- and post-PLR). Each reading was performed with the full focusing technique with the Doppler flow profile held steady for a 7.5 second sweep. Aberrant flow profile outlines on visual inspection were rejected, and scans scored according to the Freemantle criteria (Table 1). 21
In an iterative process, the trainee was given feedback on image optimisation following each pair of readings. In all, 100 healthy volunteers were scanned, providing 200 paired readings. Different volunteers were used to train each trainee due to resource availability. For the PLR, a subject is placed semi-recumbent for 3 min, then supine with the legs elevated to 45°. Total training time including data collection pre- and post-PLR on 25 volunteers by the two personnel, took 4–5 h.
Inter-rater reliability
This part of the study assessed inter-rater agreement for absolute SV as well as detection of a ≥10% change (Δ) in SV induced by PLR. There is no consensus on what constitutes a significant Δ following PLR, or Δ in SV following volume expansion to conclude a patient is fluid ‘responsive’. However, most studies and expert recommendations use a cut-off between 10% and 15%.6,28–30 For example, in a study by Monnet et al., 31 a Δ10% induced by PLR best predicted their definition of a significant Δ in SV – in this case, a Δ15% in SV following volume expansion. Pre- and post-PLR scans were performed, in a blinded fashion, on 24 in-patients (mean age 55, range 22–88; 15 male, 9 female) on acute medical and surgical wards, by one newly trained operator and the experienced operator. Both operators were blinded to the patients’ diagnosis and history. As in a previous study 22 (with a similar sample size), only one of the four trainees participated, as it was felt that including more would be too onerous for patients, and there was limited availability of trainees to take part concurrently.
Statistics
A wide range of statistical techniques have been described to assess the learning curve in clinical situations, though none have been described in reference to the USCOM.32,33 Mean percentage difference in SV measurements obtained by the paired trainee, compared to the experienced operator pre- and post-PLR, was calculated on each volunteer scanned. Following this, a linear model with 95% confidence intervals was fitted to the data, in an attempt to visually demonstrate convergence in the mean percentage differences around the fitted line as the number of scans (and experience) increased.
The experienced operator was taken to represent the gold standard for SV values using the device, over the course of the scans. The concordance correlation coefficient (ρc) proposed by Lin 34 for assessment of concordance in continuous data avoids the shortcomings associated with a number of alternative procedures, including Pearson correlation coefficient r, paired t-tests, coefficient of variation and intra-class correlation coefficient. It is said to be robust on as few as 10 pairs of data. This technique was used to compare each trainee, with the experienced operator, during scans on the first five and last five volunteers and subsequently to assess inter-rater reliability on patients. 34 A value of one denotes perfect concordance; a value of zero denotes complete absence. Ease of assessment and the Fremantle score were also recorded.
All data were imported into an Excel™ spreadsheet (Microsoft, Redmond, WA, USA) used to calculate mean differences. All other statistical analyses were performed using the open source statistical package R (GNU project, R Foundation for Statistical Computing, Vienna, Austria).
Results
Learning curve
During training, across 25 volunteers, mean percentage difference in SV readings (n = 200) between novice trainees (n = 4) and experienced operator decreased significantly from 19% (95% confidence intervals 14–23) during scans 1–5, to 5.9% (4–8) for the last five volunteers (Figure 2). Lin’s concordance correlation coefficient (ρc) increased from 0.75 (0.62 to 0.84) for the first five volunteers to 0.91 (0.85 to 0.95) for the scans from volunteers 21–25.
Learning curve on 25 volunteers (50 scans – 25 pre- PLR and 25 post-PLR). Mean percentage difference SV values between trainees (n = 4) and experienced operator decreased significantly from 19% (95% confidence intervals 14–23) during scans 1–5, to 5.9% (4–8) for the last five volunteers during training. The shaded area represents the 95% confidence interval. PLR = passive leg raise. SV = stroke volume.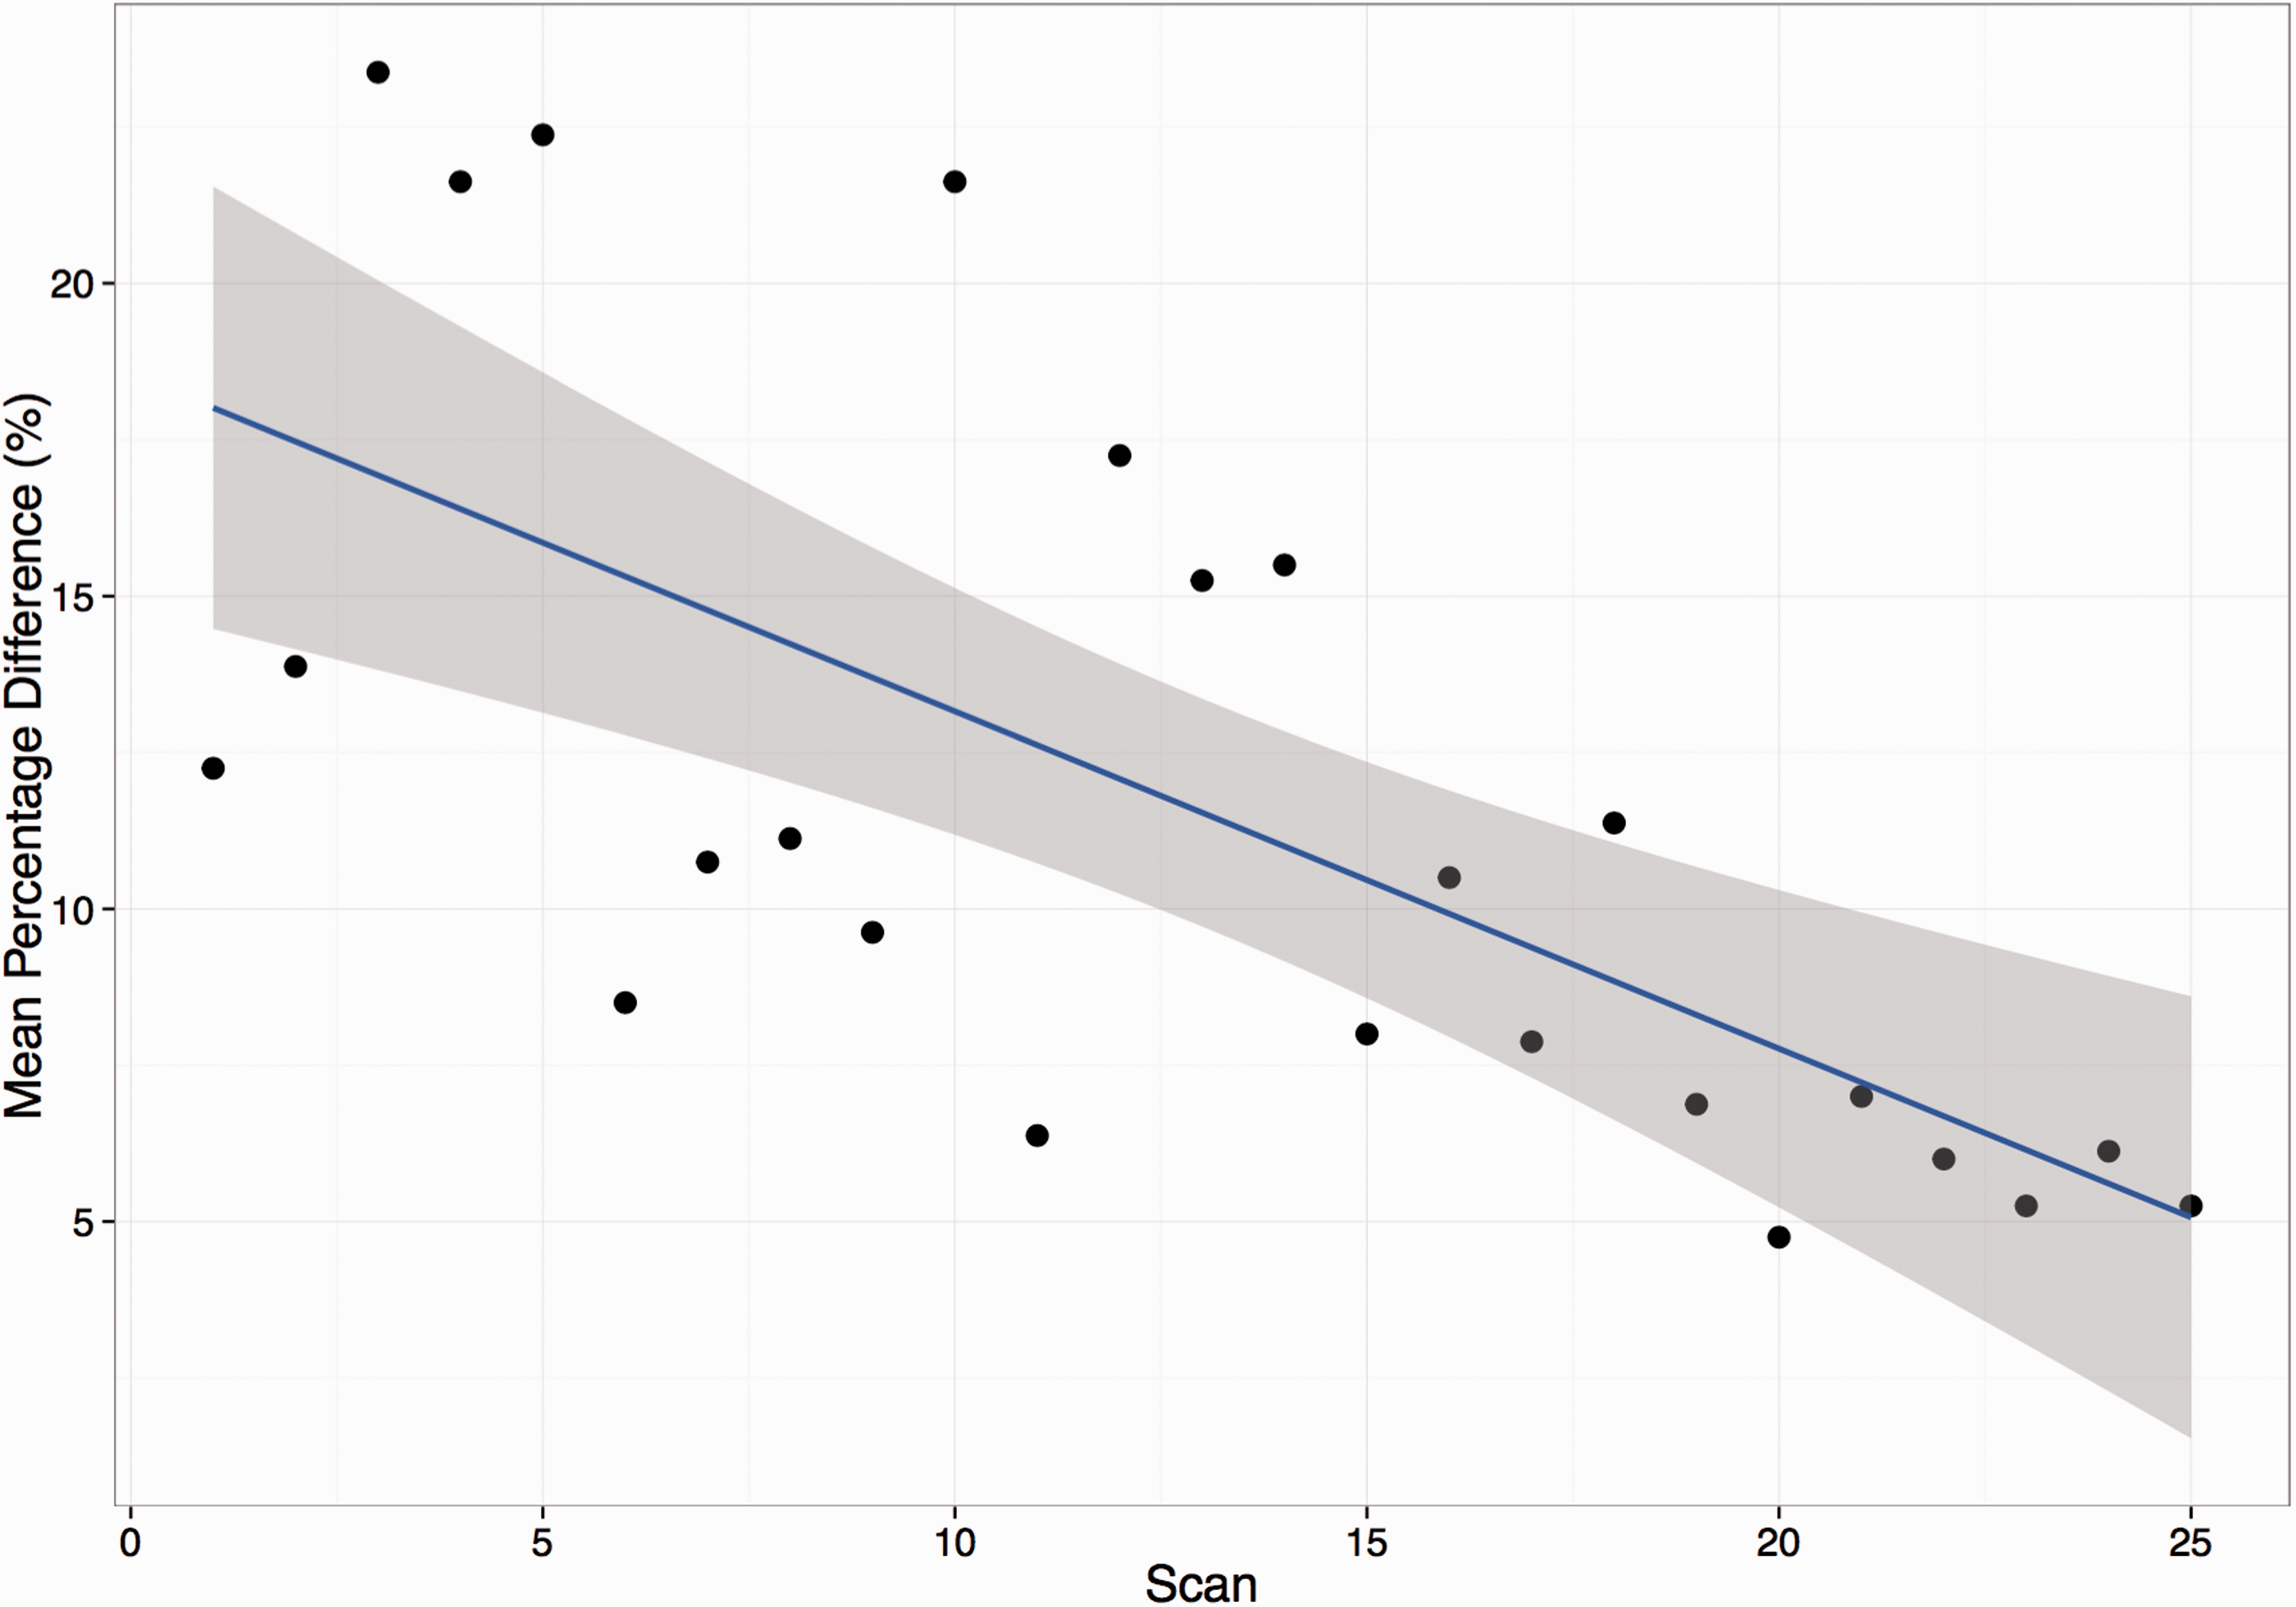
Inter-rater reliability
Inter-rater reliability was assessed on 24 patients pre- and post-PLR. Mean SV pre-PLR was 61 ml (54–67) for the experienced operator and 59 ml (53–66) for the newly trained operator; mean percentage difference in SV between operators was 5.8%. Post-PLR SV values were 76 ml (68–83) and 74 ml (66–82), respectively, with a mean percentage difference of 4.8%. Across all of the patient scans, Lin’s concordance correlation coefficient (ρc) was 0.96 (0.92–0.98) (Figure 3). On 23/24 occasions, the two operators agreed as to whether a PLR had produced a ≥10% increase in SV. Four of the patients did not significantly increase SV with a PLR, all with a history of cardiac disease. Freemantle score for image quality was ≥4/6 for all 24 patients, with 83% scoring ≥5/6.
Inter-rater agreement – absolute SV values pre- and post-PLR on 24 patients, between a newly trained and experienced operator. Lin’s concordance correlation coefficient (ρc) 0.96 (95% confidence intervals 0.92–0.98). PLR = passive leg raise. SV = stroke volume.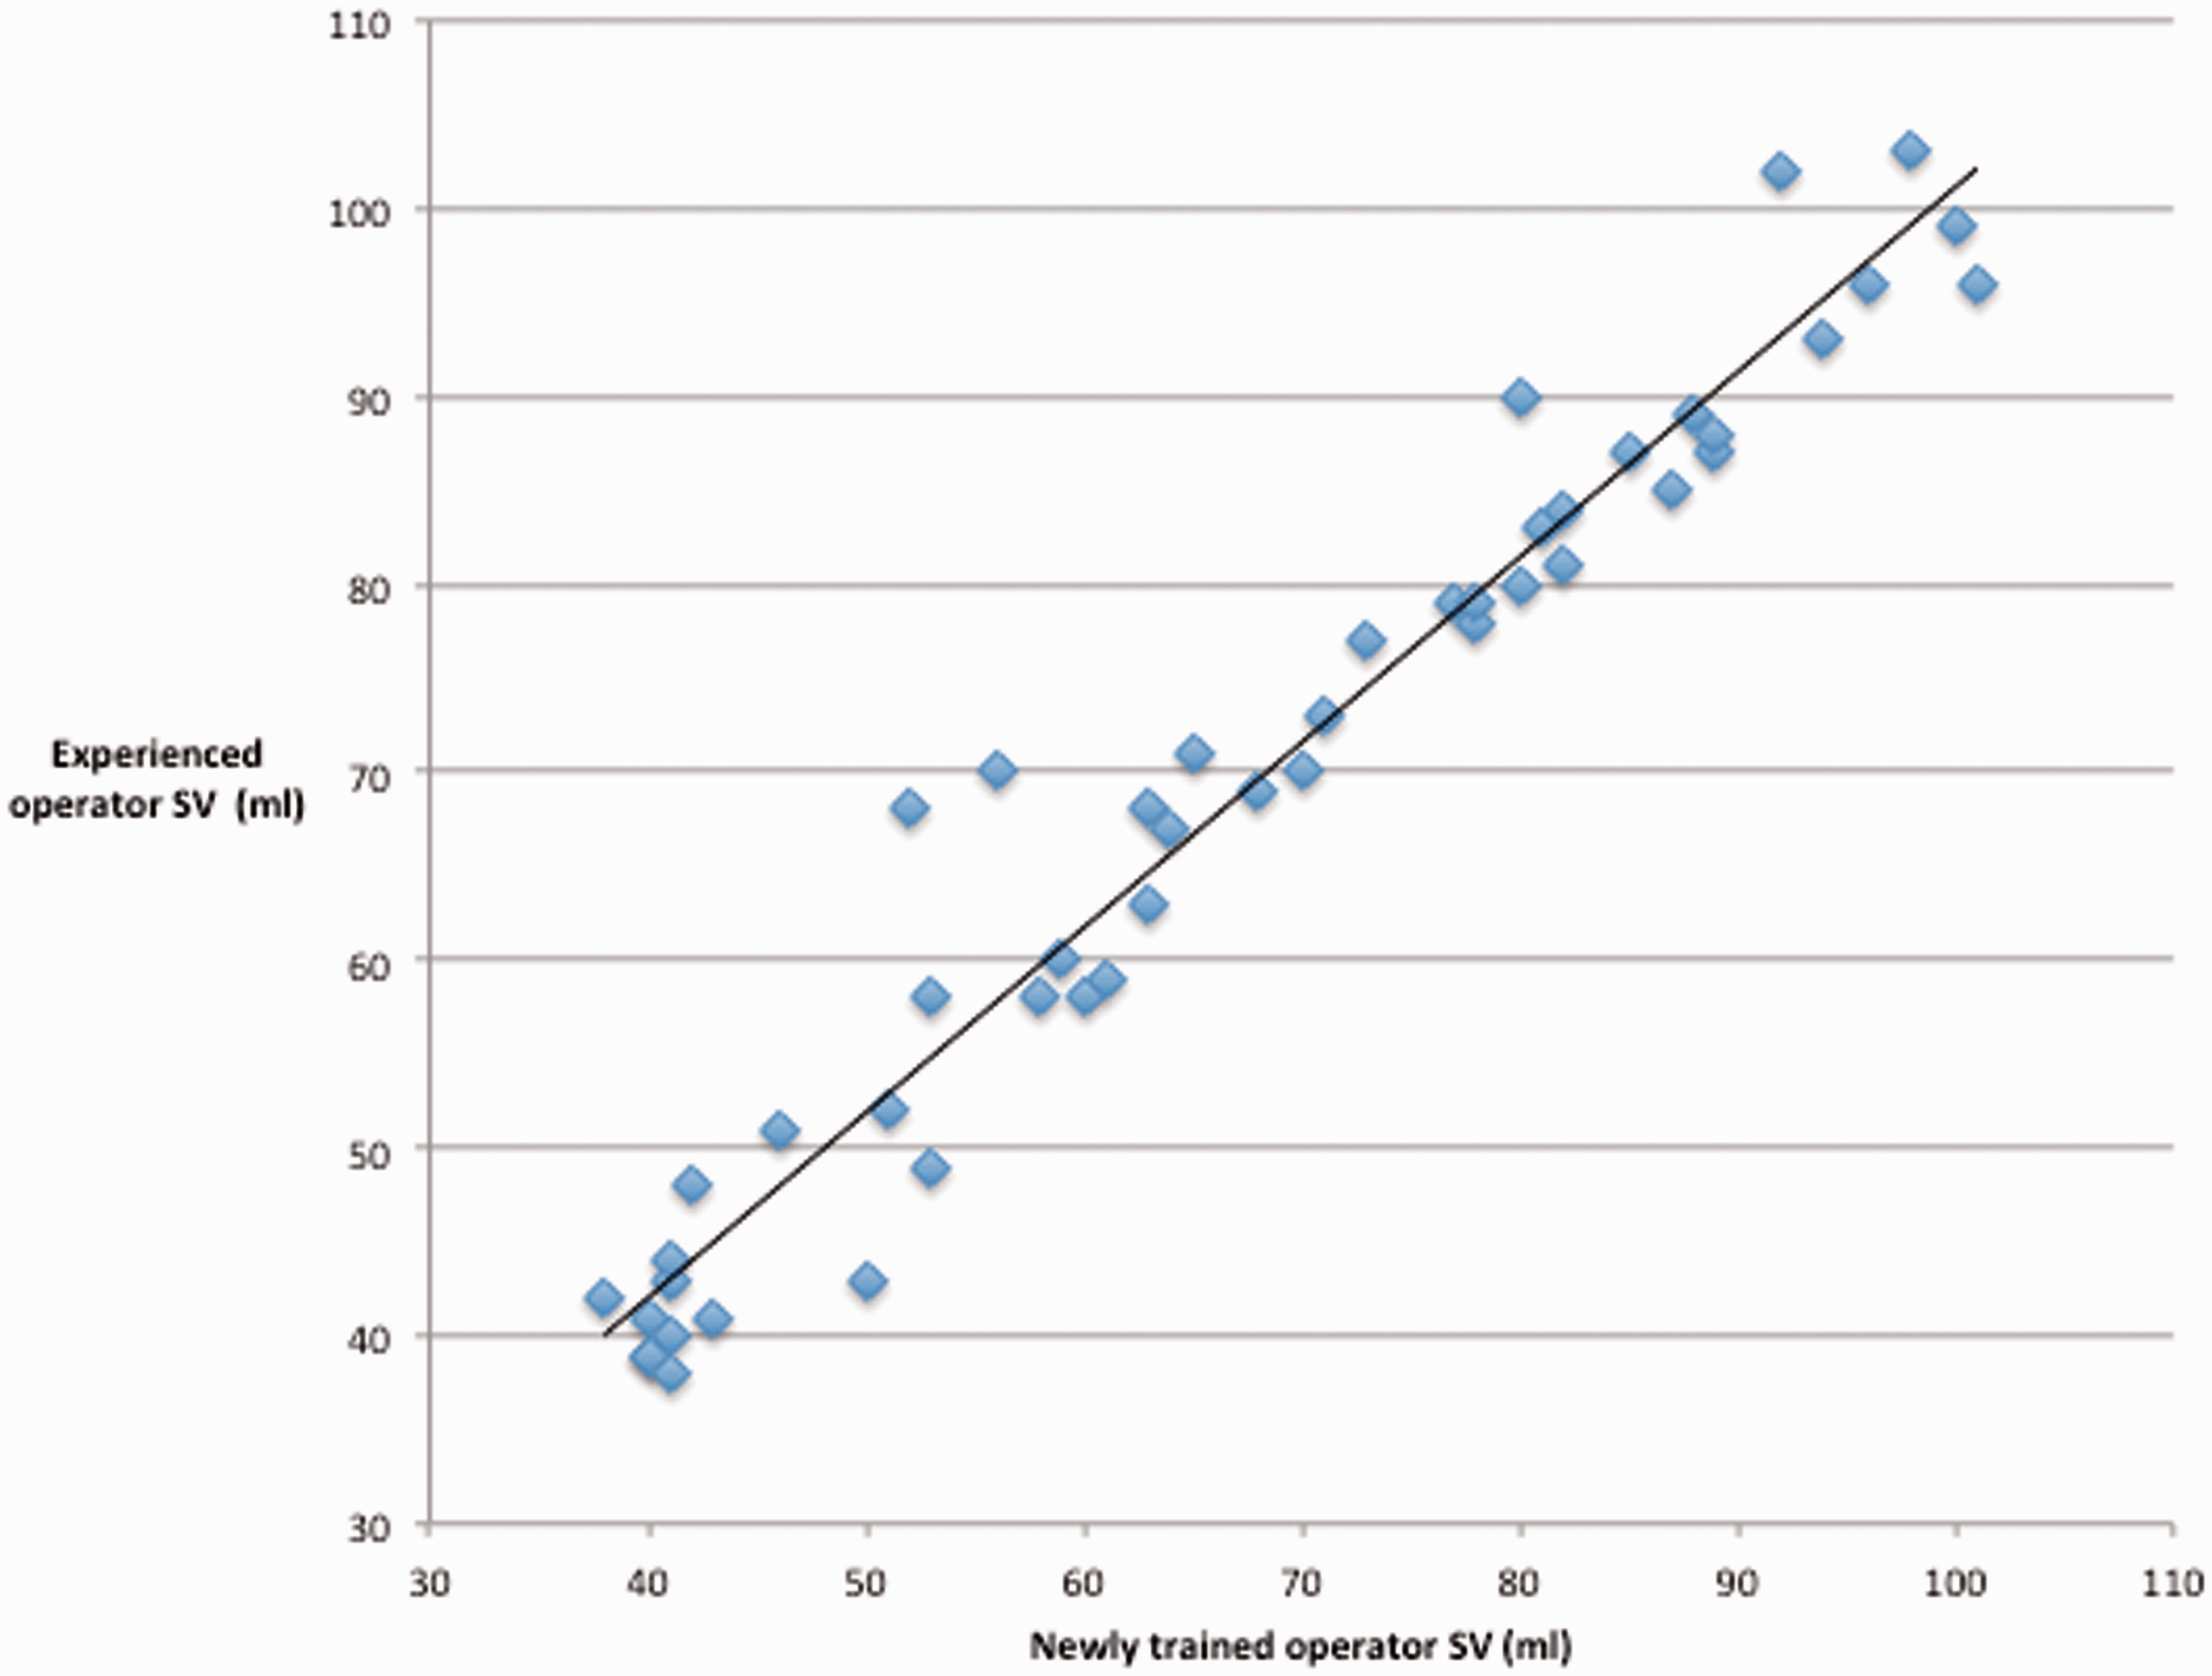
Discussion
Existing inter-rater studies.
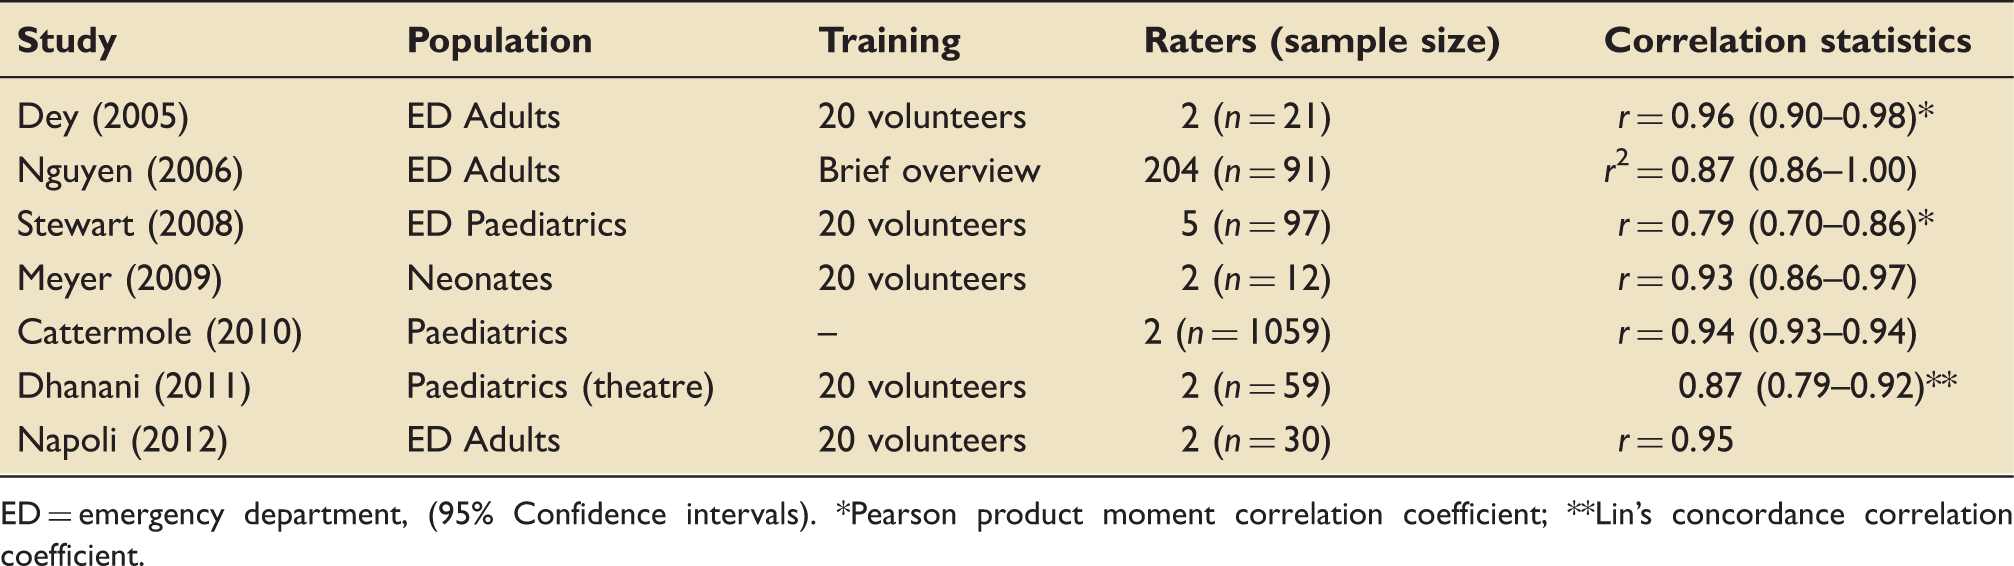
ED = emergency department, (95% Confidence intervals). *Pearson product moment correlation coefficient; **Lin’s concordance correlation coefficient.
The first step in the haemodynamic management of acutely unwell patients is to determine adequacy of tissue perfusion. At present, assessment of response to therapy outside theatre and critical care relies on soft endpoints such as examination, arterial pressure or urine output,1–3 potentially leading to inadequate resuscitation, or overload. SV directly impacts on oxygen delivery, and it follows that optimising SV should play a role in the management of acutely unwell patients. The work presented shows that the non-invasive USCOM has a relatively short learning curve and could be studied in a clinical trial as part of a novel algorithm applied outside the critical care environment, for example, in the early management of sepsis. Such trials could be argued for given the relative dearth of outcome studies using non-invasive devices and recent negative trials for early goal-directed therapy in sepsis. 35
The PLR accurately predicts SV response to a fluid challenge, 18 thus potentially avoiding unnecessary fluid loading. As maximal haemodynamic effects of the PLR occur rapidly, it is important to assess these effects with a device on a real-time basis. 31 This study demonstrated that trainees could rapidly attain a SV pre- and post-PLR, adding to the work of Thiel and colleagues. 20
Limitations
Focusing of the probe (visual and acoustic) to obtain optimal and maximal Doppler signal plays a critical role in all Doppler devices 36 and, although the learning curve has been quoted as twenty scans for the USCOM device, 21 in our experience, it takes longer to become familiar with the nuances of different signal sounds and patterns to recognise a reliable signal. Improper technique and poor beam alignment with flow at the aortic outflow tract leads to suboptimal VTI measurements and underestimation of SV.
Our study has weaknesses. The learning curve was performed on healthy volunteers, younger than the average hospitalised patient. Due to resource and time constraints, a different set of volunteers was used for each trainee and only one trainee was subsequently assessed against the experienced operator, on acutely admitted in-patients. As the study involved a PLR, where maximal effects are reached and then wane rapidly, it was not feasible to assess more than one trainee at a time on the volunteers and patients studied. As previously noted, elderly patients can be more difficult to obtain good quality images from.37,38 However, the inter-rater study included a number of elderly patients with high correlation between raters. The study did not assess whether acquisition of the skill was sustained, however, as with most simple practical skills, in our experience, this has not been problematic. No interventions were performed on patients, however, the PLR has been shown to be an accurate reflection of a fluid challenge in a number of studies, and this is the first study to assess inter-rater agreement of the device with such a manoeuvre.18,31
Conclusions
The learning curve for the USCOM device shows proficiency is gained in fewer than 50 scans; this can be achieved in less than 5 h, with close supervision. Following training, the device shows excellent inter-rater reliability. Adoption of such techniques could improve assessment of the circulation in our unstable patients. Future studies to assess the impact of using such technology, as part of a goal-directed approach, on patient outcomes are desirable.
Footnotes
Declaration of conflicting interests
The authors declared no potential conflicts of interest with respect to the research, authorship, and/or publication of this article.
Funding
The authors received no financial support for the research, authorship, and/or publication of this article.