
Abstract
The aim is to analyse that, during the current pandemic situation, the reduction in the number of cases of influenza suggests that the non-pharmaceutical interventions (NPIs) applied to contain the expansion of SARS-CoV-2 also affect the influenza expansion. We analyse the interaction of influenza and SARS-CoV-2 spread based on an extended SEIRD model for the Catalonia region in Spain. We show that the dynamic evolution of the spread of SARS-CoV-2 and influenza generates a small interference. This interference causes a small reduction in the number of cases of seasonal influenza, reducing its expansion over the population. Other elements like the face mask mandates, social distancing and hand cleaning boost the reduction in both expansions. Influenza expansion will present a small reduction in the number of cases due to the interaction with SARS-CoV-2 expansion but mainly because the NPIs applied to the population.
Introduction
Along with the COVID-19 pandemic, caused by the SARS-CoV-2 expansion, the reduction in the number of cases of seasonal influenza is notorious, being this effect generalized in several countries. 1 The discussion of why this happens is relevant since it allows us to prepare the health system for possible increases and interactions between both viruses spread. In this study, we analyse the interaction between influenza and SARS-CoV-2 expansion using a model that represents this effect.
We consider influenza a stational disease 2 and COVID-19, at this point, not strongly influenced by climatic factors, with humidity as a key element as suggested in Tobías et al., Ward et al., Pineda Rojas et al., Mecenas et al., and Fontal et al.3–7 The routes of transmission for influenza and SARS-CoV-2 seem to be a little different, being influenza is strongly transmitted by droplets, 8 while SARS-CoV-2 also uses the airborne route of transmission. 9 This has serious implications, as we can notice that the face mask will have a small effect on the containment of influenza10,11 but strong effects with SARS-CoV-212–14 probably due to its airborne nature. 15
The approach we follow is to use a modified SEIRD model that allows computing the interaction between the two spreads. We add to the model the possibility to represent a simple non-pharmaceutical intervention (NPI), the total lockdown. This will allow the validation of the model results with the observed pattern on the first waves analysed. We do our analysis for the Catalonia region.
There are several approaches to understanding the effects of NPIs on the population16–20 in the context of the current COVID-19 pandemic. These analyses help in the validation process we do; however, they do not provide information regarding the effect that these NPIs can cause over other pandemics. Some works are analysing the interaction between SARS-CoV-2 and influenza over a population, like Domenech de Cellès et al. 21 where the interaction to detect the effects of the coinfection over the increase of the SARS-CoV-2 transmission is analysed. In Dadashi et al., 22 the possibility of coinfection is analysed, which seems low, and in Stowe et al., 23 it is analysed to detect the severity of this possible coinfection.
The paper is organized as follows: first, Section 2 presents the preliminary theoretical model we will use, and next, in Section 2.1, we present the model adaptation we will use for the representation of the interaction. This conceptual model represents the structural assumptions we will use in our model. Next, we present in Section 2.2 the model parametrization, which shows the data assumptions we will use, along with some simplification assumptions our model uses; the results for Catalonia are discussed in Section 3. Finally, in Section 4, some conclusions are pointed out.
Methods
The differences between both viruses are presented clearly on the parametrization of a classical SEIRD model
24
we can use to model the propagation of both viruses without any relation.


The compartments S, E, I, R and D, are the susceptible, exposed, infective, recovered and dead sets, respectively. The latency rate (α) and recovery rate (γ) parameters will be considered constant, based on the measurements made by other studies, and N will be the total population of our analysis; in this case, we will be focused as a starting point, on the population in Catalonia, N = 7,653,845 at the time of this analysis. 25 We can assume that there is no pre-existing level of immunization to SARS-CoV-2 of influenza and that therefore the entire population is initially susceptible (S0 = N). The fatality rate (µ) will be the fraction of sick people who do not recover. Thus, the crucial parameter to fit was the transmission rate (β), which we considered to be time-varying under the assumption of a step function. Each step would represent a government intervention (NPI, confinement, distribution of masks, reopening, etc.). We assumed that interventions are applied to control the disease, which will imply changes due to such interventions. 26
Adaptation of the SEIRD model, structural hypotheses used
Since we want to model the evolution of the interaction of two virus spreads, we expand the SEIRD model, see Figure 1, to be able to interact with a second SEIRD model that represents the spread of a second disease over the same population. In this case, we duplicate the compartments to consider the possibility of being susceptible or recovering from one of the two infections. The conceptualization of the model is presented in Figure 2. We have a Susceptible population, ‘S’, an exposed population to SARS-CoV-2, and ‘Es’, an exposed population to influenza as ‘Ei’, and then we have an infective population for SARS-CoV-2, ‘Is’, and for influenza, ‘Ii’, and recovered for SARS-CoV-2 as ‘Rs’ and for influenza as ‘Ri’. These last compartments Rs and Ri can be a starting point to becoming infected by the other virus.

Classical compartments in a SEIRD model.

The SEIRD model was adapted to contain the interaction between two viruses spread. In black, the main paths for a SARS-CoV-2 infection are presented, while in grey are for influenza infection.
The model implementation is done with InsightMaker a free tool under a General Public License (GPL adjusted) freely accessible through a browser. 27
The model presents some particularities that must be detailed. First, being influenzas a stationary pandemic, we must limit the β we use depending on the month. This is done in the variable seasonal effect, which represents a multiplier to influenza's β, that uses a function that represents a wave that oscillates from 0 to 1 and peaks in January, as is suggested by analysing the data for the influenza on the PIDIRAC service in Catalonia.
28
In the equations is represented as the season variable. The model does consider the possibility of reinfections for influenza and SARS-CoV-2 and considers the possibility of being infected with SARS-CoV-2 after an influenza infection or being infected with influenza after a SARS-CoV-2 infection. We do not also consider a simultaneous infection of both influenza and SARS-CoV-2. This is a conservative approach since seems that some type of cross-immunity exists, at least from the use of influenza vaccination29–32 implying that the number of susceptible people will be higher on the model than the real value of the system. The equations that rule the model are derived from the basic equations of a SEIRD model combining both models and are presented next. The stationarity for SARS-CoV-2 is not as important as influenza, and although about 20% of the β can be due to stationarity on the model, we do not consider this for SARS-CoV-2 propagation; this will be interesting in case we want to study the stationary period after the initial spread of SARS-CoV-2. We do not consider the possible waning protection of the vaccines that eventually increase the reinfections of SARS-CoV-2. We do not consider the level of asymptomatic cases or the real number of cases for both propagations. This can have some effects at the end of a pandemic like COVID-19, where the system saturates, due to the reduction of people being infected, implying a higher value for beta instead of a low one, which causes the descent of the cases if the number of Susceptible people is still huge. This will imply that at the end of the Omicron wave, the per cent of reduction of the beta due to the measures will be small than the one represented in the model. On the Python model used to estimate the β, we do not consider the deaths being an SEIR model; however, the resulting curves using those betas on the SEIRD model are coherent with the observed data. We do not consider coinfection, which seems low.
22
We consider the population of Catalonia stable using the 2021 census.
In the next section, we detail the parametrization done for Catalonia, detailing the data hypotheses used in the model.


Model parametrization
Data assumptions are presented here. For SARS-CoV-2, the incubation time values are about 5.3 33 or 5.1, 34 the last value the one we will use. For the recovery period, we use 5 days. 35
The total lockdown in Catalonia takes place on 15 March 2020, but the effect on the curve happens on 21 March 2020. This will be the value we will use to change the β for the propagation due to the NPI application. The initial value for the SARS-CoV-2 β is 1.23 and with the application of the measures is reduced to 0.17, representing about 13%. We assume that these measures also affect the reduction of influenza transmission, being the lockdowns, recommendations for hand cleaning, face mask use and social distancing measures that also affect influenza transmission. 11 We assume a similar reduction for influenza β, 13% of its original value.
On the model, it is also needed to establish the first case for SARS-CoV-2, being this relevant to detail the β to be used in its expansion. This, however, will not be relevant to understanding the interaction, since as we will see, the key aspect is the fact that the β of influenza is lower than the β for SARS-CoV-2. The first SARS-CoV-2 reported case in Catalonia is due to an Italian woman that go to a hospital because presented symptoms on 20 February 2020, 36 hence being the incubation of about 5 days the first ‘exposed’ case take place on 15 February 2020, being this the day we use to start our propagation for SARS-CoV-2 for Catalonia case.
For the calculus of the β, we use a Python optimization model37,38 that uses the same start day but that calculates, using an optimization algorithm, the values for the different β resulting from the application of the different NPIs over the population. In Table 1, we can see the β values for the different turning points (NPIs) in Catalonia. The code can be found in Online Appendix 1.
Turning points and values for the β of the model considering the NPIs applied over the population.

The dates include the delay until the effect of the NPI is applied, hence must include the incubation period and the notification period.
Abbreviation: NPI: non-pharmaceutical intervention.
Figure 3 shows the SARS-CoV-2 waves in Catalonia due to the different NPIs application that results in different regimes for the curve (different β).

Optimization model to fit the transmission rate for the SARS-CoV-2 in Catalonia, from February 2020 to April 2022.

Comparison of influenza spread and model spread in Catalonia. Left: influenza cases for the 2018–2019 campaign in Catalonia: right: influenza cases for the 2019–2020 campaign in Catalonia. Source: Torner et al. 41 ‘VG’ refers to the genetic variant, ‘nivell basal’ is the baseline level, ‘nivell epidemic’ is the epidemic level with moderate level ‘nivell moderat’, high level ‘nivell alt’, and very high level ‘nivell molt alt’.
The calculated β for the first wave is 1.23 until the lockdown where it is 0.17; using the expression R0 = β/γ, we can obtain a value for R0 of 6.27. This value is coherent with the values proposed for R0, of about 3.38 ± 1.40, with a range of 1.90 to 6.49, 39 or the values that are calculated on López L and Rodó 20 for Catalonia. Notice that we are focused on the first wave in Catalonia; hence, we are not considering other variants like Delta or Omicron that seem to increase this value.39,40
The model will start on 01 January 2017, to perform stabilization of the influenza propagation dynamic; Week 40 of 2019 is the first week that we must use for the validation with the data from the PIDIRAC service in Catalonia. 28 We use the reports for 2018–2019, 2019–2020 (the start of the COVID-19 pandemic) and 2020–2021 (during the COVID-19 pandemic); see Torner et al. and de Catalunya and de Salut.41–43 This last report for 2021–2022 showed that a small number of influenza cases in Catalonia are detected.
To be consistent with the historical values obtained by the epidemiological service in Catalonia for the 2018–2019 and 2019–2020 campaigns, 41 influenza spread in Catalonia must be about β = 0.36, see Figure 4. Therefore, for influenza, the parameter we will use as R0 is 1.85, which is in the range of the values proposed in Biggerstaff et al. 44 Furthermore, we must keep a basal level of influenzas cases of 15, being this coherent with the information presented by the PIDIRAC. 28 For influenza, the incubation is estimated with a mean of 2 days, 45 while the infective period is about 5–7 days 46 ; we will use 5.
With this value, we obtain a curve with a maximum of about 350 cases for 100K people (27K for all the Catalonia population) that is coherent with the observed data for the seasonal influenza wave in Catalonia for the 2018–2019 and 2019–2020 seasons (see Figure 5); the values obtained with the model fits well with the observed ones.

Scenario 03: application of the NPIs over SARS-CoV-2 but considering that they do not have any effect on influenza spread. Notice that seasonal influenza is affected but not at the level we observed in those years.
The protection offered by a natural influenza infection is under discussion, although some analysis shows that the protection for a specific variant last for a long, 47 some other analysts suggest that reinfection with the same variant is not rare and can happen in a year. 48 In existing different variants, we assume in our model that the reinfection of influenza can be done in a year.
The protection for SARS-CoV-2 reinfection depends on the vaccination process and the protection due to the natural infection.
Summarizing all this, data assumptions that represent the model parametrization are presented in Table 2.
Parameters for the SEIRD models to be used in the analysis on Catalonia.

SARS-CoV-2 will change depending on the variants and the NPIs actions to be applied.
Abbreviation: NPI: non-pharmaceutical intervention.
Results
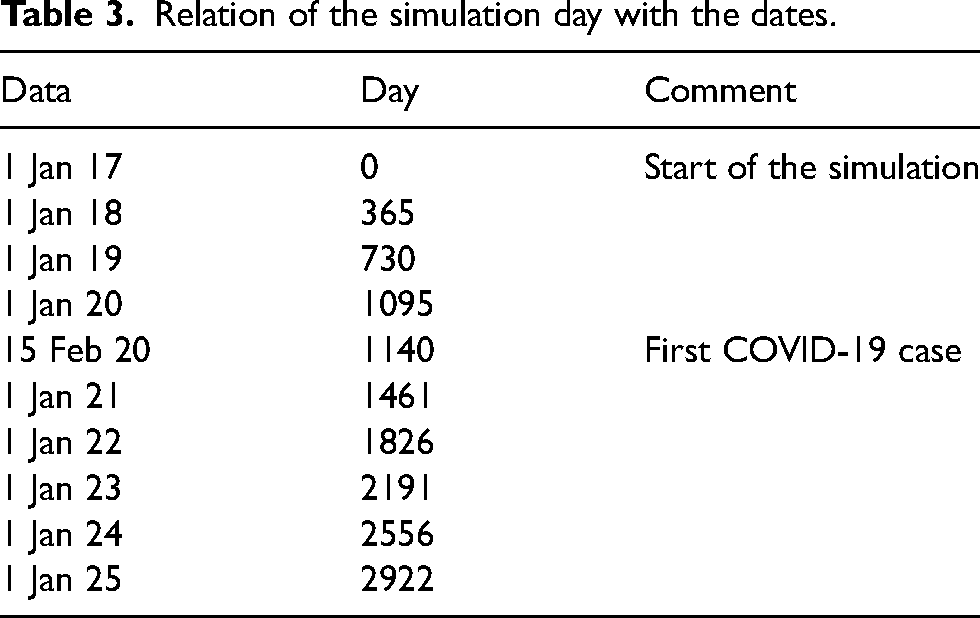
We conduct different scenarios with the model that analysed the interaction of SARS-CoV-2 and influenza over the effects of the different NPIs applied to the population. Notice that the last β we will use in the SARS-CoV-2 model is about 0.11, to represent the descent in the number of cases. This value, however, is not representing the application of any NPIs but just a natural decrease in the number of cases due to the saturation of the system and because of the under detection due to the high number of asymptomatic cases. Asymptomatic has an estimation of about 40% 50 increasing to almost 70% for Omicron. 51 This implies that mainly the NPIs that remain are the face mask in interiors, allowing us to evaluate the effect of this NPI over the influenza spread, understanding that other NPI that remain at this point are not mandatory. The results of the scenarios are presented in the next figures. The initial date (01 January 2017) is Day 0, and the date of the first COVID-19 case is Day 1140 (15 February 2020); on the figures, the y-axis represents the simulation day, and to simplify the understanding, we add, in Table 3, the relation between the simulation day and the date; also, on the figures, the years until 2025 are added.
Relation of the simulation day with the dates.
Discussion
Scenario 01 and Scenario 02 (Figures 6 and 7) present two situations mainly for the validation of the model. Figure 6 shows the normal regime of the seasonal influenzas under normal circumstances, with no COVID-19 pandemic, and the first 3 years are for the stabilization of the model. Figure 7 presents a hypothetical scenario where no NPIs have been applied to the population. This last scenario shows a plausible end situation for the pandemic, where no reduction in the protection due to natural immunity happens and no new variants appear. Notice the long downtrend of the SARS-CoV-2 cases.
Scenario 01: no COVID-19 pandemic. With a TR of 0 for SARS-CoV-2, this scenario is for the validation of the stationary behaviour of seasonal influenza in Catalonia. The first 3 years are for the stabilization of the model.

Scenario 02: no application of any NPI over the SARS-CoV-2. To detect if influenza spread will be affected only because of the interaction with SARS-CoV-2. NPI: non-pharmaceutical intervention.
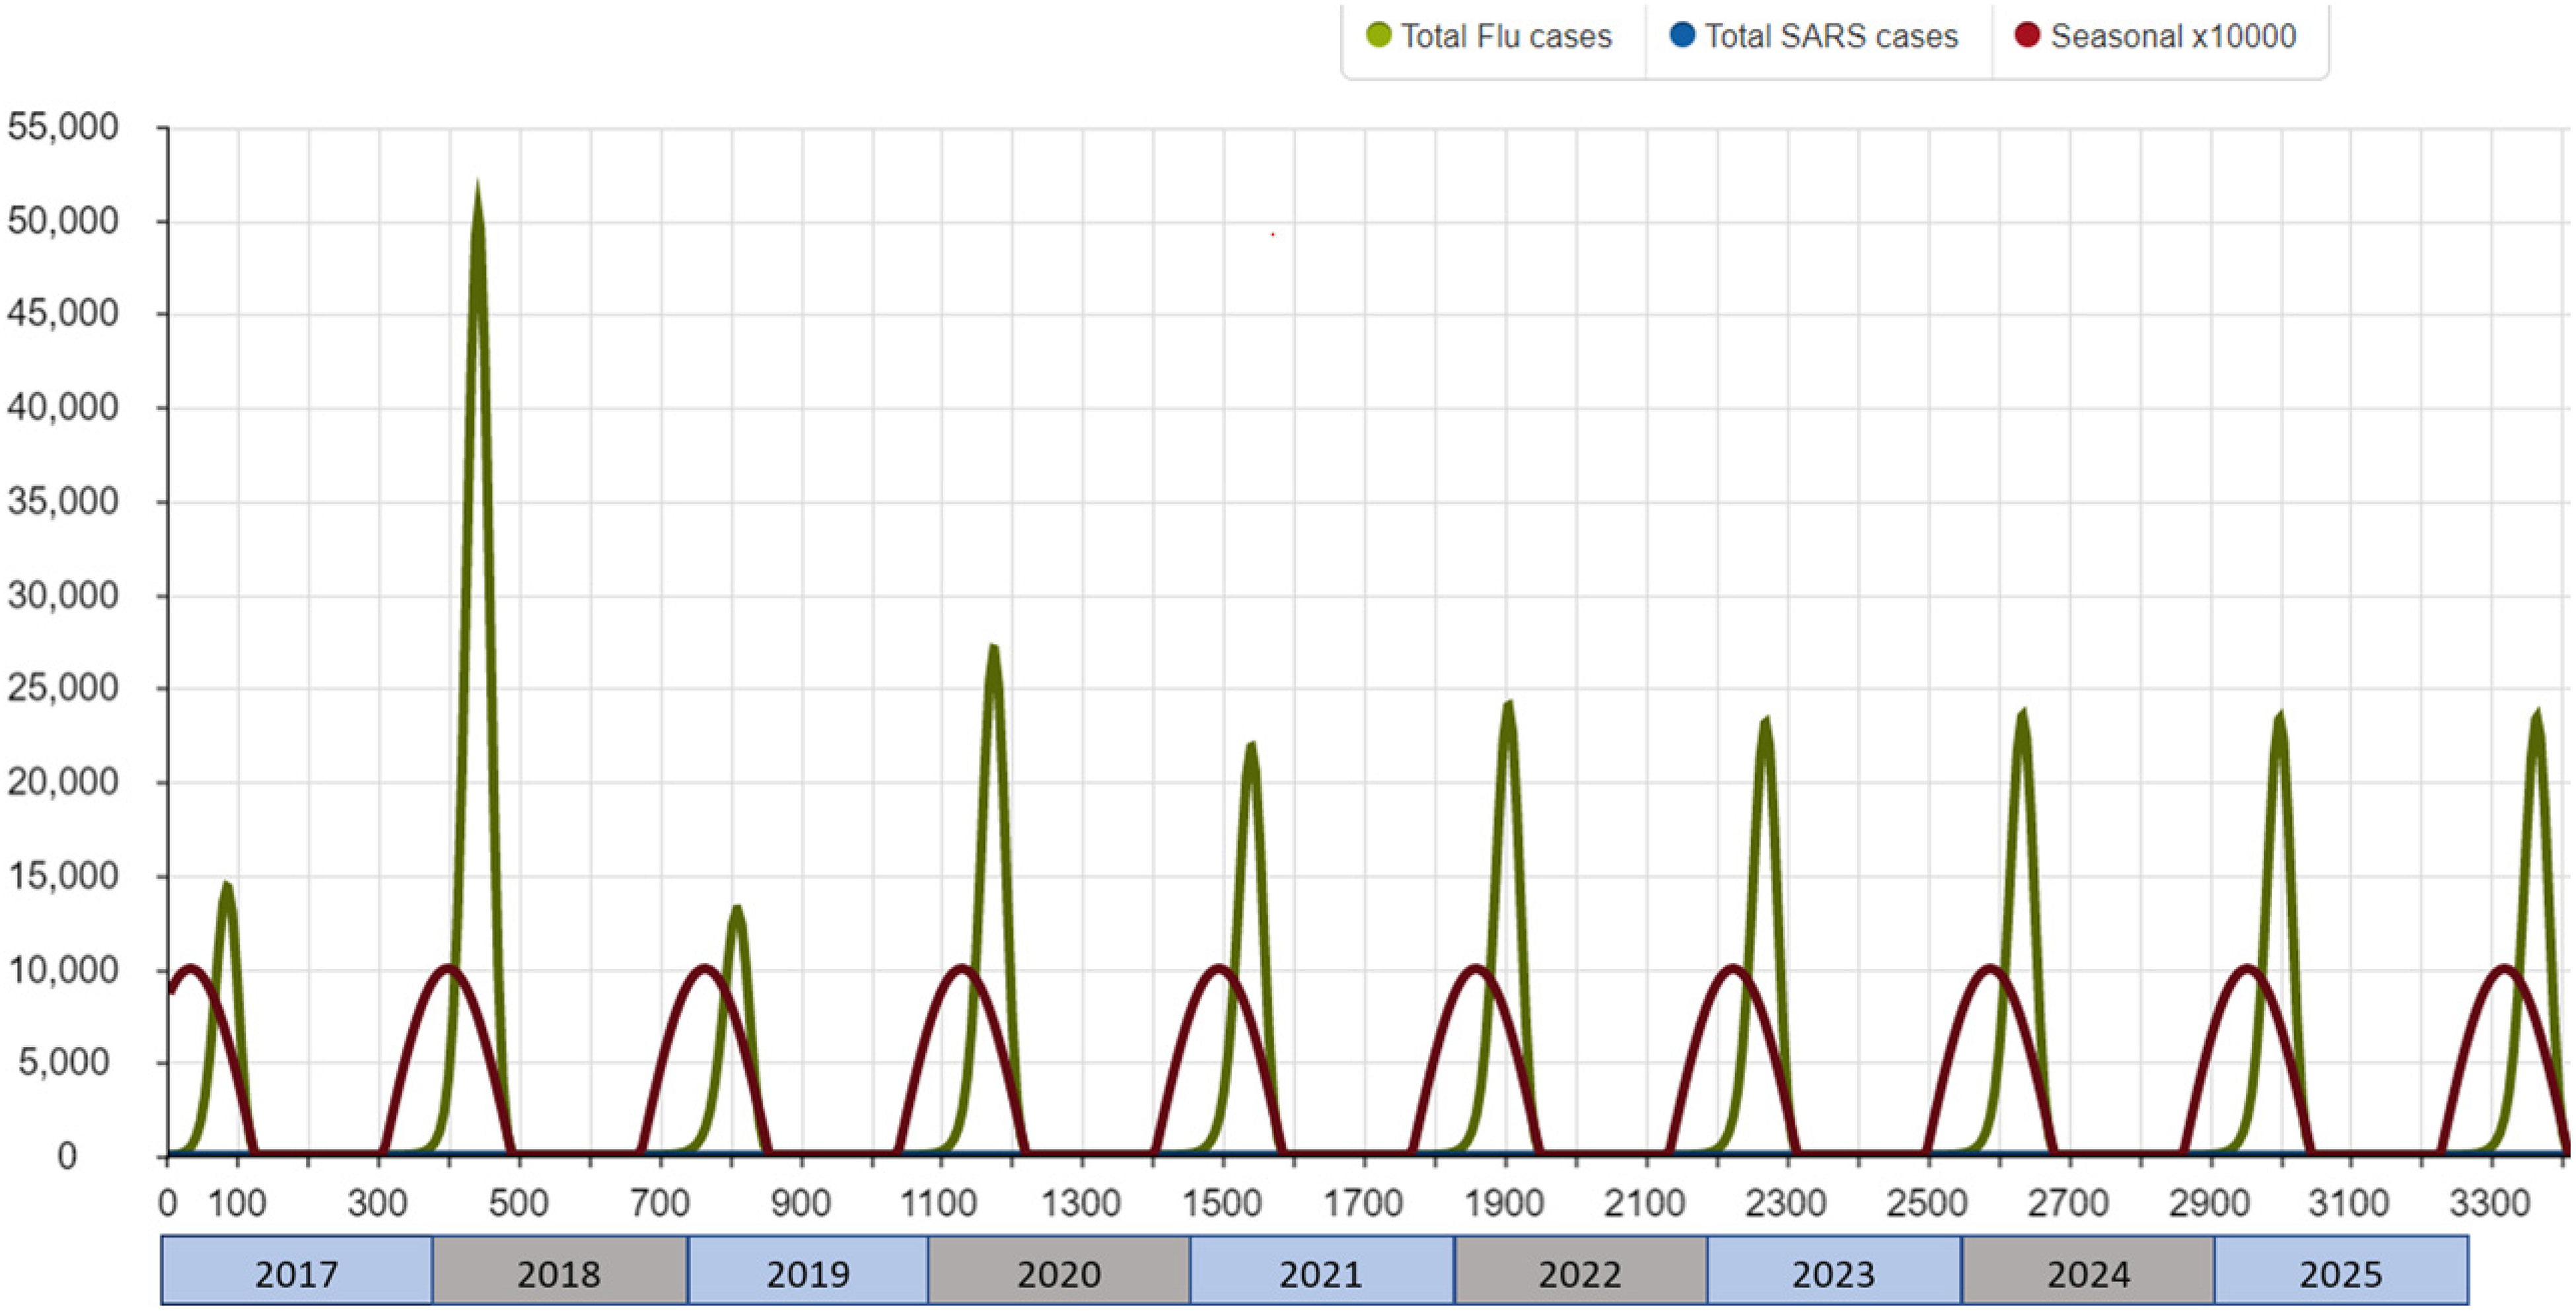
Scenario 03 and Scenario 04, see Figures 5 and 8, show two plausible situations. In both cases, we can see a reduction in the number of cases of influenza due to the interaction. In the case that the NPIs do not affect influenza spread, the reduction in the waves during the COVID-19 pandemic is from 27K cases in January 2020 to 21K cases in January 2021 and 19K cases in January 2022. These values are in contradiction with what we observed in Catalonia during those years; hence we can consider that there are other elements, the NPIs applied over the population, and not only the interaction. A plausible explanation for this reduction is because SARS-CoV-2 sick people are going to become aisled, they will not be infected by influenza, being the routes of transmission of influenza included the routes of transmission of SARS-CoV-2. Therefore, some NPIs that clearly will have an important effect on the containment of both spreads are the confinements of the positives and close contact over almost 15 days (about 2 weeks). This can have a noticeable effect on the control of both diseases since the susceptible population reduces drastically. This NPI is included in the reduction of the β for the SARS-CoV-2 spread but is not analysed in isolated.
All these scenarios suggest that, although the interaction between SARS-CoV-2 and influenza exists, the NPIs play a key role in the control of both spreads, coherently with current results.52,53
Scenario 05, see Figure 9, defines a situation where the remaining NPIs, indoor face mask use, remain, suggesting that face masks have some kind of effect also in the control of influenza. This is providing evidence in the opposite sense10,11 but coherent with the analysis done due to the specific situation generated by the SARS-CoV-2 spread,12–14 suggesting that the wide use of face mask has some effect on the containment of the spread of other respiratory viruses, not only for COVID-19 prevention. Coherently with this, countries with the widespread use of face masks, like Japan,54–56 present low levels of cases in the common influenza seasons. Specifically, we observed an incidence of 350 cases for 100K habitats in Catalonia to about 214 cases for 100K habitats in Japan, 57 representing a reduction of about 61%. However, this reduction cannot be entirely attributed to the use of masks, as other unanalysed factors could also cause this reduction, such as cultural or technological ones.
Being the route of transmission similar to influenzas and SARS-CoV-2 (but not equal), it is reasonable to consider that these NPIs also have effects on the influenza contention, hence reducing its transmission. In case no NPIs have been applied to the population, the resulting interference between both spreads ends in a small reduction in the number of influenza cases.
The model can be used to analyse and control a syndemic, a synergistic epidemic that is composed of the combination of two or more concurrent or also sequential epidemics, like in the case of influenza and COVID-19. This concurrent or sequential epidemic happens over the same population causing interactions. Each one of the epidemics analysed can cause an increase in the number of cases that needs medical attention. The increase in the number of cases the health service must attend can cause a decrease in the quality of the service or, in the worst case, a collapse of the health service; this implies an obvious worsening of the prognosis of both diseases. Understanding the interaction of the two expansions can help in making the right decisions to reduce the transmission and also can help to understand the scenarios we face in case the NPIs do not work to control the transmission of the different pandemics analysed.
Although this model is focused, for validation purposes on Catalonia, we can infer that this pattern can be applied to other countries and that this interference appears always when we have two waves that use similar transmission paths.

Scenario 04: application of the NPIs over SARS-CoV-2 and considering that they also affect seasonal influenza. This scenario allows seeing if influenza spread will be affected because of the interaction with SARS-CoV-2 and the NPI application. This scenario considers that the effects of the last NPI remain active affecting both influenza and SARS-CoV-2. NPI: non-pharmaceutical intervention.

Scenario 05 considers that just the last NPIs that remain in Catalonia (indoor face mask mandates and the possible new behaviours adopted by the population) do not affect influenza spread. Notice that the influenza wave of 2022 does not happen; therefore, the NPIs also affect influenza spread. NPIs: non-pharmaceutical interventions.
Footnotes
Declaration of conflicting interests
The author(s) declared no potential conflicts of interest with respect to the research, authorship, and/or publication of this article.
Funding
The author(s) received no financial support for the research, authorship, and/or publication of this article.
Ethical approval statement
No experiment involving animals or persons has been conducted. All the data used can be freely accessible.