
Abstract
Recent years have witnessed the success of representation-based classification method (RBCM) in the domain of face recognition. Collaborative representation-based classification (CRC) and linear regression-based classification (LRC) are two representative approaches. CRC is a global representation method which uses all training samples to represent test samples and utilizes representation residuals to perform classification, whereas LRC is a local representation method which exploits training samples from each class to represent test samples. Related researches indicate that the combination of LRC and CRC can fully exploit the representation residuals produced by them, thus improving the performance of RBCM. However, the representation coefficients obtained by CRC usually contain negative values which may result in overfitting problem. Therefore, to solve this problem to some extent, the combination of LRC and non-negative least square-based classification (NNLSC) is proposed in this paper. Experimental results on benchmark face datasets show that the proposed method is superior to the combination of LRC and CRC and other state-of-the-art RBCMs. The source code of our proposed method is available at https://github.com/li-zi-qi/score-level-fusion-of-NNLS-and-LRC.
Keywords
Introduction
Currently, and in the past few years, representation-based classification method (RBCM),1,2 which can be applied in a wide variety of fields – e.g. face recognition 3 – 6 and hyperspectral imagery classification – has received more attention. 7 – 9 RBCM represents a test sample as a linear combination of training samples and then employs the representation results to classify the test sample. Generally, RBCM can be divided into two categories: global representation methods and local representation methods.
The global representation methods utilize all the training samples to represent test samples, while the local representation methods use class-specific training samples. Actually, both of them employ their representation residuals for the final classification process. In 2008, Wright et al.
10
proposed a sparse representation-based classification (SRC) method, which achieves impressive recognition results in the community of face recognition.
1
SRC first obtains the sparse coefficient of a test sample using the dictionary formed by all the training samples, then reconstructs the test sample using the sparse coefficient and each class of training samples, and finally designates the test sample into the category which yields the minimum reconstruction error. And related experiments have proved that SRC is robust to image occlusion and pixel corruption, pointing out a new direction for face recognition research. However, the original SRC method needs to solve the
In contrast to the global representation methods, the local representation methods use class-specific training samples to represent test samples and exploit the local information between training samples to improve performance. Naseem et al. 16 presented a linear regression classification (LRC) method, essentially it is the nearest subspace classifier with downsampling features. Li et al. 17 proposed a local sparse representation (LSRC) method, which selects k training samples adjacent to the current test sample by kNN to form the dictionary. Xu et al. 18 developed a two-phase test sample sparse representation (TPTSR) method. The first stage represents a test sample as a linear combination of training samples and uses the training samples to determine M adjacent training samples of the current test sample. The second stage employs the CRC method to classify the test sample on the M adjacent samples.
Since both the global representation methods and the local representation methods use residuals for classification, only the training samples used to represent the current test sample are different. Additionally, these two types of methods have various advantages on different datasets. Therefore, Zhang et al. 19 proposed to combine CRC and LRC and used the residuals obtained by CRC and LRC to perform score level fusion. The experimental results showed that the performance of the fusion method is better than that of the single algorithm. However, the representation coefficient obtained by CRC usually contains some negative values, which may cause overfitting problem. To tackle this problem, we propose a new score level fusion method which is based on LRC and NNLSC. To be specific, residuals of LRC and NNLRS are first produced, then these residuals are normalized and fused in a weighted sum manner; finally, the test sample is classified to the class that leads to the minimum residual.
Here, we clearly show the advantages of our proposed scheme:
Non-negative constraint of NNLSC can avoid overfitting problem. Score level fusion strategy of LRC and NNLSC is presented, in which the complementary information of residuals produced by local and global representation approaches can be fully exploited.
This paper is structured as follows: “Related work” section reviews several related methods which contain LRC, CRC, and NNLSC. Score level fusion on the combination of NNLSC and LRC and the analysis of the proposed method is presented in the following section. “Experimental results and analysis” section shows the results of our experiments on publicly available face databases and analyzes the parameter in our proposed algorithm. Conclusion and future works are presented in the final section.
Related work
Suppose there are n training samples for C classes, the ith class contains ni training samples (
Linear regression classification
The linear regression classification method is based on linear subspace hypothesis. Suppose a test sample

Equation (1) can be written in the following matrix form


Using the ith class samples

If the test sample belongs to the ith class, then

We can classify

Collaborative representation-based classification
LRC encodes a test sample on each class of training samples, whereas CRC represents the test sample on all training samples, i.e.


Besides the class-specific reconstruction error, Zhang et al.
1
,
2
found that the representation coefficient

Non-negative least square-based classification
Inspired by non-negative matrix factorization (NMF)
20
and Xu et al.,
15
we represent a test sample
The least square classification method usually solves the following problem

The coefficient will contain negative values, but in many practical problems, the coefficient is often required to be non-negative. Therefore, by introducing the non-negative constraint into equation (12), we can obtain the following non-negative least square model

It is worth noting that in Xu et al.,
15
they solved equation (13) under the framework of alternating direction method of multipliers (ADMM).
21
By introducing an auxiliary variable γ, equation (13) can be reformulated as

Score level fusion method based on NNLSC and LRC
Combine NNLSC and LRC
Zhang et al. 19 proposed the combination of CRC and LRC, because they both use residuals to classify an input test sample. The rationality of this combination has twofold. First, the residuals of them have little correlation, and CRC is a global representation method which uses all training samples to represent test samples, whereas LRC is a local representation method which only exploits training samples from each class. Second, the superiority of CRC and LRC is different on various datasets, which can enhance the stability of performance to some extent under combination.
Zhang et al. 1 , 2 found that CRC can achieve comparable performance to SRC, and the speed is faster. However, the goal of CRC is to make training samples represent the test sample as good as possible, that is, the reconstruction error is the smallest; thus, the coefficient will contain negative values, which will lead to overfitting problem. In order to tackle this problem, we employ NNLSC to get the global representation coefficient. The experimental results show that the performance by fusing NNLSC and LRC is better than that of by combining CRC and LRC.
Suppose


Then, the above two residuals are normalized according to the following formulations


Finally, we can classify the test sample

The complete procedures of our proposed method are outlined in Algorithm 1.
Algorithm 1. Score level fusion of NNLSC and LRC
Analysis of the proposed method
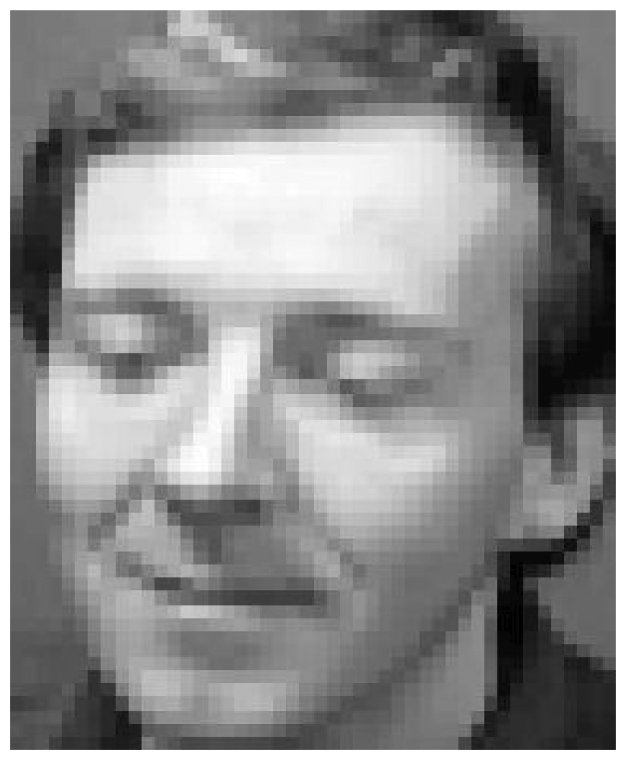
In order to demonstrate the effectiveness of our proposed algorithm, we here present an example on the ORL database. 2 Figure 1 is a test image from the fifth class, whose size is 56 × 46. The training images are the first three samples per subject. Figure 2 shows the residuals obtained by CRC. There are 40 residuals corresponding to 40 subjects. We can see that the residual from the 21st class is a little smaller than that from the fifth class, whereas in Figure 3, the fifth class has the least residual obtained by NNLSC, which can correctly classify the test image.

A test image in the ORL database (the fifth class).
The residual obtained by CRC, and the 21st class has the least residual.
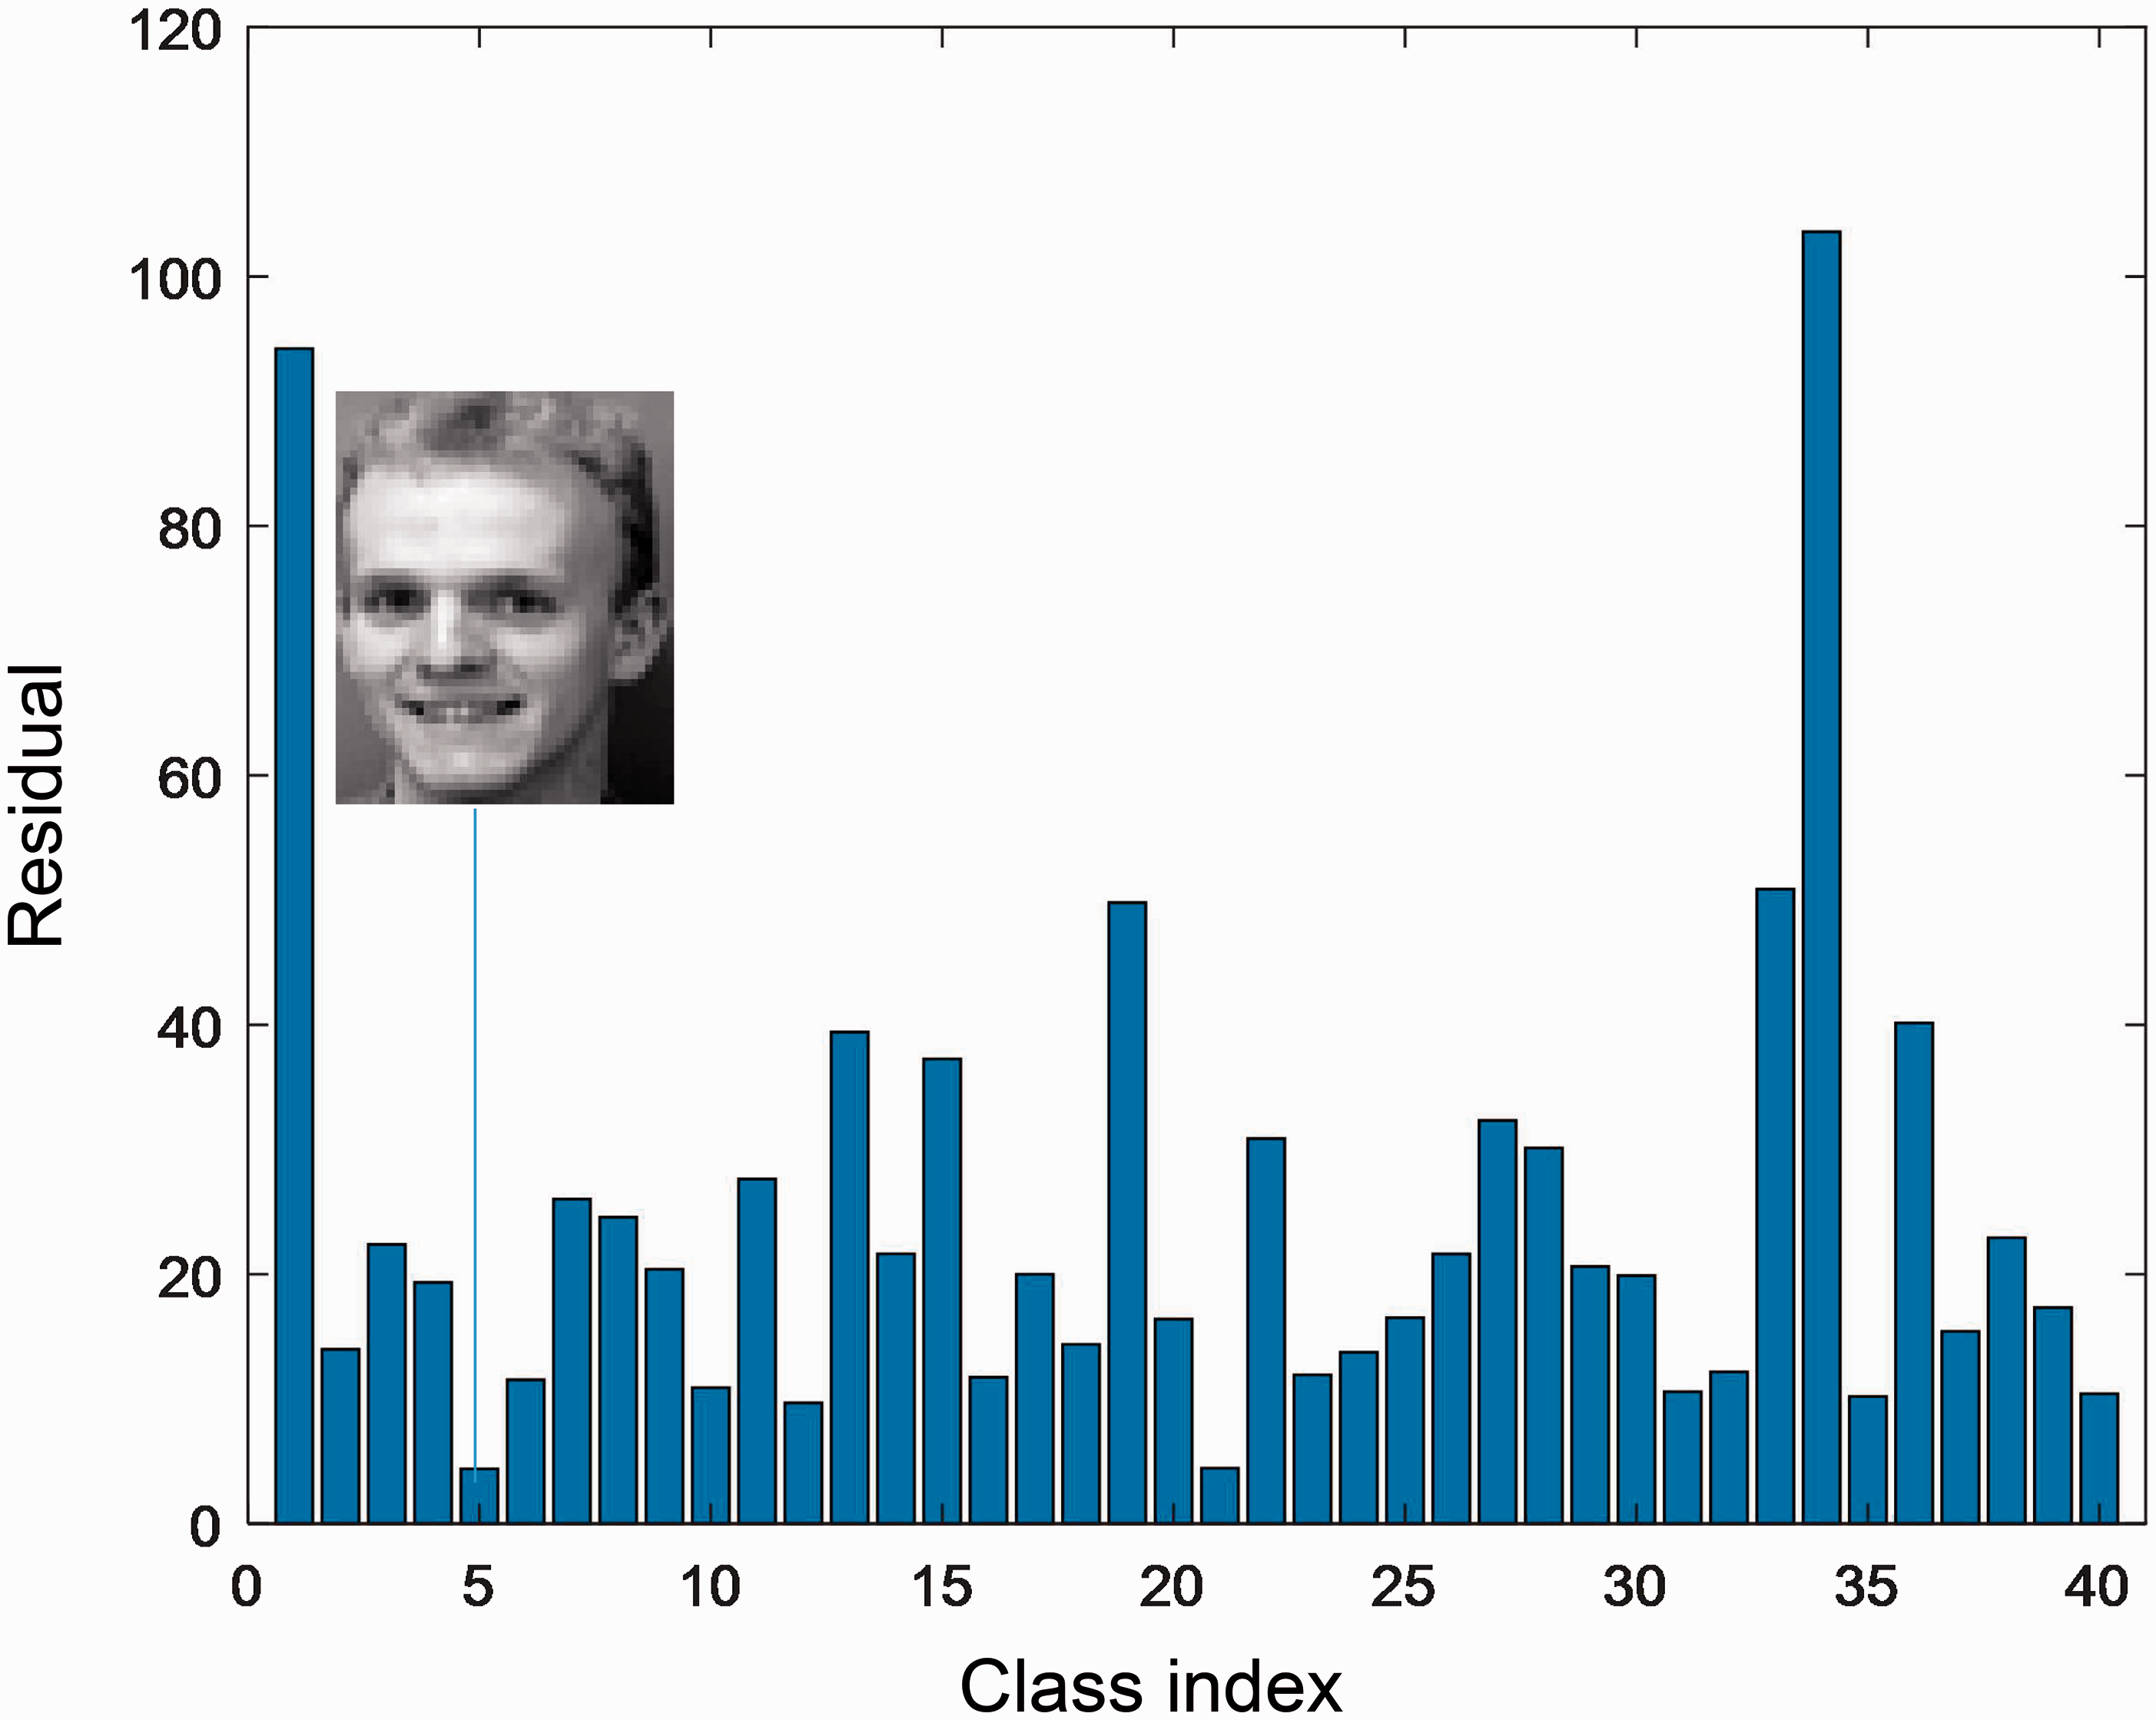
The residual obtained by NNLSC, and the fifth class has the least residual.
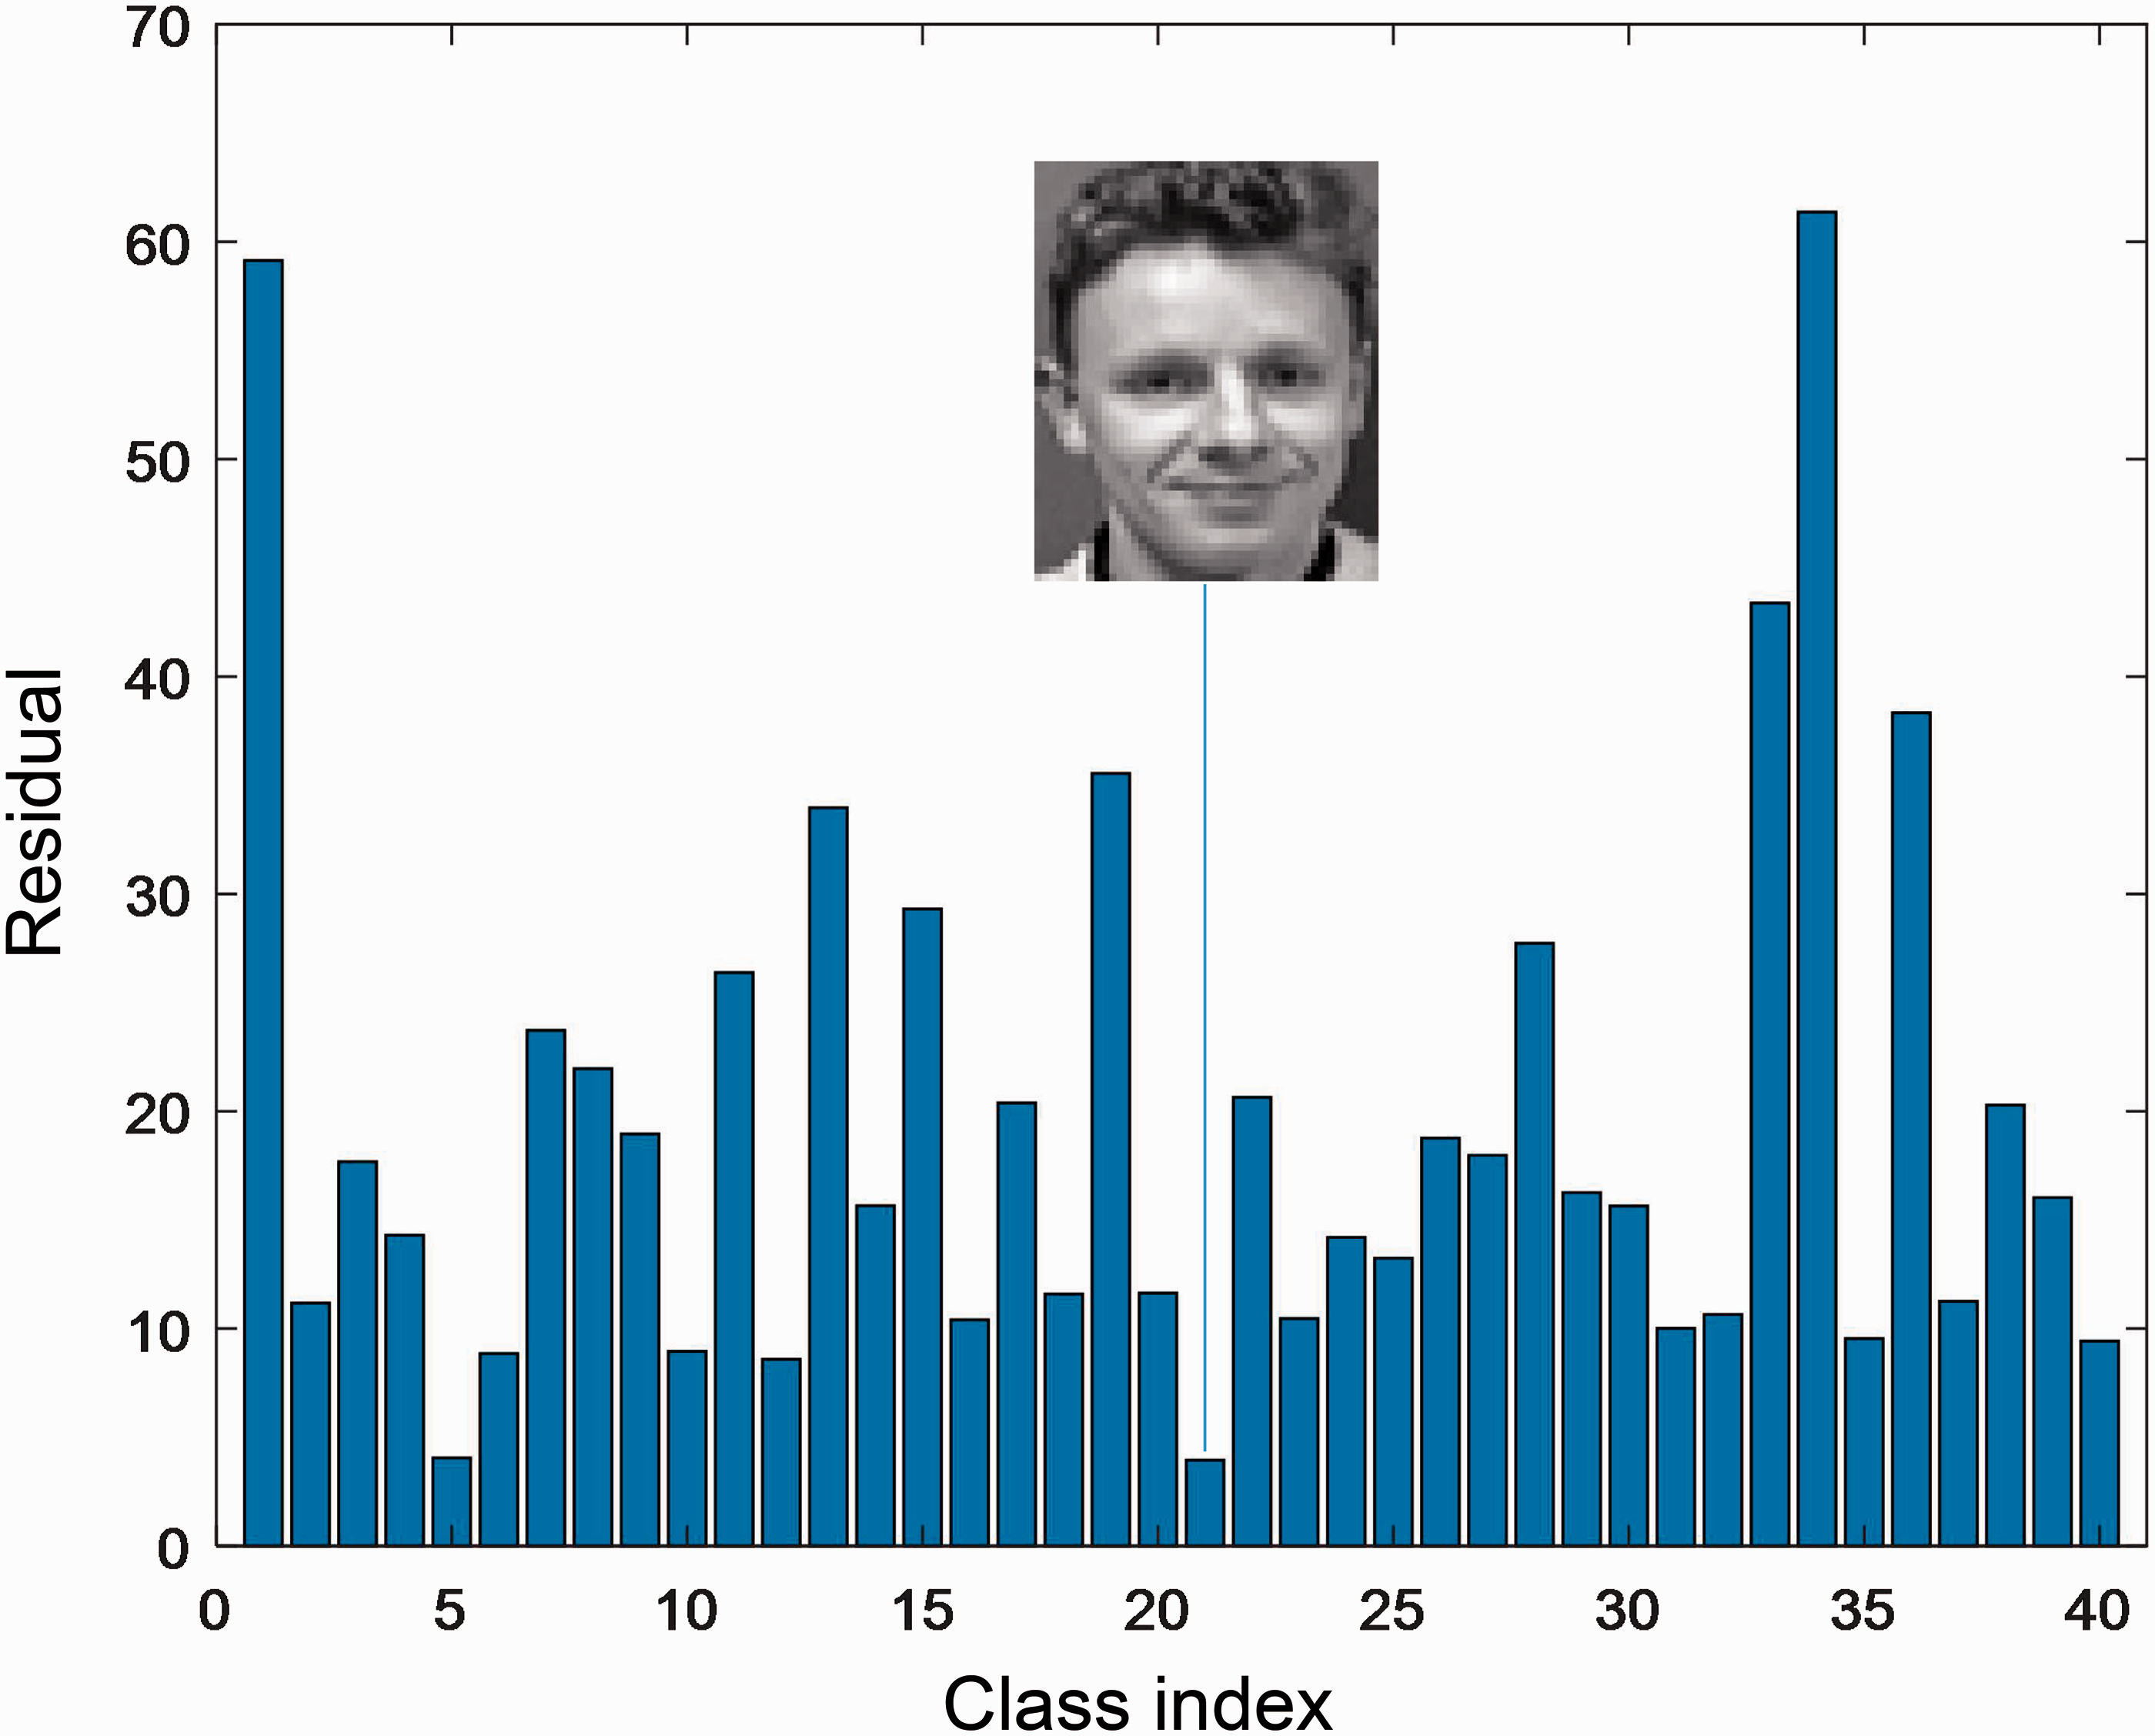
Figure 4 is a test image from the third class on the ORL database. Figure 5 displays the residuals obtained by CRC + LRC, we can observe that the 26th class has the least residual; thus, the test sample is misclassified into the 26th class. The residuals of our proposed method are plotted in Figure 6, one can see that the third class leads to the minimum residual, which means that the test sample is correctly classified.
A test image in the ORL database (the third class).

The residual obtained by CRC + LRC, and the 26th class has the least residual.

The residual obtained by NNLSC + LRC, and the third class has the least residual.
Experimental results and analysis
In this section, we report the performance of the score level fusion based on NNLSC and LRC under three publicly available datasets, i.e. FERET
2
3
, GT24 and XM2VTS
25
databases, the details of which are listed in Table 1. To illustrate the superiority of our proposed method, SRC,
10
CRC,
1
,
2
CCRC,
26
NCRC,
27
LRC,
16
NNLSC,
15
and LRC + CRC
19
approaches are compared. The parameters
Details of datasets are used in our experiments.

The columns from left to right are the names of datasets, total number of samples, the number of classes, and the dimensionality of features.
The chosen parameters on each dataset.

FERET database
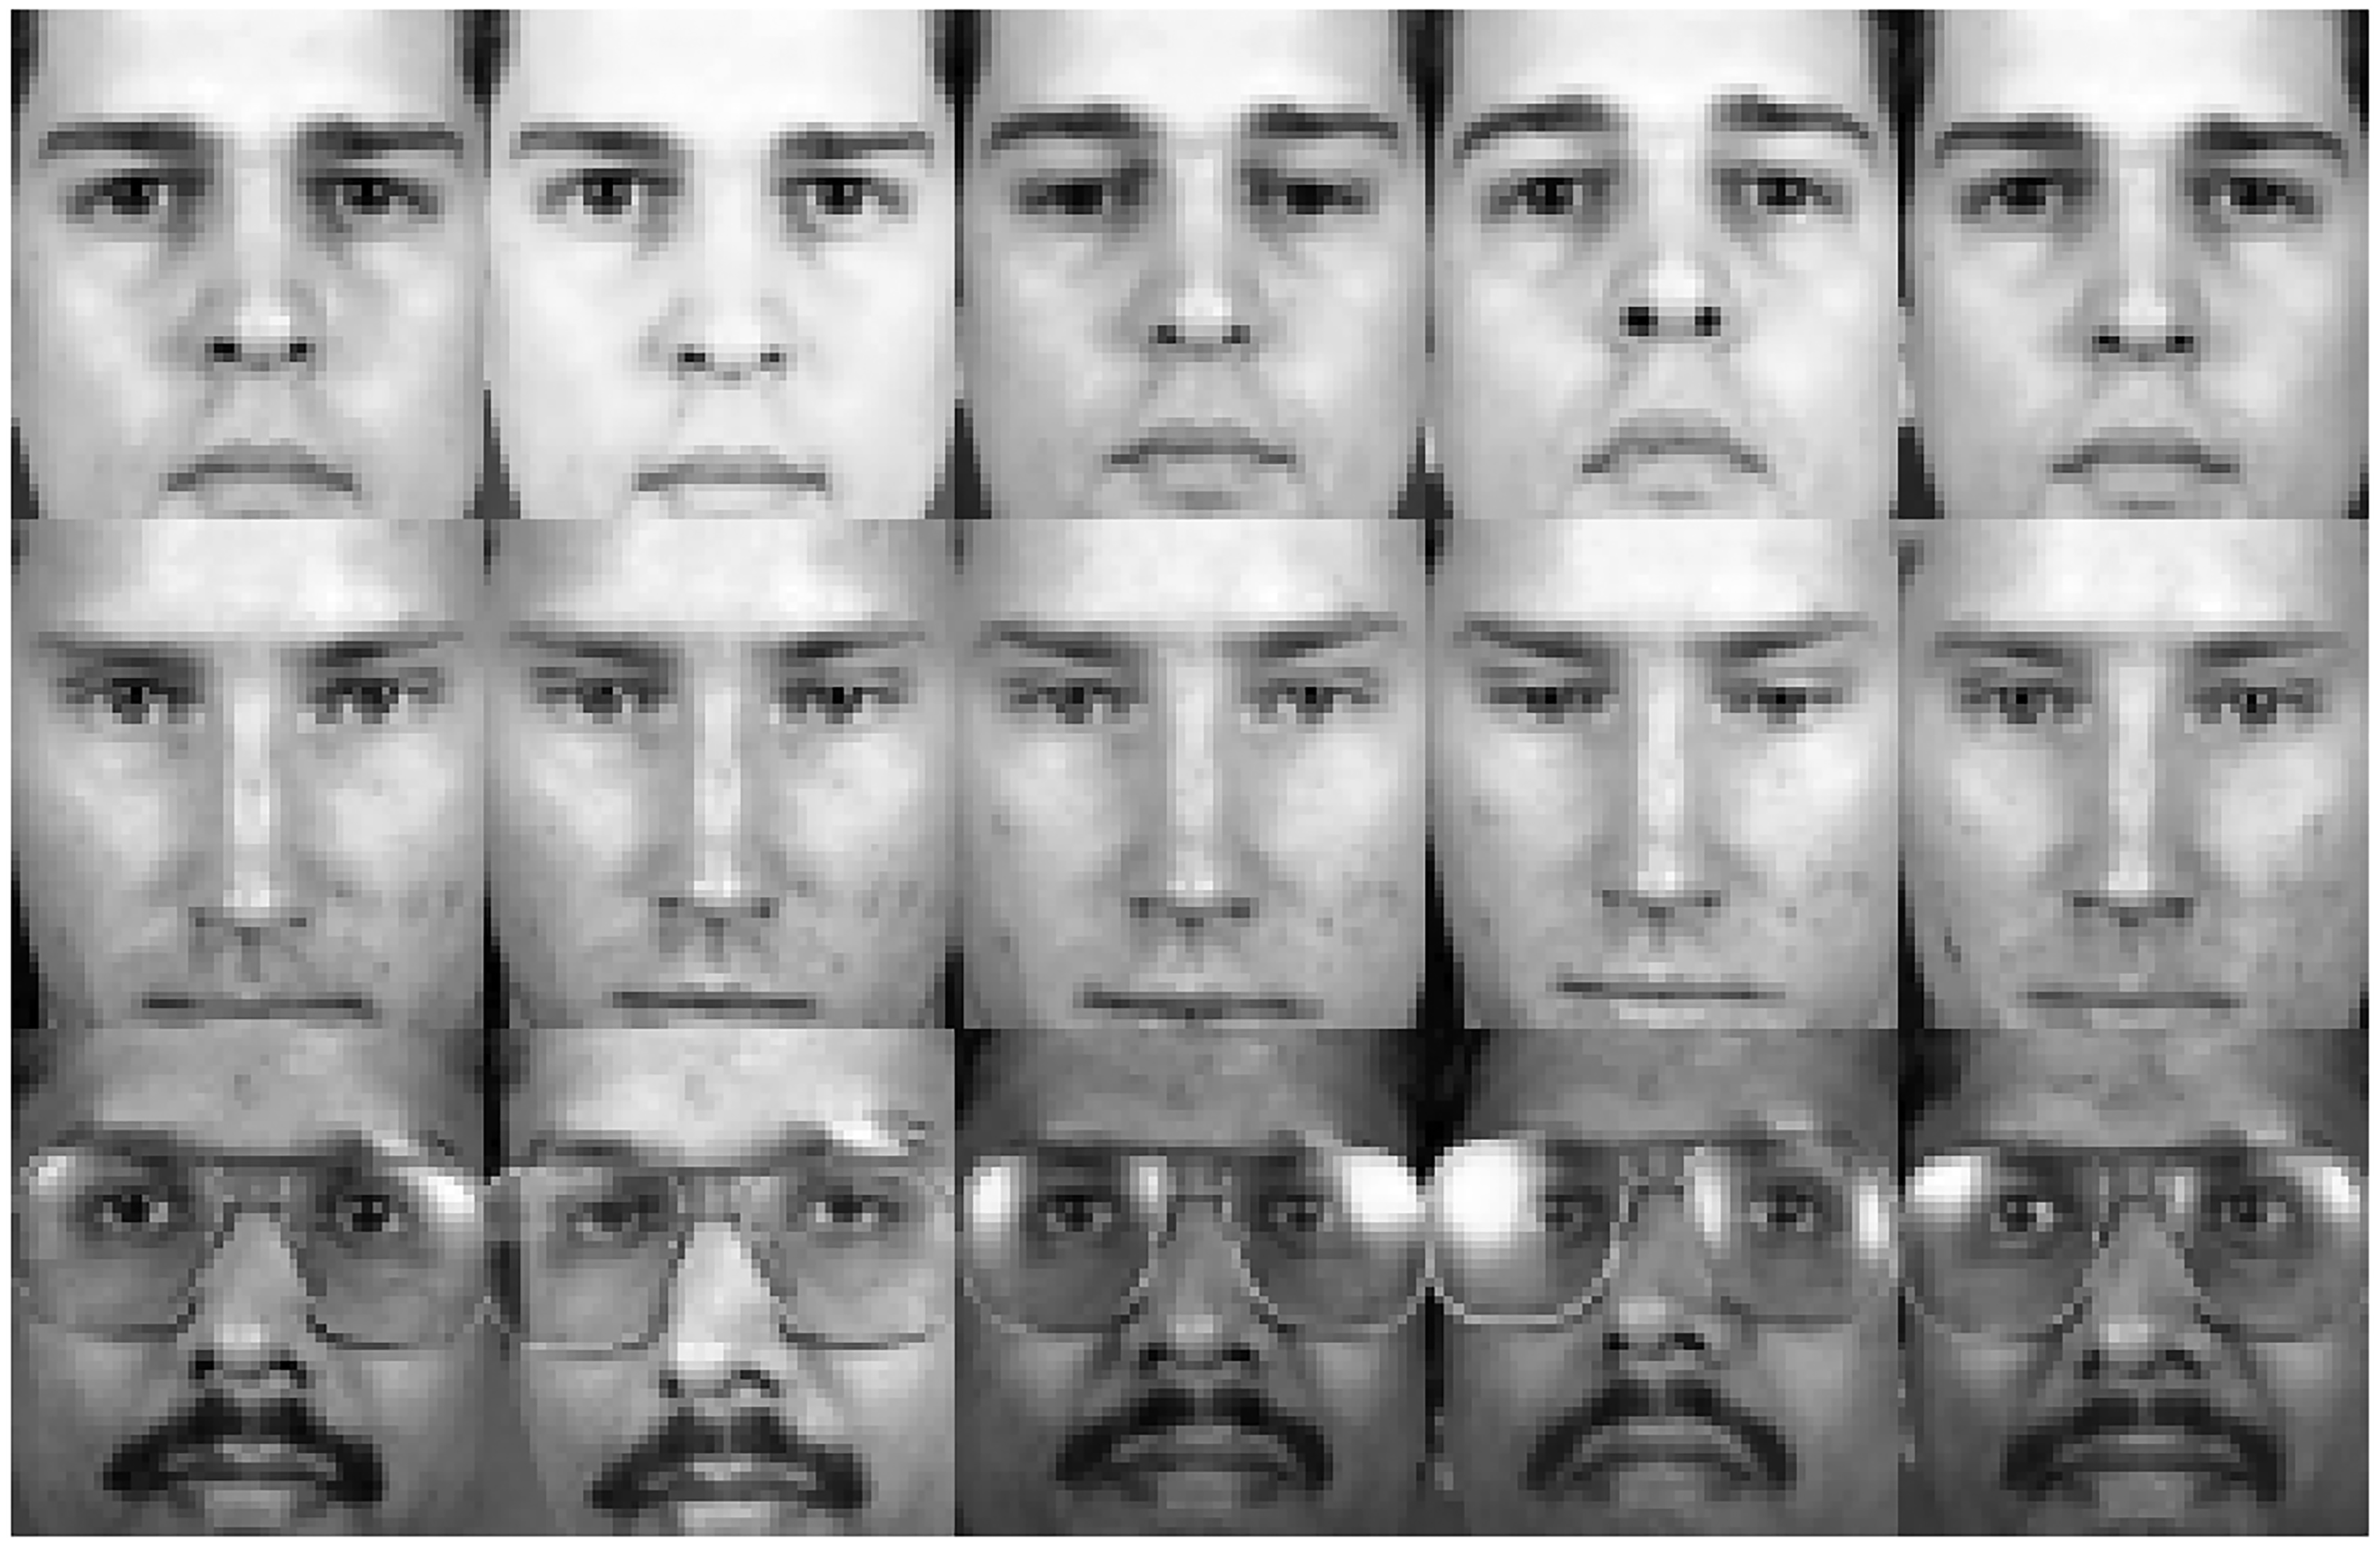
The FERET face database includes 1400 face images of 200 subjects, each having seven images with the variation in pose, facial expressions, and lighting conditions. Some typical face images are shown in Figure 7. All face images are resized as 40 × 40 pixels in our experiments, and the first one to four face images per subject are treated as training samples and the remaining as testing samples.
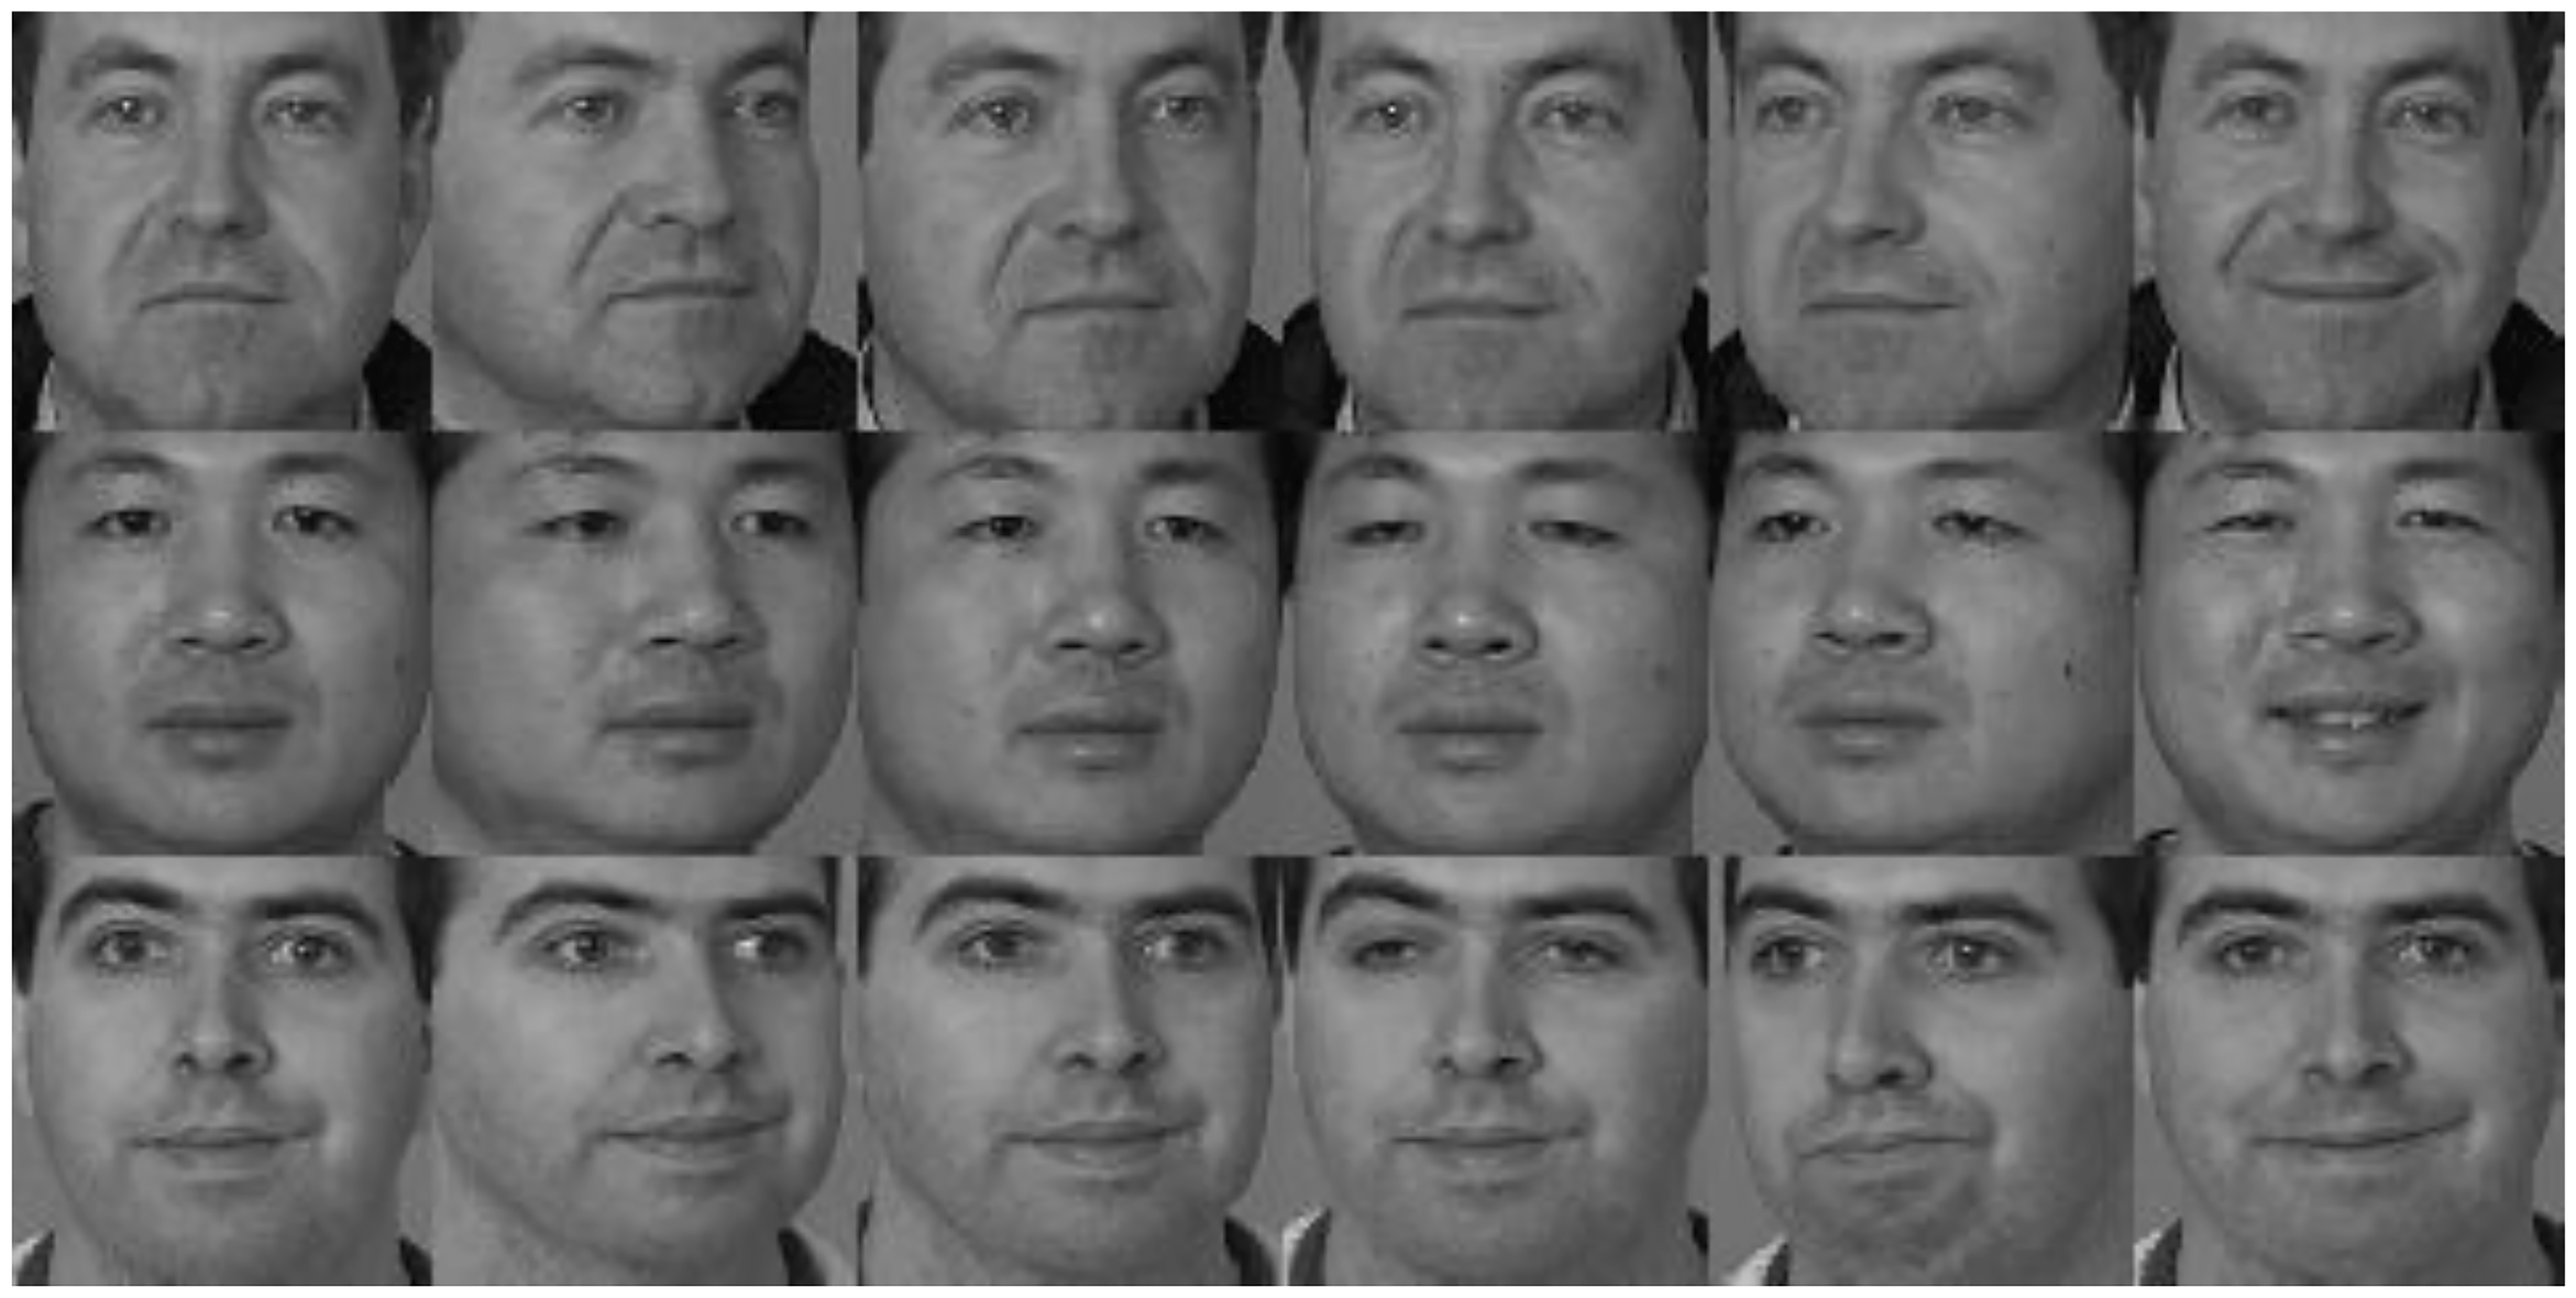
Example images from the FERET database.
The classification results of various competing methods under different number of training samples are summarized in Table 3. It can be seen that our proposed method outperforms other algorithms in most cases expect when the number of training samples is four per subject. By combining CRC and LRC, it can obtain better classification accuracy than those, respectively. The parameter
Classification accuracy (%) of competing methods on the FERET database.

Bold values signify the highest recognition rate accuracy.
GT database
The GT database contains 750 face images from 50 subjects. For per individual, there are 15 face images with variation in frontal and/or leaned face images under different scales, facial expressions, and lighting conditions. In our experiments, each image is cropped and resized to 60 × 50 pixels, and some example images are shown in Figure 8. The first one to six face images of each class are selected as training samples and the rest as testing samples.

Example images from the GT database.
Table 4 details the recognition results of various methods. We can see that all the algorithms increase consistently when the number of training samples increases, and our proposed method can achieve better recognition results when the parameter
Classification accuracy (%) of various methods on the GT database..

Bold values signify the highest recognition accuracy.
XM2VTS database
There are 2360 face images (295 subjects and each has 8 face images) in the XM2VTS database. These face images were captured from four recording sessions with two face images per subject, which had no expression changes under the same conditions. Figure 9 shows some face images from this database. In our experiments, we treat the first one to four images as training samples, and the remaining as testing samples. These images are of size 55 × 51 pixels.
Example images from the XM2VTS database.
Table 5 lists the experimental results with various algorithms on the XM2VTS database. It can be seen that with the increase of the number of training samples in each individual, the performance of all competing methods improves steadily, and our proposed method outperforms other compared approaches except when the first two images are used for training. We choose
Classification accuracy (%) of different algorithms on the XM2VTS database.

Note: bold text represent statistical significance i.e. p value <0.05.
Parameter analysis
In our proposed method, the parameter used for score level fusion needs to be determined. To examine how influences the performance of our proposed method, we conduct experiments on the FERET database, and the first two images per subject are used for training and the remaining for testing. is selected from the candidate set

The classification accuracy (%) with the variation of in our proposed method on the FERET database.
Conclusions
RBCM can be roughly divided into two categories: global representation and local representation, they both employ the residuals to classify an input test sample. Related researches indicate that the residuals of these two types of methods have low correlation, and their performance varies on different datasets. Therefore, a method which fuses the residuals of CRC and LRC was proposed by other scholars. Nevertheless, the coefficient of CRC often contains negative values, which may lead to overfitting problem. To address this problem, we obtain the global residual by NNLSC which introduces the non-negative constraint into the model of least square regression. Experimental results demonstrate that by fusing NNLSC and LRC in score level, our proposed method can achieve promising performance. In future, we will solve some potential problems when the number of training samples is insufficient in LRC by adding some local constraints.
Footnotes
Acknowledgements
Declaration of Conflicting Interests
The author(s) declared no potential conflicts of interest with respect to the research, authorship, and/or publication of this article.
Funding
The author(s) disclosed receipt of the following financial support for the research, authorship, and/or publication of this article: National Natural Science Foundation of China (Projects Numbers: 61673194, 61672263, 61672265, and 61876072), and in part by the national first-class discipline program of Light Industry Technology and Engineering (Project Number: LITE2018-25).