
Abstract
This study aimed to examine defensive lineout strategies during the 2022/23 English Championship rugby union competition, accounting for contextual and tactical factors associated with successful lineout disruption and variation across teams. All regular-season fixtures involving the top six teams were analysed (n = 1876 defended lineouts across 97 matches). Performance indicators were derived from literature and expert consultation, operationally defined, and coded using Hudl SportsCode. Lineout outcomes were examined for associations against pre-, during and post-line phase variables using Chi-square tests and Cramer's V (p < .05). Defensive teams disrupted 18.4% of lineouts, with Coventry Rugby achieving the highest disruption rate (22.4%). Associations were observed for pitch zone (V = .186), formation (V = .091), contesting status (V = 0.164), contesting zone (V = 0.348), intended target (V = 0.164) and lifting/pod structure (V = 0.299). Disruption tended to be greatest when contests occurred in front of the attacking jumper and when two lifters supported the defensive jumper. Defensive effectiveness appeared to be associated with contextual factors and resource allocation. Aggressive contesting positions and optimal lifting support were associated with disruption potential. Findings provide provisional, evidence-informed insights that may assist coaches in refining defensive systems and improving turnover opportunities.
Introduction
Set-piece platforms in invasion games provide structured opportunities and constraints that shape both how attacks launch and how defences organise to prevent opposition progression.1,2 In rugby union, the lineout is considered one of the most influential set pieces, offering teams a controlled restart and a tactical foundation for advancing territory or initiating multi-phase attacks.3,4 From a defensive perspective, the lineout is also a primary platform for denying clean possession, disturbing structures, and limiting continuation threats (e.g., maul, off-the-top, breakout plays), making it a critical battleground for both the attacking and defensive teams. 5
The lineout occurs when the ball goes into touch, and two opposing lines of players form perpendicular to the sideline between the 5-meter and 15-meter line. 6 The attacking team determines the number of players in the lineout, while the defending team can match or reduce the numbers in the lineout to contest possession. The throw, typically delivered by the attacking hooker, initiates the contest that combines technical execution, aerial skill and coordinated lifting. While this process may appear routine, its outcomes often separate winning and losing teams. Previous research has consistently suggested an association between lineout performance and match success, with winning teams tending to demonstrate superior performance in both attacking and defensive contexts, regardless of competition and league.2,4,7,8 Therefore, defensive units must make rapid, context-specific decisions about whether and how to contest, where to locate resources, and how to contain continuation play.
The attacking lineout has traditionally been viewed as a potent scoring platform. Studies indicate that top-ranked teams in elite competitions typically generate more tries from lineout-originating plays than lower-ranked teams.2,9 This supports the perception of the lineout as a cornerstone of attacking strategy. However, the defensive dimension, specifically the ability to disrupt opposition possession, has received comparatively less attention despite evidence of its impact. Jones et al. 7 pointed out trends showing that winning teams successfully stole opposition lineout ball (14.58%) more often than losing teams (6.27%), frequently converting these turnovers into scoring opportunities. Similarly, Vaz et al. 10 argued that contest strategies may be pivotal in transforming defensive gains into points, with losing teams losing more of their own lineouts than winning teams across international games played between 2003 and 2005. More recently, Schoeman and Schall 8 acknowledged that lineout steals were a distinctive feature in league competitions, with the French Top 14 reporting the highest number of highly contested lineouts. Yet, these studies stop short of detailing the specific defensive techniques, positional choices, or lifting structures underpinning successful disruption.
Recent work has begun to explore contextual factors influencing lineout strategies. 9 Pitch location is a key determinant, as defensive priorities and risk management shift with territorial risk. Research and applied coaching practice commonly divide the field into four lateral zones to capture positional trends. 11 For defenders, lineouts in the opposition's attacking 22, for example, demand clear trade-offs; whether to stay grounded to pre-empt the maul, or to contest aerially to prevent a clean launching platform. Lower-ranked teams have been observed to contest more aggressively in the air against seven-man lineouts, a pattern interpretable as a defensive attempt to prevent early maul formation, though this approach carries risk if the contest fails. 9
Formation and intended target further shape defensive decision-making, but they are only part of the dilemma. For example, seven-player lineouts may expand attacking options and increase deception potential, which further complicates defensive reads. 12 While top teams tend to contest more effectively than bottom teams (17% vs 9%, p < .05), 9 existing research rarely shines a light on how defenders operationalise contest quality, whether through timing, lifter allocation, or targeted disruption. Equally, the anticipated method of ball delivery (off-the-top, maul, ground pop/direct transfer, breakout) imposes distinct spatial and resource demands.11,13 The role of the channel defender, typically the hooker, scrum-half or another forward, further affects the ability to contest or contain threats in the five-meter channel and midfield. 14 Understanding these interactions from the defensive perspective, how delivery type interacts with channel defender positioning, is central for designing effective disruption strategies. Yet little is known about how defensive units organise pre-lineout (e.g., formation, positioning), execute in-air contests, or reorganise post-lineout to reduce threats such as mauls or off-the-top plays. Addressing these gaps may provide coaches with defence-led, evidence-informed insights that anticipate attacking intent and allocate resources effectively across all phases of play.
Coaches seeking to enhance defensive lineout performance require granular insights into which defensive strategies succeed under various conditions. Understanding not only whether to contest but how to contest, against which formations, in which zones, and with what resource allocation, can inform evidence-based decision-making.15,16 Moreover, framing analysis across lineout phases of play offers a holistic perspective. Defensive effectiveness is not confined to the throw; it encompasses pre-lineout organisation, in-air execution, and post-lineout outcomes, each contributing to the disruption or containment of threat.
This study responds to the gap by examining defensive lineout strategies during the 2022/23 English Championship rugby union competition, accounting for contextual and tactical factors associated with successful lineout disruption and variation across teams. The analysis focuses on the top six teams and three lineout phases of play: (1) pre-lineout organisation (pitch location, formation size, and defender roles), (2) during-lineout contesting (strategy type, lifter allocation, pod structure, and intended target), and (3) post-lineout defensive actions. By identifying patterns associated with opposition steals and containment of the attacking team's lineout success across these phases, both collectively and at the team level, the study seeks to identify indicative associations that reflect how teams manage these constraints in real-world conditions. Findings are interpreted as contextually meaningful defensive-focused insights that could assist coaches, players and support staff in refining defensive systems and designing representative training sessions.
Method
This study employed a retrospective observational design, situated within a post-positivist research perspective. Match footage was analysed to explore contextual and tactical factors associated with defensive lineout performance, providing insights into past performance trends within an English Championship rugby competition. Findings were interpreted as indicative and context-dependent associations rather than causal explanations. Gatekeeper permission was obtained from the Rugby Football Union (RFU) to access the required footage, and institutional ethical approval was granted before data collection.
Sample
The sample comprised the top six teams from the 2022/23 English Championship season, selected based on their final league position to ensure analysis of high-performance standards. These teams were Bedford Blues (n = 295), Cornish Pirates (n = 337), Coventry Rugby (n = 281), Doncaster Knights (n = 334), Ealing Trailfinders (n = 339) and Jersey Reds (n = 292).
All regular-season fixtures involving these teams (Game Rounds 1–22) were included, resulting in a data set of 1876 defended lineouts across 102 matches. Playoff and cup fixtures were excluded to maintain consistency in the competitive context and opposition quality. Lineouts resulting in penalties during the throw were excluded, whereas penalties occurring in subsequent maul phases were retained, as these actions form part of defensive strategies beyond the initial contest.
Validity and reliability process
Following established guidance for designing a valid and reliable data collection system,17,18 a list of performance variables was identified through a systematic review of literature9,11 and refined through expert consultation. The expert panel comprised two rugby union coaches (combined experience >30 years in rugby union) and the second author (>20 years’ experience in rugby union and >15 years in performance analysis). No additional performance variables were added; however, wording revisions were undertaken to improve clarity and consistency. This process aimed to strengthen content and construct validity within the limits of observational performance analysis, acknowledging that definitions reflect expert interpretation, resulting in 51 action variables grouped into 14 performance categories (Table 1).
Performance variables with operational definitions.
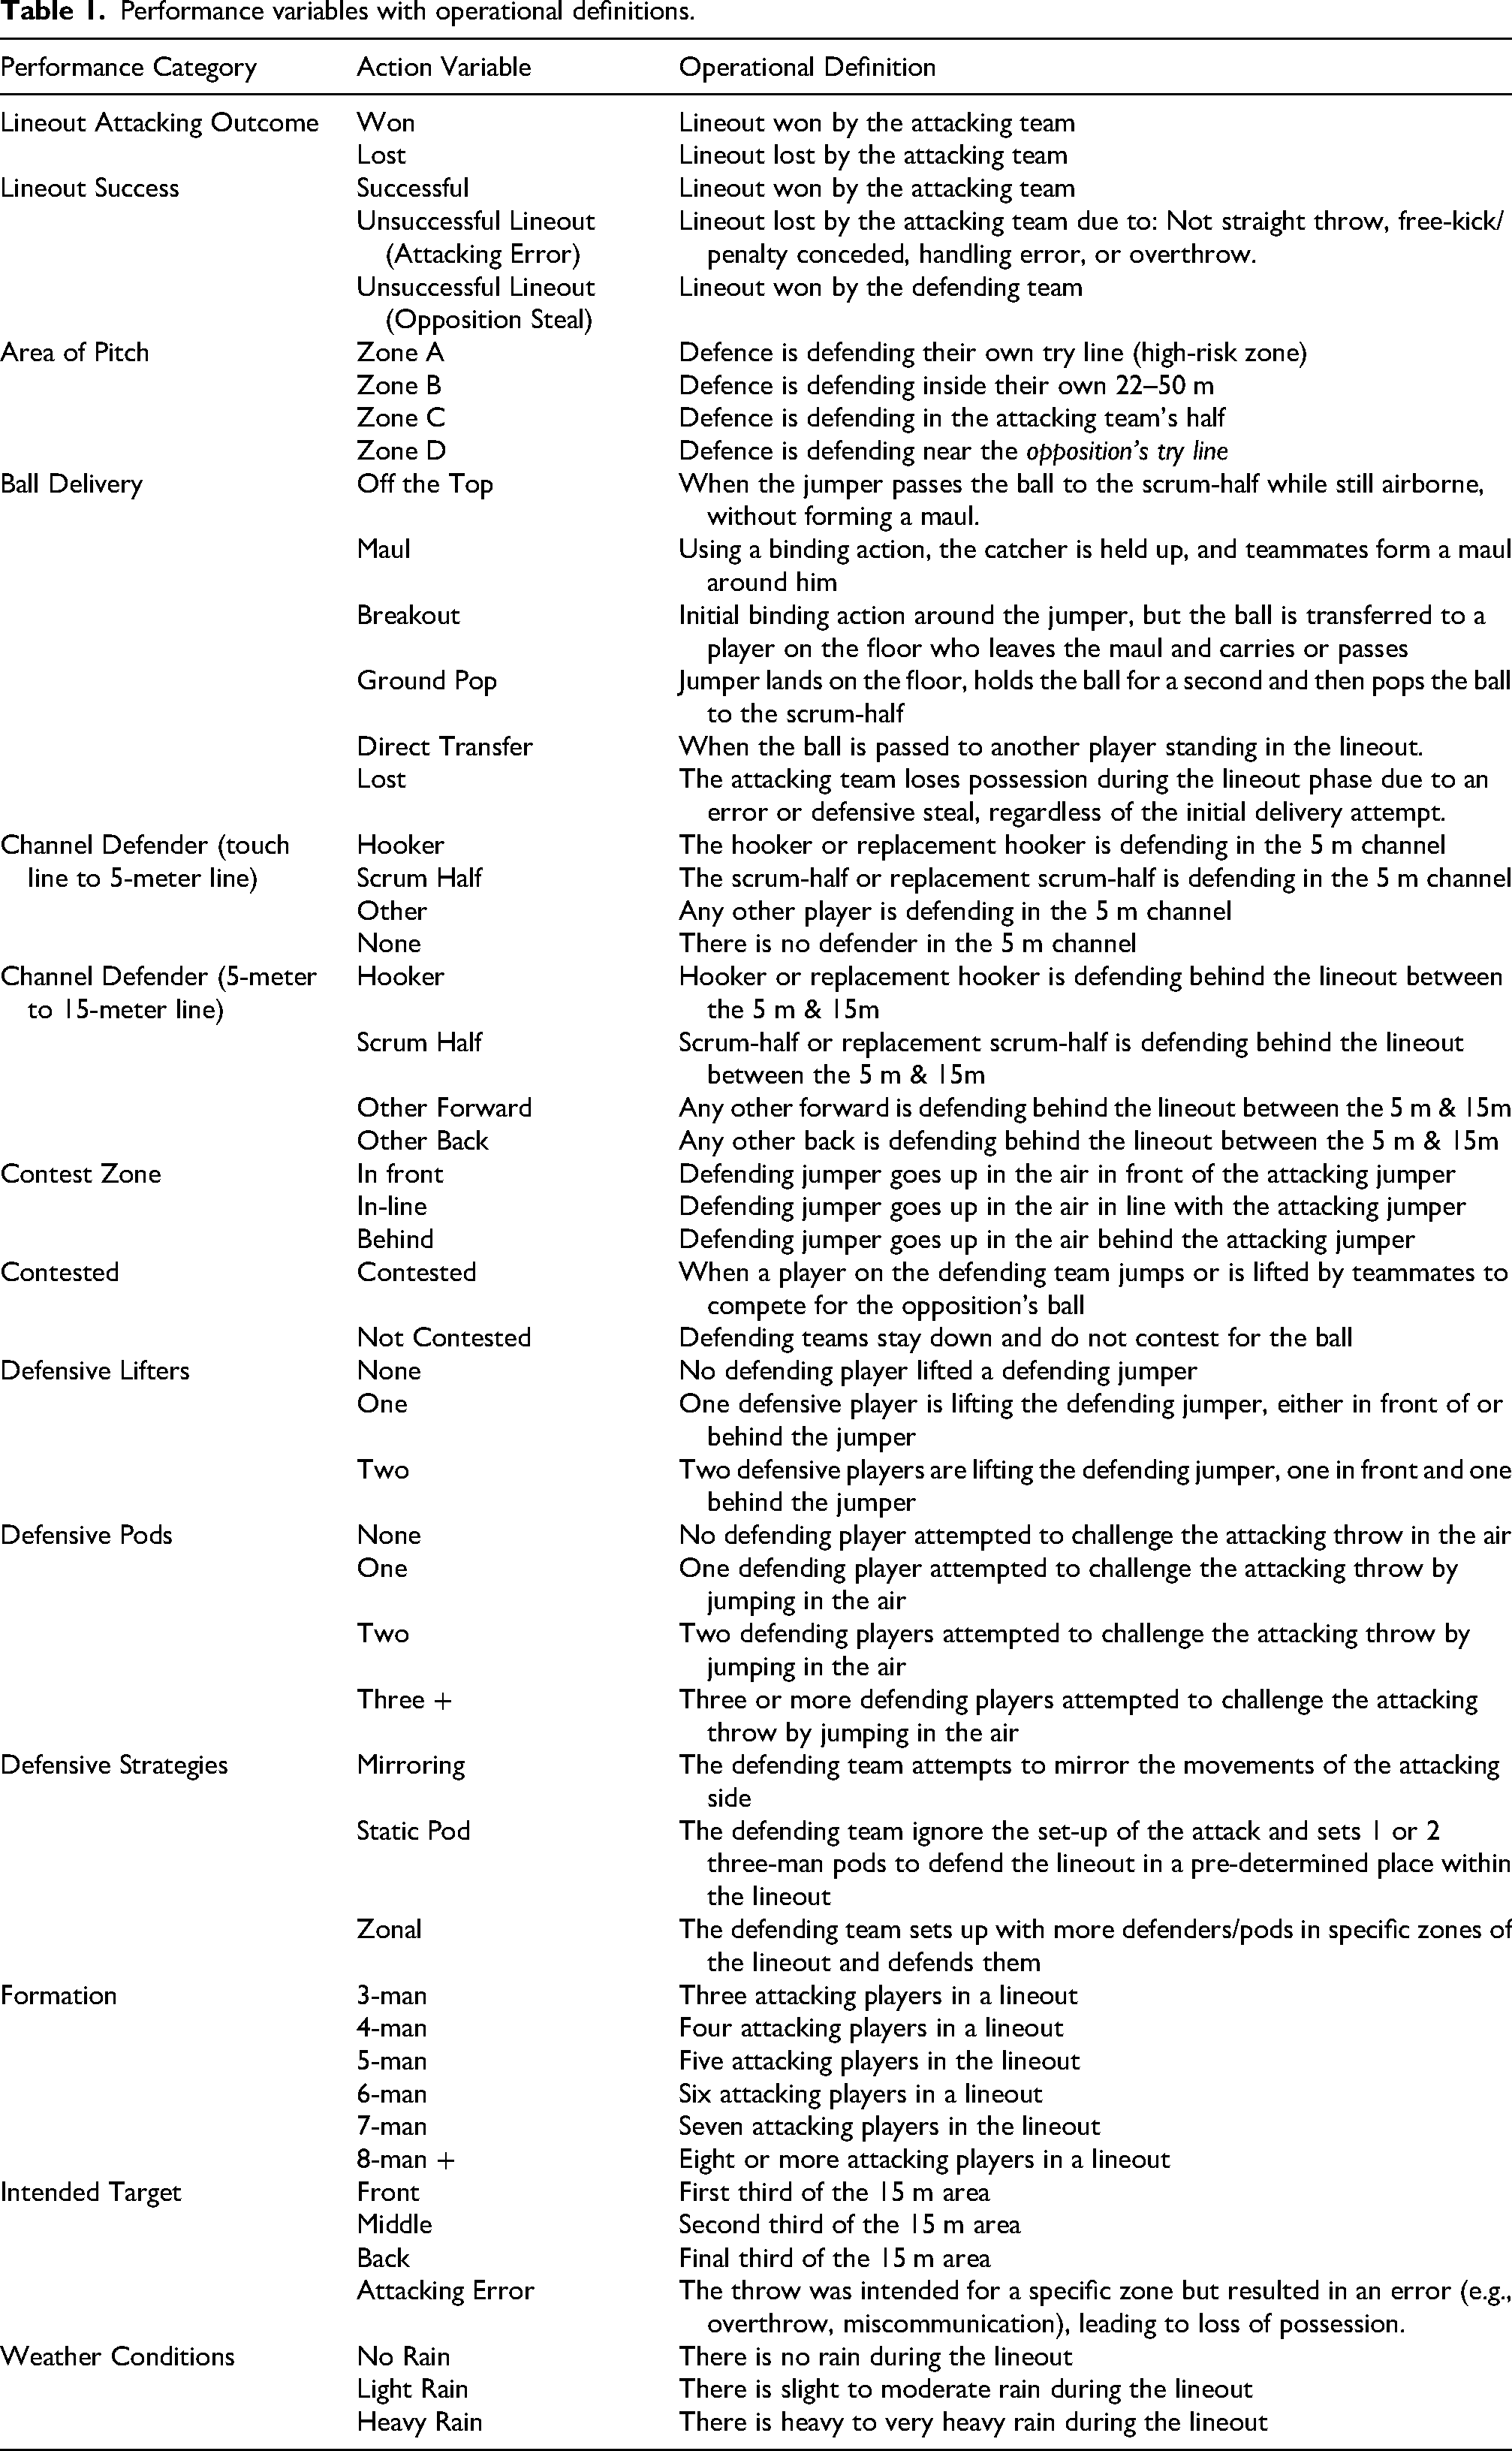
Operational definitions were primarily drawn from previous rugby union lineout research.9,11 Where published definitions were unavailable, bespoke definitions were developed using rugby union-specific knowledge from the research team and the consulted coaches. This iterative process sought to reduce subjectivity while recognising that coding decisions involve interpretation.
For this study, defensive “disruption” was operationally defined as any lineout outcome in which the defending team gained possession of the ball (i.e., opposition steal or turnover). In applied coaching contexts, lineout disruption may also refer to outcomes such as slowing ball delivery, destabilising attacking structure, or shifting momentum despite the attacking team retaining possession. However, these forms of functional disruption were not included within the present operational definition. This decision was made to ensure objective, reliable, and reproducible coding of outcomes, focusing on possession change as the clearest and most consistently identifiable indicator of successful defensive disruption.
The agreed performance variables and operational definitions informed the design of a custom code window in Hudl SportsCode Pro V12.24.0 (Agile Sports Technologies, Inc. dba Hudl) (Figure 1). Both authors undertook approximately 15 h of system familiarisation over two weeks to ensure knowledge and proficiency in data collection procedures.
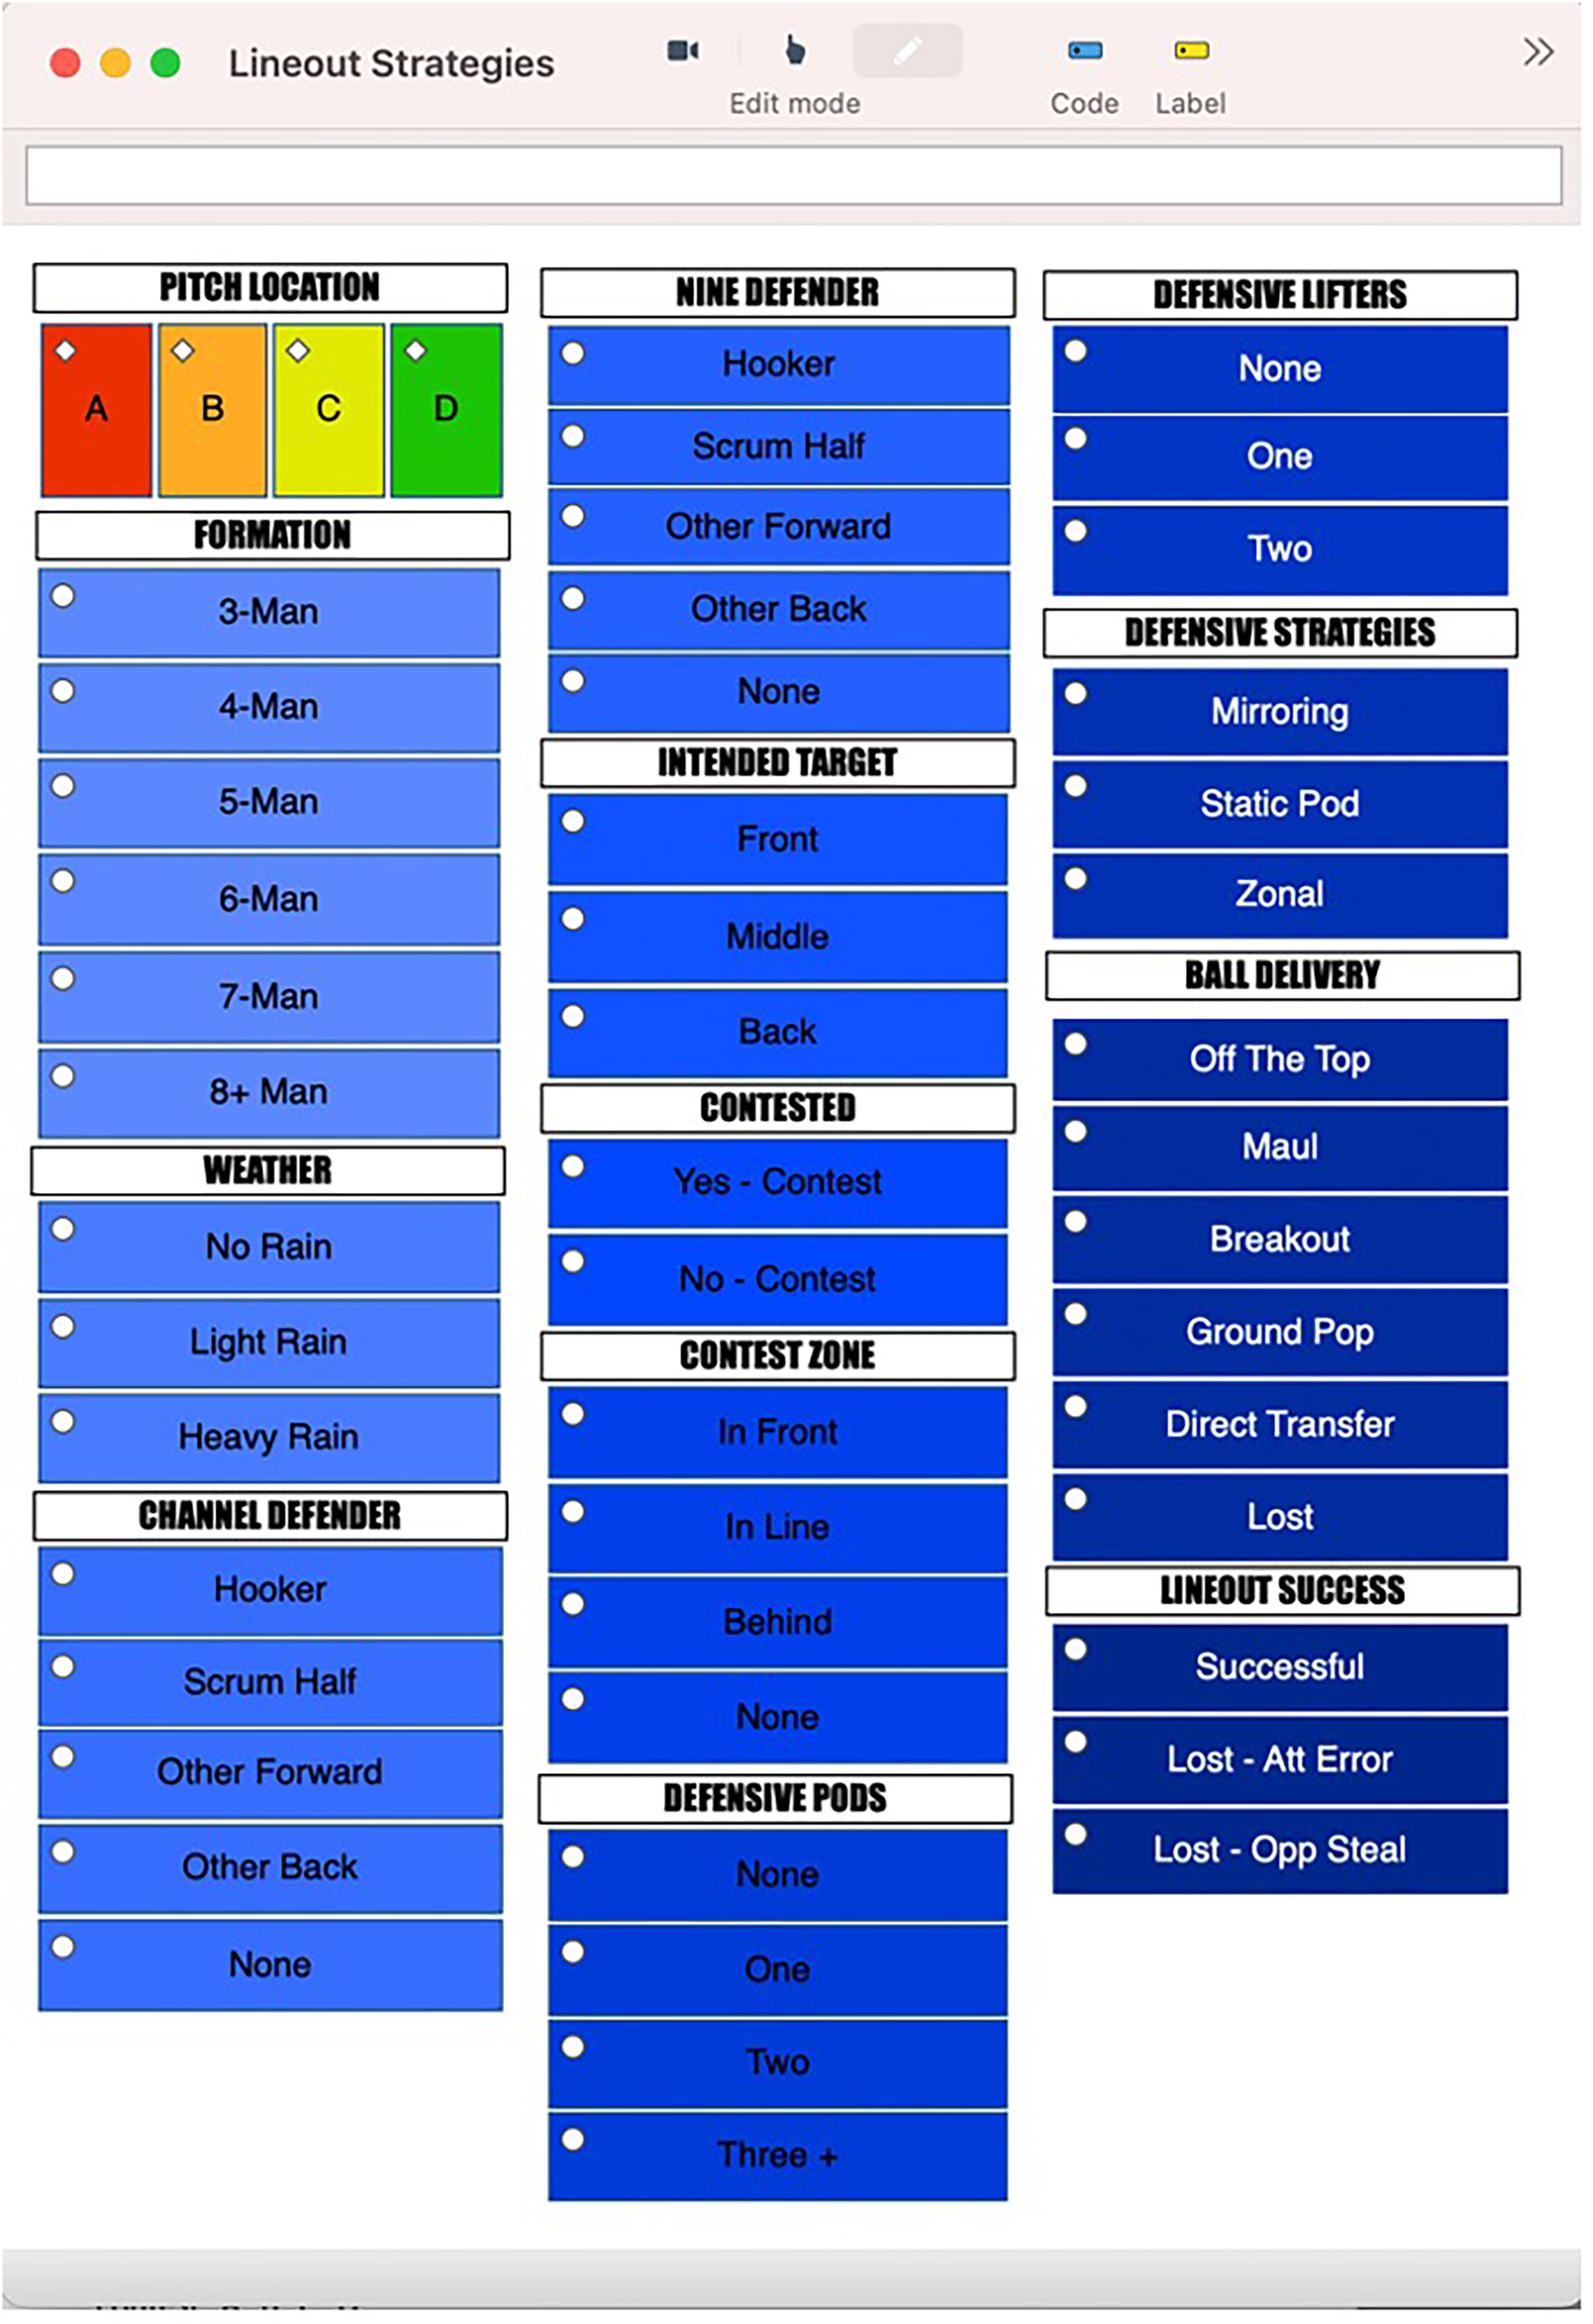
Customised code window in Hudl SportsCode.
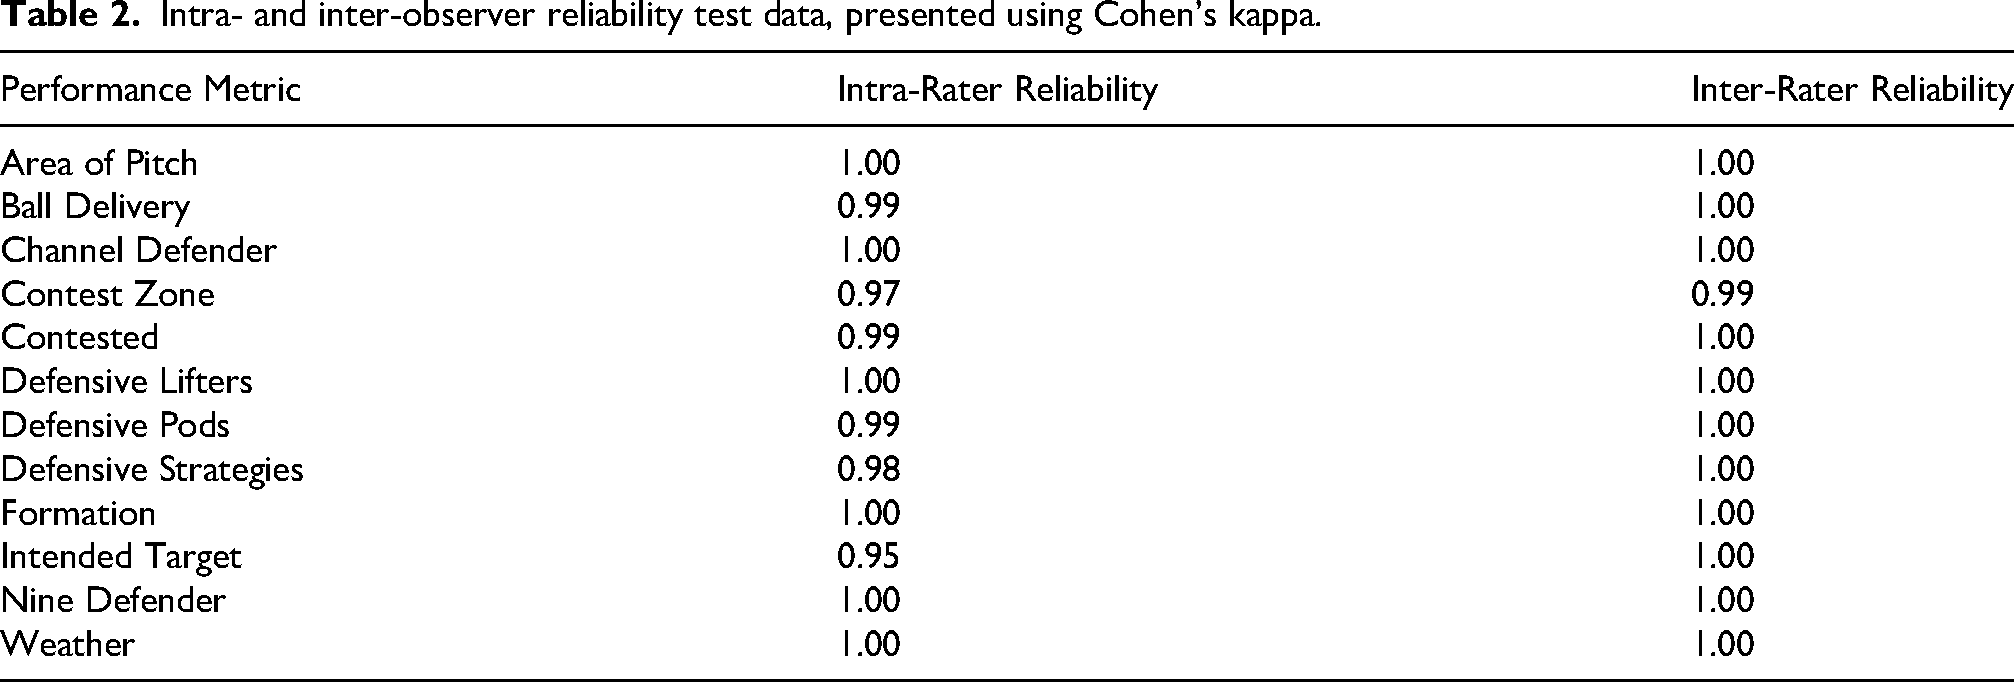
Reliability testing of the data collection system included intra- and inter-rater assessments18,19 using a random sample of 173 lineouts from the season. Intra-observer testing was undertaken by the first author, with a re-test one week later to minimise recall bias. Inter-observer testing was undertaken by the second author, using the first author's observation as the reference data set. Agreement was evaluated using Cohen's 20 Kappa Coefficient, to strengthen reliability within the limits of observational interpretation, understood according to the following thresholds: <0.01 poor agreement, 0.01–0.20 slight agreement, 0.21–0.40 fair agreement, 0.41–0.60 moderate agreement, 0.61–0.80 substantial agreement, 0.81–0.99 almost perfect agreement and 1.00 perfect agreement. All intra-rater and inter-rater Kappa values ranged from 0.95 to 1.00, indicating almost perfect to perfect agreement across all performance categories. Minor disagreements were reviewed by the research team, and clarification of specific performance indicators was undertaken to address sources of disagreements (Table 2).18,21
Intra- and inter-observer reliability test data, presented using Cohen's kappa.
Procedure
Match footage was downloaded from the Rugby Football Union's EliteHub and analysed in the custom code window in Hudl SportsCode Pro V12.24.0 (Agile Sports Technologies, Inc. dba Hudl) developed as part of the validation and reliability process. Each game was analysed by the first author, who had three years of applied performance analysis experience and in-depth rugby union knowledge. Operational definitions were accessible throughout the process to maintain consistency. Data quality was further enhanced through periodic checks on a random sample of lineouts (approximately 5% per game) by both authors.17,18 Any discrepancies were discussed and resolved before continuing the analysis. Upon completion, all coded data were exported from Hudl SportsCode as a CSV file via the Sorter view and stored securely for further data analysis.
Data analysis
Descriptive and inferential analyses were conducted using RStudio (2025.09.0 + 387, Posit Software, PBC). As the exported data comprised categorical variables, lineout outcomes were examined for potential associations within the sample using Pearson's Chi-square test of independence. This approach was selected to explore relationships rather than establish causality, recognising that findings are context-dependent and indicative rather than definitive. Where contingency tables contained low expected frequencies (< 5), Fisher's exact test was used to provide assumption-robust inference while retaining practically important action variables. Cramer's V was calculated to assess the strength of association, providing an effect size measure suitable for nominal data. Interpretation of Cramer's V followed established thresholds to contextualise the practical significance of observed relationships rather than imply universal generalisation. 22
Results
Lineout success
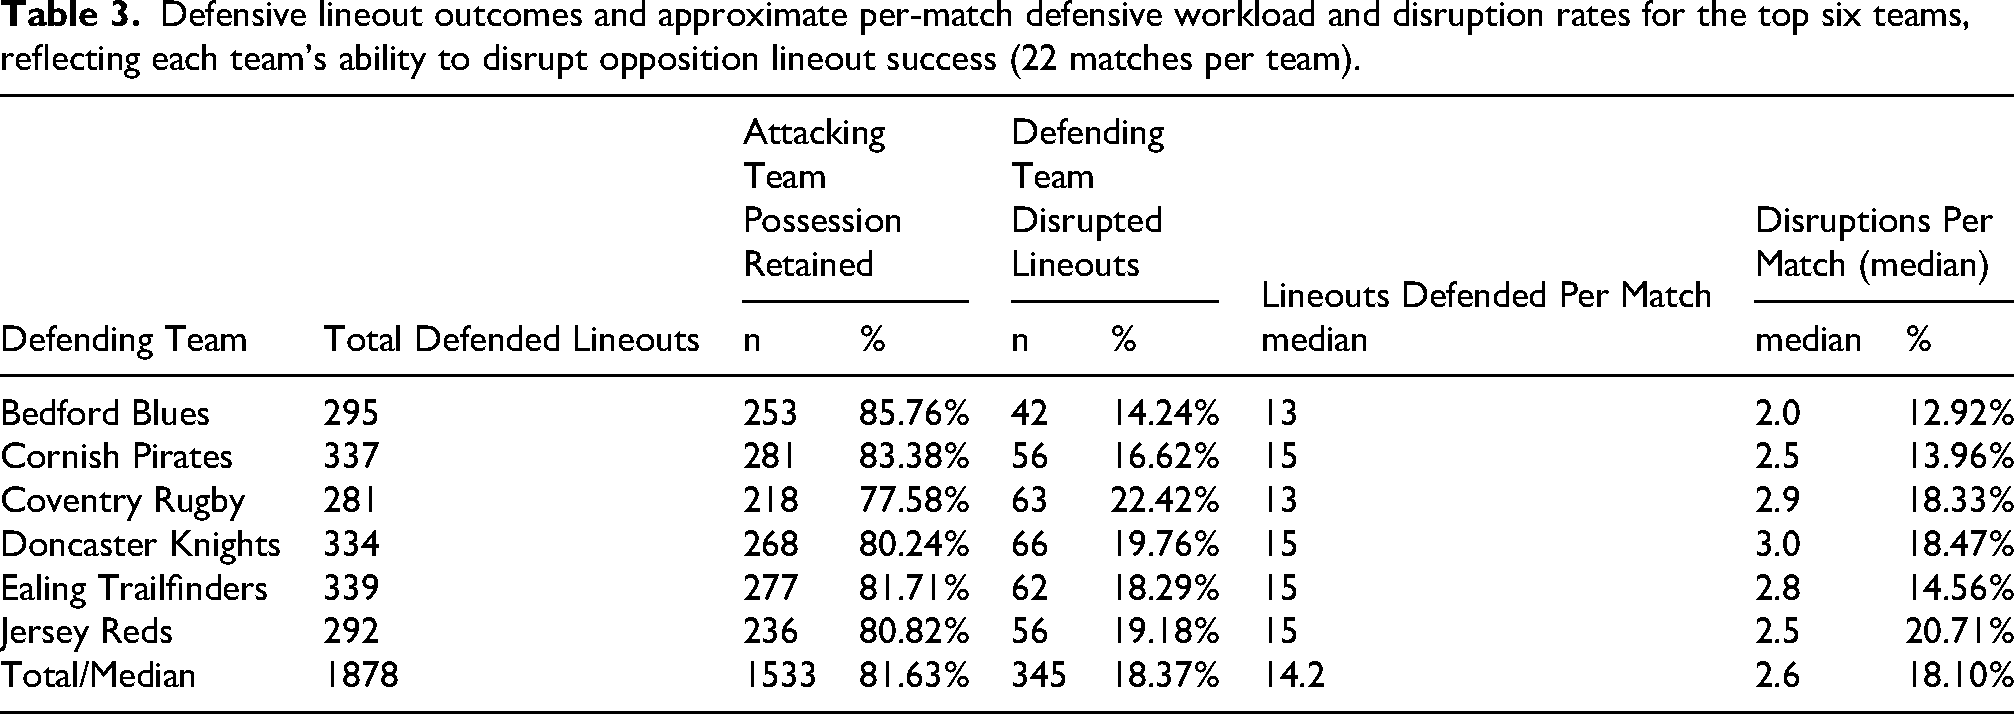
Descriptive analysis of defensive lineout outcomes across the sample indicates that most lineouts were not disrupted by the defence, with the attacking team retaining possession (n = 1533; 87.05%), and the defending team gaining possession in 18.30% (n = 343) of cases. This infers that defensive disruption occurred in specific contexts rather than uniform defensive effectiveness across teams (see Table 3). When defensive outcomes were considered on a per-match basis, differences emerged between teams in both defensive workload and disruption effectiveness. Doncaster Knights defended the highest median number of lineouts per match (15), indicating the greatest absolute defensive disruption output across the sample. In contrast, Jersey Reds also defended a high median number of lineouts per match (15) and had the greatest absolute disruption output across the sample (20.71%), reflecting greater efficiency in converting defensive contest opportunities to possession loss. Coventry Rugby demonstrated a similarly high disruption rate (18.33%) while defending fewer lineouts per match (median = 13), suggesting comparatively efficient disruption under lower defensive exposure. Taken together, these patterns infer that higher disruption rates per match were not solely a function of defensive workload, but were influenced by team-specific approaches to contest selection and execution within their defensive lineout systems (Table 4).
Defensive lineout outcomes and approximate per-match defensive workload and disruption rates for the top six teams, reflecting each team's ability to disrupt opposition lineout success (22 matches per team).
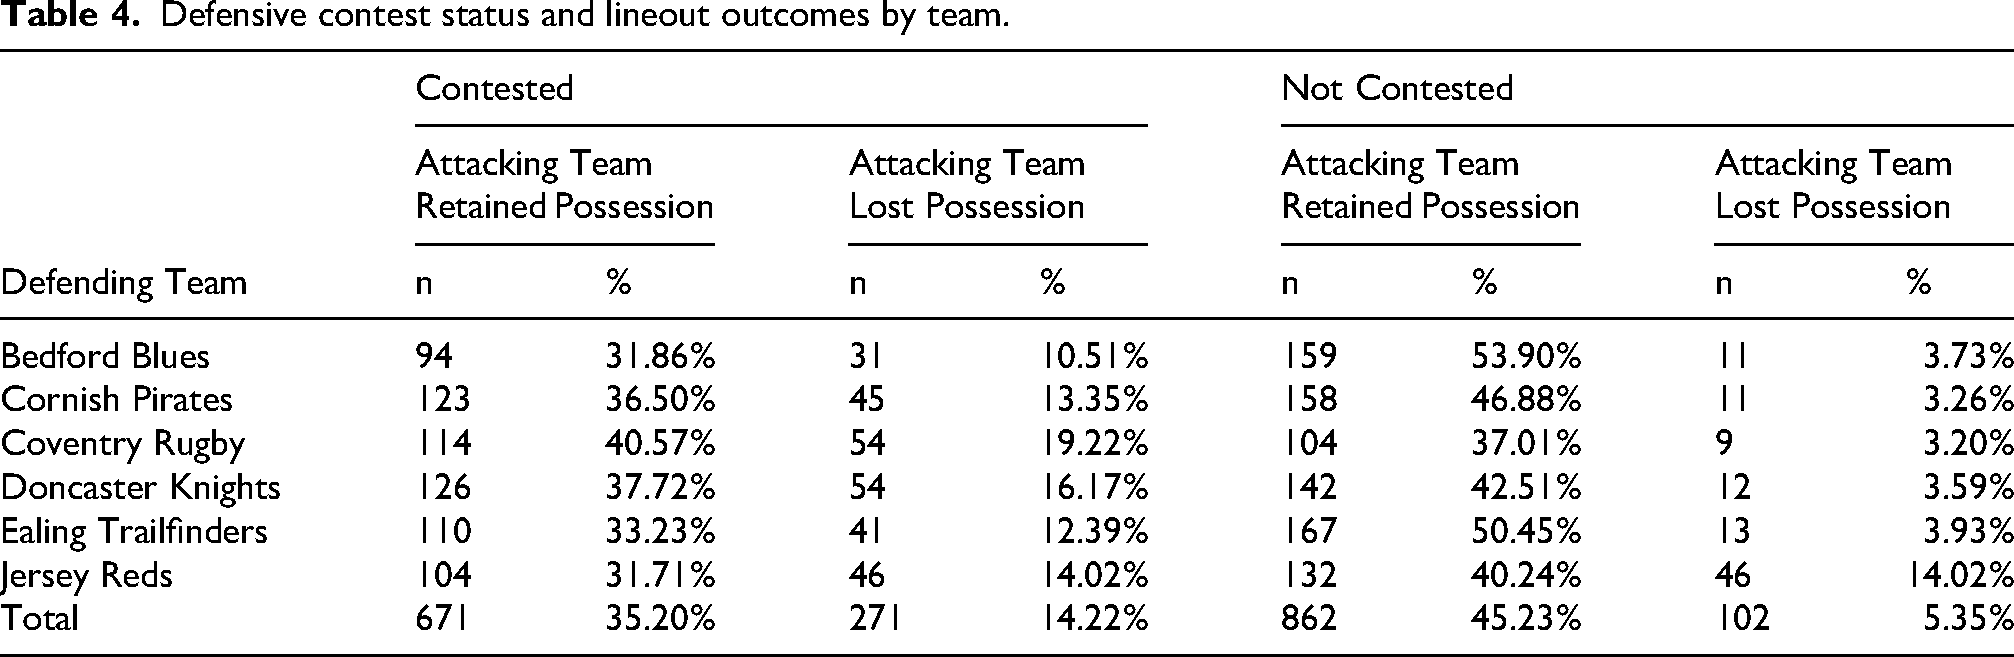
Defensive contest status and lineout outcomes by team.
Pre-Lineout phase variables
Lineout outcomes varied across pitch zones (χ2 = 26.35, df = 3, p < 0.001, Cramer's V = 0.186), with defensive disruption tending to occur more frequently as the attacking team advanced towards a scoring position, particularly in Zones A and B. Team-specific patterns showed defensive variation rather than uniform trends (see Figure 2). Bedford Blues and Coventry Rugby appeared to sustain consistent defensive performance across Zones, reflected in very small associations (Cramer's V ≈ 0.09). Doncaster Knights displayed a slightly stronger, but still small association (Cramer's V = 0.14), indicating only modest variation in defensive outcomes across zones. Ealing Trailfinders, Jersey Reds, and Cornish Pirates demonstrated moderate associations within this context (Cramer's V = 0.159–0.199). Jersey Reds were most disruptive when defending inside their own 22-halfway region (Zone B). Cornish Pirates, Ealing, and Doncaster all showed their highest disruption when defending between halfway and the opposition 22 (Zone C). Coventry were the most disruptive team when defending close to their own tryline (Zone A), recording a higher proportion of opposition lineout disruptions than any other team in this zone.
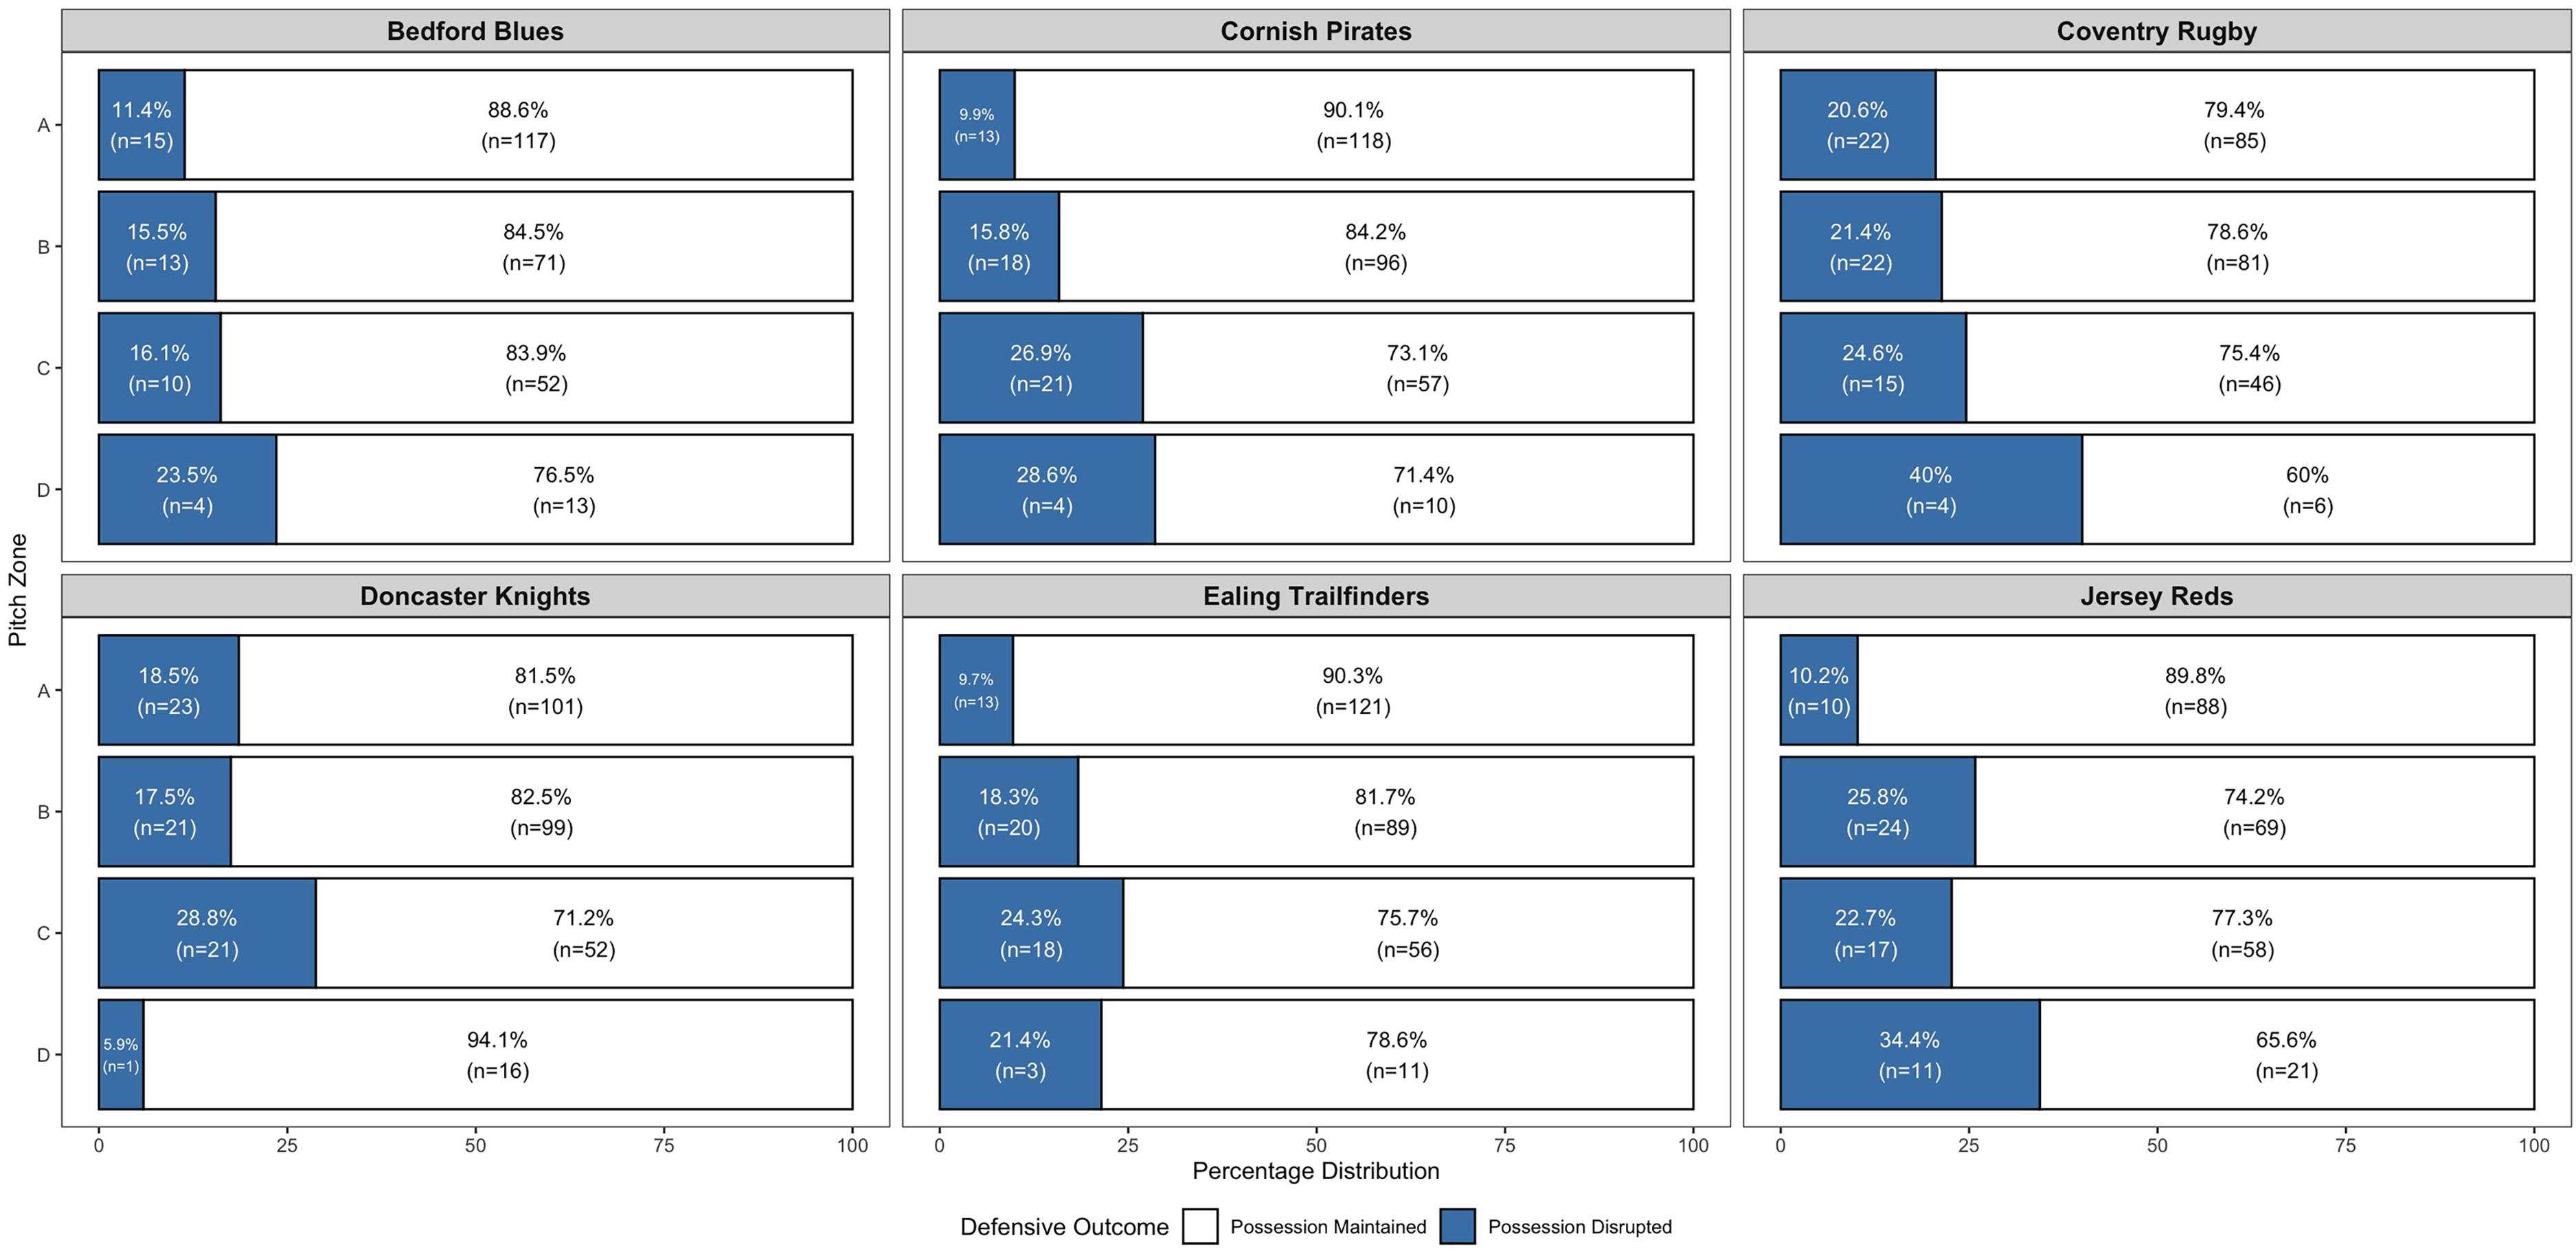
Percentage distribution of defensive lineout outcomes across pitch zones (A-D) for the top six teams.
An association was also observed between lineout formation and outcome (χ2 = 15.66, df = 5, p = 0.0079, Cramer's V = 0.091). Larger formations (6-man to 8+) were generally associated with lower defensive disruptions (i.e., higher attacking retention), suggesting a potential constraint on defensive contesting. Despite this trend, defensive formations varied across teams (see Figure 3). Coventry Rugby and Jersey Reds appeared more effective at disrupting possession in compact formations (3-man to 5-man), while Bedford Blues and Ealing Trailfinders showed weaker associations and lower disruption rates. Doncaster Knights, Cornish Pirates and Ealing Trailfinders displayed moderate associations (Cramer's V = 0.157–0.184), with Pirates most disruptive in 5-man and 7-man formations.
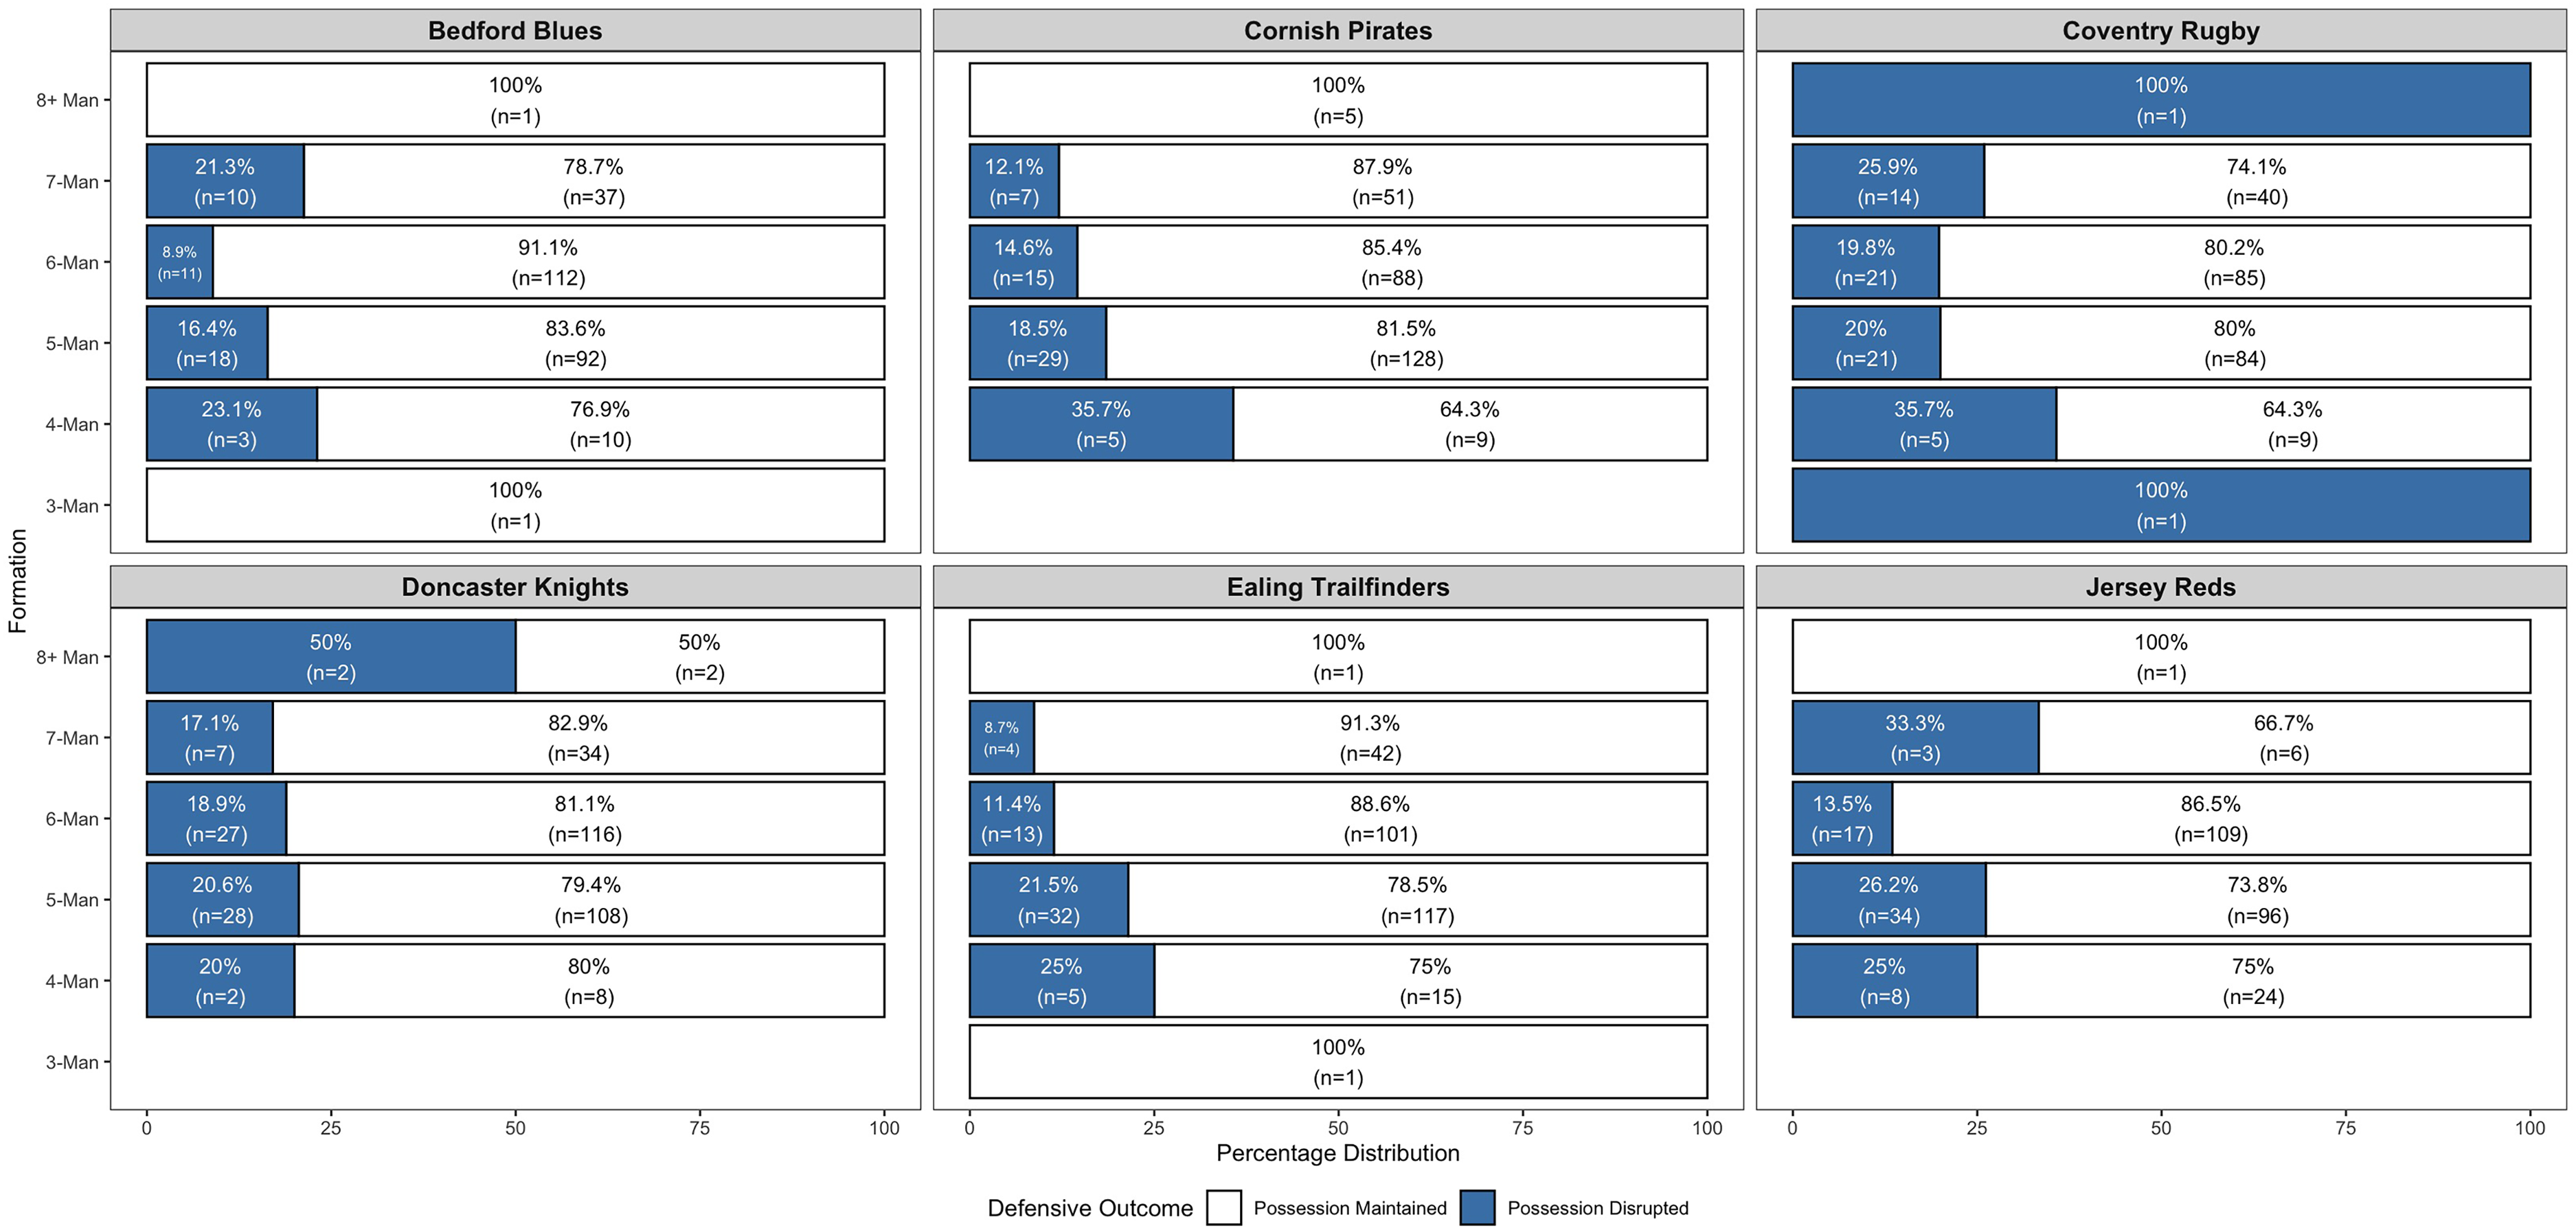
Percentage distribution of defensive lineout outcomes across formations (3-man to 8 + man) for the top six teams.
The player who occupied the space between the touch line and the 5-meter line was also associated with lineout outcome (χ2 = 16.69, df = 4, p = 0.0022, Cramer's V = 0.094). The Scrum Half was most frequently positioned here and linked to the lowest defensive disruption (i.e., highest retention rates 20.5%). Ealing Trailfinders and Jersey Reds showed moderate associations (Cramer's V ≈ 0.159–0.199) within this sample (see Figure 4), with Ealing varying defensive responsibility across Hooker and Back Defenders, while Jersey Reds relied heavily on the Scrum Half and Other Backs. In contrast, Bedford Blues and Coventry Rugby showed weak associations, typically assigning the Scrum Half to this role.
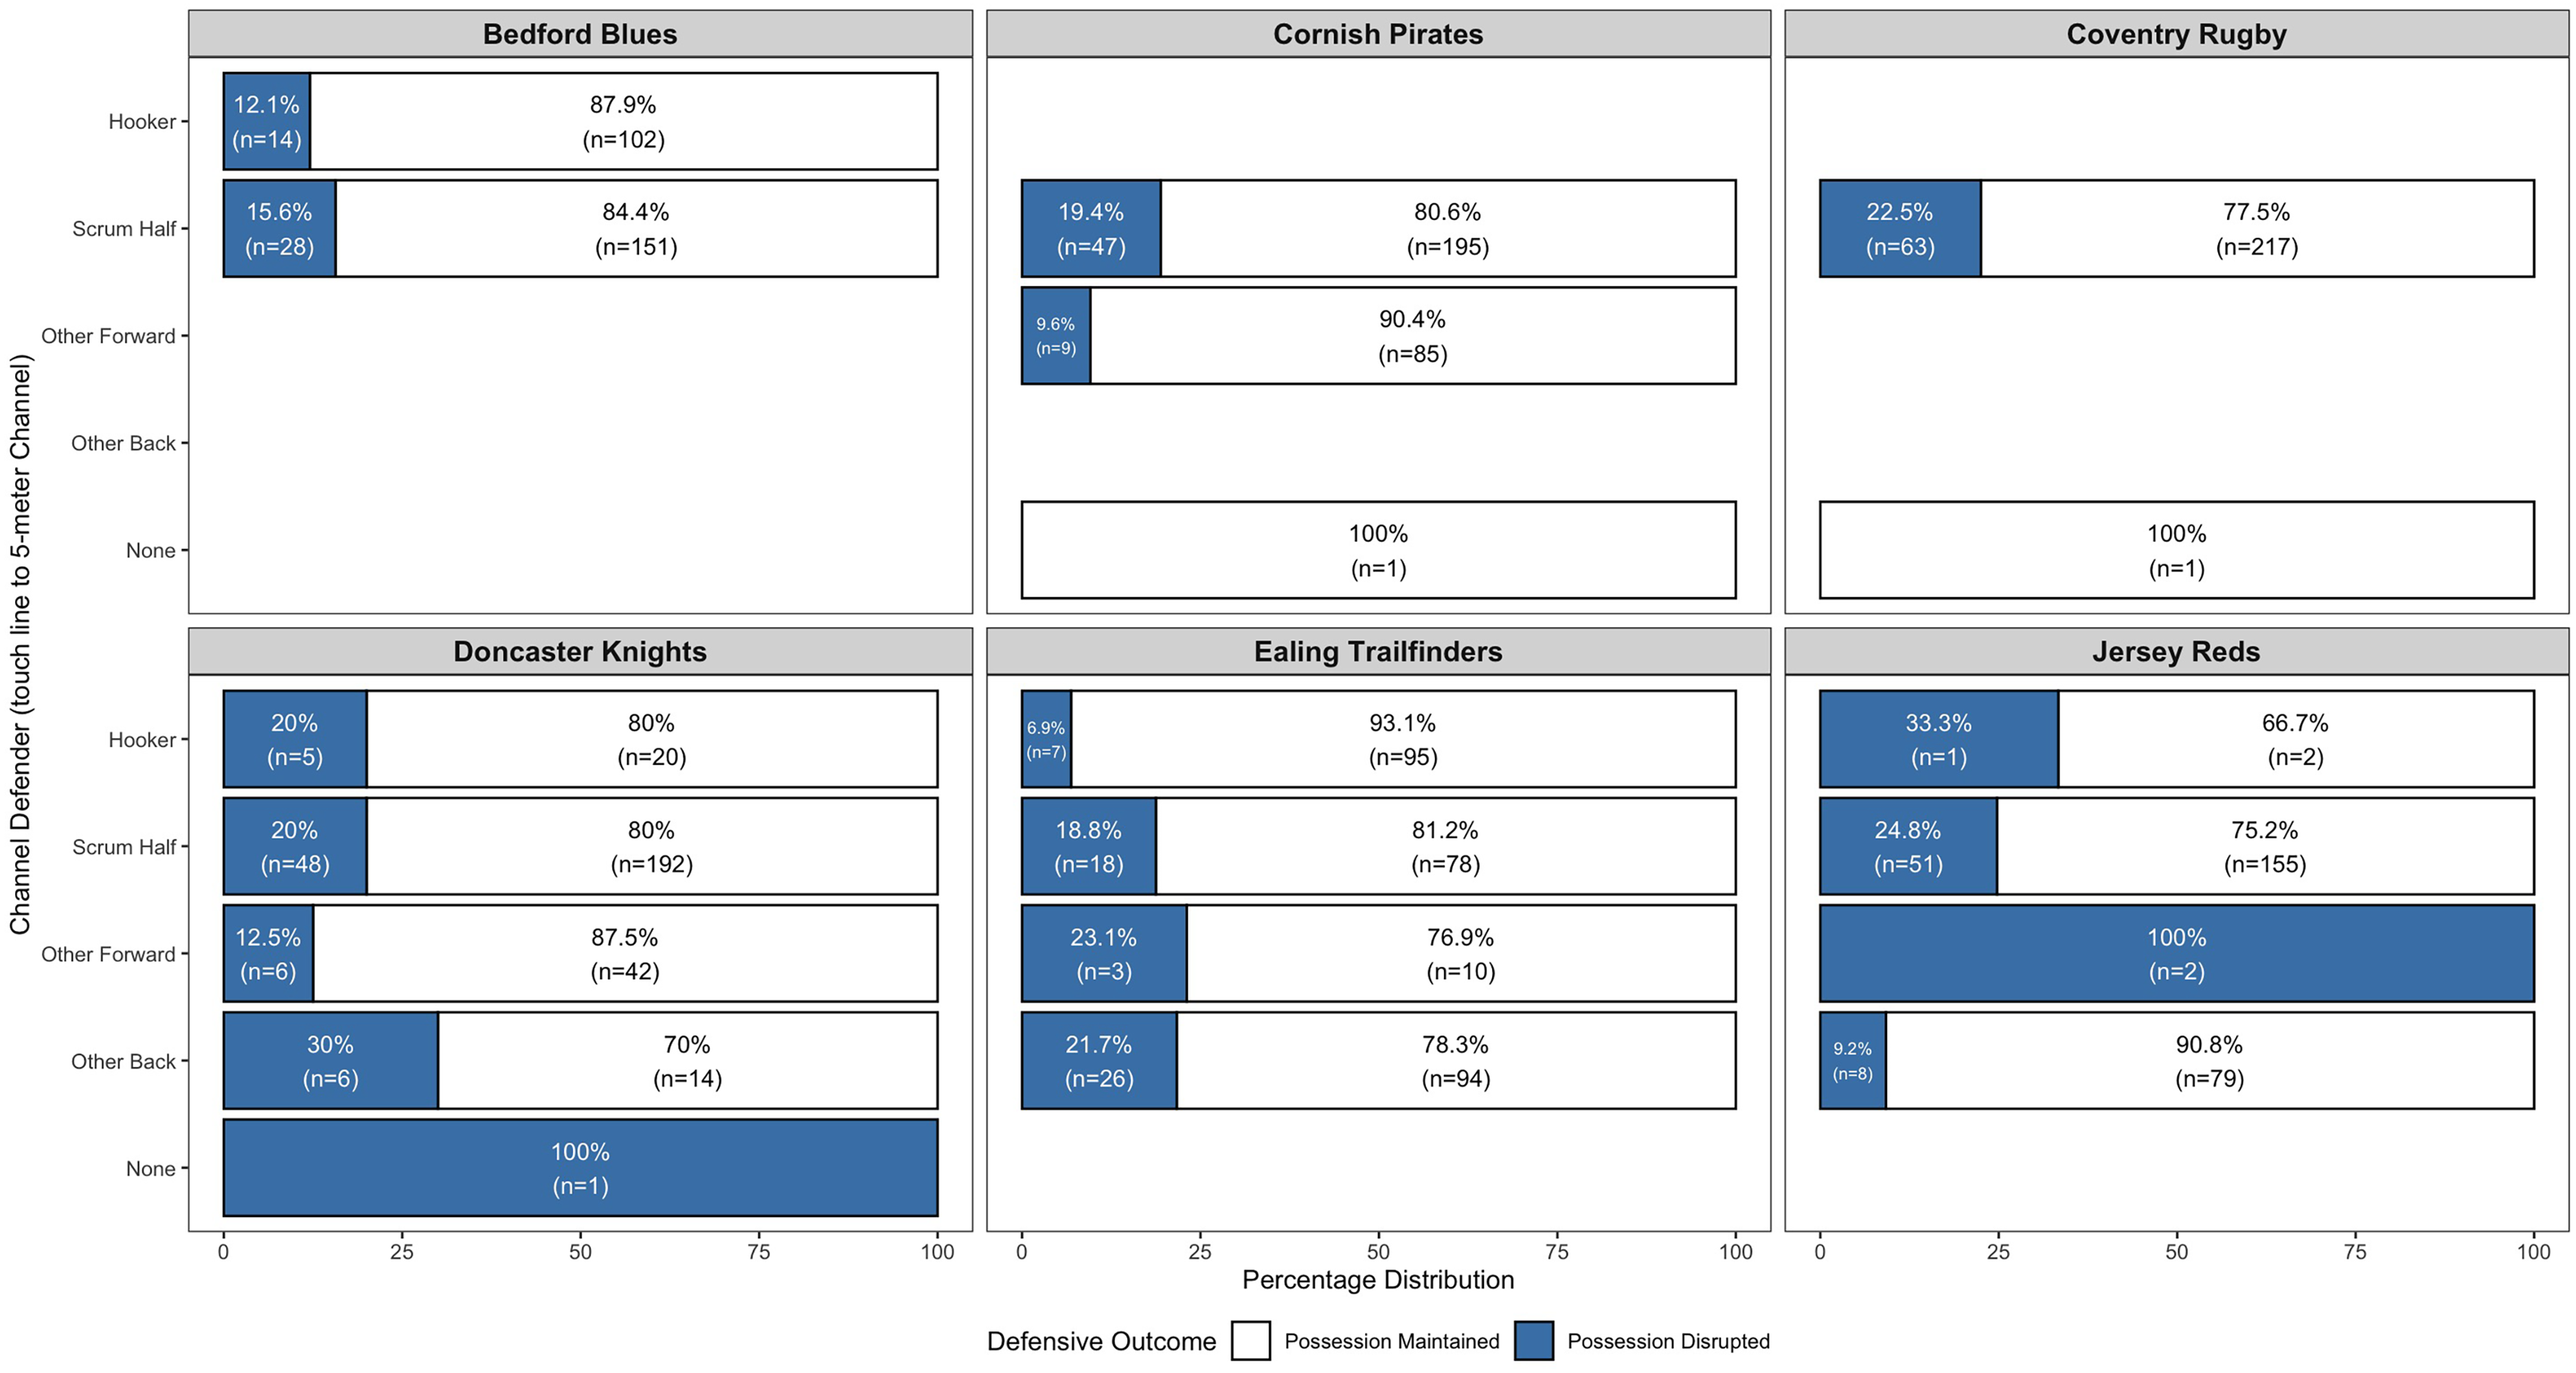
Percentage distribution of defensive lineout outcomes depending on who was positioned in the 5-meter channel for the top six teams.
Lineout outcome was also associated with who occupied the space between the 5-meter to 15-meter lines, also referred to as the receiving area (χ2 = 14.60, df = 4, p = 0.0056, Cramer's V = 0.088). The Hooker was most frequently positioned here and linked to lower defensive disruption (24.4%). Ealing Trailfinders demonstrated a moderate association (Cramer's V = 0.202), using a more varied defensive allocation across Hookers, Other Forwards, and Backs (see Figure 5). In contrast, Coventry Rugby, Jersey Reds, and Cornish Pirates relied almost exclusively on the Hooker, showing minimal variation and weaker association.
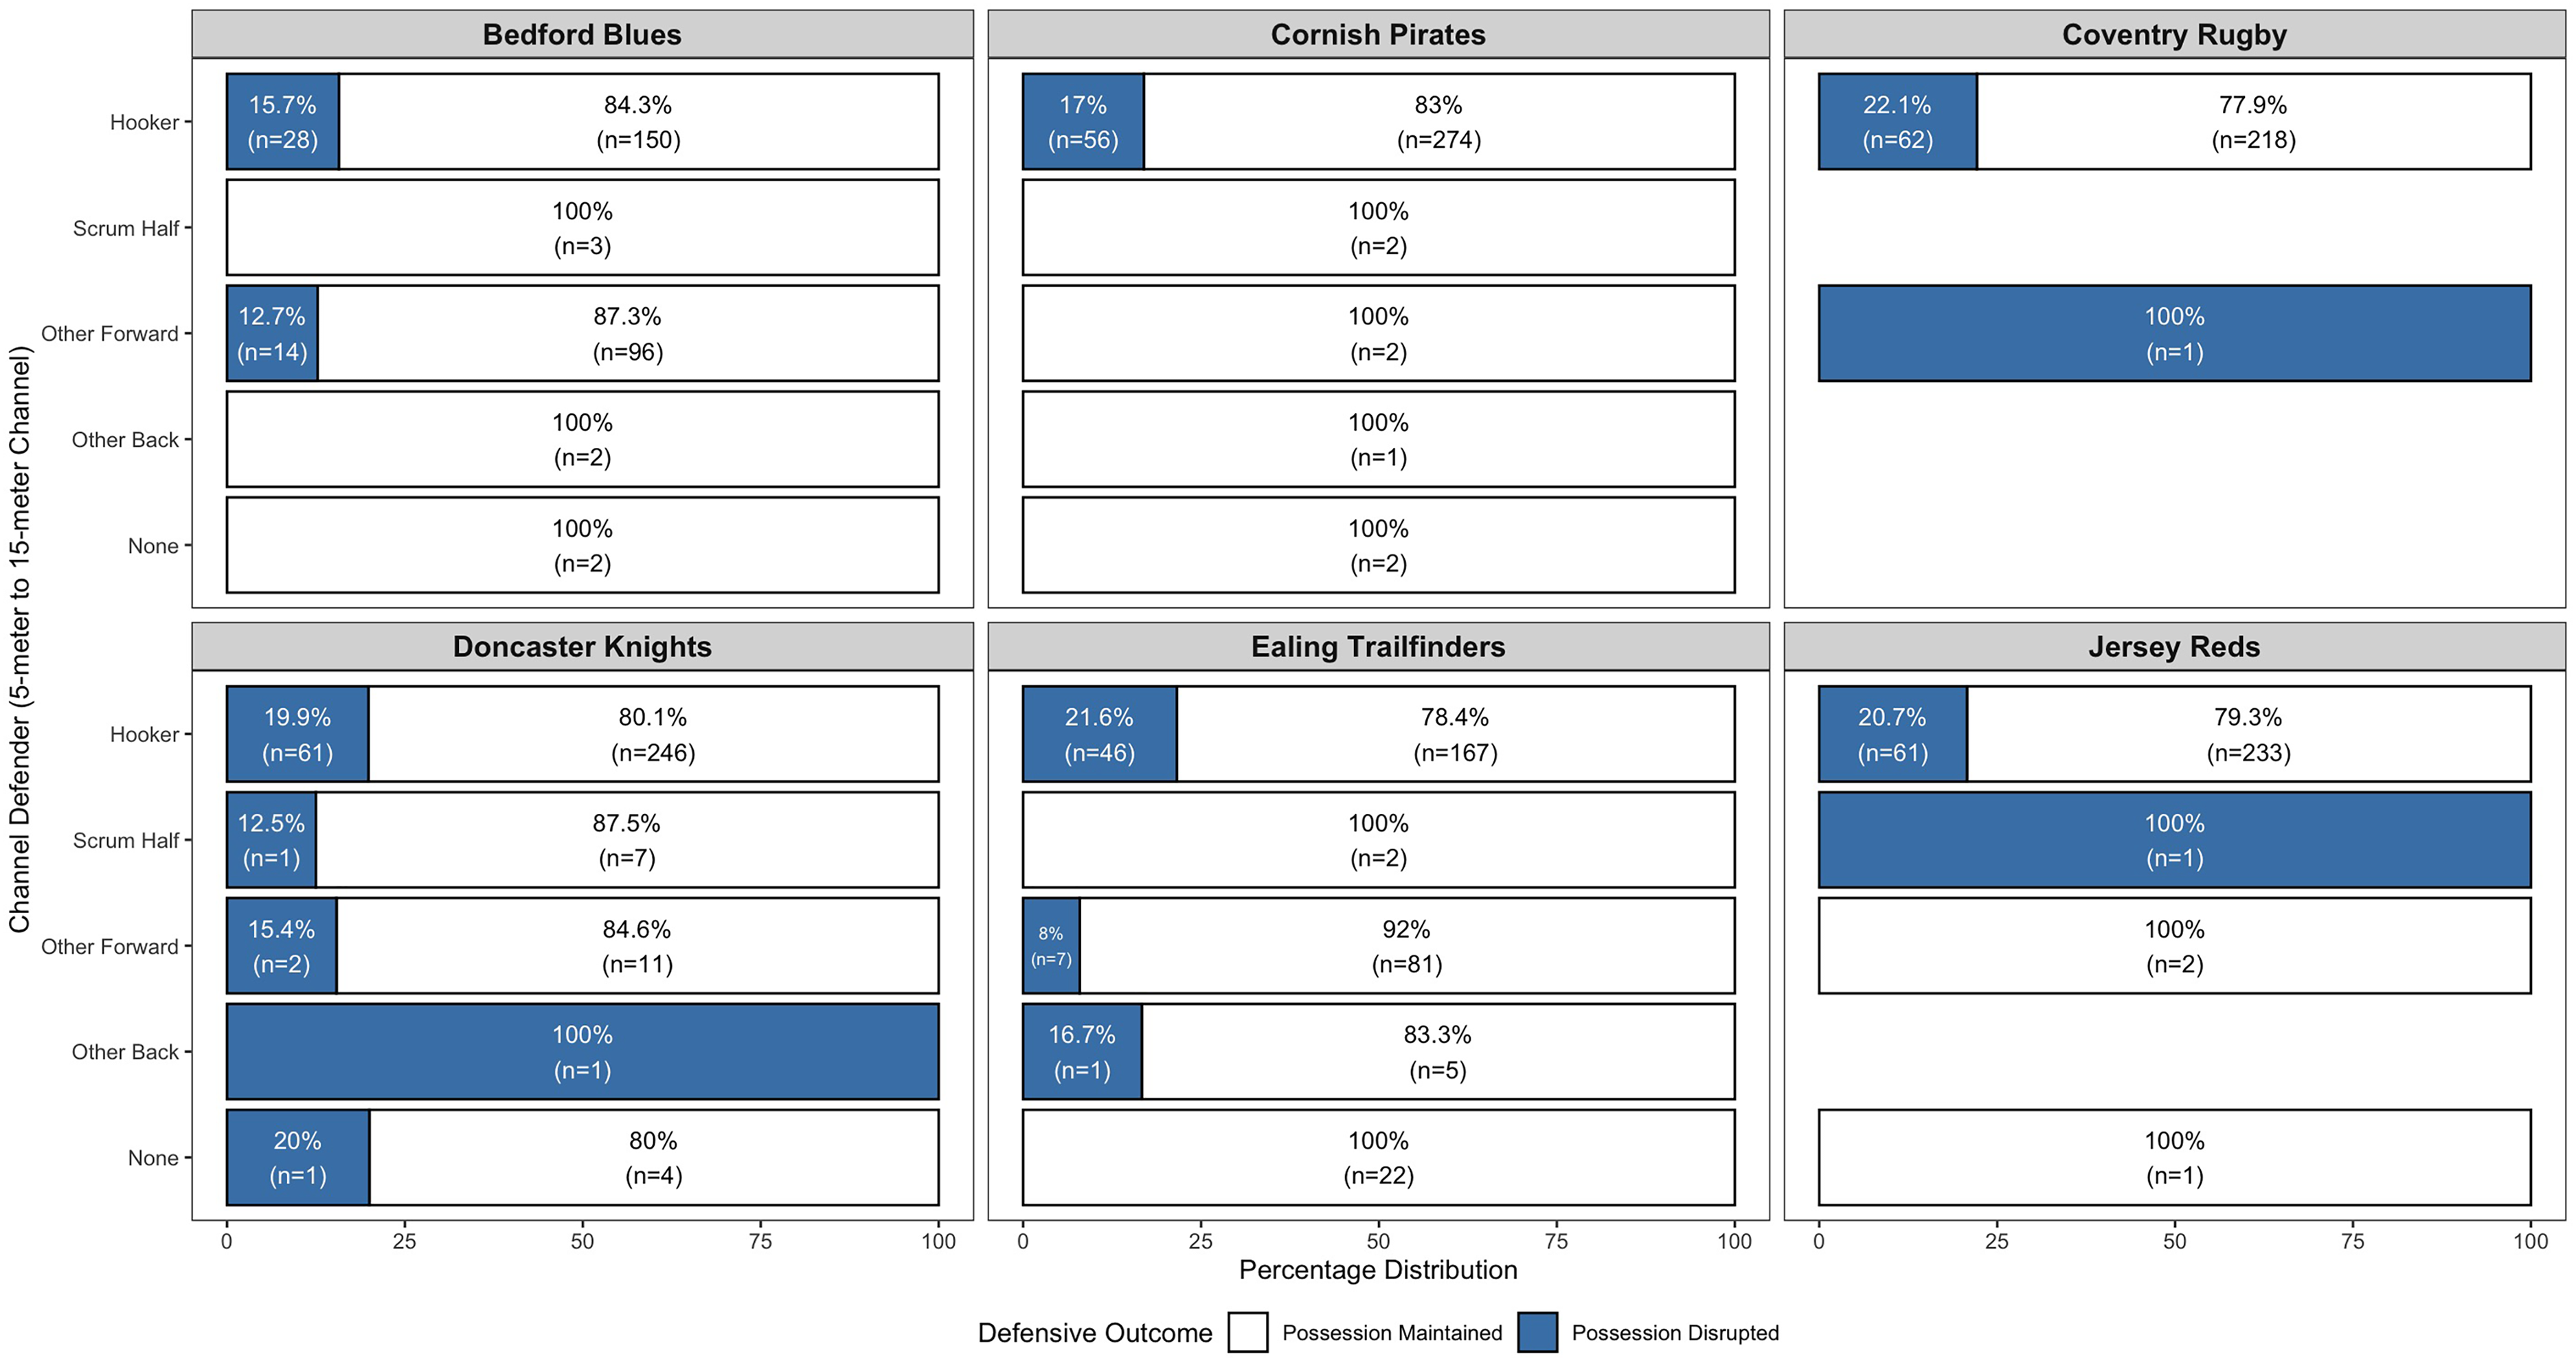
Percentage distribution of defensive lineout outcomes depending on who was positioned in the receiving area for the top six teams.
During-lineout phase variables
A small association was found between defensive contest strategy and lineout outcome (χ2 = 10.46, df = 2, p = 0.0054, Cramer's V = 0.075). Across all teams, Mirroring appeared to be the most frequently used and generally yielded higher disruption, while a Static Pod was rarely used and tended to be less disruptive. Bedford Blues (Cramer's V = 0.126, p = 0.095) and Doncaster Knights (Cramer's V = 0.119, p = 0.093) showed the greatest variation in strategy use within this context (see Figure 6). Ealing Trailfinders and Jersey Reds avoided the Static Pod strategy entirely, relying primarily on Mirroring with comparatively greater defensive success. Coventry Rugby adopted a balanced approach between Mirroring and Zonal strategies; despite a weak association (Cramer's V = 0.081, p = 0.402), they appeared to achieve the highest overall disruption effectiveness in this sample.
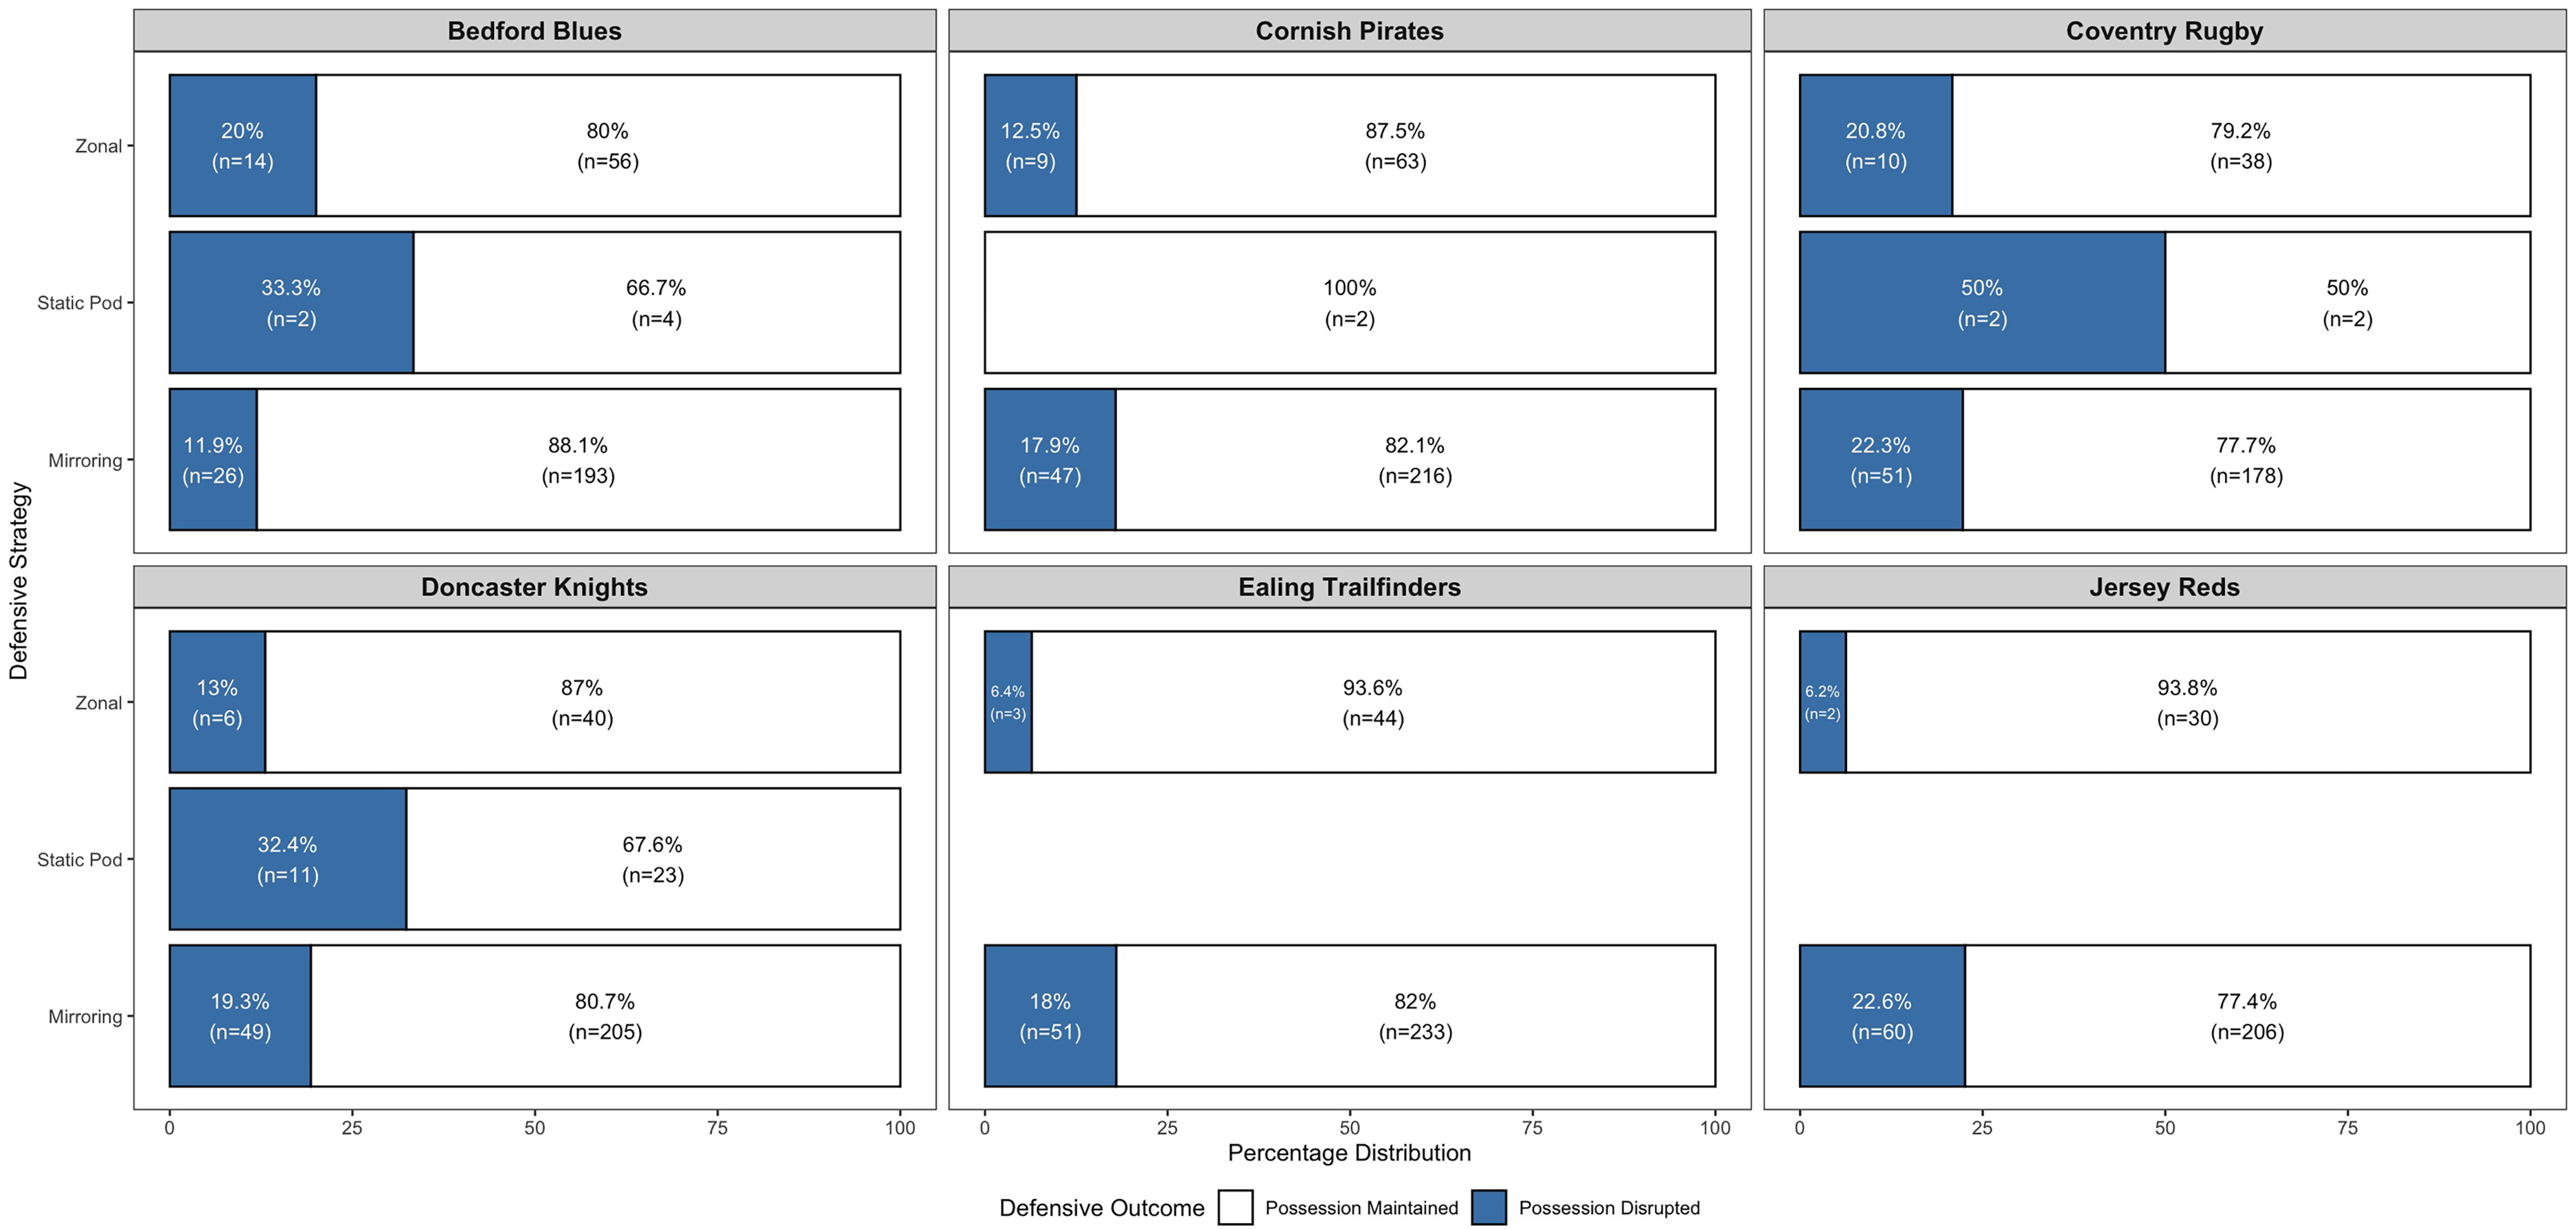
Percentage distribution of defensive lineout outcomes depending on defensive strategy for the top six teams.
Contested lineouts were more frequently associated with defensive disruption (271 losses; 14.22%) than non-contested lineouts (72 losses; 5.35%) (χ2 = 137.81, df = 1, p < 0.001). All six teams showed statistically significant associations within this sample (Cramer's V = 0.245–0.284). Coventry Rugby recorded the highest disruption rate from contested lineouts (19.22%), followed by Doncaster Knights (16.17%) (see Table 3). Jersey Reds recorded similar disruption rates (14.02%) in both contested and non-contested scenarios, suggesting that other contextual factors may influence defensive outcomes.
A strong association was observed between the defensive contesting zone and lineout outcome (χ2 = 226.58, df = 3, p < 0.001, Cramer's V = 0.348). All six teams demonstrated significant associations within this context (Cramer's V = 0.318–0.374), highlighting the apparent tactical relevance of proactive, zone-based contesting (see Figure 7). Defensive disruption was highest when contesting In Front, led by Jersey Reds (49.2%), Ealing Trailfinders (41.4%), Doncaster Knights (40.8%) and Coventry Rugby (38.8%). Lower contest frequency from Behind for Coventry Rugby and Jersey Reds may reflect a deliberate defensive preference for aggressive, proactive contesting positions, potentially supported by faster pod lift speed, aerial timing, and pre-throw anticipation.
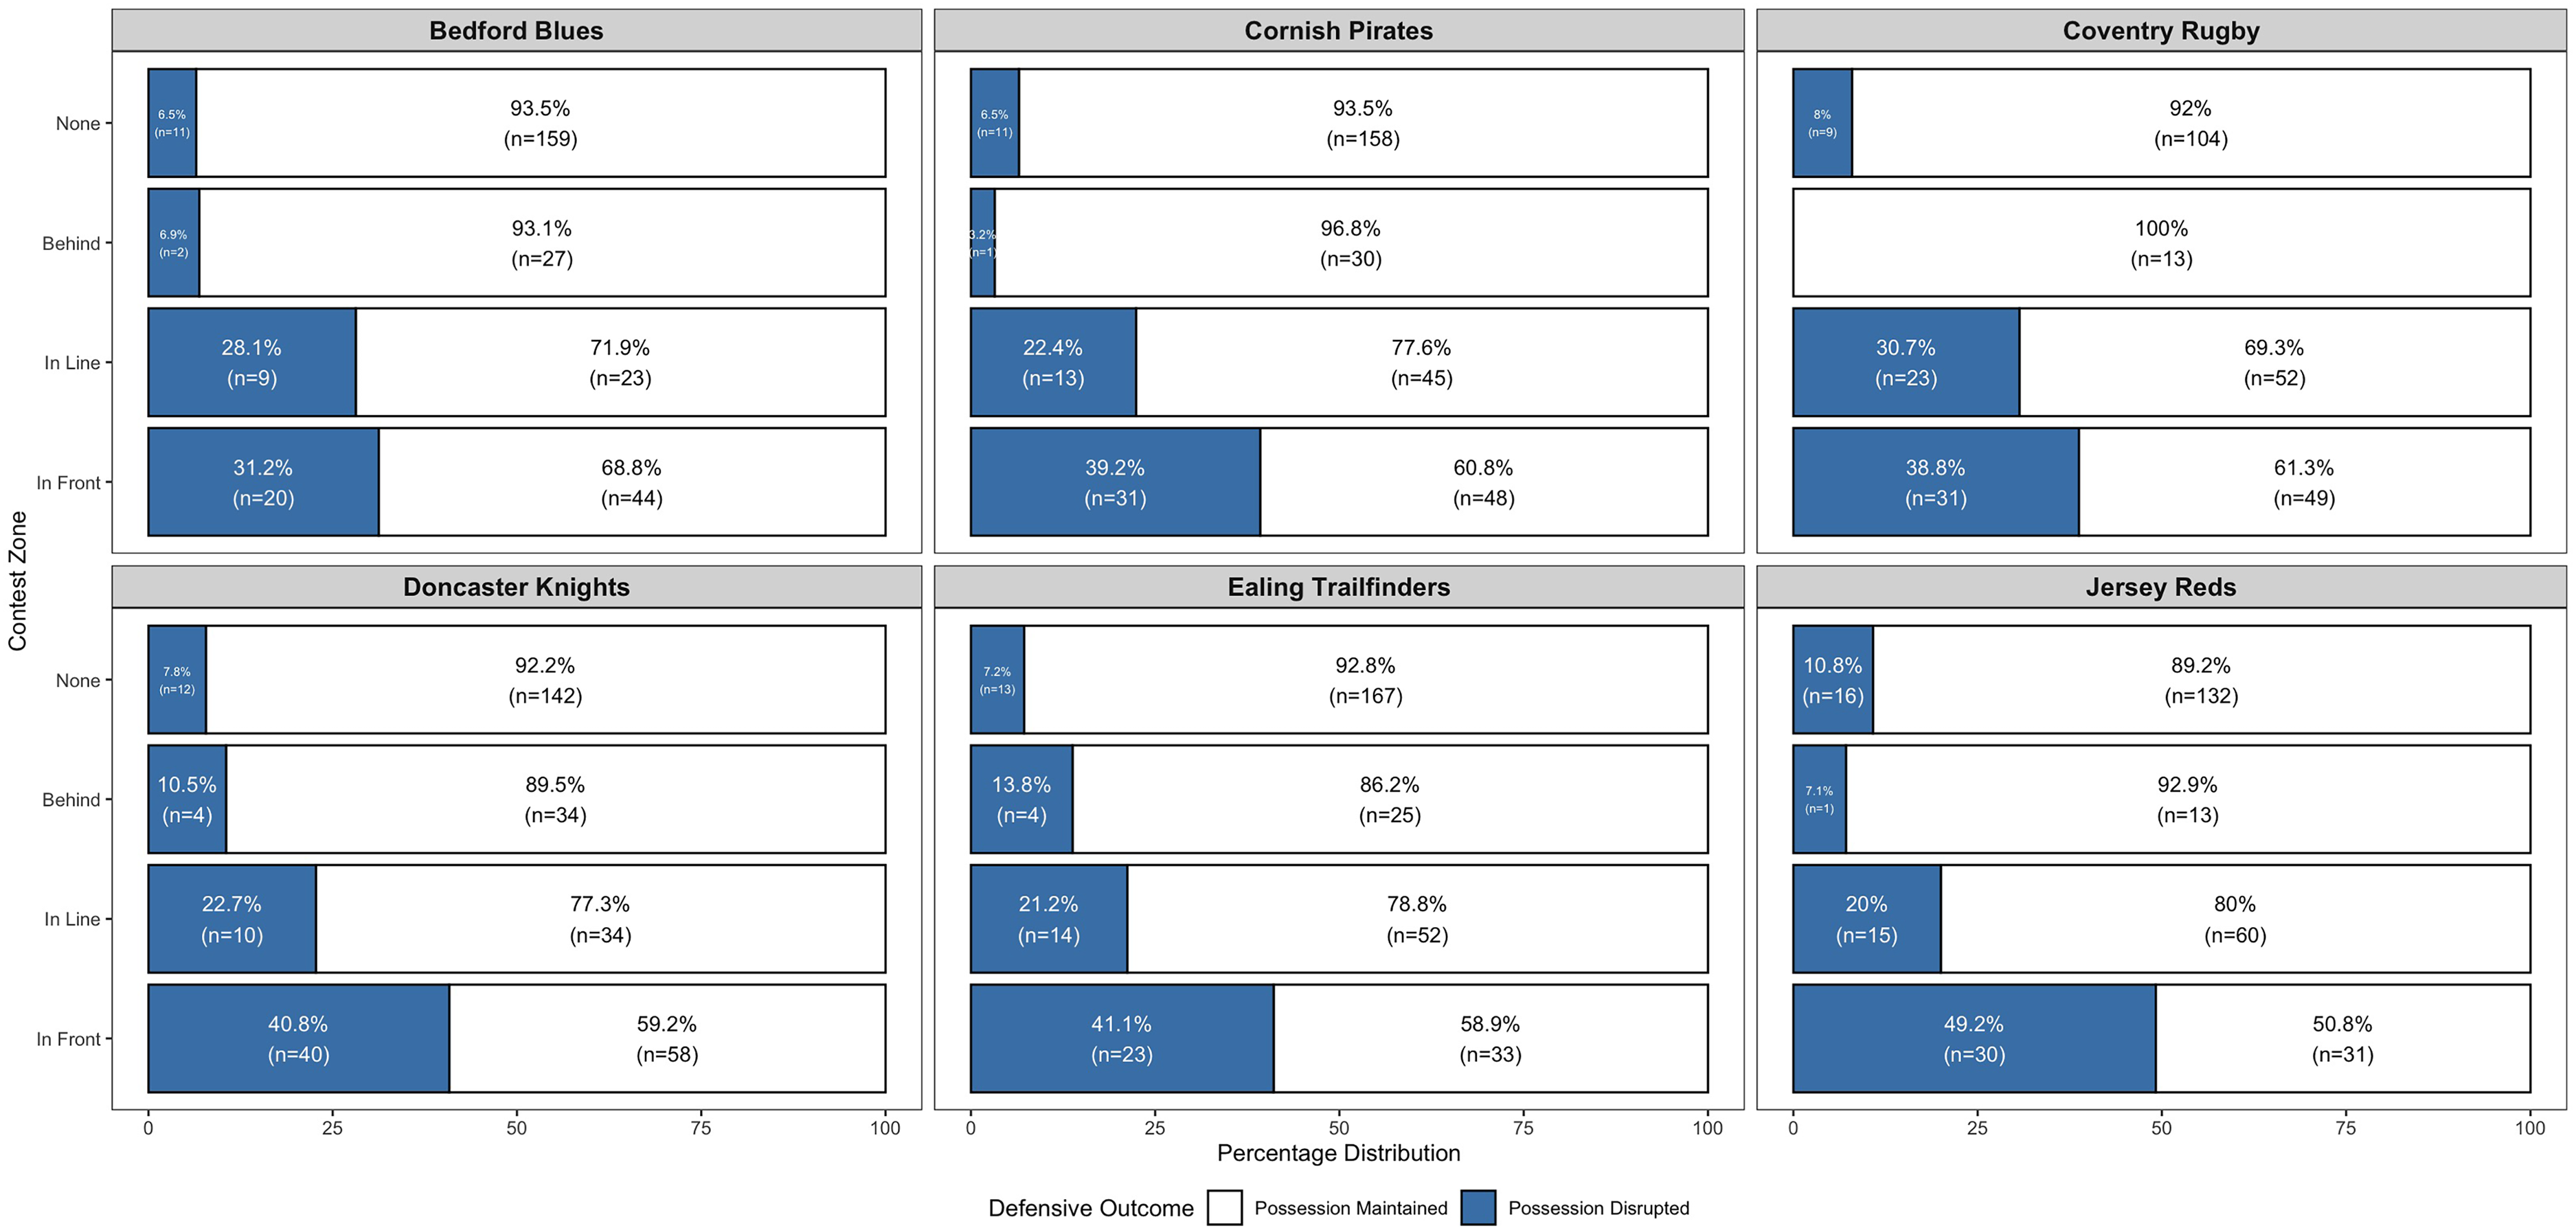
Percentage distribution of defensive lineout outcomes based on contesting zone position (none, behind, in line, in front) for the top six defending teams.
The intended attacking target zone appeared to influence defensive outcomes (χ2 = 50.34, df = 2, p < 0.001, Cramer's V = 0.164). Defensive units were least successful at disrupting throws to the Front (retention 86.7%), while they achieved more disruption to throws to the Back (retention 70.5%) within this sample. Moderate team-level effects were observed (Cramer's V = 0.149–0.215). Most defensive systems face a higher challenge against throws to the front (see Figure 8). However, Coventry Rugby, Doncaster Knights and Jersey Reds were more disruptive when the ball was thrown to the Middle and Back target zones, suggesting a tactical emphasis on contesting deeper throws in these contexts.
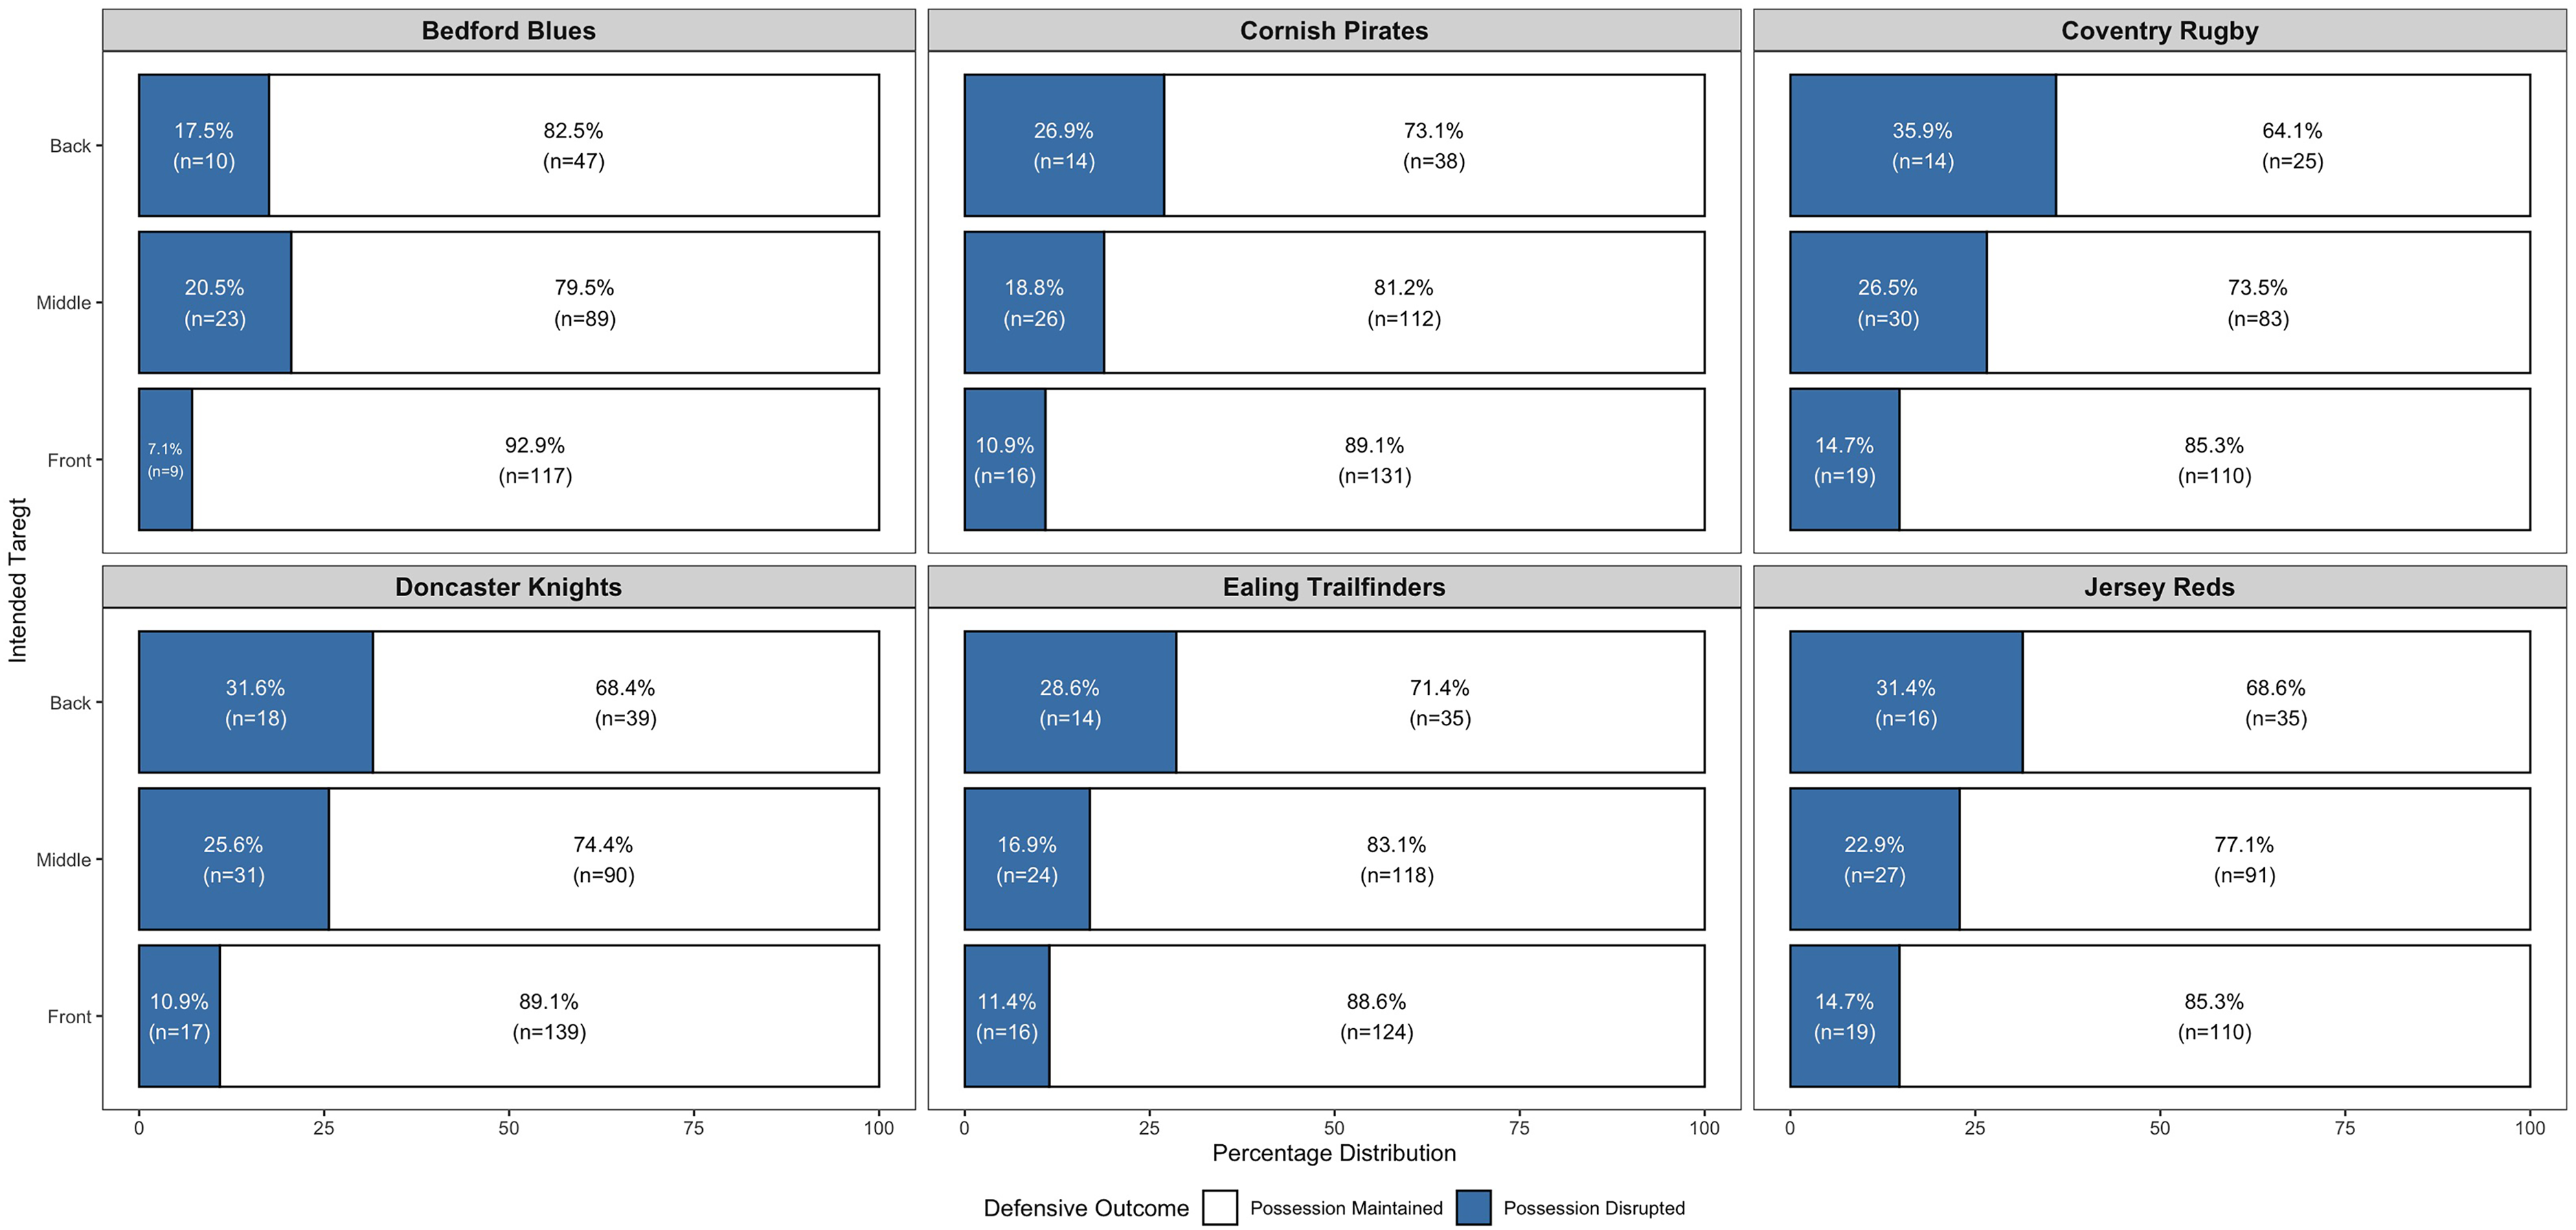
Percentage distribution of defensive lineout outcomes relative to intended target area (front, middle, back) for the top six defending teams.
An association was identified between the number of defensive lifters and disruption outcome (χ2 = 167.34, p < 0.001, Cramer's V = 0.299). Lineouts involving no defensive lifters tended to result in the lowest disruption rates, suggesting more passive defensive setups. In contrast, lineouts with two lifters were associated with higher disruption rates, suggesting that increased lifting support may be associated with the ability to challenge the throw and disrupt possession. This trend was consistent across teams in this sample (see Figure 9), with Coventry Rugby showing the strongest association (Cramer's V = 0.337).
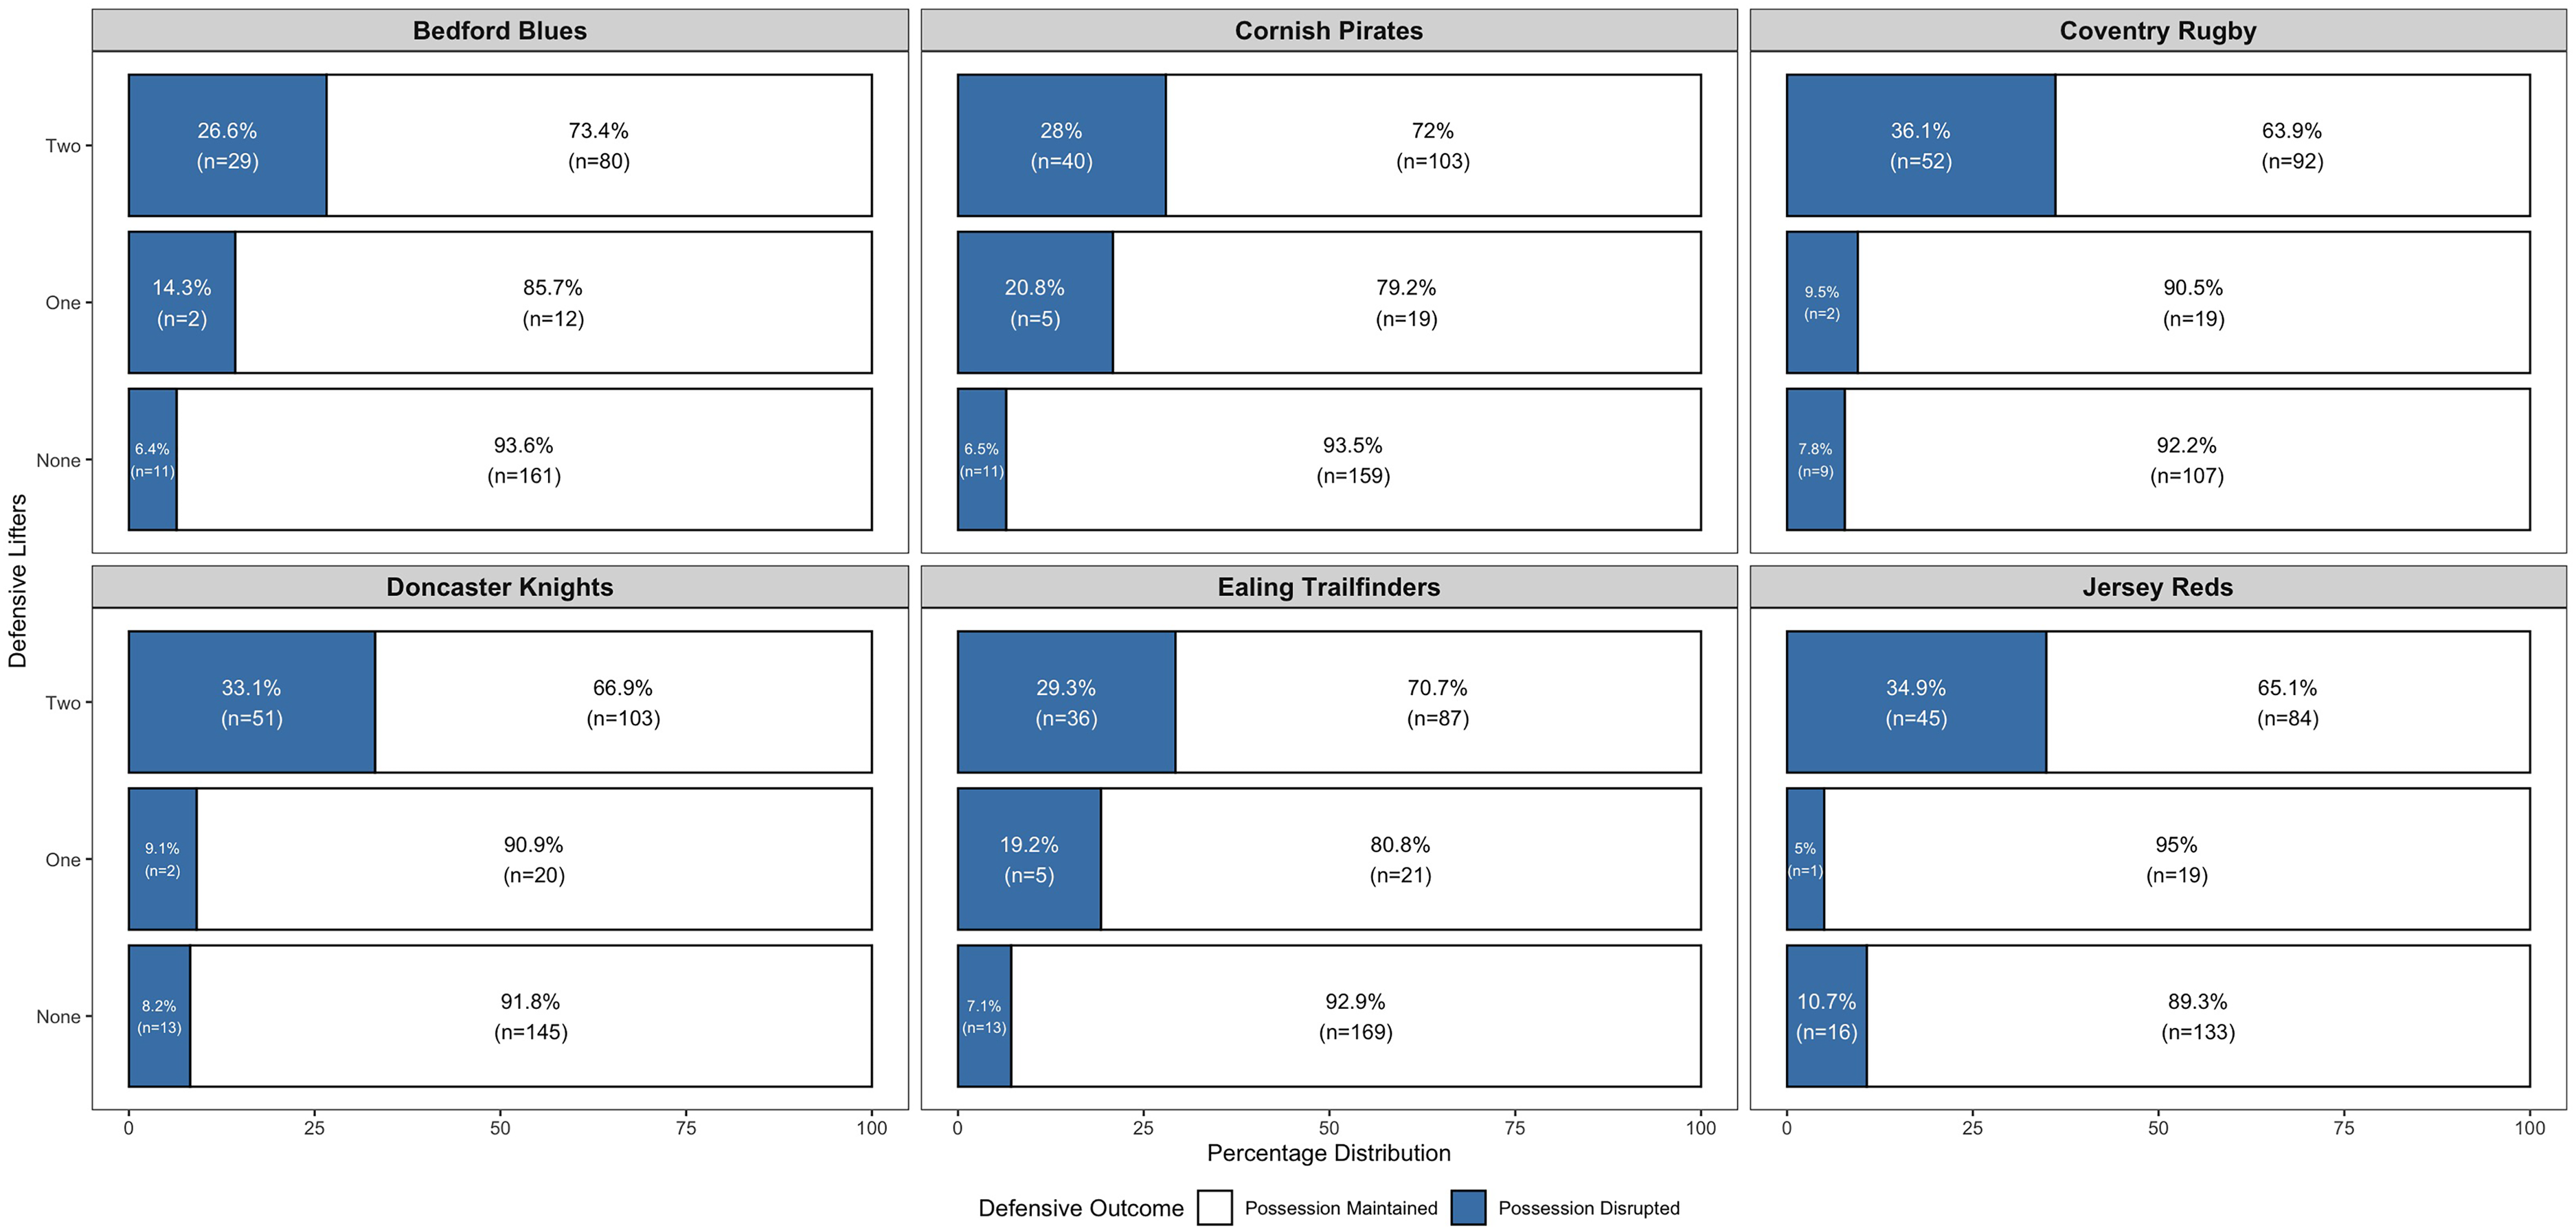
Percentage distribution of defensive lineout outcomes according to the number of defensive lifters used (none, one, two) for the top six defending teams.
Defensive Pod structure also showed a statistically significant relationship with disruption outcome (χ2 = 140.10, p < 0.001, Cramer's V = 0.273). No Pod defensive formations were the most common but tended to be the least disruptive (7.71%, see Figure 10). Two-Pod defensive formation, though least used (44 instances), was linked with the highest disruption rates (34.1%). One-Pod defensive formations were used 898 times, producing a 28.5% disruption rate, suggesting a tactical balance between contesting and defensive coverage rather than a fixed advantage. Team-level analysis reinforced these trends, with Coventry Rugby appearing most effective, particularly when defending with one pod (31.3%).
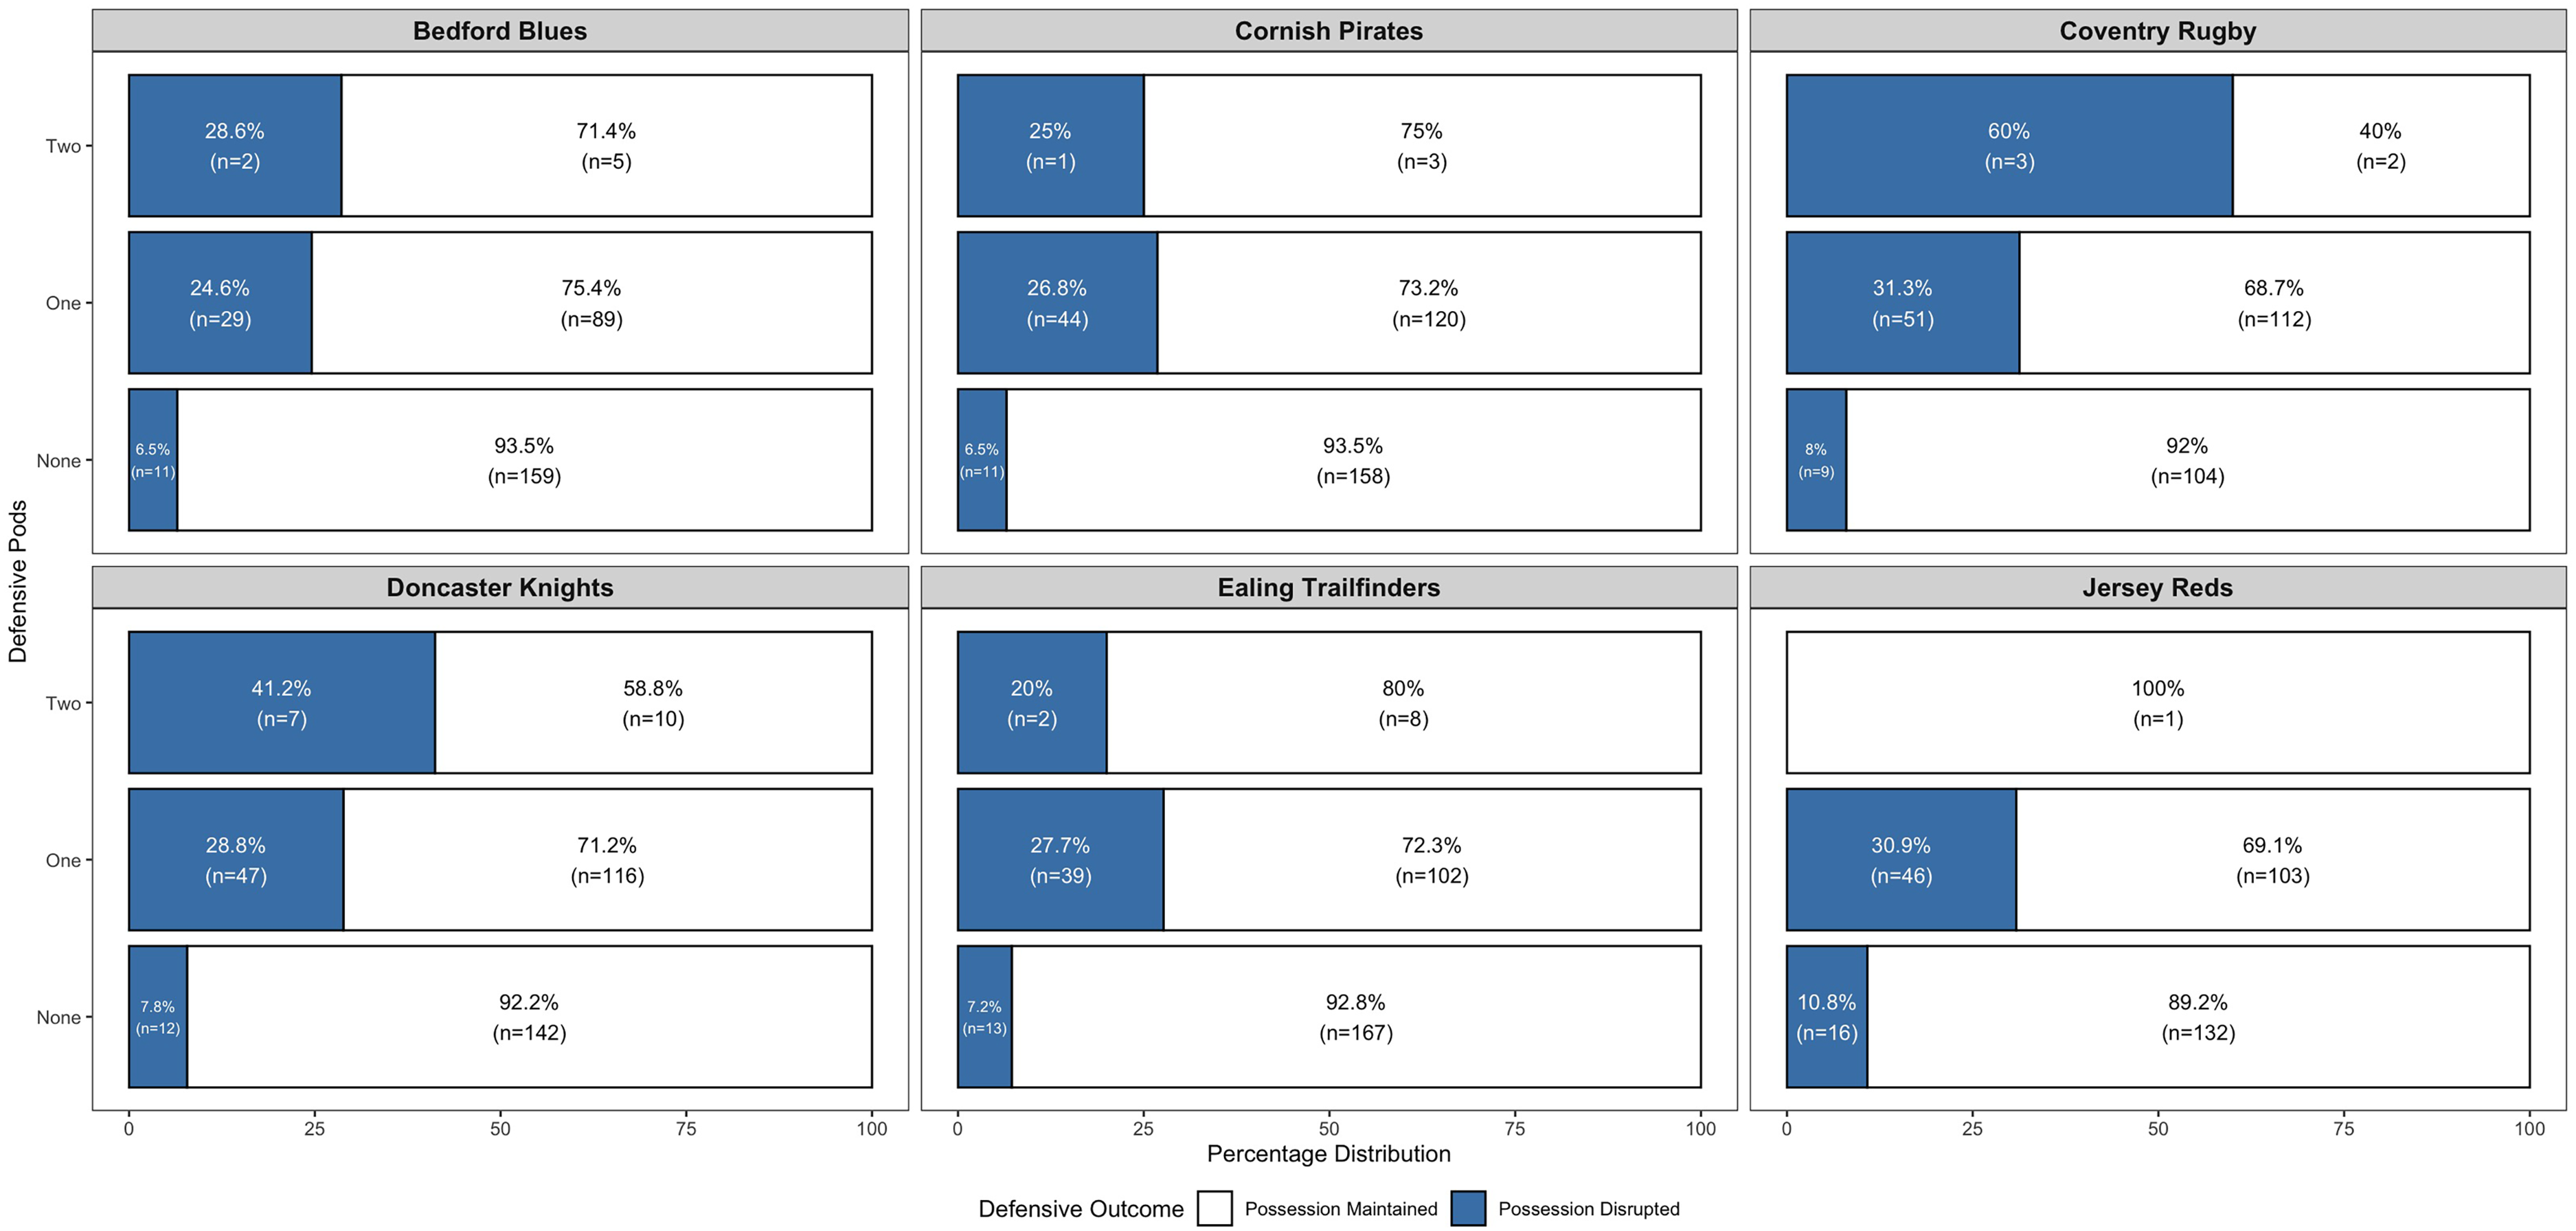
Percentage distribution of defensive lineout outcomes based on defensive pods used (none, one, two) for the top six defending teams.
Post-defensive lineout phase
Post-Lineout actions indicated that defences most frequently had to contain a Maul, which became the dominant continuation threat, with the defending side facing between 41.9% (Jersey Reds) and 56.3% (Bedford Blues) of all the lineouts they defended (see Figure 11). Off-the-top deliveries occurred less frequently, accounting for between 14.2% and 21.7% of post-lineout actions, while breakout plays displayed greater variation across teams. Notably, Cornish Pirates were required to defend breakout actions more frequently than any other team (15.4%). The attacking teams most commonly lost possession through Attacking Errors and Opposition Steals, each accounting for approximately 7–12% of post-lineout outcomes per team. Coventry Rugby and Jersey Reds recorded the highest proportion of disrupting lineouts via defensive Opposition Steals (12.1% and 10.4%, respectively). Cornish Pirates recorded a lower proportion of opposition steals (7.1%) relative to other teams (see Figure 11). Bedford Blues had to defend the highest proportion of Mauls, while Cornish Pirates encountered a more varied distribution of post-lineout outcomes.
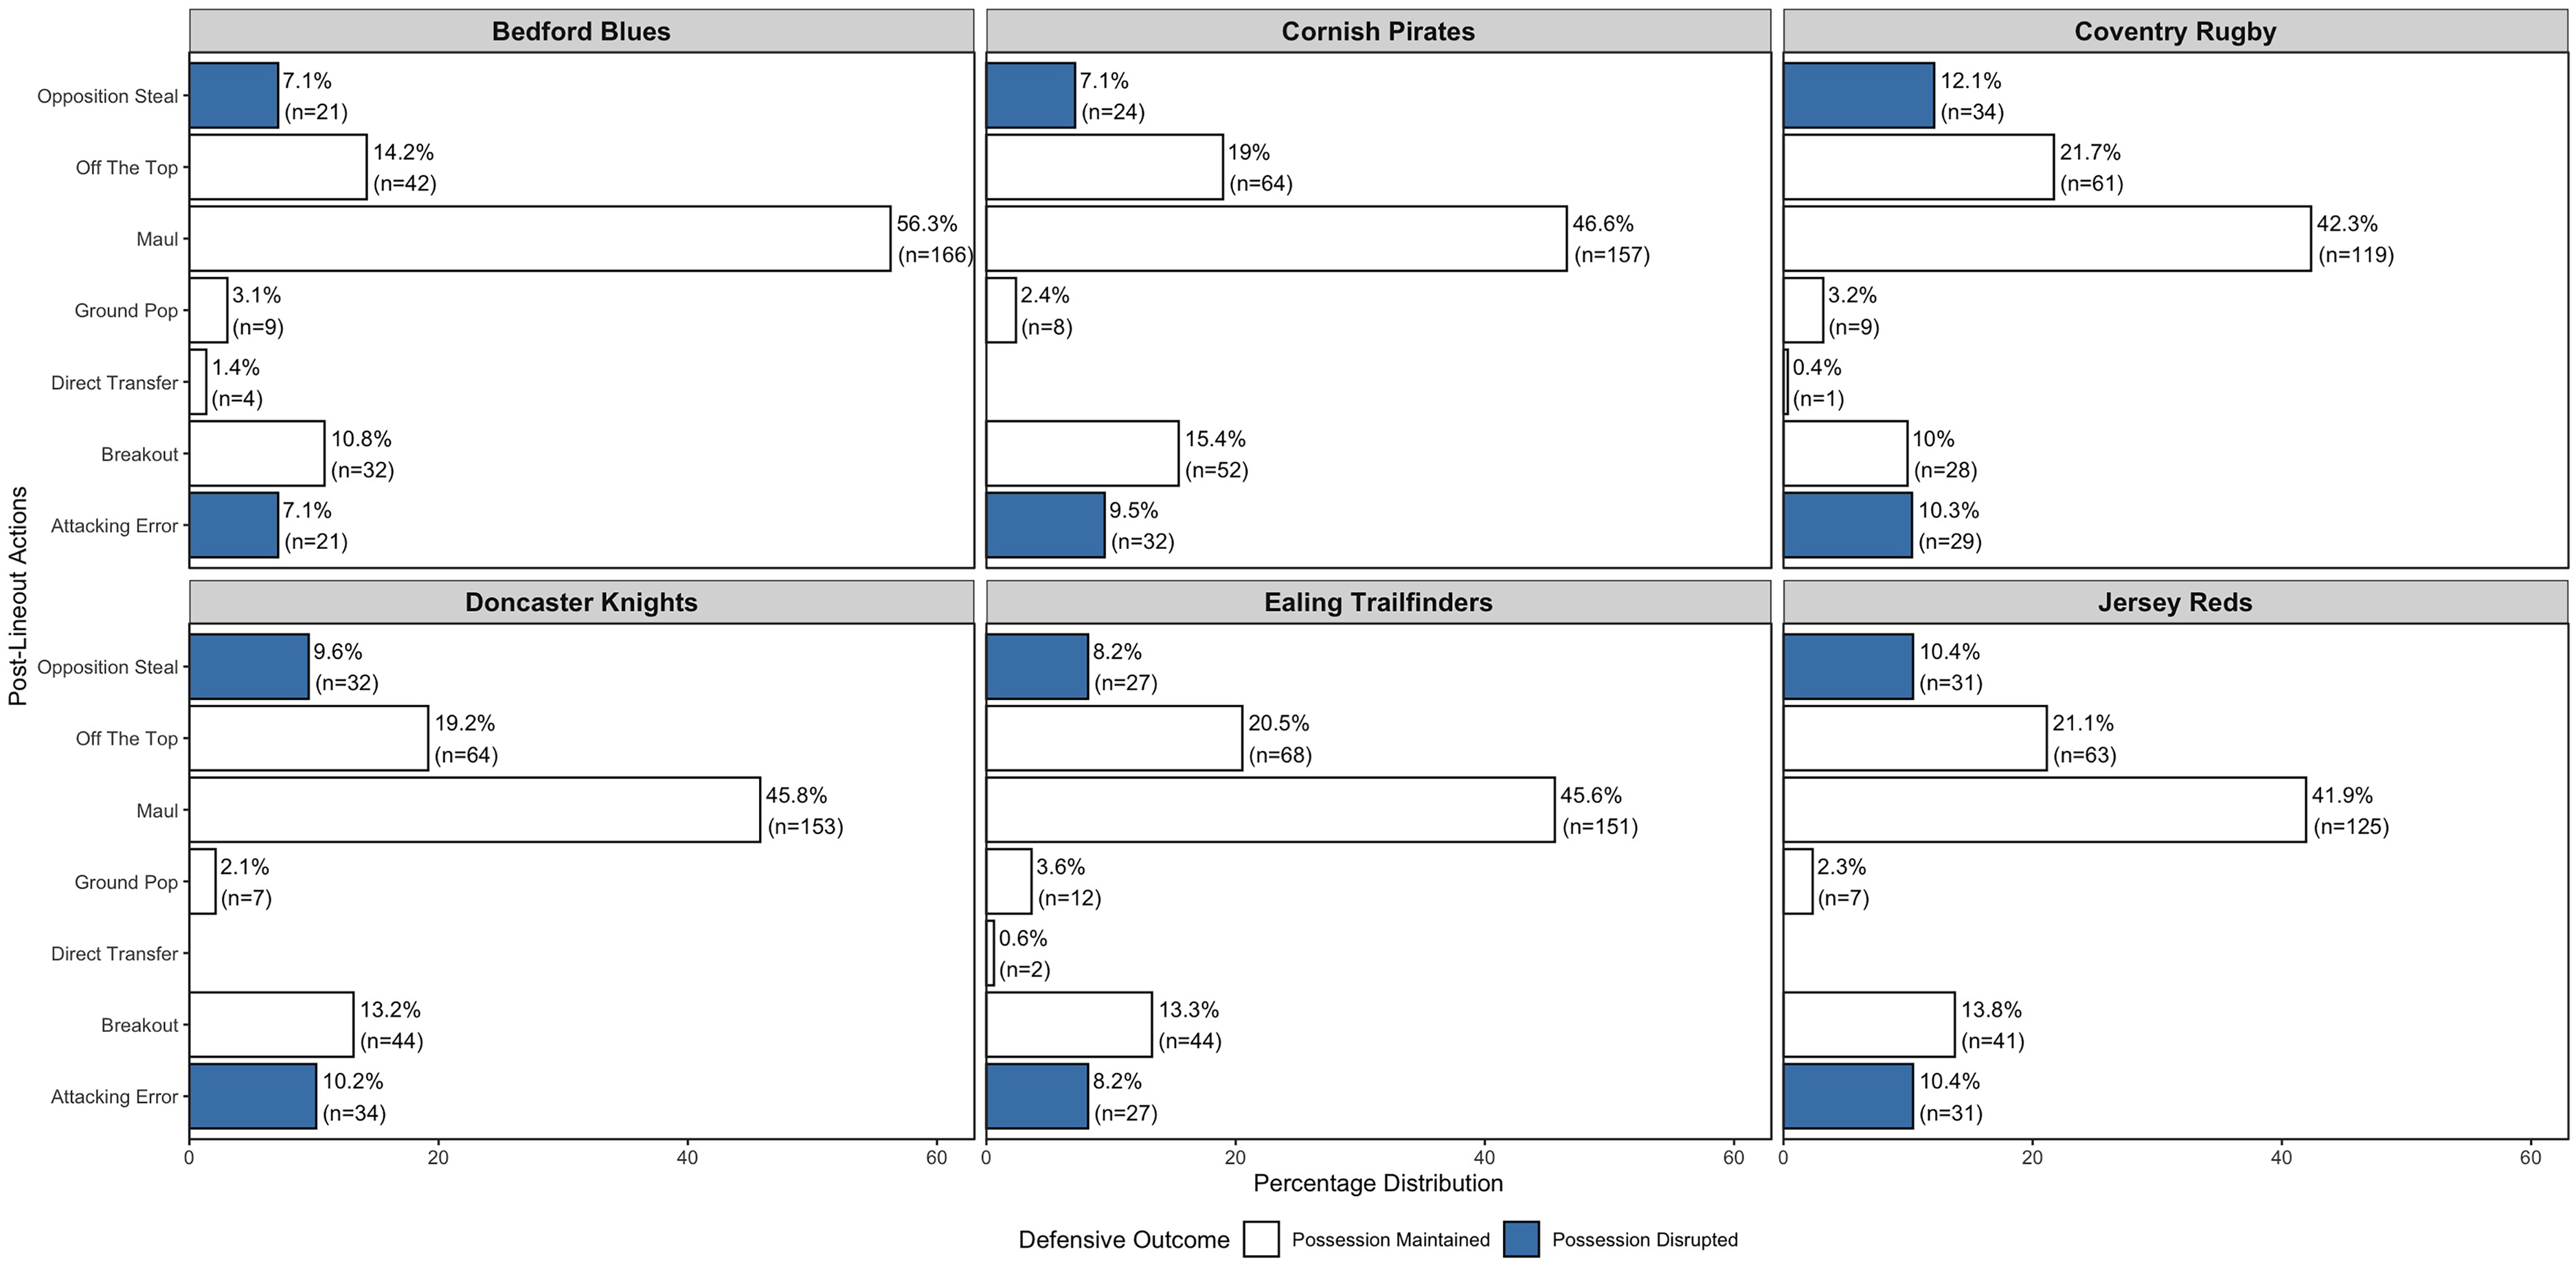
Percentage distribution of defensive lineout outcomes by post-lineout actions (e.g., Maul, Off The Top, Breakout, Opposition Steal) for the top six defending teams.
Discussion
This study explored defensive lineout strategies during the 2022/23 English Championship, accounting for contextual and tactical factors associated with successful lineout disruption and variation across teams. From a defensive perspective, overall attacking lineout success (81.6%) was lower within this sample compared to values reported in other elite competitions such as the English Premiership (95–87%) and Rugby World Cup (89–92%).3,9 These differences may reflect contextual variations in technical proficiency, throwing accuracy, and tactical intricacy at the Championship level rather than universal trends.8,23,24 Disruption rates also varied across teams, with Coventry Rugby recording the highest proportion (22.4%) and Bedford Blues the lowest (14.2%). Rather than indicating inherent defensive superiority, these differences highlight variation in observed outcomes associated with team-specific defensive approaches within the constraints of this competition. Collectively, these findings position lineout defence as a system of decisions and coordinated actions whose effectiveness depends on context, not on contest frequency alone.
Pre-Lineout phase
Defensive organisation appears to co-vary with spatial and structural constraints, 13 and was observed as both teams approach the lineout. Pitch location was associated with disruption, with Zones C and D tending to show greater defensive success (Cramer's V = 0.186). These observations align with previous research emphasising that defensive strategies appeared related to territorial risk, with teams adjusting their level of contest and resource allocation based on the area of the pitch and the perceived threat of conceding points. 11 Team-level patterns varied, with Coventry applying more midfield pressure (Zone B and C), and were the most disruptive team when defending their own try-line (Zone A). Jersey Reds were most disruptive when defending within their own 22-halfway region (Zone B), while Cornish Pirates and Ealing experienced their greatest disruption in midfield zones (C and B, respectively).
Formation size was also associated with defensive behaviour; with larger formations (6 to 8 + man) generally associated with reduced defensive disruption (i.e., higher attacking retention), while Coventry and Jersey appeared more effective with compact formations (3 to 5 man). These patterns suggest defensive responses adapted to perceived attacking intent, rather than fixed structural advantages. Furthermore, those who defended the 5-meter channel emerged as an influential organisational factor. The Scrum-Half was most frequently used in this channel but tended to correlate with lower defensive disruption, whereas teams employing varied defenders appeared to achieve better disruption (e.g., Ealing distributing roles across hookers and other backs). Allocating this role to forwards or hookers rather than scrum-halves may be associated with improved cue recognition and communication, as these players are more exposed to lineout-specific triggers during training.
These observations reinforce the importance of pre-lineout defensive resource allocation and communication, consistent with viewing team behaviour as a product of self-organisation under interacting constraints. 25 Defensive units may need to adapt continuously to spatial, numerical and temporal constraints imposed by attacking formations and pitch location. These interacting constraints shape how players detect and respond to key cues, reflecting principles of constraint-led perspectives on skill adaptation. 16 For defenders, effective pre-lineout organisation may depend on coupling perception and action to anticipate attacking cues and reorganise rapidly to close space, restrict options, and create conditions that increase the likelihood of disruption within this context.
During-lineout phase
The decision to contest defensively was the variable most strongly associated within this sample, with contested lineouts tending to result in disruption rates nearly three times higher than non-contested (14.2% vs 5.3%). However, Coventry contested less frequently yet appeared more effective, suggesting that defensive contest quality and selectivity rather than frequency may be more closely associated with disruption outcomes. From a defensive system perspective, the contest zone showed the strongest association with outcome (Cramer's V = 0.348), with In Front contest reducing attacking success to ∼50%, compared to ∼95% when contesting Behind. This supports previous research suggesting that lineout success depends in part on precise throwing and synchronised lifting, factors more vulnerable to defensive disruption under increased contest pressure. 26 Positioning strategies that anticipate attacking movement to secure front space, such as mirroring, illustrate how defenders couple perception and action under time constraints. 13 Within this dynamic, aerial timing becomes critical; defenders who synchronise lift and jump phases with the throw trajectory may maximise interception potential, even when the contest does not result in a clean steal.
Building on the importance of positioning and timing in contesting, the effectiveness of these actions depends on technical execution. Research indicates that lift speed, jump stability, and synchronisation between lifters and jumpers are key determinants of success. 27 These factors may help explain why optimal defensive lifting support by two lifters and adopting a two-pod defensive structure were associated with greater disruption (Cramer's V = 0.299), with Coventry appearing to lead in these defensive structures. When technical precision and biomechanical efficiency align with tactical organisation, defensive units can exploit small time windows to challenge possession effectively. This interplay highlights the need for integrated defensive preparation, where perceptual-cognitive skills and physical execution converge to increase defensive effectiveness within comparable contexts. Integrated preparation across all phases may explain why the top-six teams achieve higher disruption rates; combining efficient previewing, technical execution, and adaptive organisation.
Post-lineout phase
Following the aerial contest, defensive prioritise shift towards containing the attacking team's continuation play, as part of the same integrated defensive system rather than a separate phase. Defending close to a team's own try line (Zone A) indicated a tendency for defending teams to avoid aggressive aerial contests, opting instead to remain grounded and prepare for the maul; a pattern consistent with rugby tactical principles and supported within this sample. While this conservative approach reflects a trade-off between aerial risk and structural integrity, prioritising containment over contest in high-threat zones, it can create vulnerabilities. Overcommitting to maul defence without preparing for off-the-top plays or breakouts may expose weaknesses elsewhere. Therefore, defensive planning should anticipate multiple threats and retain the ability to reorganise immediately after the throw. Mauling remained the dominant retention method, accounting for 45.5% of all post-lineout actions overall, and overall retention in Zone A exceeded 70% for most attacking teams, reinforcing our interpretation of the heightened threat posed near the try line.8,11,28 Defensive responses varied considerably across teams. For example, Bedford Blues faced the highest proportion of mauls (56.3%), while Cornish Pirates encountered a broader distribution, including the highest frequency of breakout plays (15.4%). These variations suggest divergent attaching profiles across teams, supporting the need for adaptable defensive systems that can switch coverage between multiple threats rather than adopting a one-size-fits-all approach.
These patterns highlight a key tactical challenge for defences, for example, ensuring that in-air contest efforts translate into effective post-lineout organisation capable of neutralising immediate continuation threat. Hendricks et al. 14 emphasise that defensive organisation and decision-making under pressure are important for neutralising structured attacks such as mauls. Failure to reorganise rapidly may negate or reduce the gains achieved during the contest phase, allowing the attacking team to consolidate possession and generate momentum. 10 These transitions reflect principles of self-organisation, where defenders adapt to evolving constraints, such as ball delivery type and spatial positioning, within seconds. 13 This adaptability is particularly important near the try line, where mauls are commonly associated with high scoring potential. Strategies such as pre-binding, targeted entry angles, and coordinated counter-drive are commonly intended to disrupt maul formation before it becomes unmanageable. Additionally, teams should prepare for off-the-top plays and breakouts by ensuring defensive pods and backline coverage are organised immediately after the contest. The ability to anticipate and respond to these post-lineout scenarios is essential for holistic set-piece defence, reinforcing the need for integrated planning across all phases of play. Embedding adaptable organisation and contingency responses (i.e., ‘Plan B’) may help mitigate predictable vulnerabilities, such as the need to shift from maul-first to off-the-top or breakdown coverage rapidly.
Practical implications
Defensive effectiveness in lineouts appears to require a holistic approach that spans pre-, during-, and post-lineout phases. Coaches may consider prioritising contextual awareness and adaptive organisation, tailoring strategies to pitch zone, attacking formation, and anticipated ball delivery within their specific environment. Pre-lineout preparation may emphasise dynamic role allocation and communication, enabling defenders to anticipate maul threats and adjust positioning under changing constraints.16,25 During the live-contesting phase, training may focus on quality over quantity of contest, with activities that support aerial timing, lift synchronisation, and movement mirroring to achieve proactive positions such as contesting in front.13,26,27 Incorporating constraint-led learning principles may improve perceptual-cognitive coupling, allowing defenders to read attacking cues and respond effectively under time pressure. Post-lineout defence demands rapid transitions to contain maul and off-the-top plays. Coaches may wish to integrate maul defence strategies, including pre-binding, target entry angles and coordinated counter-drive into set-piece training. 29 Defensive pods and backline coverage may be organised ahead of the throw and remain adaptable throughout the contest, reorganising based on the emerging picture to neutralise breakout threats. By embedding these defence-centred principles into practice, teams may develop flexible, system-based responses that increase disruption potential and reduce scoring opportunities across all phases of play.
Limitations and future research
The study focused on the top six English Championship teams, which may not fully represent league-wide defensive lineout behaviours or capture longer-term trends within this context. In addition, the observational design limits findings to patterns observed within the specific dataset and competition, and results should therefore be interpreted as contextually bound patterns of defensive behaviour rather than universally generalisable.
While a broad range of contextual and tactical variables were examined, these factors were analysed largely in isolation to maximise analytical transparency and applied interpretability for practitioners. However, defensive lineout behaviours are inherently interdependent. Variables such as contesting zone, lifter allocation, pod structure, and contesting status frequently co-occur as part of coordinated defensive plans, reflecting integrated tactical decisions rather than isolated actions. As a result, reported associations should be interpreted as indicative patterns within holistic defensive systems rather than as independent effects of single variables. The analytical emphasis of this study was pattern recognition and defence-focused practical insights, rather than predictive model optimisation or causal explanation.
Although rigorous validation and reliability procedures were undertaken, coding complex defensive tactical behaviours necessarily involved researcher interpretation. Despite expert validation, system familiarisation and periodic re-checks, some degree of subjectivity remains, consistent with the post-positivist stance underpinning this research. Observations reflect informed interpretations of emergent defensive behaviours in a dynamic performance environment rather than objective truths. In addition, the dataset did not track post-lineout possession chains or scoring sequences, which prevented the ability to quantify “points saved” by defensive turnovers or subsequent points generated from steals.
Future research may extend this work by incorporating all Championship teams, adopting longitudinal designs, or pursuing analytical approaches aligned with predictive or explanatory research questions. Integrating biomechanical measures (e.g., lift speed, synchronisation timing), perceptual-cognitive indicators, and qualitative insights from players or coaches may further enhance understanding of how technical execution, decision-making, and coordinated tactical behaviour interact during lineout defence. Comparative analyses across Premiership Rugby or international competitions may also help illustrate how defensive lineout systems adapt under increasing technical, tactical, and physical demands. Additionally, future work could explore linking event data to short possession-chain summaries (e.g., next one to three phases and any territory/points status) to provide practical estimates of value; such estimates would be context-specific and indicative.
Conclusion
This study contributes to the understanding of defensive lineout strategies within the English Championship, highlighting how contextual and tactical factors appear to influence defensive disruption outcomes across pre-lineout, live-, and post-lineout phases. While attacking teams retained possession in most lineouts, defensive disruption was more likely when contests occurred in front of the attacking jumper and when two lifters supported the defensive jumper, highlighting the importance of defensive contest positioning and coordinated resource allocation. A central insight from this analysis is that defensive effectiveness appeared to be driven more by the quality of contesting than by its frequency. Although contested lineouts were generally associated with higher disruption rates, teams varied considerably in how often and how effectively they chose to contest. Notably, Coventry Rugby achieved the highest defensive disruption rate despite contesting less frequently, suggesting that selective, well-timed contests supported by appropriate lifting structures may be more effective than uniformly contesting every throw. Overall, these findings suggest that effective lineout defence emerges from adaptive organisation under interacting spatial and temporal constraints rather than from isolated technical actions. By emphasising efficient defensive contest decision-making, proactive positioning, and integrated defensive structures, this study provides context-specific, evidence-informed insights that may assist coaches in refining defensive lineout systems within comparable competitive environments.
Footnotes
Acknowledgements
The authors wish to thank the Rugby Football Union for access to the game footage via the EliteHub, without whom this study would not have been possible.
Ethical considerations
This study received institutional ethical approval prior to data collection.
Consent to participate
Not applicable. The study involved analysis of unobtrusive performance footage and did not require individual participant consent.
Consent for publication
Permission to publish the findings was granted by the Rugby Football Union (RFU), which acted as the gatekeeper for access to performance footage.
Funding
The authors received no financial support for the research, authorship, and/or publication of this article.
Declaration of conflicting interests
The authors declared no potential conflicts of interest with respect to the research, authorship, and/or publication of this article.
Data availability
The data that support the findings of this study are not publicly available. The data were generated through access to proprietary match footage provided by the Rugby Football Union via the EliteHub and are subject to access restrictions imposed by the data owner.