
Abstract
Tactical behavior of soccer players always comes with both risk and reward depending on the outcome of the actions. This is especially true during the often chaotic playing phase of transition following a ball gain/loss, where player actions can highly impact a team's success. Therefore, this study analyses the risks and rewards of transitions, focusing on the objectives of both the defensive and offensive teams. Official tracking and event data of 612 matches played during two Bundesliga seasons (2022/23 and 2023/24) were analyzed. To assess transitions, two separate machine learning models were developed based on over 30 expert-driven features: (i) an expected possession value (EPV) model that predicts the probability of the ball-gaining team to score a goal in the following seconds of the possession, (ii) an expected ball gain (xBG) model that predicts the probability of the ball losing team to regain the ball in the following seconds of the possession. Overall, 220,226 match situations during the 58,868 transitions were analyzed. The resulting EPV (AUC: 0.88) and xBG (AUC: 0.64) models showed satisfactory prediction performance. Based on the combination of both models, the risk and reward of match situations for both teams can be quantified in detail which ultimately assists in analyzing the tactical strategy in offensive and defensive transition. This is illustrated in an in-depth individual player analysis to evaluate tactical player decision-making and determine the influence of the players on the success of a team.
Introduction
In elite soccer, a single decisive match situation can make the difference between success and defeat, which can have enormous economic consequences for the teams. This is why vast sums of money are spent to increase the chances of success. 1 To gain such an on-field advantage, the match performance of soccer players has become a main topic of interest 2 with the aim to assess players’ performances objectively and ultimately assist them in reaching their potential.
For this purpose, the research on soccer match performance has focused on the assessment of four different performance facets which are mutually dependent but can be assessed individually: physical, technical, psychological, and tactical match performance.3,4 In detail, tactical performance describes the effectiveness of a player's behavior in achieving a tactical objective (e.g. scoring 5 ). Accordingly, the assessment of tactical behavior should always be placed in the context of its effectiveness in order to judge a performance reasonably. Since the tactical objectives differ significantly depending on the possession of the ball and the context of the match situation, six distinct playing phases are differentiated in the analysis of tactical match performance: defensive & offensive play, defensive & offensive transition, defensive & offensive set plays.6,7 Those playing phases proceed in a mutual interrelationship of both teams with opposing tactical objectives. For example, while one team is in offensive transition after a ball gain (i.e. objective to control the ball and eventually score), the opposing team is in defensive play after a ball loss (i.e. objective to regain the ball and save the own goal). In this context, most research on tactical match performance assesses one playing phase at a time, such as the individual analysis of offensive play 8 or the individual analysis of defensive play. 9 However, to gain a deeper insight into the complexities of tactical match performance it is arguably a powerful approach to analyze the opposing phases of the game simultaneously to get a complete picture of a match situation. Therefore, this study focuses on the analysis of the mutual opposing playing phases of transition, thereby considering the objectives of both the defensive and offensive teams.
This comprehensive way of examining opposing tactical objectives can also be interpreted as risk-reward analyses. For instance, Neuberg and Thiem 10 analyzed risk and reward in handball and showed, among other things, that underdogs can benefit more from taking higher risks than favorites do. In soccer, this type of analysis has been shown to grant deeper insights into the assessment of tactical match performance. For instance, it was used to assess the passing performance of players by modeling the success probabilities of passing options.11,12 Following this idea applied to the present assessment of transitions, the team in defensive transition (i.e. after a ball loss) aims at regaining the ball and saving the own goal. In order to achieve those objectives the players counter-press to regain the ball as a potential reward 13 while minimizing the risk of conceding as a result of a dangerous counter-attack, e.g. by securing deep spaces behind the defending line using rest defense. 14 On the other hand, the team in offensive transition may directly drive a counter-attack with a high probability in scoring a goal taking advantage of an unorganized opposing defense after a ball loss as potential reward 15 without taking to great of a risk at losing the ball possession.
To assess those detailed behavioral patterns of players during a competitive match, the almost continuous and highly accurate tracking data has been established as the most promising data to evaluate in the last years.16–18 The resulting Big-Data sets of tracking data and complementary data formats such as event data make them especially useful for the deployment of computer science methods such as machine learning.19,20 Using those highly time-efficient procedures which are able to filter the most important information out of large data sets by detecting patterns such as success factors in players’ behavior makes them especially attractive for soccer analytics.21,22 Based on tracking data and machine learning (ML), offensive performance analytics have produced the most well-known performance metric in soccer, namely expected goals (xG).23,24
While xG estimates the likelihood of a shot resulting in a goal, recent approaches also assessed the scoring probability of all on-ball actions or entire possessions, enabling a more detailed evaluation of all actions on the pitch. In detail, various approaches have been developed to model the success of actions and attacking sequences, differing in both the input data and the methodologies applied.
For instance, xThreat relies solely on event locations and uses a Markov process to estimate scoring probabilities based on a scoring probability surface across pitch zones, without using machine learning methodologies. 25 In contrast, action based models, such as VAEP models, 26 use shallow machine learning methodologies and event data information to estimate the change in scoring and conceding probabilities resulting from each action. In contrast to both event data based approaches (xThreat & VAEP), expected possession value (EPV) models divide the match into distinct possession phases of consecutive actions where one team continuously controls the ball.27,28 Based on those possession phases they use complex input data (e.g. raw tracking data) and deep neural networks to continuously predict the outcome of the playing sequence.29–31 These presented EPV models also account for off-ball behavior, such as modeling pass option surfaces and space control, and their sophistication reflects the complexity of goal scoring in soccer. 30
However, those recent EPV studies approached the problem of predicting the scoring probability of possessions by applying the ML model across all possessions without differentiating between playing phases. 30 However, organized playing sequences (offensive & defensive play) differ significantly in the match situation context of transition playing sequences (offensive & defensive transition). Consequently, research has already shown that the use of different models for different match situations, such as in differing playing phases, can improve the quality of models in soccer. 23 Therefore, this study solely focuses on match situations during transitions to gain deeper insights into the tactical match performance with this specific match context.
Furthermore, the recent EPV approaches mainly modeled two objective states: scoring a goal and conceding a goal. In defense, however, a team's most important tactical objective is not to score. Rather, the defending team aims at regaining the ball 32 or sometimes even concentrates exclusively on protecting its own goal (e.g. deep defending). Therefore, predicting the chance of scoring for a team that is not even in possession of the ball is of limited value. Therefore, on the defensive side, this paper focuses on the prediction of ball regains as a defensive objective. 33 Using ball regains to analyze defensive success has proven to be an effective approach for analyzing tactical behavior defensive play.34,35 This idea of expected ball gains (xBG) enables a reasonable judgment of the tactical performance of the defending team by playing the defending behavior in the context of the true objectives of the defending team. This enables a more detailed analysis of match situations from both an offensive and defensive viewpoint.
So far, both approaches (EPV & xBG) have been deployed either without a differentiation according to playing phases29–31 or solely on organized playing sequences of offensive and defensive play. 33 Table 1 presents a concise overview of the first author's work in this area. This paper is the first to analyze both models solely for the playing phases of transition.
Summarizing information on the recent work of the first author related to the presented study.
However, besides the described approaches, there have been several other studies that analyzed transitions in soccer which are of value for the present study. In defensive transition, it has been shown that the time to regain the ball is the most important KPI indicating successful performance.36,37 Further, two group tactics in defensive transition, namely counter-pressing 13 and rest defense, 14 have been assessed in detail. On the offensive side, several overarching studies have analyzed the differences between organized and counter-attacks, 15 and counter-attacks have been assessed in more detail. 38 Still, to the best of the authors’ knowledge, there is no study that analyzed the risk and reward of both offensive and defensive transitions exploiting the possibilities of tracking data and machine learning.
Therefore, the aim of this study is to analyze playing sequences of (offensive & defensive) transition by developing two separate machine learning models that analyze tactical match performance. First, an EPV model that predicts the probability of the attacking team after a ball gain to score a goal in the following seconds of the possession. Second, an expected ball gain (xBG) model that predicts the probability of the defending team after a ball loss to regain the ball in the following seconds of the possession. Those models are applied in a practice-oriented risk-reward assessment for the attacking team's transition (EPV: reward to score, xBG: risk to lose possession of the ball) and the defending team's transition (EPV: risk to concede, xBG: reward to regain the ball).
Methods
This study was conducted according to the guidelines of the Declaration of Helsinki and approved by the local ethics committee (Human and Business Sciences Institute, Saarland University, Germany, identification number: 22–02, 10 January 2022).
Data
The presented study analyzed two seasons of official tracking and event data (2022/23 and 2023/24) of the German Bundesliga including a total of 612 matches.
The tracking data of the ball and the on-field players were measured using a semi-automatic multi-camera tracking system with a measuring frequency of 25 Hz (TRACAB, ChyronHego, Melville, NY, USA). This system has been validated for soccer-specific performance assessment. 41
The notational event data was collected by Sportec Solutions (Sportec Solutions AG, Ismaning, Germany) consisting of about 30 events with over 100 attributes defined by the official match data catalog of the German Soccer League (DFL). 42
Both data types were synchronized by Sportec Solutions following the methodology of Anzer & Bauer demonstrating high robustness (i.e. shots were synchronized with an average error of 0.23 ± 0.49 s). 23
All steps of data preprocessing, analysis, modeling, and visualization were completed using python 3.11.8 with the Pandas, NumPy, Math, SciPy, Matplotlib, SHAP, and scikit-learn libraries.
To ensure the traceability of the presented study the main processing steps are described below. This includes the specification of the playing phases, the derivation of features, and the detailed description of the sophisticated features deep runs and expected pass reception.
Features
Every on-ball action of the ball-possessing team during its own playing sequence of the playing phase of offensive transition was analyzed as an individual match situation. Accordingly, the observation level was event-based, while success as target variable was defined by the outcome of the same playing sequence (see Statistics). the level of observation of was event based while the success was defined using the outcome of the playing sequence of the same possession. For every match situation, the features were derived from the identified matching time frame of tracking data. This approach was selected to ensure a selective analysis of match situations where the attacking team is in control of the ball. For instance, analyzing the defending team's coverage of passing options is only meaningful if an attacker has ball control and can take advantage of a passing opportunity.
The features were carefully selected and specified by two professional match analysts of a Bundesliga team, who are also the first two authors of this paper (LeaF & LeoF), and were only considered when they reflected a technical or tactical element of match performance.33,43 This procedure was chosen to ensure the validity of the presented approach in specifically examining the technical and tactical behavior of the players to eventually prevent false conclusions. 2
The features were selected to provide detailed information on the match context (e.g. pitch position), the on-ball and off-ball behavior of the offense (e.g. availability of close pass options), and the off-ball behavior of the defending team (e.g. defensive pressure on the ball-leader).
All detailed feature specifications can be found in Table 2. Due to their importance and complexity, the identification of the playing phase of transition, tactical formations, deep runs and expected pass reception are presented in more detail below.
Features of tactical & technical match performance, colored according to the three main feature categories (match situation: gray, offense: orange, defense: blue).
Playing phase transition
To analyze the match situations during the specific playing phase of transition, playing phases were defined in order to assign each match situation to one of the six playing phases (defensive & offensive play, defensive & offensive transition, defensive & offensive set plays). First, the ball possessions, or playing sequences, of each team were identified based on a rule-based approach to calculate possession chains. 44 Afterward, the playing sequences were classified into the six specific playing phases: defensive & offensive play, defensive & offensive transition, and defensive & offensive set plays. All playing phases were defined by two professional match analysts of a Bundesliga team (LeaF & LeoF). Accordingly, offensive transitions were defined as follows: They started with a gain of possession (with a minimum of one successful on ball action, e.g. pass) of the defending team during open play and ended whenever the ball got out of play, gameplay was interrupted (e.g. foul, offside), the opposing team regained the ball, or the phase of play switched to a controlled possession (offensive play). In detail, the playing phase of offensive transition shifted to controlled possession whenever the team gaining possession executed either two consecutive backward passes or two actions while all 10 opposing players were positioned behind the ball. On the other side, defensive transitions occurred in the time interval of an opposing offensive transition.
This study focused on those (offensive & defensive) transition playing sequences.
Tactical formation
To define the relative pitch position of the ball position, the tactical formation of both the defending and the attacking team was identified. With this information, it is possible to determine the number of outplayed formation lines and, for instance, whether the ball is positioned between the midfielder- and defending-line, or behind the defending-line, etc. In detail, a k-Means clustering algorithm was used to cluster the longitudinal x-positions of all on-field players of a team into three formation lines (e.g. 5-3-2). This analysis was applied separately for each playing phase in three different time windows over the match (0–45, 46–62.5, 62.6–90 [min]). Those time windows were determined since almost all tactical formation changes occur during the second half. 40
Deep runs
A deep run denotes an off-ball movement of an attacking player to threaten deep spaces behind the opposing defensive line with the aims (i) to create a scoring opportunity by outplaying the defensive line or (ii) to disrupt the opposing defensive structure, in consequence of defending the deep run (e.g. the defense has to fall back towards the own goal to secure the threatened spaces). This type of tactical off-ball behavior of attackers was analyzed to indicate the dynamic of an offensive transition.
While there is research on overlapping runs, which can be interpreted as deep runs at the outer lanes of the pitch, 45 to date, there is no validated definition of deep runs in soccer literature. Therefore, we defined a rule-based approach to identify deep runs based on five criteria: (i) velocity, (ii) area, (iii) direction, (iv) duration, and (v) playing phase.
During the deep run, the player has to reach (i) a minimum velocity of 21 [km/h] which is considered a high-intensity run from a physical point of view. Further, the run has to be performed (ii) in proximity to the last defending line of the opposing team. In detail, the deep running player has to have a minimum of 15 [m] vertical distance to the last defender and decrease this distance to a minimum of 4 [m] at least once during the run (i.e. come close to the defending line or cross it). Additionally, the deep run has to be performed (i) with a direction towards the opposing goal line. Accordingly, the deep run may not exceed a maximum angle of 45 degrees towards the goal line. Overall, a deep run has (iv) to last at least one second in which criteria (i-iii) have to be true. In the end, a deep run can only be performed (v) during a ball possession of the own team.
This definition was specified and validated by two professional match analysts of a Bundesliga team (LeaF & LeoF). Each analyst independently analyzed one match from the current sample. Using scouting feeds and analysis software (Hudl, Sportscode), they manually tagged instances of deep runs. During those two matches, 129 deep runs were identified by the analysts. A run was considered as detected if the manually tagged instance occurred within the timeframe defined by the rule-based identification. The rule-based approach identified 109 of them correctly (84.5%), 8 runs were identified incorrectly (false positives) and 20 runs were not identified (false negatives). This results in a Precision of 0.93 (≙proportion of true positives among all identified deep runs by the rule-based approach), Recall of 0.85 (≙proportion of true positives identified among all tagged deep runs by experts), and F1-Score of 0.89 (≙harmonic mean of Precision and Recall).
For instance, the identification of overlapping runs using a graph neural network showed a F1-Score of 0.40. 45 Concluding, the presented approach shows a powerful performance in identifying the tactical pattern of deep runs.
Expected pass reception (xPR)
To model the probability of a pass to be successfully completed we used data of 276,521 passes played during the 22/23 Bundesliga season of which 223,521 (80.83%) were successful.
The used event data provided no information on the targeted receiver for unsuccessful passes. However, this information is mandatory to analyze the coverage of the passing lane or the pressure on the receiver to effectively analyze the success probabilities of passes. To determine the targeted receiver for an unsuccessful pass, we identified the closest attacking player to the passing vector of the played pass. The passing vector was computed on the position of the ball one second after the pass and the position two seconds after the pass. This identification procedure was validated for all successful passes of a sample match which resulted in a correctly identified recipient in 93 [%] of the passes. This identification rate is similar to the 93% identification rate in. 46
For each pass of the given sample, (i) the defensive pressure on the ball leader, (ii) the defensive pressure on the targeted receiver, (iii) the coverage of the passing lane, (iv) and the passing distance were computed. The specified feature computation can be found in the appendix (see Appendix 1).
Using those features, we trained an XGBoost classifier to predict a pass to be successfully completed (outperformed the Random Forest classifier on this problem). The prediction performance is shown in Table 3. This expected pass reception model (xPR) was used to compute the feature subcategory off-ball behavior: Pass options (see2).
Prediction performance of machine learning classifiers of xPR (top), EPV (middle), & xBG (bottom). The selected models for further analysis are highlighted in green.
Statistics
To assess the tactical objectives of both the offensive and the defensive team, two separate machine learning models were developed. For the offensive side, an EPV model that predicts the probability of the team in offensive transition to score within the next ten seconds of the possession.29–31 Second, an expected ball gain (xBG) model that predicts the probability of the team in defensive transition to regain the ball in the next five seconds of the possession. 33
The time windows were selected to reflect the distinct nature of offense and defense. While goals are typically scored from areas close to the goal and often result from longer sequences of attacking actions, ball regains can occur anywhere on the pitch. Therefore, in line with previous literature,29–31 a ten second window was chosen for EPV to capture and credit key actions leading to goal-scoring opportunities, whereas a shorter five second window was used for xBG to better reflect the closer temporal link between defensive actions and their outcomes.
To solve the given binary tasks, we employed several classifiers, including Random Forest and XGBoost, as they have demonstrated robust performance on the given problems.23,33 To effectively train the classifiers, a stratified train-test-validation split (60%, 20%, 20%) on a match-by-match basis was implemented. This approach prevented match situations from the same possession from appearing in different data sets, which could lead to overfitting. The test set was held out to assess the model's performance on unseen data. The validation set was used for hyperparameter tuning, and the models were optimized on a composite score of Brier score, expected calibration error (ECE), and Recall. The weights were set to 
We optimized on Recall to account for adequate discrimination in the highly unbalanced data set (≈1% successful outcomes for EPV) while also minimizing the Brier score and ECE to maintain well-calibrated probability estimates (calibration). In detail, in the case of EPV, it is the main aim to correctly predict goals (Recall) while minimizing the number of false positives and preventing overestimation of scoring probabilities.
For feature selection, the Pearson correlation between the features was analyzed and for all feature pairs with a high correlation (Pearson's r > 0.75) one feature was excluded (see Appendix 2). Further, to reduce the complexity of the models and enable more comprehensible interpretability, we additionally computed reduced feature models with the best 15 features for both given problems. Finally, for the selected models SHAP values and feature importances were analyzed. SHAP values, grounded in cooperative game theory, calculate the impact of individual features on the model's output. 47 Thereby, they reveal the overall influence of each feature on the prediction (feature importance) as well as the effect of specific feature values on a given prediction. This enables a detailed interpretability of a machine learning approach.
Baseline approaches
To further evaluate the classifiers and judge their performance on the given problems, we established several naïve baseline appoaches to model the binary tasks (i.e. EPV to predict the probability of scoring in the next ten seconds of the attacking possession & xBG to estimate the probability of a ball regain in the next five seconds of the opposing possession).
For the EPV task, we implemented two rule-based baselines:
A distance to the goal approach, which linearly scales the ball's current distance to the goal from 1 directly on the goal line to 0 at the farthest possible position at the opposing corner (110.37 [m] away from goal). In contrast to other international competitions, all pitches in the German Bundesliga have standardized dimensions and a uniform coordinate system (68 [m]×105 [m]). Accordingly, the definition of the maximum possible distance to goal was consistent across all matches. A chance-evaluation approach similar to Anzer & Bauer,
23
that assigns each match situation in the possession leading to a big scoring chance (hand-labelled as a sitter in the notated event data) its mean conversion rate in the current data set (mean conversion rate sitter = 0.52) and assigns all other situations the mean conversion rate of other scoring chances not labeled as sitter (mean conversion rate no sitter = 0.06). In the given event data sitters are defined as a shooting opportunity in a highly promising position, typically close to the goal with only the goalkeeper to beat, where the ball-leading player faces little defensive pressure, has a clear lane and sufficient angle to the goal, and can control the ball without external factors (e.g. poorly played pass).
42
For the xBG task, we implemented one naïve rule-based baseline:
A defensive pressure approach, which used the defensive pressure on the ball-leading player in every match situation (between 0–100%) as estimate to determine xBG.
Results
All 612 matches of two Bundesliga seasons resulted in a total of 220,226 match situations (on-ball actions of the attacking team) during 58,868 playing sequences of transition. Accordingly, on average 96 transition playing sequences took place during each Bundesliga match consisting of about 3,74 actions per transition.
Across the considered Bundesliga seasons 2022/23 and 2023/24, a total of 1956 goals were scored, with 480 of them (24.54%) scored during the playing phase of offensive transitions. The other transition playing sequences shifted to controlled possession according to the derived definition 21,142 times (35.91%), while 15,992 playing sequences resulted in the ball going out of play or a stoppage of play (27.17%). Additionally, 2938 transitions (4.99%) concluded with a shot at the opposing goal. Meanwhile, defending teams actively regained possession in 18,316 playing sequences of transition (31.11%) (see Figure 1).
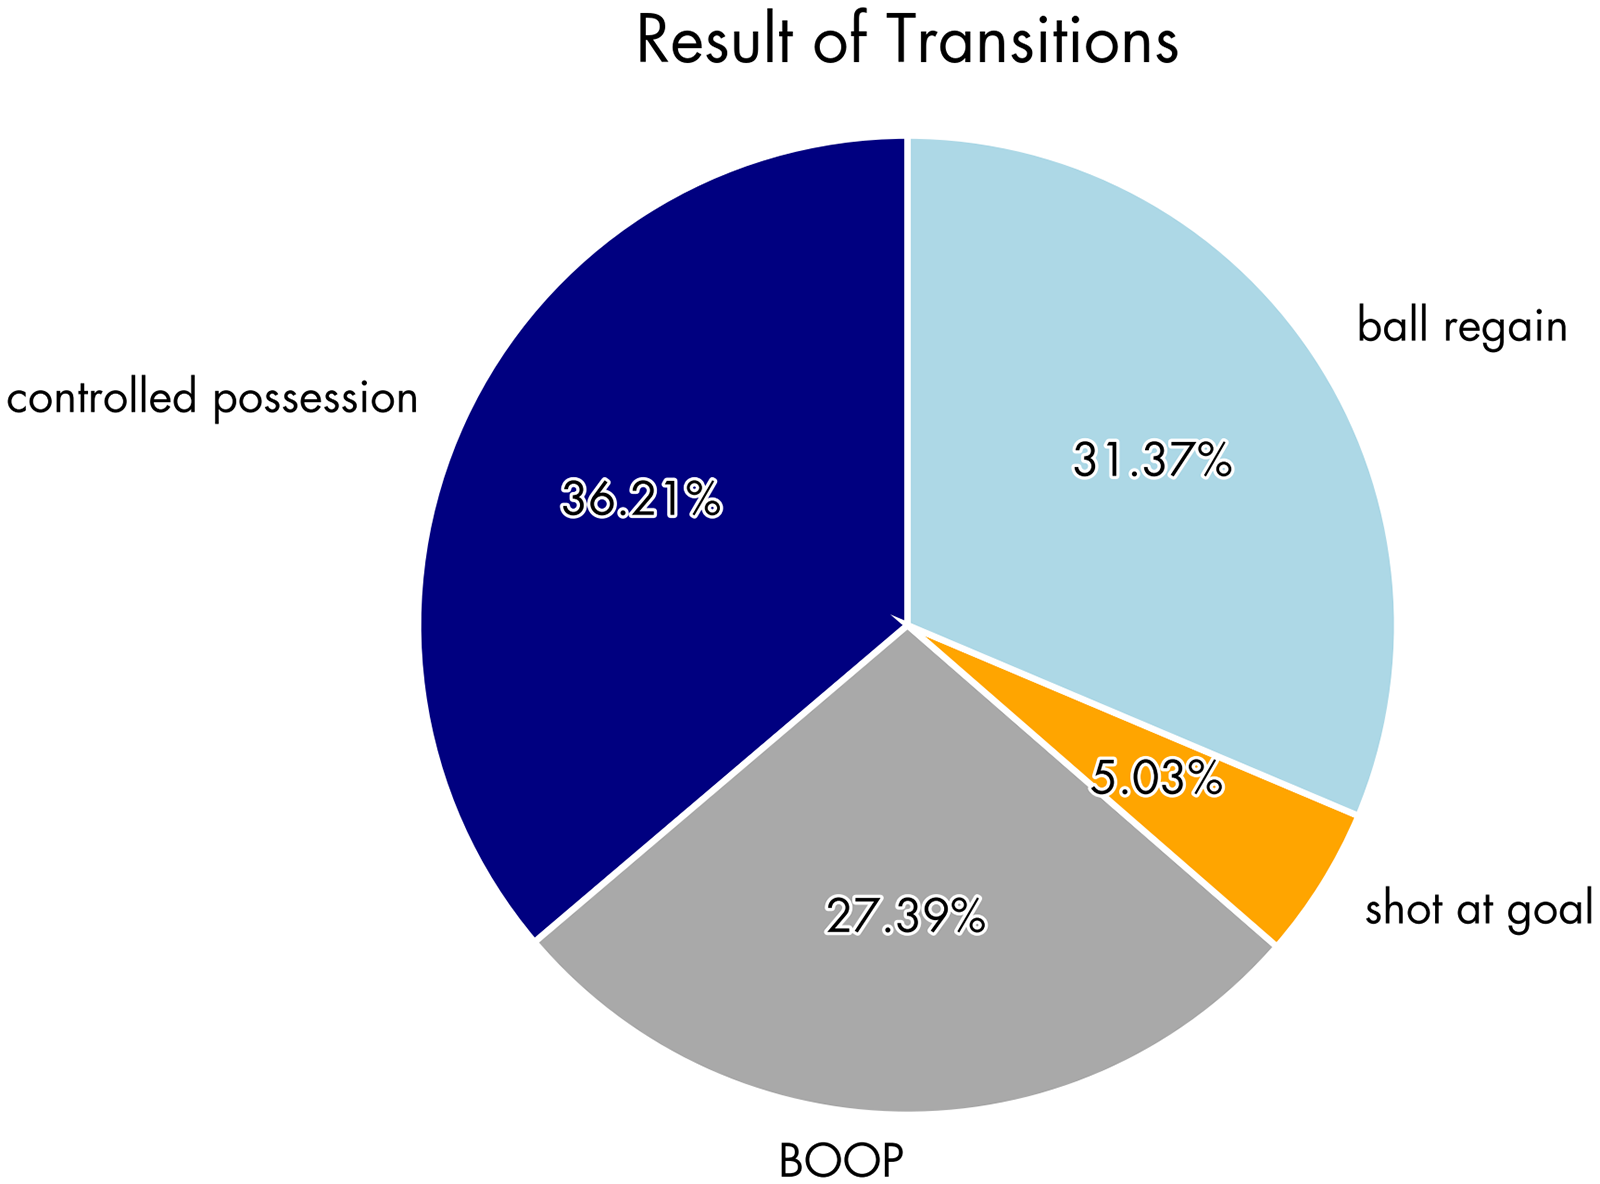
Result of transitions. Distribution of the ending of transitions in the Bundesliga seasons 2022/23 and 2023/24 including transitions that shifted to controlled possession, ending in the ball going out of play or a stoppage of play (BOOP), ending in a shot at goal of the attacking team, or ending in a ball regain of the defending team.
In 2344 (1.06%) of all match situations, the attacking team scored within the next 10 s of their possession (EPV target variable). In 51,448 (23.36%) of all match situations the defending team regained the ball within the next 5 s of the opposing possession (xBG target variable).
All Classifiers showed a satisfactory prediction performance (see Table 3). For both EPV and xBG the reduced feature models of XGBoost were selected for further analysis since they showed similar prediction performance to the all feature models. SHAP values and feature importances of those models are depicted in Figure 2 and their calibration as well as their probability distribution on the test set are illustrated in Figure 3.
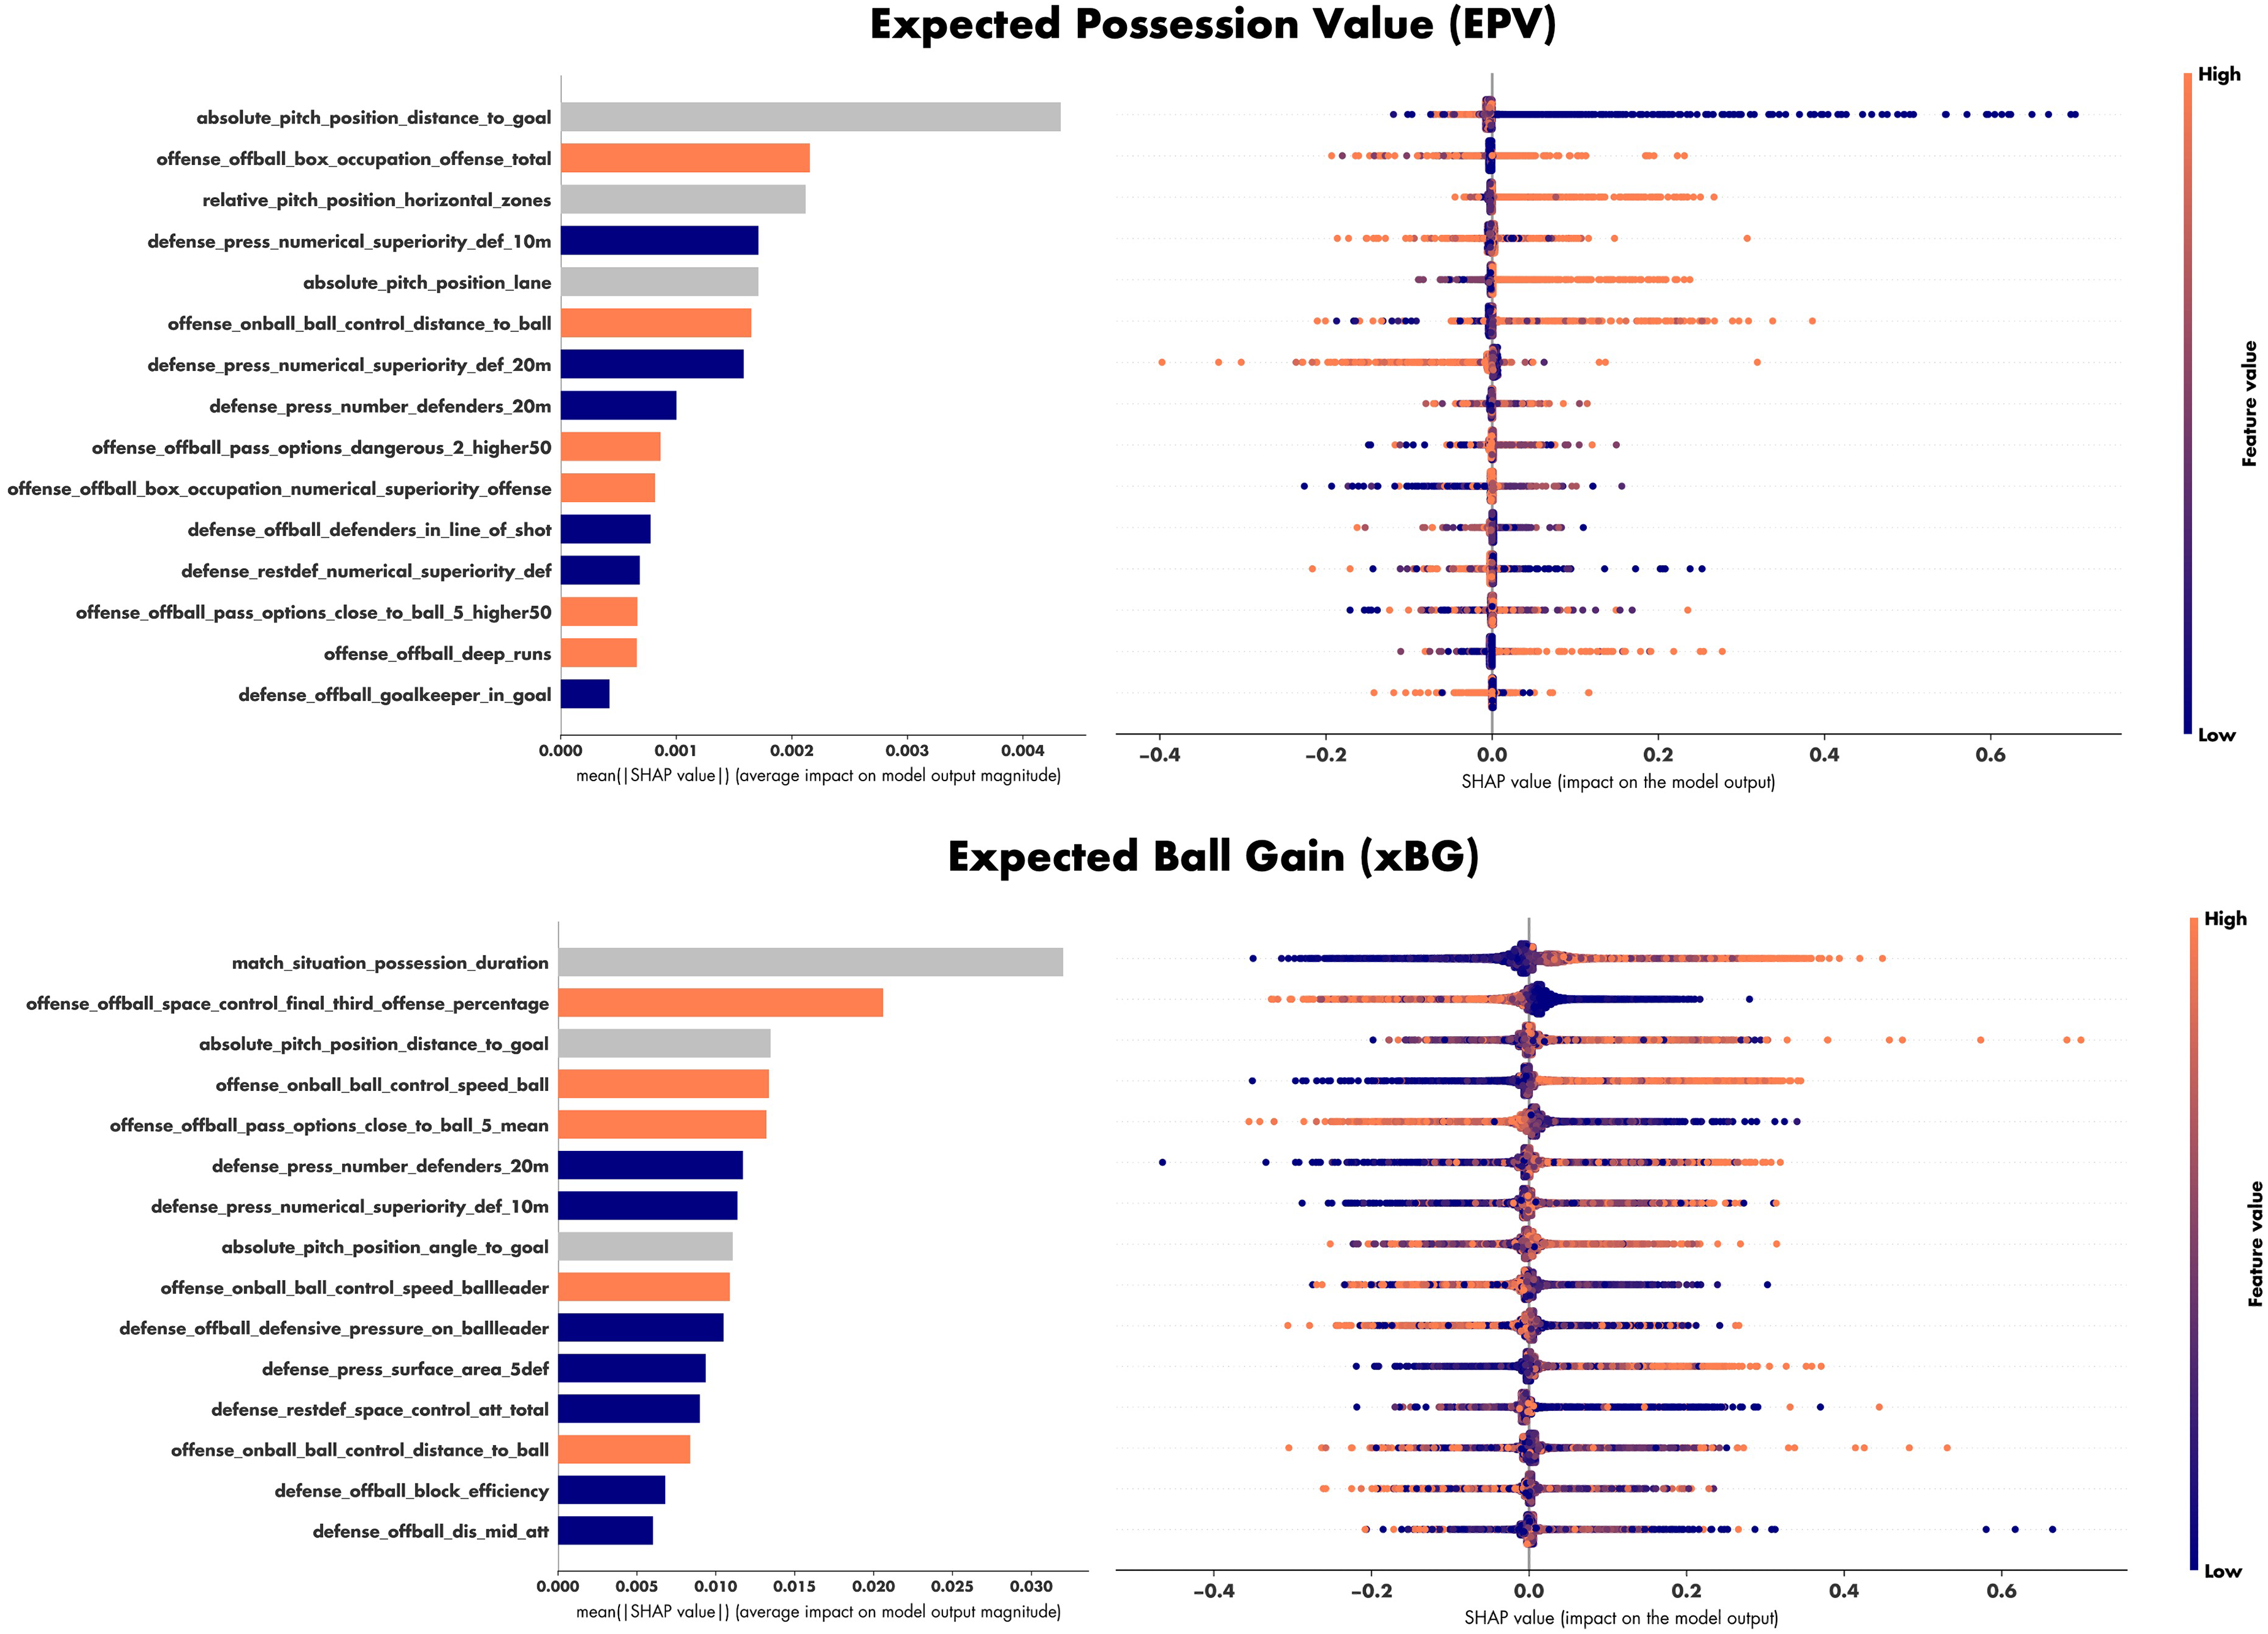
SHAP values of EPV (top) and xBG (bottom). Feature importances on the left are illustrated according to their category (defense: blue, offense: orange, match situation: gray). The feature expressions are depicted on the right.
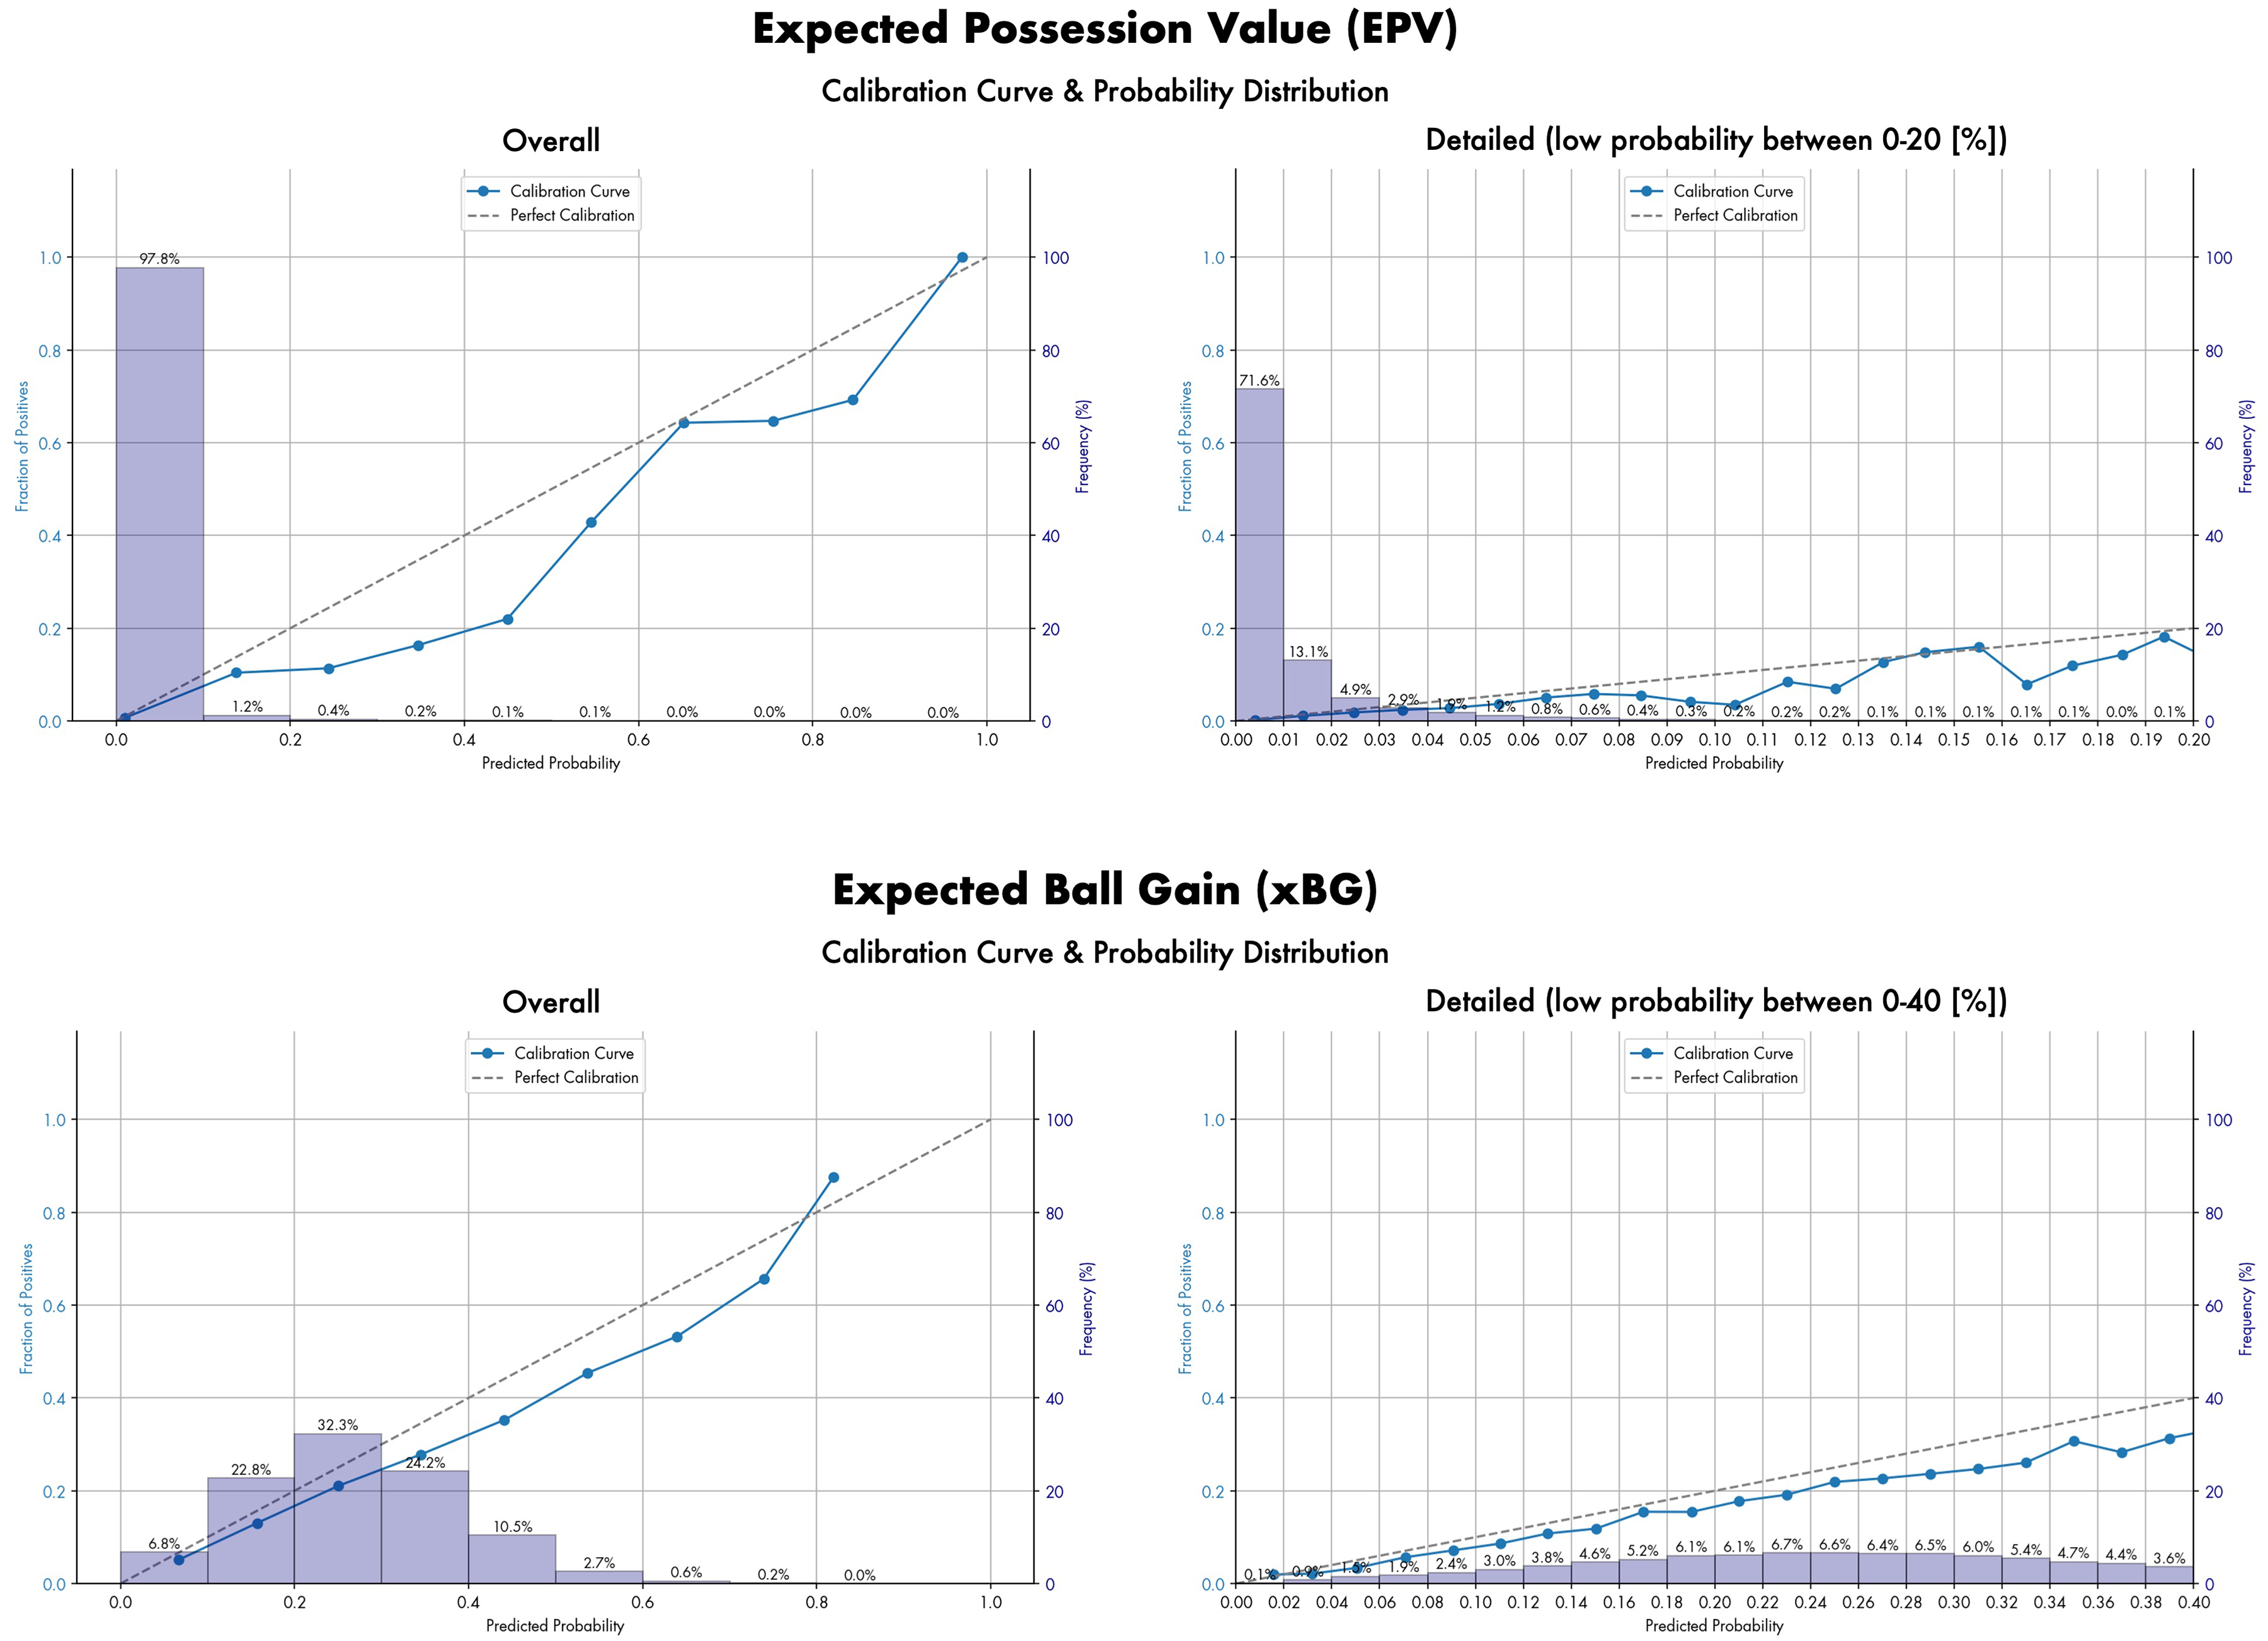
Calibration curve and the distribution of predicted probabilities of the selected models for EPV (top) and xBG (bottom) illustrating overall performance (left) and detailed analysis of the low-probability range (right). The calibration curves (dark blue) compare observed target variable rates (e.g. EPV: Goal in the next ten seconds of the possession) to the model's predicted probabilities across each probability bin. The probability distributions (light blue) indicate the relative frequency distribution of all predictions across each bin.
Discussion
The aim of this study was to develop and deploy two separate machine learning models (EPV & expected ball gain (xBG)) to analyze the tactical behavior of players during the playing phase of defensive and offensive transition in the context of the objectives of those mutually opposing playing phases (objectives offensive transition: control the ball & score, objectives defensive transition: save the own goal & regain the ball). The combination of those models enables a risk-reward assessment of the tactical match performance. In detail, the defending team's risk of conceding a goal in the following seconds of the opposing possession can be determined by the magnitude of opposing EPV, while their potential reward to regain the ball can simultaneously be measured by the size of xBG. Conversely, for the attacking team, the reward of scoring in the next few seconds of the possession can be analyzed by their EPV, and the risk of losing the ball can be evaluated by the size of the opposing xBG. With it, the achievement of all main objectives of the transition playing phases can be quantified which enables a detailed analysis of tactical match performance of teams and players. By applying those models in the described way, the risk and reward of every match situation in transition can be quantified and the quality of every player decision can be evaluated in detail.
The presented EPV model in transition showed robust prediction performance (Accuracy: 0.99, Recall: 0.11, F1-Score: 0.18, AUC: 0.88) and outperformed the baseline approaches as well as standard statistical models (e.g. logistic regression, see Table 3). Furthermore, the selected model indicated higher Accuracy and AUC compared to a comparable EPV model in the playing phase of offensive play (Accuracy: 0.97, Recall: 0.32, F1-Score: 0.17, AUC: 0.80). Accordingly, the presented model successfully identifies 11% of all successful match situations (a goal is scored in the next 10 s of the possession) which is comparable to benchmark xG models ( Recall: 0.20 23 ; Recall: 0.30 48 ) in identifying goals scored. This worse performance in identifying true positives may be traced back to the higher imbalance of the dataset in EPV (1.06% of actions entail a goal in the next ten seconds) compared to xG (13.08% of shots result in goals, across the 2022/23 and 2023/24 Bundesliga seasons: 14,956 shots, 1956 goals). Overall, this robust performance of the presented EPV model in discriminating between the classes may be attributed to the large dataset of over 600 matches analyzed in the current study, 49 and the focus on Recall in model optimization.
Next to the discrimination, the calibration of the presented models is also of interest, as the predicted probabilities should reflect the true likelihood of an action resulting in a goal (in the case of EPV) or a ball recovery (in the case of xBG) to be interpretable. 50 Although the predicted probability distribution for the selected EPV model (Figure 3) is concentrated toward values near zero, the selected EPV model maintained robust calibration even in higher probability bins (Brier score: 0.01, RPS: 0.01, log-loss: 0.05). However, the model slightly overestimates the true probabilities, which should be noted when interpreting the estimates.
While the presented EPV model's most important features belong to the match situational (three features included), it included more offensive features (six features included) and defensive features (six features). This underlines the importance of taking both the offensive and the defensive team into account when analyzing offensive match performance.7,51
The most important variable in the EPV model was distance to the goal (see Figure 2). This finding is in line with previous studies on EPV or xG.23,48 The information on the distance towards the opposing goal is complemented by the relative pitch position of horizontal zones (3th most important variable in EPV). Accordingly, a match situation is becoming more likely to result in a goal if more opposing formation lines are outplayed and/or the distance to the goal is decreased.
The second most important feature in the current EPV prediction in transitions is the box occupation of the attacking team. Besides, this feature is more relevant in transitions compared to offensive play. Accordingly, the attacking team should occupy deep spaces especially occupy the opposing box to effectively threaten the opposing goal.
In contrast, the sophisticated feature deep runs was solely included as the 14th most important feature in the EPV model. Still the presented rule-based approach to identify deep runs showed exceptional performance (Accuracy: 0.85, F1-Score: 0.92) in comparison to other studies that focused on the identification of related tactical patterns such as overlapping runs (F1-Score: 0.40) 45 (see methods section). This feature was designed to reflect the dynamic of possession and increase the chance of scoring by threatening deep spaces and disrupting the opposing defensive organization. One possible argument why deep runs were not highly important for EPV may be that most transitions are highly dynamic due to the nature of the match situations and this feature therefore holds few information for the predictions. In this context, further analysis showed that over all analyzed match situations of offensive transition, 18.52% had a minimum of one deep run (40,781). Of all match situations that entailed a scored goal (successful EPV), 50.77% of match situations included a deep run (1190). While this exemplary result shows a clear trend of more deep runs in successful offensive match situations, it did not improve the machine learning model. Further, deep runs may hold more crucial information for match situations that are not highly dynamic, such as controlled possessions, as they have a greater impact on differentiating dynamic and static match situations.
In comparison to the presented EPV model, the presented xBG model that predicts the probability for the defending team to regain the ball within the next five seconds of the possession showed a decreased but satisfactory prediction performance (Accuracy: 0.77, Recall: 0.07, F1-Score: 0.12, AUC: 0.64). Relative to the EPV model, the xBG model yields a broader spread of predicted probabilities (see Figure 3), reflecting the more balanced dataset (23.36% successful outcomes) compared to EPV (1.06% successful outcomes). While the model's calibration indicates robust prediction results (Brier score: 0.17, RPS: 0.17, log-loss: 0.52), it also slightly overestimates the true probabilities.
In this context, it could be argued that objective of regaining the ball in defense is more difficult to identify compared to goals in offense (predicted in EPV). In detail, goals are predominantly scored after a sum of positive tactical and technical behavior of the attackers. In contrast, regaining possession for the defending team frequently appears to be a consequence of opponent misconduct (e.g. technical errors in passing) and thereby is not solely dependent on positive tactical behavior of the defense. This makes the prediction of positive tactical situations in defense (predicted in xBG) more difficult. In this context, recently, an approach of xBG in controlled possession showed higher prediction performance (Accuracy: 0.85, Recall: 0.65, F1-Score: 0.58). 33 However, in this case, a positive defending outcome was determined with a ball gain within two seconds after the match situation (compared to five seconds in the present study). With it, it is important to note that prediction models with other basic principles for the division of classes (successful vs. unsuccessful) are hardly comparable. Still, it can be generally assumed that outcomes that are further in the future (three seconds more in the presented model) are more difficult to predict.
Overall, the presented xBG model included seven defensive features and three features of match situation context. While there were only five offensive features included, they showed high feature importances (three features under the five most important features for the xBG model, see Figure 2). This also includes the second most important feature of the model, the space control of the attacking team in the final third. The SHAP values for this feature indicate that a ball regain becomes more likely when the defense has more spatial control in the final third (see Figure 2). Accordingly and in line with previous research on defensive transition, the defending team should therefore safeguard deep spaces behind their defending line to be successful.13,14 With this tactical behavior, the defending team is also able to decrease the chance of successful opposing counterattacks (see SHAP values of EPV in Figure 2). The safeguarding of deep spaces can be achieved by falling back to cover those pitch areas and denying pass receptions behind the defending line in rest defense. However, to achieve a high reward and simultaneously minimize the risk in defensive transition the results also suggest to pressurize the ball near areas in counter-pressing (e.g. by covering close pass options, 4th most important feature for xBG). Consequently, the ball-leader may not be able to play a controlled deep pass. This defending principle of covering close pass options to regain the ball is supported by a number of investigations on defensive performance.9,13,33,34
Next to safeguarding deep spaces in rest defense and pressurizing ball-near areas in counter-pressing, the possession duration of the transition is of interest. This feature is the most important in the xBG model. Several studies on defensive transition also identified the “defensive reaction time” (time to regain the ball after a ball loss) to be an important KPI in transitions.36,37 However, the SHAP values of the presented xBG model suggest that the probability to regain the ball is increased with increasing duration of opposing possession. In this context, the presented EPV model indicates that the longer the attacking transition lasts the fewer the chance is to score (see Figure 2). Overall, one may therefore argue that fast transitions are most dangerous as they take advantage of an unorganized defense after the ball loss, and long transitions increase the chance of the possession to end in another game state rather than conceding. Those results suggest that the defending team needs to deny fast counter-attacks as the chance to score for the attacking team is reduced the longer the possession takes. Accordingly, the defending team in defensive transition should focus on preventing fast-counter attacks by rest defending or in the best case by directly counter-pressing ball near areas. Still, this comes with high risks in the case the counter-pressing is overplayed leaving large spaces for the attacking team.
The availability of close pass options was the 4th most important variable in the presented xBG model, indicating that more available close pass options increase the probability of the attacking team to remain ball control. This feature is calculated using the advanced expected pass reception model (xPR), which incorporates the average xPR of close passing options (xPR, see methods section). The presented xPR model (Accuracy: 0.85, F1-Score: 0.91, AUC: 0.84) showed comparable prediction performance to related studies which concentrated on predicting passing probabilities. For instance, Goes et al. (Accuracy: 0.85) 11 and Spearman et al. (Accuracy: 0.82, AUC: 0.84) 52 demonstrated similar results in predicting the success of passing attempts. Contrary, Bauer and Anzer's 46 pass model showed an increased prediction performance (F1-Score: 0.95, AUC: 0.96), however, they excluded passes that were blocked immediately which has a direct effect on the prediction. Those results indicate that our model effectively predicts the success probability of an attempted pass by solely including four powerful features. Thereby, it provides important information on the match situation.
Overall, the combination of both presented models hold high potential in performance analysis in various use cases which are outlined below.
Practical risk-reward assessment
In practice-oriented soccer data analysis, the true value of any approach or model is reflected in its practical application. Showcasing cutting-edge models through clear and compelling use cases demonstrates their usability and defines their significance in real-world scenarios. Furthermore, the gap between complex data points and actionable insights is bridged, making them accessible, hands-on, and interpretable. Thereby, the ultimate goal is to translate these advanced approaches into tangible impacts on the pitch, supporting teams, coaches, and analysts to enable more informed decisions and gain a competitive advantage. Therefore, the possibilities of the presented EPV and xBG models to analyze tactical match performance are illustrated.
Next to the independent analysis of EPV and xBG, the most interesting insights can be gained by analyzing the risk and reward of match situations by combining both models. For instance, in defensive transition, the risk to concede can be measured by the magnitude in opposing EPV (minus EPV) while simultaneously the reward of regaining the ball can be quantified by xBG (plus xBG) which results in an overall measure of: [−EPV + xBG] with a range from [−1 to 1]. On the other side, in offensive transition, this evaluation of reward (to score) and risk (to loose possession) can be evaluated by the composite measure of: [+EPV − xBG] with the same range [−1 to 1]. For both composite measures, positive values indicate a favorable risk-reward scenario of a match situation or action, while negative values represent an unfavorable game state.
Those measures can be applied in both post-match and pre-match analyses. For instance, in post-match analysis, the possessions of a whole match can be analyzed focusing on EPV-xBG values to efficiently filter decisive match situations in seconds. Examples of those approaches to analyze a whole match or individual match situations using the presented models can be found in Forcher et al. 33
Next to the analysis of whole teams, an individual player analysis can be applied to gain insights about individual performances. For soccer players the main focus is to make the right tactical decisions 11 and with the presented metrics this decision-making process becomes measurable based on the achievement of the tactical objectives. This type of analysis is exemplarily performed on the passing performance of players as passing is the most frequent way of player interactions in offense. 12 Identifying which players create the most value for the team's performance in achieving the tactical objectives of both offense and defense can be a competitive edge in scouting or pre-match analysis.
In this case, passes with a high EPV-xBG gain can be interpreted as passes that successfully put a teammate into a position where the chance to score is increased while simultaneously the risk of losing ball possession is minimized. On the other hand, low EPV-xBG gain values (or even decreasing values) may indicate passes with a high risk of losing possession (e.g. due to a highly pressurized receiver and limited nearby passing options to maintain ball control), even if the EPV reward for scoring may be maximized.
An exemplary passing performance analysis using the described metrics is illustrated in Figure 4. This analysis allows for comparing two players based on their risk-reward decision-making in passing, contextualized by their playing time over the course of a season. It highlights their respective strengths and weaknesses in managing complex match situations, where both the structure of the attacking team (e.g. nearby passing options) and the defensive structure of the opposition (e.g. probability to regain the ball) are considered using the two presented models (EPV & xBG). This enables deeper insights into players’ tactical performance (e.g. success rate under pressure or chance creation with passing) and can thereby support various processes in elite soccer (e.g. scouting).
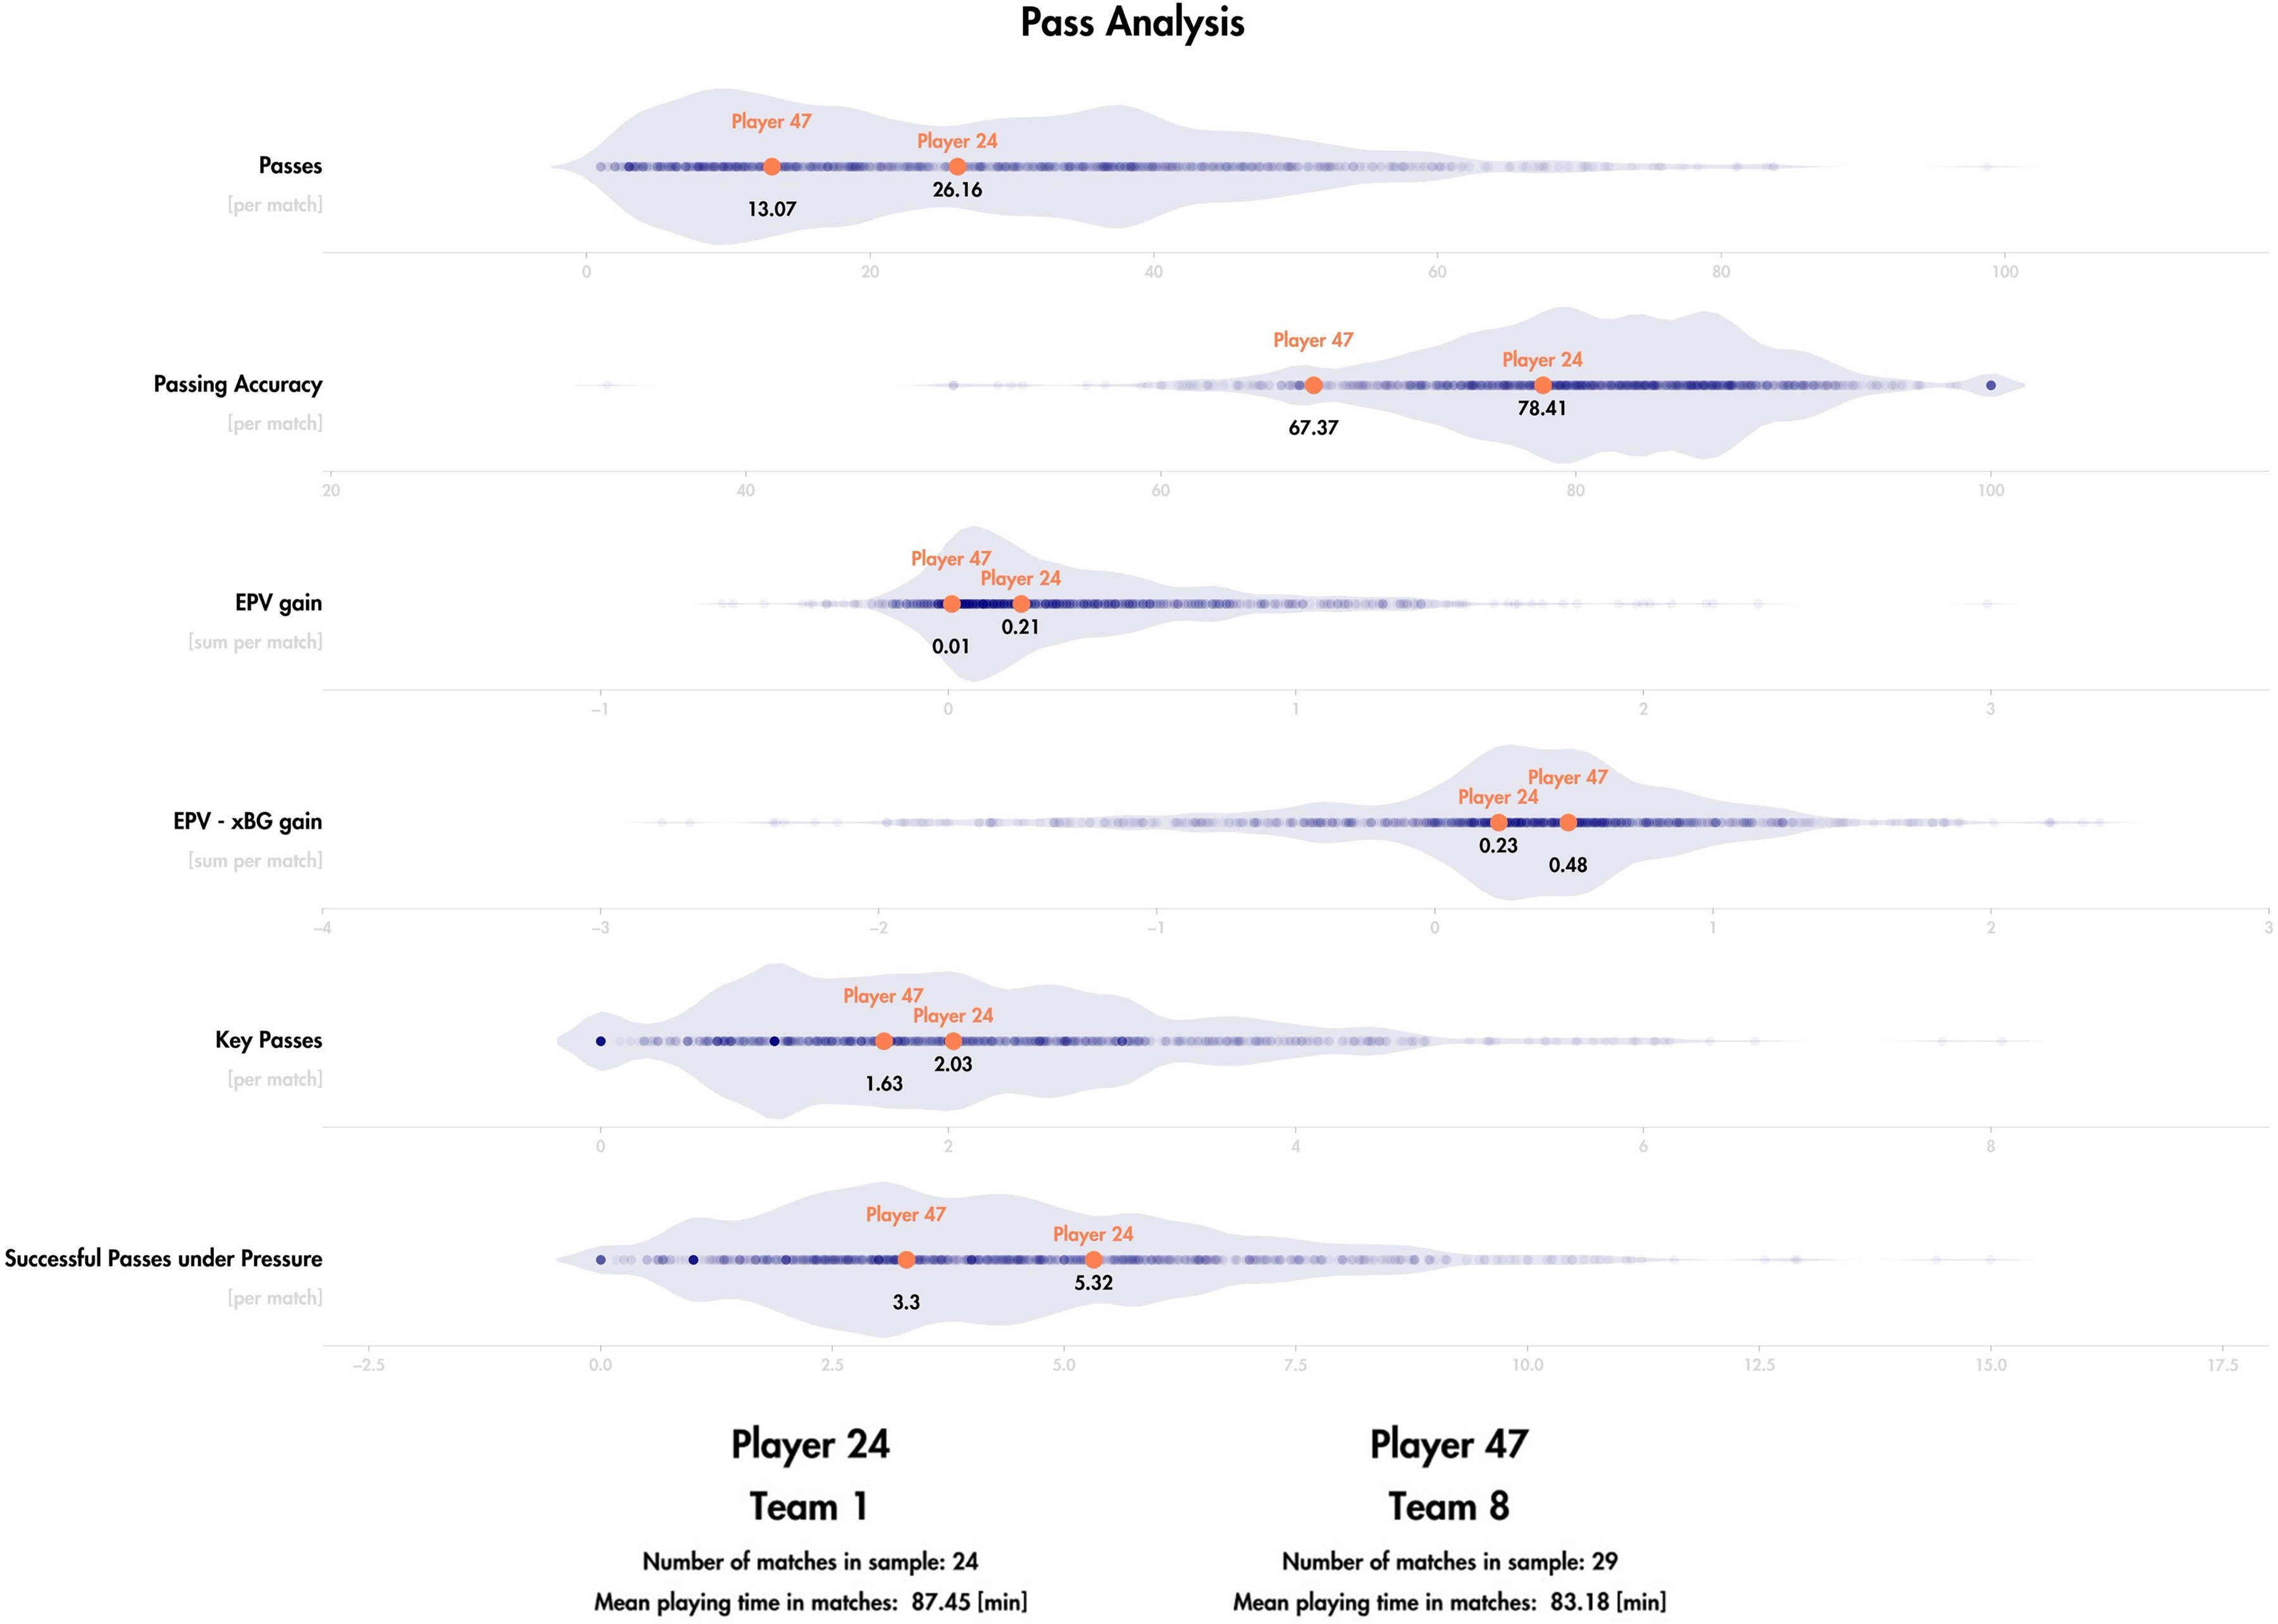
Individual player analysis based on the passing performance and the presented xBG and EPV models in Bundesliga season 23/24. (EPV gain ≙ sum of EPV gained by successful passes of the individual player, EPV – xBG gain ≙ sum of EPV-xBG gained by successful passes of the individual player, Key Passes ≙ number of successful passes of the individual player with an EPV-xBG gain of over 0.2, Successful Passes under Pressure ≙ number of successful passes of the individual player exposed with a defensive pressure over 60%).
Next to the analysis of passing performance this type of analysis can be applied to other player actions such as dribblings (players that increase the probability of a successful possession by dribbling) or pass receptions (players that create valuable target options).
Limitations and future research
When interpreting the results of this study, it is important to note its limitations.
One limitation is that the optimization and evaluation of machine learning models developed in this study also focus on discrimination of classes (i.e. Recall) rather than focusing solely on calibration, which accounts for the accuracy of predicted probabilities. 50 While the resulting models indicate robust discrimination and calibration results, the models slightly overestimate the true probabilities (see Figure 3). Therefore, the probability estimates need to be interpreted with caution. Therefore, future studies should also focus on calibrating the models presented in this study (EPV & xBG) to enable a more accurate and nuanced interpretation of probability outputs.
Further, this study was conducted exclusively using data from the highest performance level of the first-division German Bundesliga. Therefore, transfers of the presented findings to other leagues or performance levels should be made with caution.
Additionally, while some information on the match situational context was included in the presented analysis (e.g. duration of the possession) other contextual information was not considered (e.g. match venue, score-line). This procedure was chosen to focus on tactical match performance and present findings that are valuable independent of the general match context. Future studies should therefore analyze the differences in EPV and xBG depending on different match contexts. For instance, for the match context of score-line future studies could analyze whether leading teams achieve an increased EPV-xBG in offensive transition due to a high risk opposing team that needs to score an equalizer which may result in an unstable defense after a ball loss.
Furthermore, the presented models solely included features on tactical and technical match performance. Further information about the analyzed players (e.g. players’ anthropometry such as height or weight) and their physical and psychological match performance may improve the accuracy of applied models. Even though the analysis of psychological match performance (such as anticipation) is challenging and the availability of anthropometric data in the current data formats is scarce, future studies should aim to analyze the performance of soccer players as comprehensively as possible (e.g. considering all main facets of match performance: tactical, technical, physical & psychological) in order to gain deeper insights into overall soccer performance.
Moreover, the weighting scheme used for the composite optimization metric (α, β, γ; see Statistics in Methods section) was selected to best align with our study objectives, without conducting a systematic sensitivity analysis. Future methodological work could therefore explore alternative weighting configurations.
Finally, the features derived using rule-based approaches (e.g. deep runs) or machine learning models (e.g. expected pass reception in feature close pass options) used in this study contain a certain degree of error (e.g. accuracy of deep run identification of 84.5%). This may result in the possibility of incorrect labels within the input data which has direct effects on the performance and inner mechanisms of the developed models. This limitation needs to be noted when interpreting the results of this study.
Conclusion
This study presented a comprehensive big data analysis of over 600 elite-level soccer matches of two seasons of German Bundesliga, leveraging machine learning models (xBG & EPV) built upon match analysis expert knowledge and hand-crafted feature engineering. With the analysis of xBG and EPV during transitions valuable and practice-oriented insights into the tactical match performance of teams and players were gained. By simultaneously quantifying both the risk and reward of every match situation an in-depth assessment of player and team performance for the offensive and defensive team is enabled. As a result, these findings assist in measuring tactical strategy trade-offs, for instance in counter-pressing in defensive transition (vs. falling back) or counter-attacking in offensive transition (vs. saving the ball). Taking this analysis further to practical use cases, such as the individual player analysis presented, showcases the practical usability of the presented approach for advancing in the analysis of tactical decision-making in soccer.
Footnotes
Acknowledgments
The authors thank the German Football League (Deutsche Fußball Liga, DFL) for providing the match data used in this study.
Ethical considerations
This study was conducted according to the guidelines of the Declaration of Helsinki and approved by the local ethics committee (Human and Business Sciences Institute, Saarland University, Germany, identification number: 22–02, 10 January 2022).
Funding
The authors received no financial support for the research, authorship, and/or publication of this article.
Declaration of conflicting interests
The authors declared no potential conflicts of interest with respect to the research, authorship, and/or publication of this article.
Data availability statement
The used data is property of the German Football League (Deutsche Fußball Liga, DFL) and is not publicly available. The authors do not have permission to share the data publicly. This work can be reproduced using similar data from professional soccer (e.g. tracking and event data of other soccer leagues).
Appendix 1
Appendix 2
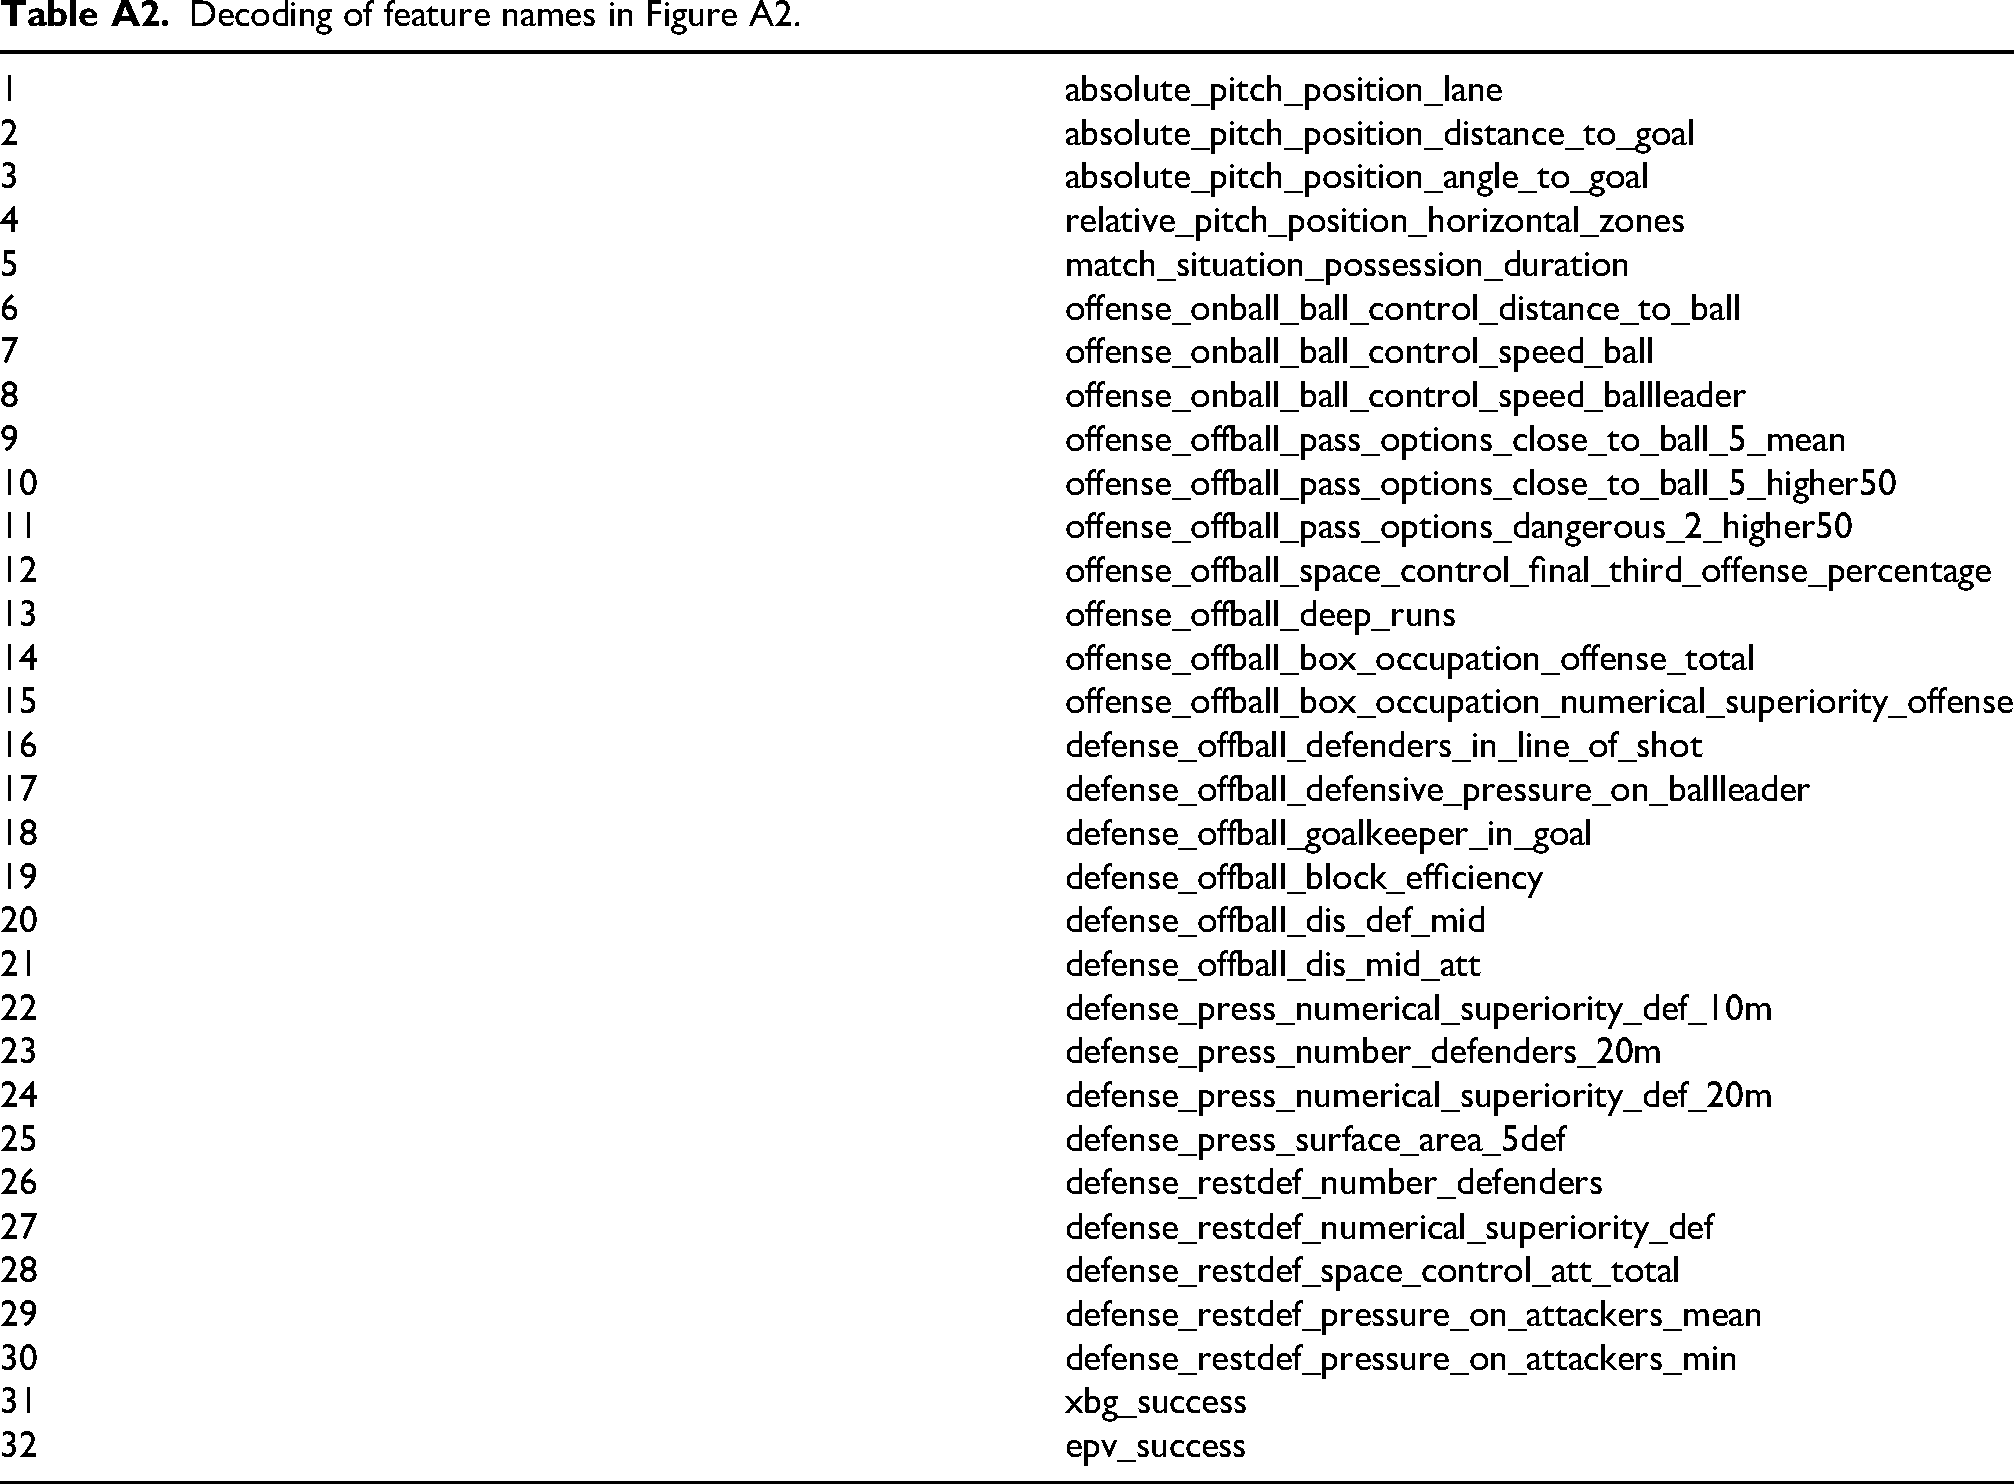
Decoding of feature names in Figure A2.
| 1 | absolute_pitch_position_lane |
| 2 | absolute_pitch_position_distance_to_goal |
| 3 | absolute_pitch_position_angle_to_goal |
| 4 | relative_pitch_position_horizontal_zones |
| 5 | match_situation_possession_duration |
| 6 | offense_onball_ball_control_distance_to_ball |
| 7 | offense_onball_ball_control_speed_ball |
| 8 | offense_onball_ball_control_speed_ballleader |
| 9 | offense_offball_pass_options_close_to_ball_5_mean |
| 10 | offense_offball_pass_options_close_to_ball_5_higher50 |
| 11 | offense_offball_pass_options_dangerous_2_higher50 |
| 12 | offense_offball_space_control_final_third_offense_percentage |
| 13 | offense_offball_deep_runs |
| 14 | offense_offball_box_occupation_offense_total |
| 15 | offense_offball_box_occupation_numerical_superiority_offense |
| 16 | defense_offball_defenders_in_line_of_shot |
| 17 | defense_offball_defensive_pressure_on_ballleader |
| 18 | defense_offball_goalkeeper_in_goal |
| 19 | defense_offball_block_efficiency |
| 20 | defense_offball_dis_def_mid |
| 21 | defense_offball_dis_mid_att |
| 22 | defense_press_numerical_superiority_def_10m |
| 23 | defense_press_number_defenders_20m |
| 24 | defense_press_numerical_superiority_def_20m |
| 25 | defense_press_surface_area_5def |
| 26 | defense_restdef_number_defenders |
| 27 | defense_restdef_numerical_superiority_def |
| 28 | defense_restdef_space_control_att_total |
| 29 | defense_restdef_pressure_on_attackers_mean |
| 30 | defense_restdef_pressure_on_attackers_min |
| 31 | xbg_success |
| 32 | epv_success |