
Abstract
This study investigated the relationship between team strength and winning the penalty shootout in men's soccer. It used publicly available market values to estimate team strength and the outcomes of 409 shootouts from club and national teams involved in national and international competitions. Two measures for team strength were used: the pre-game strength based on the market value of the eleven starting players of the team, and the in-game strength based on the average market value of only those players and goalkeepers who participated in the shootout. Both measures were taken relative to the opposing team. Results from binary logistic regressions indicated a significant effect of team strength on the winner of the shootout. This was found for both team strength measures. This reinforces findings from previous research with alternative operationalizations of team strength. These results show that a shootout is not merely a lottery. Further research is needed to disentangle the degree to which the outcome of the shootout reflects merely the sum of the efforts of individual players or also a genuine collective team effort.
Introduction
In most soccer tournaments, extra time is added if a game is tied after regular time. The teams go to a penalty shootout if this extra time does not provide a winner. Five players are selected to alternately take penalty kicks to decide who wins the game, and when still drawn, additional rounds of one kick each are used to force a decision. 1 The shootout is (increasingly) important in deciding upon the winner in soccer tournaments 2 and is known to be nerve-racking for both the audience and the players. Hence, one research focus is on performance pressure influencing the kicker.3–7 Additionally, the strategic behaviors of goalkeepers and kickers are analyzed to predict kick outcomes.8–15 What characterizes these studies is that they focus on the skills and performances of the individual goalkeeper and player, stopping or scoring a penalty kick. A topic that has received less attention is predicting which team wins the shootout.
Research on factors that predict the winner in shootouts is scarce, but an important exception is the research on the so-called first-mover advantage. Apesteguia and Palacios-Huerta found an advantage for the team making the first move (i.e., taking the first kick). 16 However, this was contested by Kocher et al., 17 Arrondel et al., 5 Santos, 18 Vollmer et al., 19 and Pipke. 20 Moll et al. investigated a second factor. They found that celebratory responses by players during the shootout were associated with winning the shootout. 21 Both factors (moving first and celebratory responses) can be considered in-game factors because they only manifest themselves during the game. These can be contrasted with pre-game factors, which are already present before the start of the game. 22 Accordingly, Billsberry et al. 23 investigated the dimensions of national culture introduced by Hofstede, 24 which reflects the level of individualism/collectivism, to predict the outcome of the shootout in competitions for national teams. They found that teams from ‘individualistic’ countries outperformed teams from ‘collectivistic’ countries.
Arrondel et al. suggested that pre-game team strength predicted the winner of shootouts in French cup competitions. 5 They argued – without further discussion – that ‘a team at a higher level than its opponent has an approximately 20% larger probability of winning the penalty shoot-out’. 5 [p. 28] Krumer verified this by investigating the shootout outcomes between teams from different divisions in five cup competitions in Europe. 25 He analyzed 586 shootouts and concluded that team strength is an important predictor of who wins a shootout. He found an eight-percentage point difference in favor of the team that played one division higher (i.e., 54% versus 46%). The second study that addressed the effect of team strength on predicting the winner is Wunderlich et al. 26 They analysed 1067 shootouts from 14 club competitions (12 national and 2 international competitions) and used a different estimate of strength: the pre-game betting odds, which they interpreted as an expert rating of team strength. Before, betting odds had been used to predict match outcomes in soccer.27–29 Wunderlich et al. found that betting odds can also be used to predict the winner of the shootout, but because very weak teams still had a forty percent chance of winning the shootout, they did not consider it a strong predictor. 26 Pipke [20, Online Appendix A5] found additional evidence that pre-game betting odds are predictive of winning a shootout.
The two studies that specifically investigated the effect of pre-game measures of team strength on shootout outcomes reported a significant relationship.25,26 The current study aims to add to these findings by using players’ market values as a new estimate of team strength, and differentiating this into a pre-game measure (i.e., the market value of the team) and an in-game measure of team strength (i.e., the market value of the participants in the shootout). We intend to uncover if, when (i.e., pre- or in-game), and to what extent the winner of the shootout can be predicted. This also speaks to a still manifest belief among some pundits and experts that the shootout is a ‘lottery’ and decided by luck 6 and discussions about the fairness of deciding upon the winner by shootouts. 25
To the best of our knowledge, market value has not been used to predict the winner of shootouts in soccer. There are, however, good reasons to do so. Market values for players in all the main competitions in soccer are available on the website transfermarkt.com. Because typically transfer fees and salaries are not disclosed, transfermarkt.com uses individual judgments of online community members and subsequent expert assessment to derive market values of individual players.30–32 Herm et al. conclude that market values predict actual transfer fees, 30 while Prockl and Frick show that market values are excellent proxies for players’ salaries. 31 The latter authors therefore encourage researchers to use the market values from transfermarkt.com in empirical studies (for a detailed discussion on the validity of the market values estimation, see also33–35). Secondly, Peeters found that the average market value of the team from transfermarkt.com predicts the game result of national teams that are members of the UEFA and CONMEBOL soccer associations. 36 Peeters further stated that ‘it would be interesting to check whether the reported results carry over to other settings in soccer’. 36 [p. 28] The shootout may be such a setting. Finally, Brinkschulte et al. investigated penalty kicks from shootouts and in-game penalty kicks in four major international tournaments and showed that a composite score of the pre-game betting odds and the penalty taker's market value from transfermarkt.com was negatively related to saves by the opposing goalkeeper. 37 Therefore, it is plausible that the market value of a team is a predictor of the outcome of the shootout - if indeed the outcome of a single penalty kick can be extrapolated to the shootout. Hence, we hypothesized that team strength, as estimated by pre-game and in-game market values derived from transfermarkt.com, predicts the winner in shootouts.
The remainder of this paper is structured as follows. Section 2 describes the methods, Section 3 the results, which are discussed in Section 4. Section 5 concludes.
Methods
Data were collected from transfermarkt.com, which provides (historical) market values, including those at the time of the shootout. Data were collected from national and international men's competitions from 2008–2009 to 2023–2024, from the round of 16 onwards. The national competitions were drawn from eight European countries ranked among the UEFA, for which market values were available for all shootouts. We collected data on penalty shootouts from national cups, super cups, and playoffs that decided on promotion, relegation, and qualification for international competitions for club teams. We additionally collected data from five major international competitions for club teams and from four major international tournaments for national teams. For an overview of all the competitions, please refer to Appendix I. For some shootouts, information on covariates (e.g., first mover) was incomplete on transfermarkt.com. In these cases, several other sites were used to complement the dataset to ensure that no shootouts had to be excluded. The sample consisted of 409 penalty shootouts.
Following Krumer, we randomly assigned the qualification ‘Team A’ or ‘Team B’ to the participating teams in each shootout. 25 Data were collected for Team A. The dependent variable in this study was winner (i.e., 1 = Team A won the shootout, 0 = Team A lost the shootout). To predict the winner, we used team strength expressed in two different variables. The first, pre-game measure team market value used the market value of the starting 11 of Team A in comparison with the market value of the starting 11 of Team B (in percentages). The second in-game measure is participants’ market value, for which the average market value of the players, including the goalkeeper, who participated in the shootout for the team, was used. The participants’ average market value of Team A was compared to the participants’ average market value of Team B (also in percentages). Both measures provide the relative team strength within a shootout and thus automatically control for inflation. a
Several covariates were used. The first covariate is team age, which was measured by using the relative average age of the starting 11 of Team A compared to the opponents’ team (in percentages) (e.g.,3,30). A similar variable (participants’ age) was used to control for the age of the participants in the shootout. In addition, seven dummy variables were used (i.e., 1 = if it applied to Team A, 0 = if it did not apply to Team A). We measured match location by using three dummy variables: home (i.e., 1 = Team A played at their home ground), away (i.e., 1 = Team A played at the opponent's home ground), and neutral (i.e., 1 = the game was played at a neutral location) (e.g.,25,26). We measured in-game momentum with three dummy variables: equalizing (i.e., 1 = Team A scored the last equalizing goal), conceding (i.e., 1 = Team A conceded the last equalizing goal), and no equalizer (i.e., 1 = no goals were scored during the game) (e.g., 38 [p. 230,5,2]). The variable first mover was used to measure who took the first shot in the shootout (i.e., 1 = Team A was the first mover) (e.g., 16 ).
To examine associations between team strength and the winner of the shootout, descriptive statistics based on quartiles and Spearman correlations were conducted. Spearman correlations were also used to test for associations between the two measures of team strength and the intercorrelations with and between the covariates. Importantly, two binary logistic regressions were run to test the influence of team strength on the winner of the shootout while controlling for possible confounders. The first model used relative team market value as a predictor, and the second model used relative participants’ market value. These models were tested for outliers, influential cases, linearity of the logit, and multicollinearity. The standardized residual indicated no outliers, and Cook's Distance indicated no influential cases.39[p. 791] The assumption of the linearity of the logit was met for team market value, team age, participants’ market value, and participants’ age.39[p. 794] Tolerance levels were above 0.7, and VIF values were smaller than 2, indicating that multicollinearity was not a concern.39[p.795] The odds ratio (OR) was used as the relative measure of effect, and the significance level was set at 0.05. Data was analysed with SPSS (version 28).
Results
Table 1 provides the summary statistics. As the classification ‘Team A’ was randomly assigned, the mean percentage of wins should approach half of the games, which is the case (M = 0.509, SD = 0.501). Similarly, the measures for relative market value and relative age, expressed in percentages, logically approach 50%. More specifically, the sample showed relative team market value (M = 49.29, SD = 24.55), relative team age (M = 50.09, SD = 1.76), relative participants’ market value (M = 48.77, SD = 25.69), and relative participants’ age (M = 50.17, SD = 2.43).
Summary statistics for ‘Team A’.
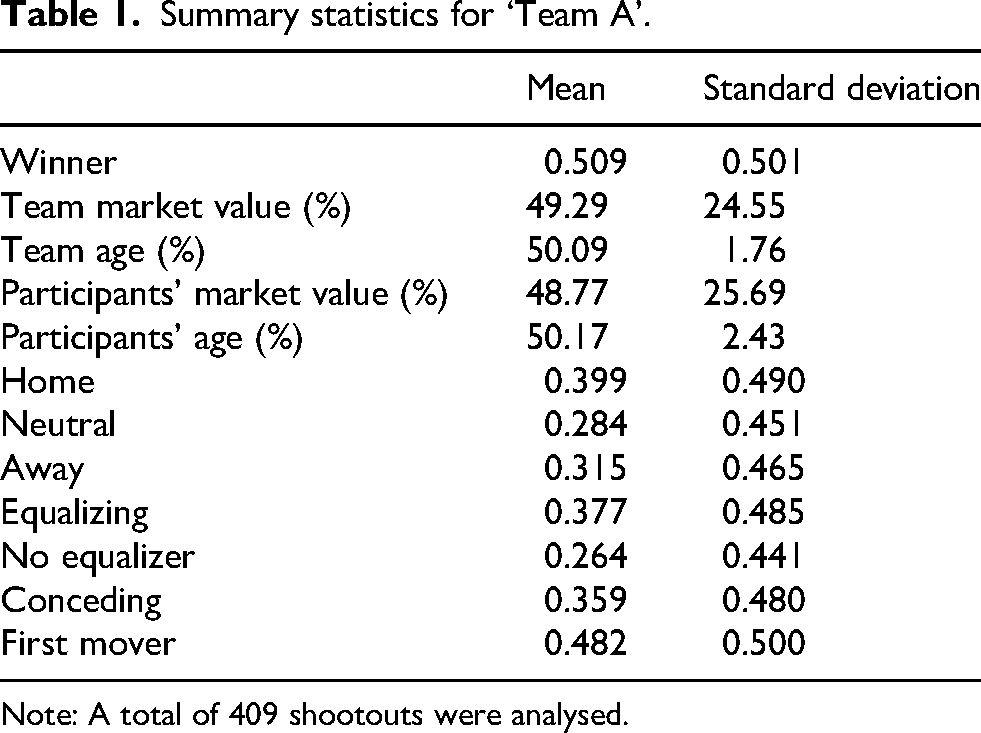
Note: A total of 409 shootouts were analysed.
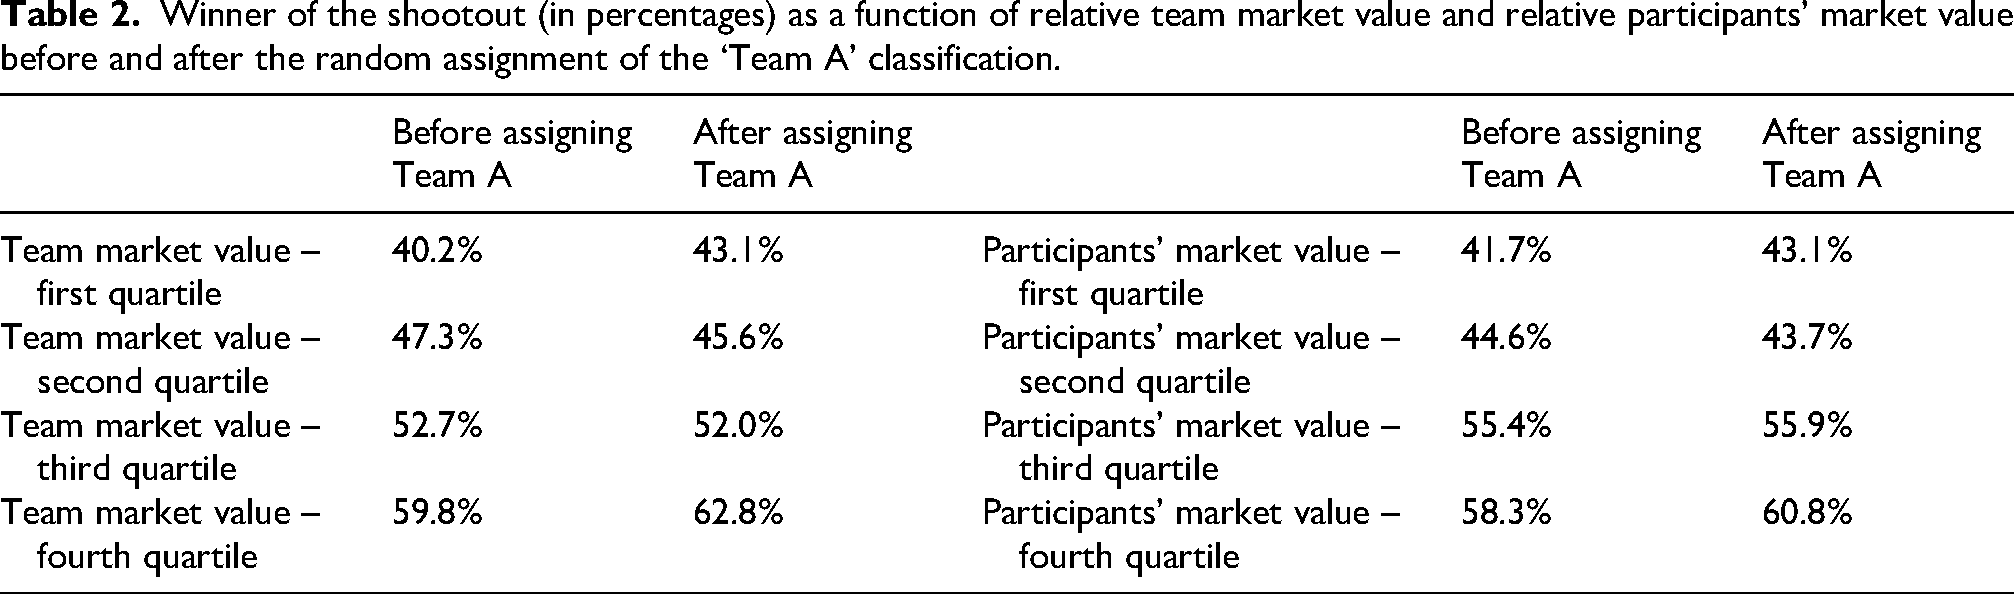
Table 2 shows the descriptive statistics based on quartiles before and after randomly assigning the classification ‘Team A’. It indicates that teams with a higher relative market value win more shootouts. Before assigning the classifications of ‘Team A’, teams in quartile 1 with the lowest relative team market value won the fewest shootouts (i.e., 40.2%). The winning percentage, however, increased for teams in the second and third quartiles to 47.3% and 52.7%, respectively. Teams in quartile 4 with the highest relative market value won the most shootouts (i.e., 59.8%). The same trend across the quartiles emerged for the participants’ relative market value: the winning percentages increased from 41.7% to 44.6%, to 55.4%, to 58.3%. Table 2 indicates similar increases in winning the shootout for the team and participants’ market values after the random assignment of the classification ‘Team A’. The Spearman correlations show that both measures of team strength are significantly related to the winner. Winner is positively correlated with relative team market value rs = .158 (n = 409, p = .001, two-tailed) and relative participants’ market value rs = .156 (n = 409, p = .002, two-tailed). The two measures of team strength (team market value and participants’ market value) are strongly correlated, rs = .919 (n = 409, p = <.001, two-tailed). There is one other notable significant association, between the covariates away and conceding rs = .171 (n = 409, p = .001, two-tailed), indicating that away teams conceded more equalizers during the game.
Winner of the shootout (in percentages) as a function of relative team market value and relative participants’ market value before and after the random assignment of the ‘Team A’ classification.
The results from the binary logistic regressions are indicated in Table 3. In the first model, we used relative team market value as the predictor and found an odds ratio of 1.013 (p = .001). This means that if the relative team market value (i.e., the market value relative to the opponent) increases by 1.0%, the odds of winning the shootout increase by 1.3%. None of the covariates predicted the winner of the shootout. In the second model, we used relative participants’ market value as the predictor and found a similar association with winner (OR = 1.013 and p = .001), and again, none of the covariates were significantly related to winner. Both models significantly predicted winner (omnibus chi-square = 15.5, df = 7, p = .030 and omnibus chi-square = 16.3, df = 7, p = .022, respectively) and accounted for between 3.7% and 3.9% (Cox & Snell) and 5.0% and 5.2% (Nagelkerke) of the variance in winner, respectively. The area under the ROC curve was 0.61 (p < .001) for both models.
Results of the two binary logistic regressions with winner as the dependent variable.
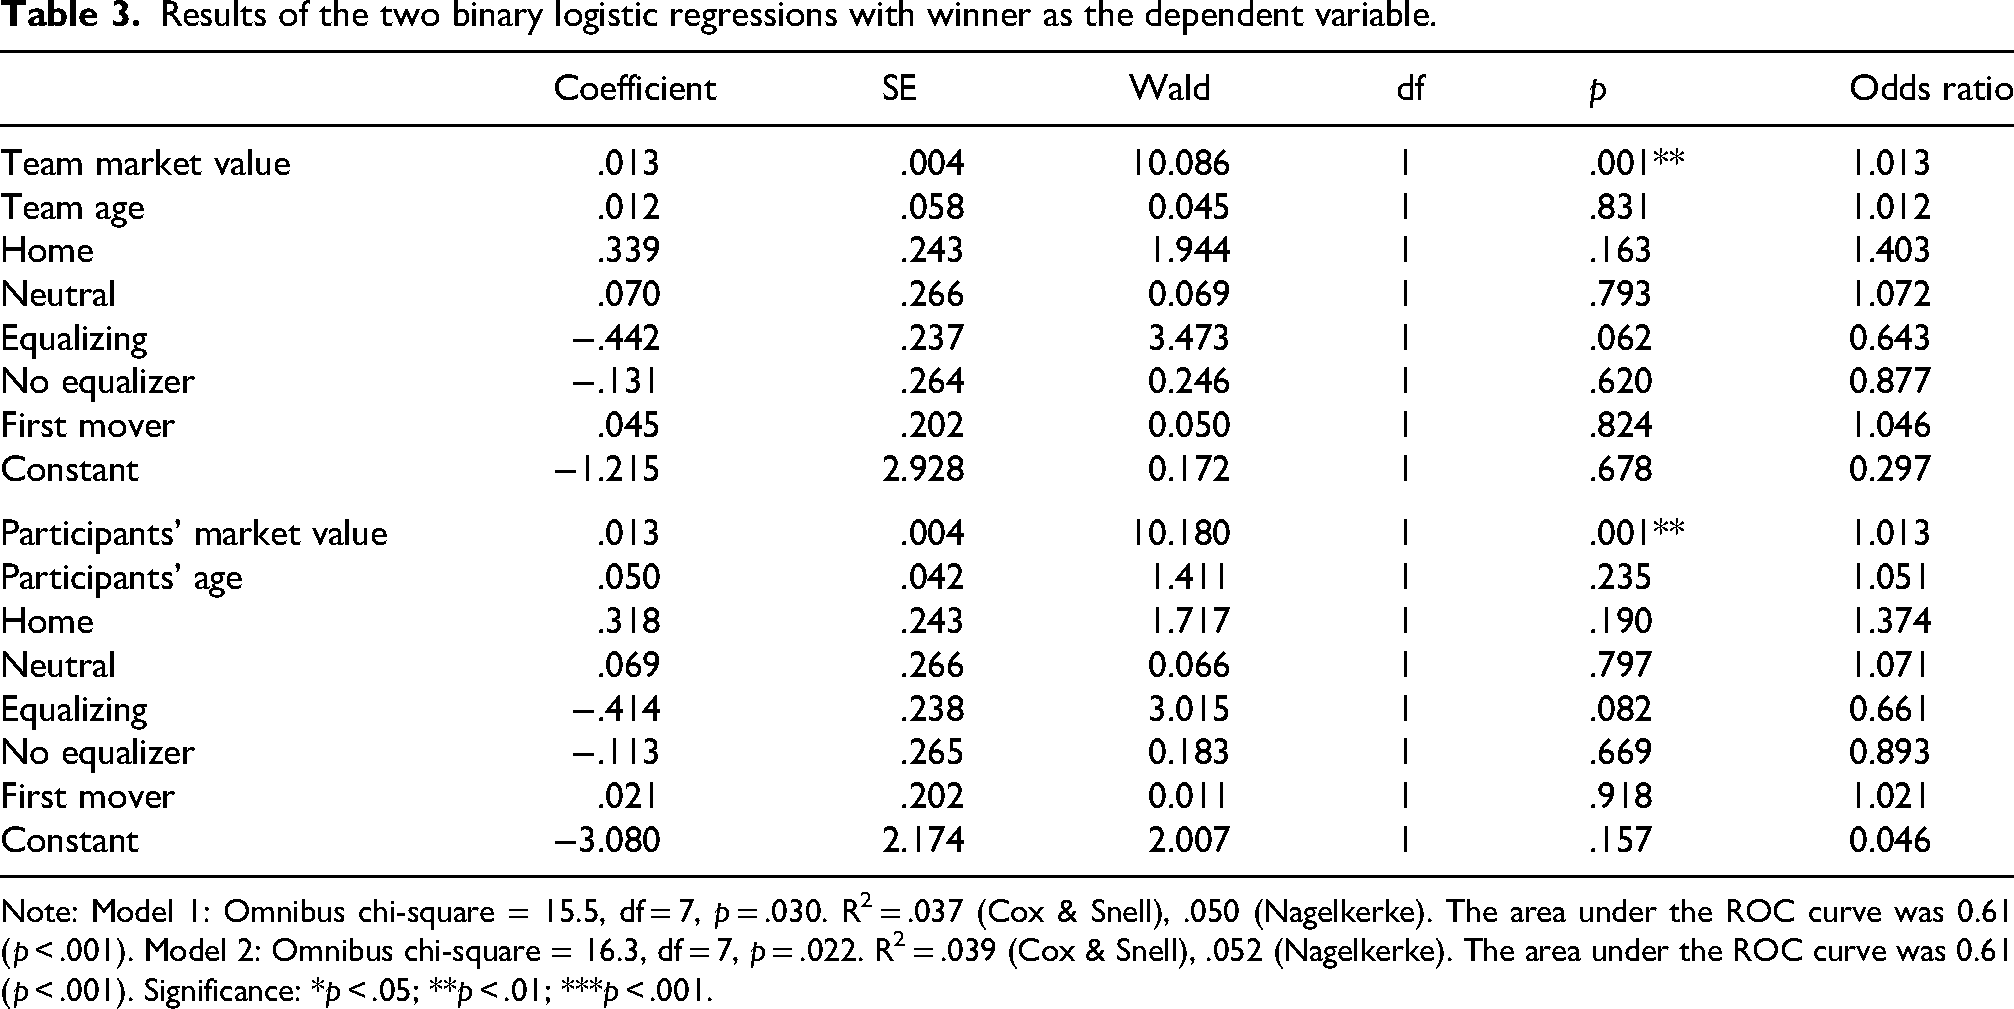
Note: Model 1: Omnibus chi-square = 15.5, df = 7, p = .030. R2 = .037 (Cox & Snell), .050 (Nagelkerke). The area under the ROC curve was 0.61 (p < .001). Model 2: Omnibus chi-square = 16.3, df = 7, p = .022. R2 = .039 (Cox & Snell), .052 (Nagelkerke). The area under the ROC curve was 0.61 (p < .001). Significance: *p < .05; **p < .01; ***p < .001.
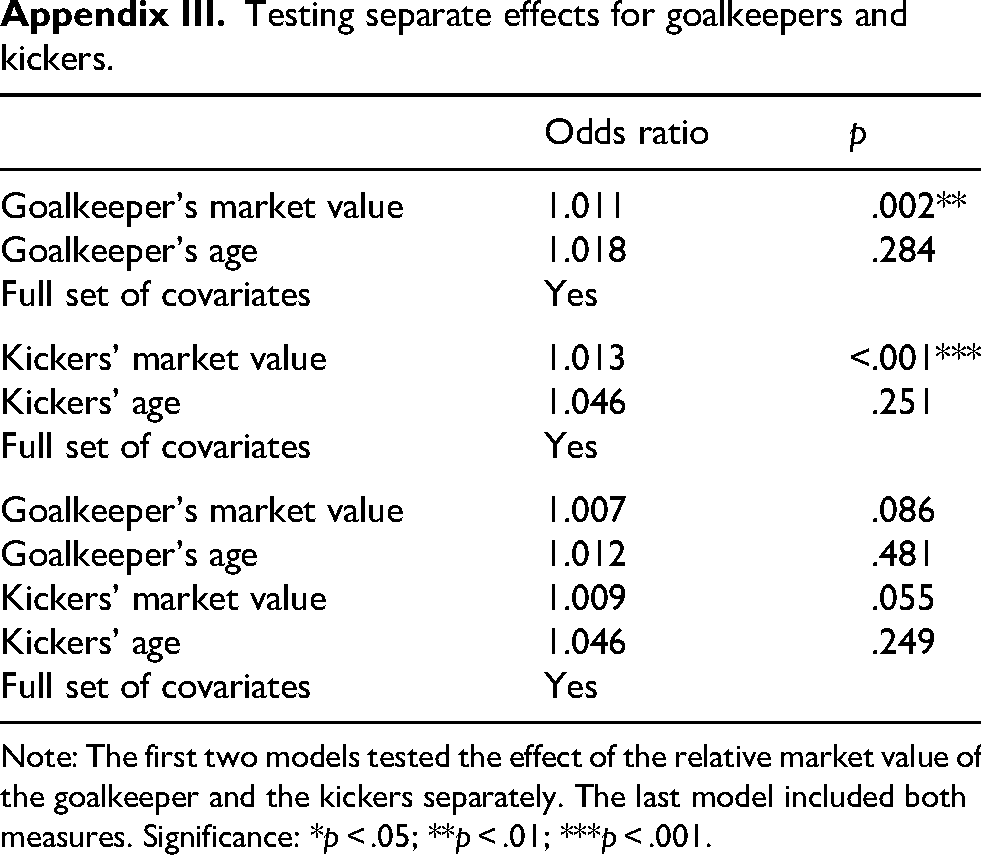
To test the robustness of the results, several checks were carried out. First, two simple models were tested without the full set of covariates on the whole sample, and second, the full model was tested for a subsample consisting of club teams (n = 340). The results were robust to this alternative model and sample restriction (Appendix II). Finally, the participants’ relative market value was split into the goalkeepers only and the kickers only. In separated models that controlled for their relative age, the results were robust. When both were added to the model, the magnitude decreased, and the effect was no longer significant (Appendix III), possibly because the values were correlated, rs = .504 (n = 409, p = <.001, two-tailed).
Discussion
This study indicates that team strength predicts who wins the penalty shootout in soccer. Both the pre-game relative market value of the team and the in-game relative market value of the participants in the shootout are positively associated with winning the shootout. These results align with previous research,25,26 but they use a different estimate of team strength. When considering relative team and participants’ market value, the teams with relative highest value (i.e., in the fourth quartile) win most often, that is, 59.8% and 58.3% of the shootouts, respectively. Additionally, the binary logistic regressions indicate a 1.3% increase in the odds of winning the shootout for each 1% increase in both measures of team strength. The strength of these effects is comparable to that of Wunderlich et al. 26 We interpret these findings as confirming that a shootout in soccer cannot be considered as a mere ‘lottery’, but because the models only explain a small portion of the variation (i.e., approximately 3 to 5%) of the winner, further research is needed to improve the prediction power of statistical models for shootout outcomes. b
There are two important limitations to this study. Although the market value from transfermarkt.com has been used in previous research, it is not a perfect estimator of team strength. 33 Market values can be interpreted as (imperfect) estimates of transfer fees, 33 more specifically, they aim to measure the expected value of a player in a free market. 32 Yet, this expected value is not only based on the current ability of the player, which is critical for predicting current performance, but also on their potential and prospects for future development, 32 which will not directly be manifested in performance. Finally, the quality of the data depends on the fidelity of the data provided by the website transfermarkt.com, which, as for any public website, is challenging to confirm.
The second important limitation is that we only provide evidence for an association and not for causation. Consequently, further research is needed to understand exactly why team strength influences the outcome of shootouts. One possible explanation is that team strength merely reflects the sum of individual players’ skills, as the best teams arguably have the best players, goalkeepers, and coaches. Indeed, research has indicated that the individual skills of kickers and goalkeepers predict the outcome of the penalty kick.22,37,40,41 Yet, penalty goalkeeping and kicking skills are likely to have a minor contribution in determining market value, while players with stronger general skills also do not necessarily perform better in penalty kicks. Still, the current study finds that the separate relative market values of the goalkeeper and players do predict the penalty shootout outcome. The second (possibly additional) explanation is, as argued by Jordet, 42 that even though the penalty kick is an individual task, the outcome of a shootout is more than the summation of these individual tasks: “a penalty kick – both in-game and in shootouts – is better thought of as a collective team task, where several players play their part in making sure that the penalty taker is supported in every way possible”. 42 [p. 154] Further to this point, Jordet argued that this collective team task can be trained and managed. 42 As such, it is perhaps anticipated that the market value of the starting 11 is a stronger predictor of the winner than the market value of the participating players. However, this was not borne out in the present study, also because the two measures were strongly correlated. Other research methods are needed to differentiate how team strength can affect winning the shootout.
Conclusion
This study found that team strength, as measured by market value, is positively associated with the winner of the penalty shootout in men's soccer. This applies to the pre-game relative market value of the team as well as to the in-game relative market value of the participants in the shootout. Further research is needed to disentangle the degree to which the outcome of the shootout reflects a collective team effort or merely the sum of the skills of the participants.
Footnotes
Ethics approval
This research is approved by the Economics and Business Ethics Committee of the University of Amsterdam (EB-13549).
Consent to participate
Not applicable
Consent for publication
Not applicable
Author contributions
RvH conceived the study and collected and analyzed the data. RvH and JvdK contributed to the manuscript.
Funding
The authors received no financial support for the research, authorship, and/or publication of this article.
Declaration of conflicting interests
The authors declared no potential conflicts of interest with respect to the research, authorship, and/or publication of this article.
Data availability
Data are available from the corresponding author upon reasonable request.
Notes
Appendix I.
We collected data from penalty shootouts from the round of 16 onwards for competitions involving club teams and national teams from 2008–2009 to 2023–2024.
Testing separate effects for goalkeepers and kickers.
| Odds ratio | p | |
|---|---|---|
| Goalkeeper's market value | 1.011 | .002** |
| Goalkeeper's age | 1.018 | .284 |
| Full set of covariates | Yes | |
| Kickers’ market value | 1.013 | <.001*** |
| Kickers’ age | 1.046 | .251 |
| Full set of covariates | Yes | |
| Goalkeeper's market value | 1.007 | .086 |
| Goalkeeper's age | 1.012 | .481 |
| Kickers’ market value | 1.009 | .055 |
| Kickers’ age | 1.046 | .249 |
| Full set of covariates | Yes |
Note: The first two models tested the effect of the relative market value of the goalkeeper and the kickers separately. The last model included both measures. Significance: *p < .05; **p < .01; ***p < .001.