
Abstract
Set pieces in soccer (i.e., free kicks and corners) have been examined in detail and are a common focus for coaches during training and performance preparation. However, limited evidence is available on the impact of throw-ins on soccer performance and if coaches should dedicate time in training towards this specific set piece. Therefore, this research aimed to firstly examine if throw-in performance is linked with soccer performance, and secondly the effect throw-in direction and length has on first contact success rate, possession retention, mean time in possession and shot creation. 16,154 throw-ins from 380 English Premier League matches during the 2018–2019 season were analysed. Higher final league position was correlated to increased throw-in first contact success and possession retention. 83% of throw-in’s resulted in a successful first contact, 54% resulted in possession being retained and 8.8% of throw-ins led to a shot at goal from the possession achieved after a successful first contact. Throw-in’s which went backwards or laterally in direction resulted in increased first contact success, retaining of possession, and shot creation. The least efficient throw-in was forwards and long, which resulted in both reduced first contact success and possession retention. Findings highlight, that throwing the ball laterally or backwards should be a focus for coaches and players during attacking training. In contrast, a team’s defensive strategy should reduce the opportunities to throw backwards or laterally with a higher press and look to force a long forward throw-in, therefore, increasing the likelihood of winning possession and counter attacking.
Introduction
Performance analysis is now a central element of sport science support for soccer coaches and therefore research has undergone rapid expansion over recent years, with studies investigating performance indicators related to possession, tactical behaviour, positional demands and the match location.1–4 Furthermore, with set pieces accounting for 30% to 40% of goals scored in elite soccer 5 recent research has focused on set piece examination of corner kicks, 6 free kicks,7,8 and penalty kicks. 9 Findings highlight these set piece game events as critical components of successful offensive performance in soccer and hence form a key focus area during professional soccer training and performance preparation. However, one set piece which has had limited investigation is the throw-in and therefore it is unknown if coaches should dedicate time in training towards this specific set piece. A throw-in is awarded to the opponents of the player who last touched the ball when the whole of the ball passes over the touchline, on the ground or in the air (Law 15). 10 Recently, McKinley 11 highlighted in the Major League Soccer (MLS) between 2015 and 2019 almost 64,000 throw-ins were taken. This results in an average of 44 throw-ins occurring each game, accounting for almost 5% of all passes. This means throw-ins occur more frequently per match than corner kicks (10), 6 , 12 free kicks (25–35)7,8, 13 and goal kicks (17). 14 This highlights the importance throw-ins may have on a team’s possession and the outcome of matches.
Research on throw-ins has typically focused on a biomechanical analysis of throwing the ball as long as possible 15 with the notion of creating a similar goal scoring opportunity to a corner kick (i.e. the ability to deliver the ball into the 18-yard box with pre-plan routines).16,17 Yet, long throws into the 18-yard box are likely to be a small proportion of the total (approx. 44 per match) throw-ins taken per match. 11 , 18 Rather, throw-ins are more commonly used to restart a team’s possession. 11 With the importance of ball possession and shot creation being demonstrated as two factors that can discriminate between winning, drawing, and losing teams, 2 throw-in strategy could therefore directly influence a team’s ability to retain possession and build goal scoring opportunities.
The location of the throw-in has been showed to influence game tactics, with throw-ins in the defensive area of the pitch taking longer to take (i.e. increased game interruption) than in other areas of the pitch. 14 Despite not examining the actions of the resulting throw-in, Siegle and Lames 14 suggested as the team not in ball possession frequently sees a throw-in in the defensive area as an opportunity to conquer the ball, they create pressure that might lead to a longer throw-in duration. This fits with anecdotal evidence from soccer coaches that suggests throw-ins in defensive areas have traditionally been taught to “work the line” and “play in their half”. The emphasis being to throw the ball as long as possible in the forward direction (“down the line”) away from the teams’ own goal. However, empirical evidence is required to support the effectiveness of this strategy and help inform coaches tactics. Furthermore, the potential importance of the throw-in on soccer matches was recently highlighted in practice by professional soccer teams starting to hire coaches specialising in throw-in strategy. 19 Yet with the very limited research to date (for an exception see McKinley 11 online article) empirical understanding on how throw-ins could affect soccer performance is needed to aid with future coaching practice. Therefore, this research aimed to firstly examine if throw-in performance is linked with soccer performance, and secondly the effect throw-in direction and length has on first contact success rate, possession retention, mean time in possession, and shot creation during the English Premier League 2018–2019 season.
Method
Sample
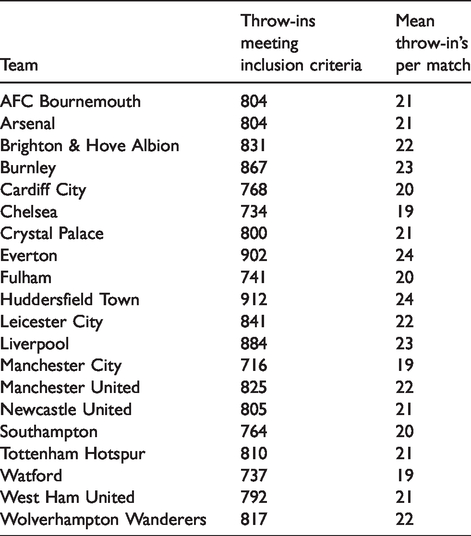
The 20 English Premier League teams were included in the sample. Raw coded data on throw-in phases of play was exported from each of the 380 games during the 2018/2019 English Premier League season from the Statsbomb database (https://statsbomb.com). Permission to use the data was granted by Statsbomb. This resulted in a sample of 16,380 phases of play starting from a throw-in. After excluding throws-ins from injury clearances (i.e. possession freely given back to the opposition following the ball being kicked out of play due to an injury) a total of 16,154 throw-in’s were included in the sample (see Table 1) and resulted on average of 808 throw-in’s per team (range 716–912 throw-ins). The Local University ethics committee granted approval for the study.
Total number of throw-ins and mean throw-ins per match during the 2018–2019 English Premier League Season.
Measures and procedures
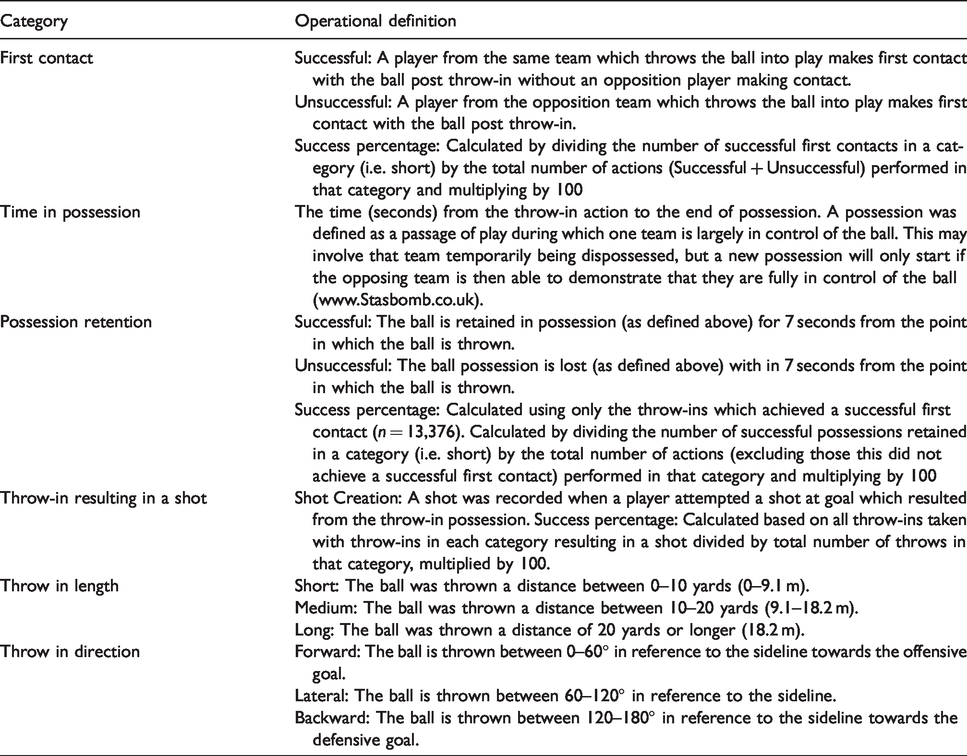
Raw data from each throw-ins phase of play was exported from the Statsbomb database (www.statsbomb.com). The phase of play was defined from the start of the throw-in action, to the point the team which threw the ball lost possession of the ball. Raw data included, the team, opposition team, throw in location (x, y), outcome of the throw, throw-in outcome location (x, y), angle of throw in, length of throw-in, time in the match, actions during the possession from the throw-in, and the outcome of possession from the throw-in. Microsoft Office Excel (Version 14.7.1, Microsoft Cooperation, United States) was used to calculate performance indicators from the raw files for each of the 20 teams. Based on the performance indicators, three independent variables were examined, length (short, medium, long), direction (backwards, lateral, forwards) and pitch location (4 areas, see Figure 1). The effect of these independent variables was examined via four dependant variables, first contact success, possession retention success, mean time in possession, and shot creation (see Table 2 and Figure 1 for categories and definitions).
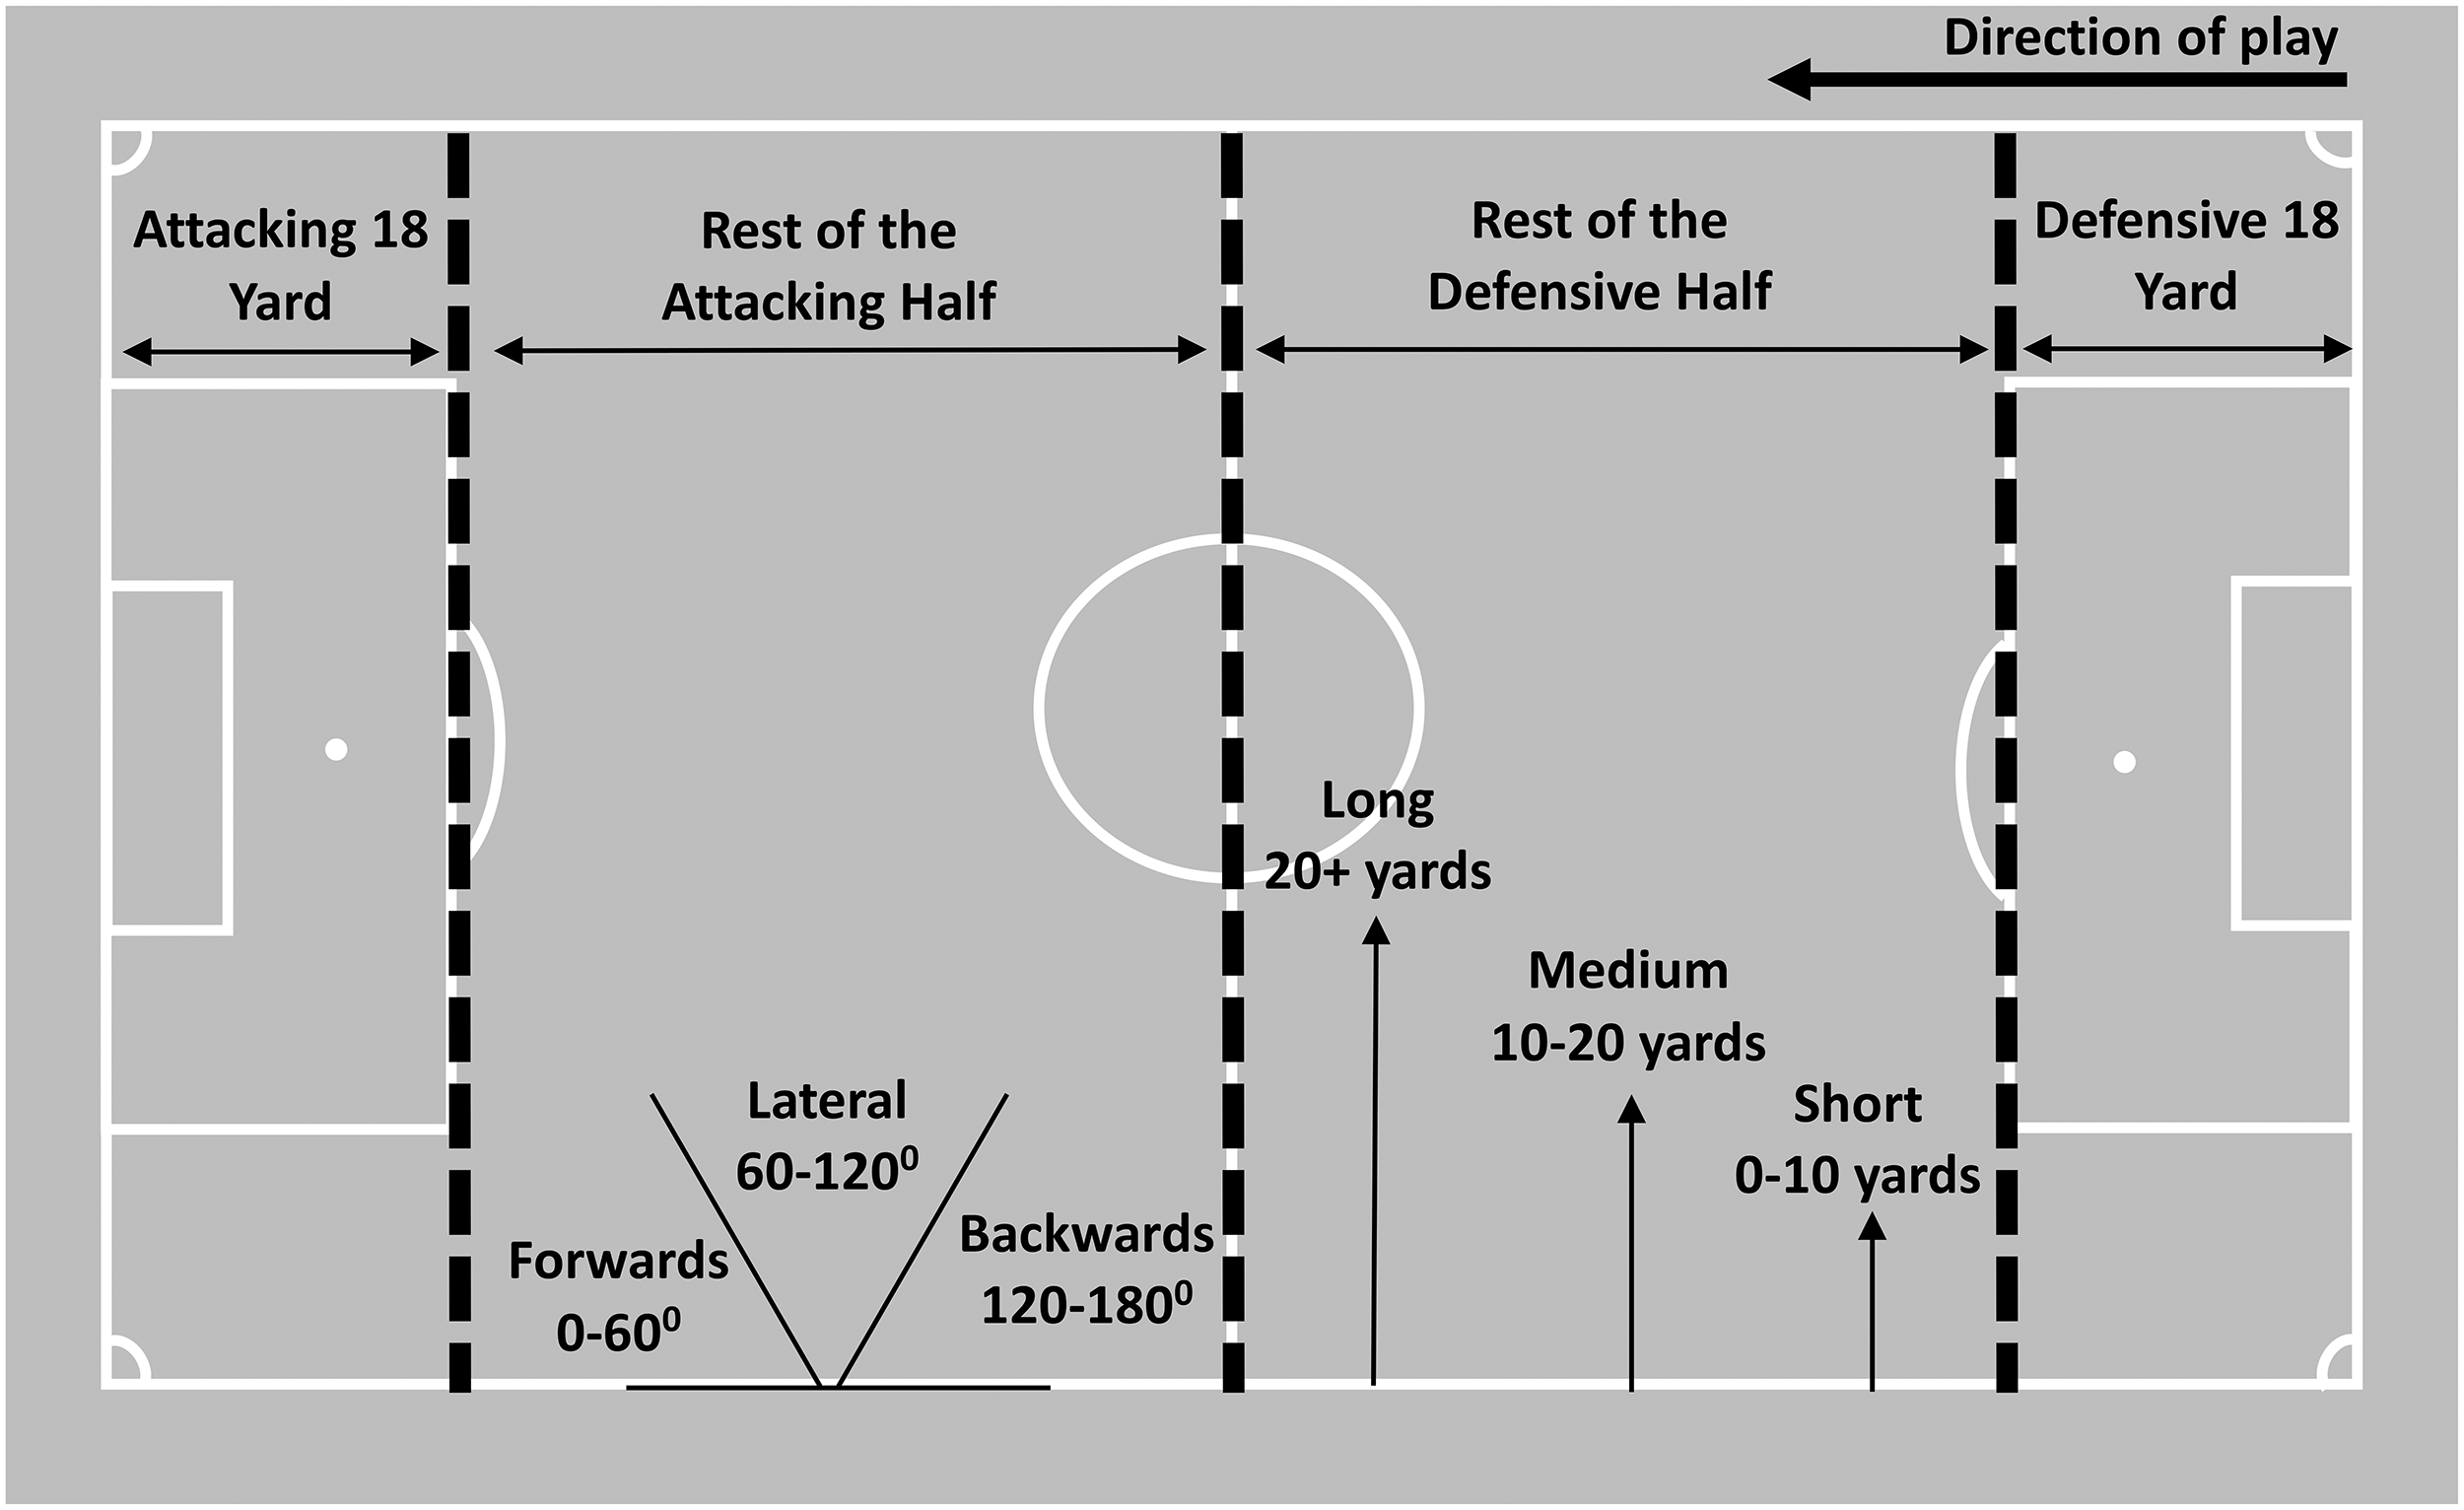
Operational definitions for throw-in lengths, directions and outcome variables (based on Statsbomb, 201921 and McKinley, 201811).
Statsbomb are one of the leading suppliers of statistical data in professional football clubs, media outlets, and broadcasters. However, to ensure the reliability of the data set, three randomly selected matches were independently coded by the lead author using a NacSport (NacSport Elite, Las Palmas de Gran Canaria, Spain) custom-notational analysis system examining throw-in location, length, direction and outcome (i.e. first contact succuss and possession retention). Cohen’s kappa coefficient was calculated, based on analysis of 106 throw-ins, with a kappa value of k = 0.97 representing excellent reliability. 20
Data analysis
Descriptive analyses was employed in Microsoft Office Excel to calculate relative frequencies for each variable and the calculation of performance mean success values for each team, (based on each teams 38 games) for each variable. The data was then transferred to SPSS (Version 24.00 SPSS Inc., USA) to perform statistical analysis. First to establish if a relationship existed between overall team performance and throw-ins, separate spearman correlation coefficients were performed between final league position (ranked 1–20) and first contact success, possession retention success, mean time in possession, and throw-ins resulting in a shot from the possession achieved after a successful first contact. Second, to test the relationship between league position and throw-in strategy, separate spearman correlation coefficients were performed between final league position, and percentage of throw-ins (directions and lengths). Due to the low number of throw-ins taken in the defensive 18-yard area, and the expectation of throw-ins in the attacking 18-yard area to have more of an emphasis on direct set pieces and not possession retention, these two zones were excluded from further analysis. Data was examined between the two remaining locations (rest of the defensive half, and rest of the attacking half) to examine the influence of specific throw-in strategies on performance (examined via first contact success, possession retention and shot creation). The majority of data was normally distributed, examined via Shapiro-wilk tests (p > .05), therefore parametric analysis was employed. Separate Three-way (Location, Direction and Length) repeated measure Analysis of Variances (ANOVA) were used to examined first contact success, possession retention, and mean time in possession with pairwise post-hoc testing using a Bonferroni correction. Finally, due to the lower number of shots being created, the two locations were combined and a Two-way (Direction and Length) ANOVA was employed for shot creation. If the assumption of sphericity was violated, a Greenhouse-Geisser correction was used. Partial Eta Squared (ηp2) is presented for effect size estimations of main effects on ANOVAs.
Results
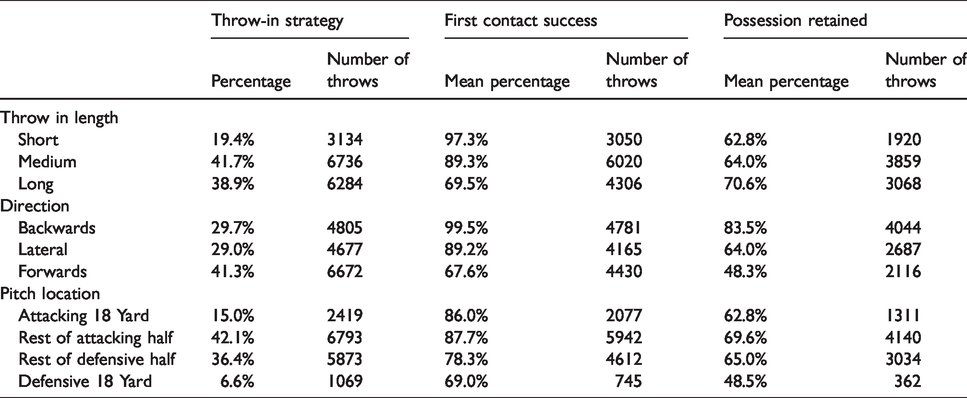
Descriptive analysis is presented in Table 3. A total of 16,154 throw-in’s were taken during the 2018–2019 season (excluding injury clearances), in which 83% (13,376 throws) resulted in a successful first contact, 54% (8847 throws) resulted in possession being retained for 7 seconds or longer, with 8.8% (1422) of throw-ins resulting in a shot from the possession achieved after a successful first contact. The most common direction of throw was forwards (41.3%) with 78.5% of throw-ins taken in the rest of the attacking and defensive areas.
Descriptive analysis of throw-in strategy (n = 16,154), first contact success (n = 13,376) and possession retained (n = 8847) in relation to throw-in length, direction, and pitch location.
Relationship between throw-ins and final league position
There was a relationship between league position and first contact success (rs (20) = −.868, p < 0.001), possession retention success (rs (20) = −.768, p < 0.001), mean time in possession after the throw-in (rs (20) = −.738, p < 0.001) and throw-ins resulting in a shot from the possession achieved after a successful first contact (rs (20) = −.710, p < 0.05) (see Figure 2). The higher ranked teams had greater success rates in all four variables.
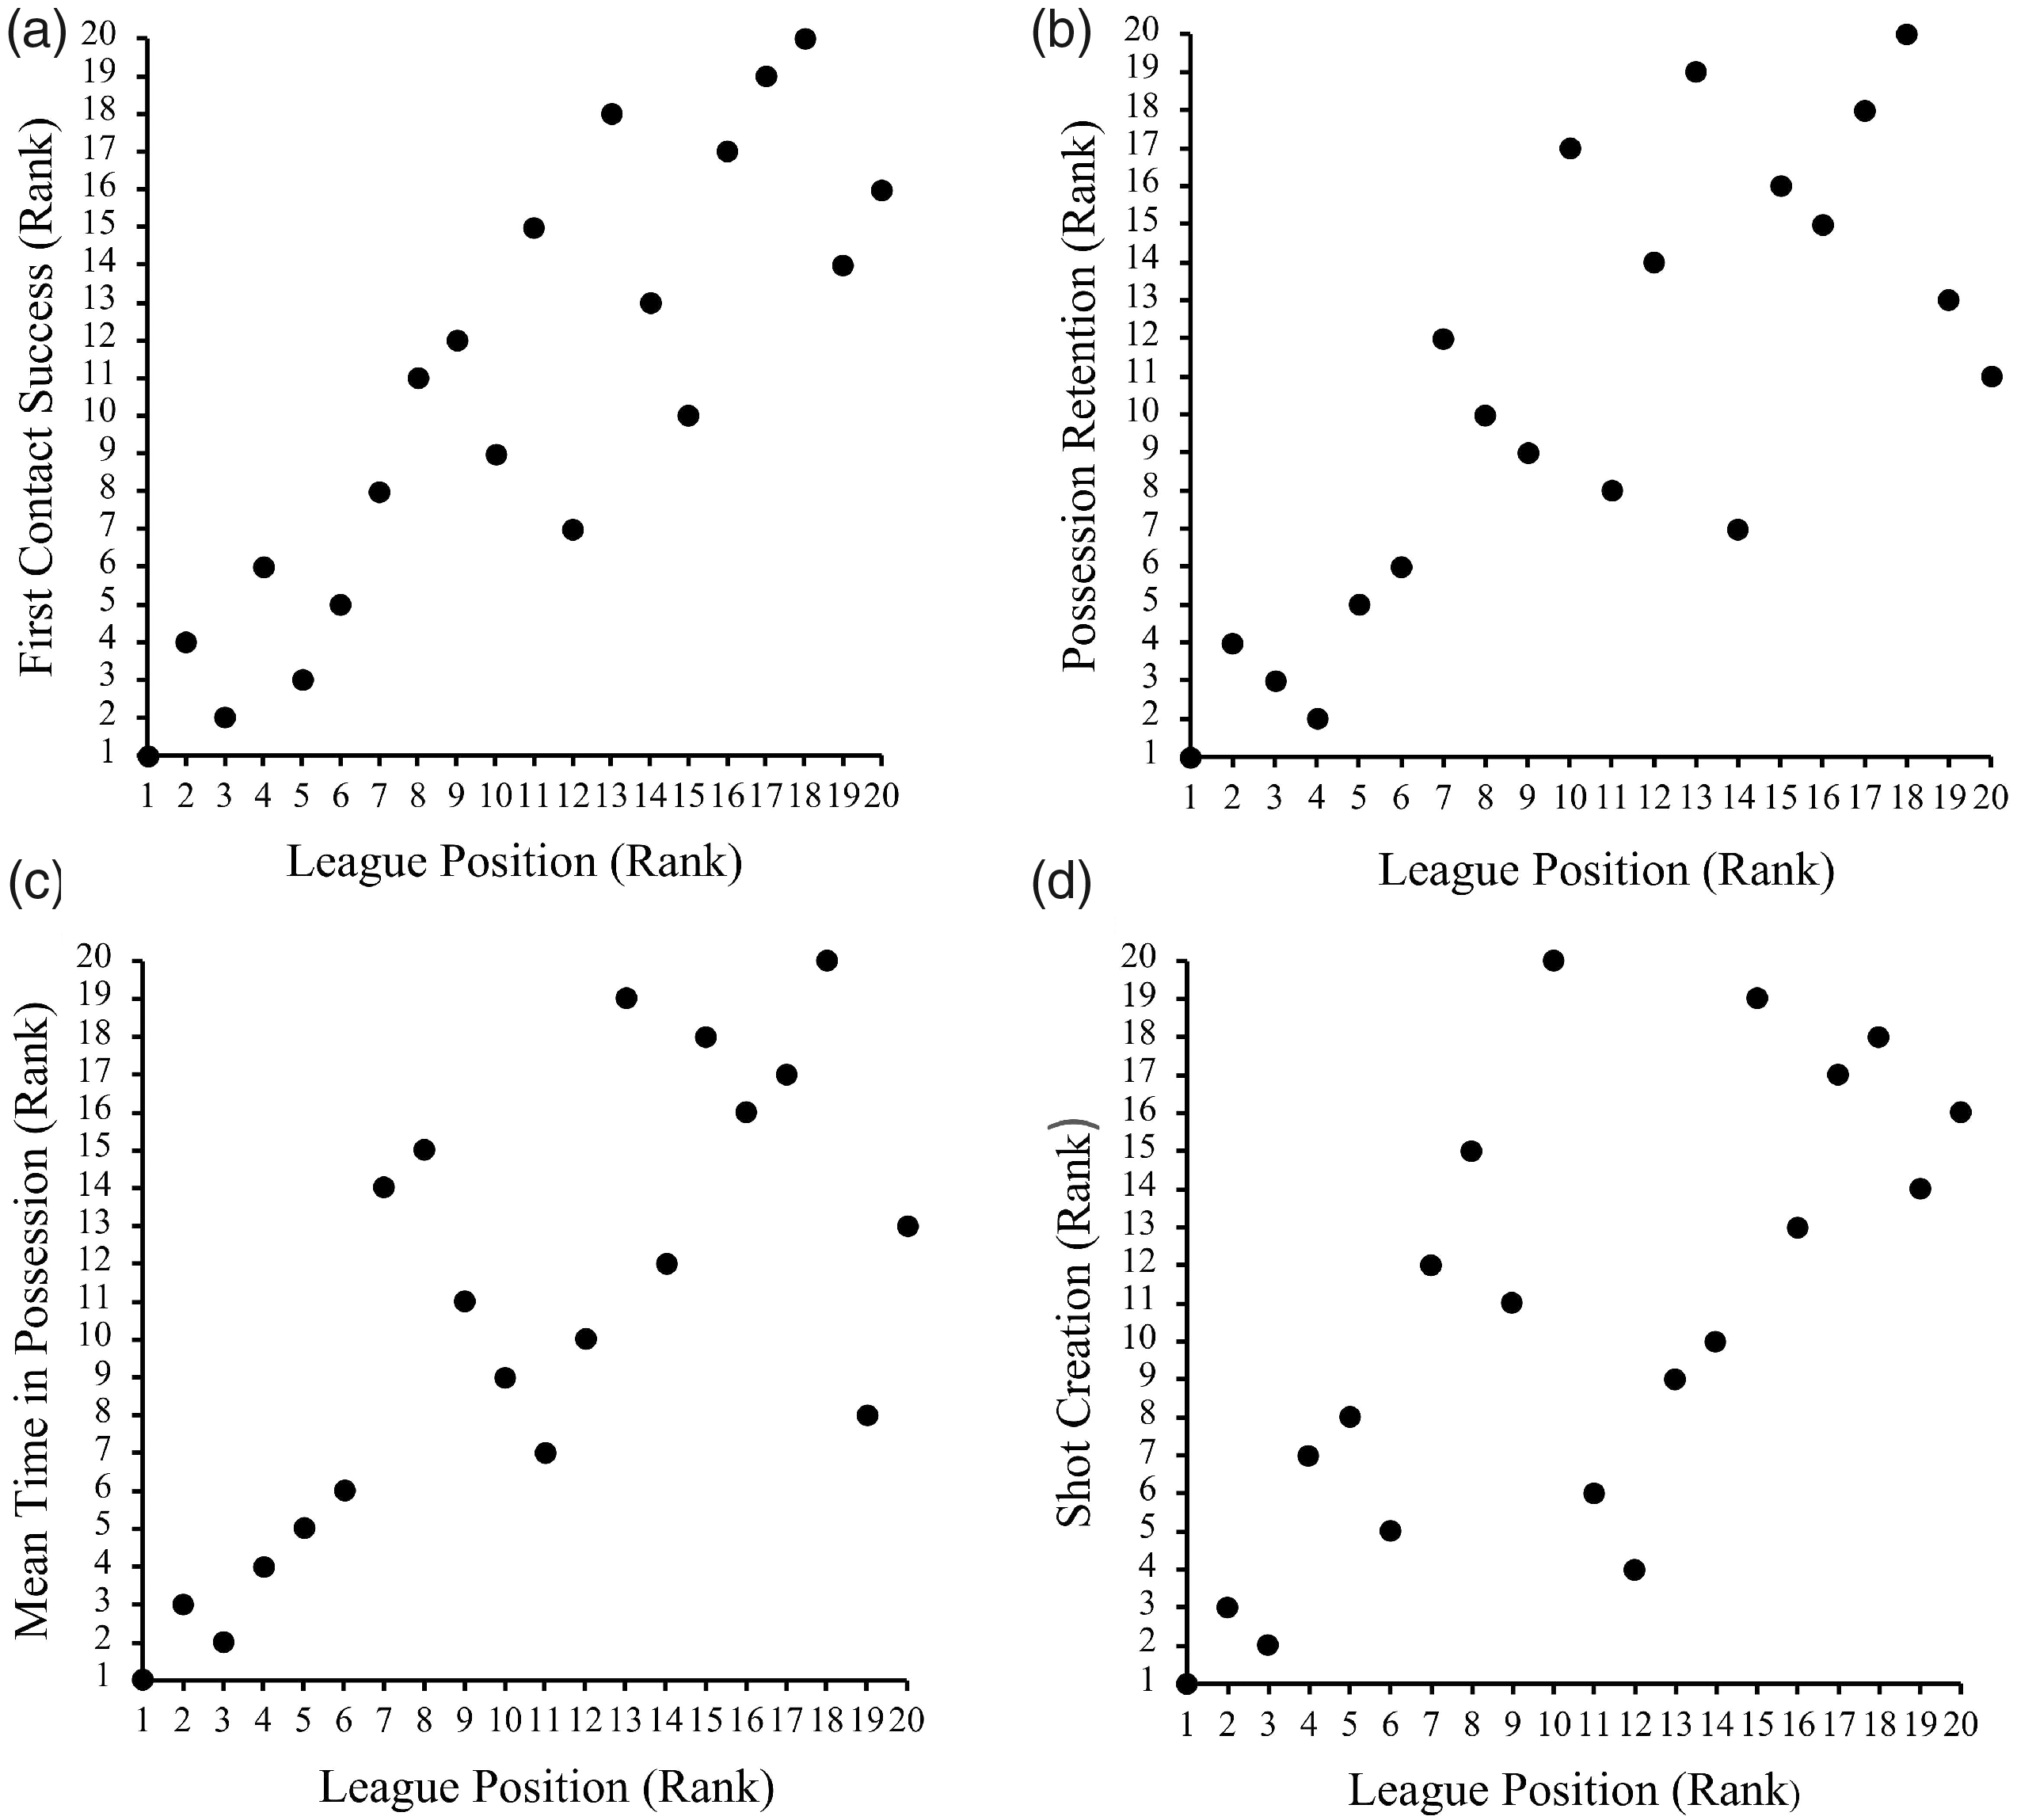
Correlations between final league position and first contact success (a), possession retention for 7 s (b), mean time in possession from the throw-in (c), and (d) throw-ins resulting in a shot from the possession achieved after a successful first contact.
Final league position was correlated with percentage of throw-ins performed backwards (rs (20) = −.662, p = 0.001), forwards (rs (20) = .767, p < 0.001) and lateral (rs (20) = −.474, p = 0.035) (Figure 3). Higher ranked teams performed more backwards throw-ins, whereas lower ranked teams favoured a forward direction. No relationship was shown between league position and lengths of throw-in (p > 0.05).
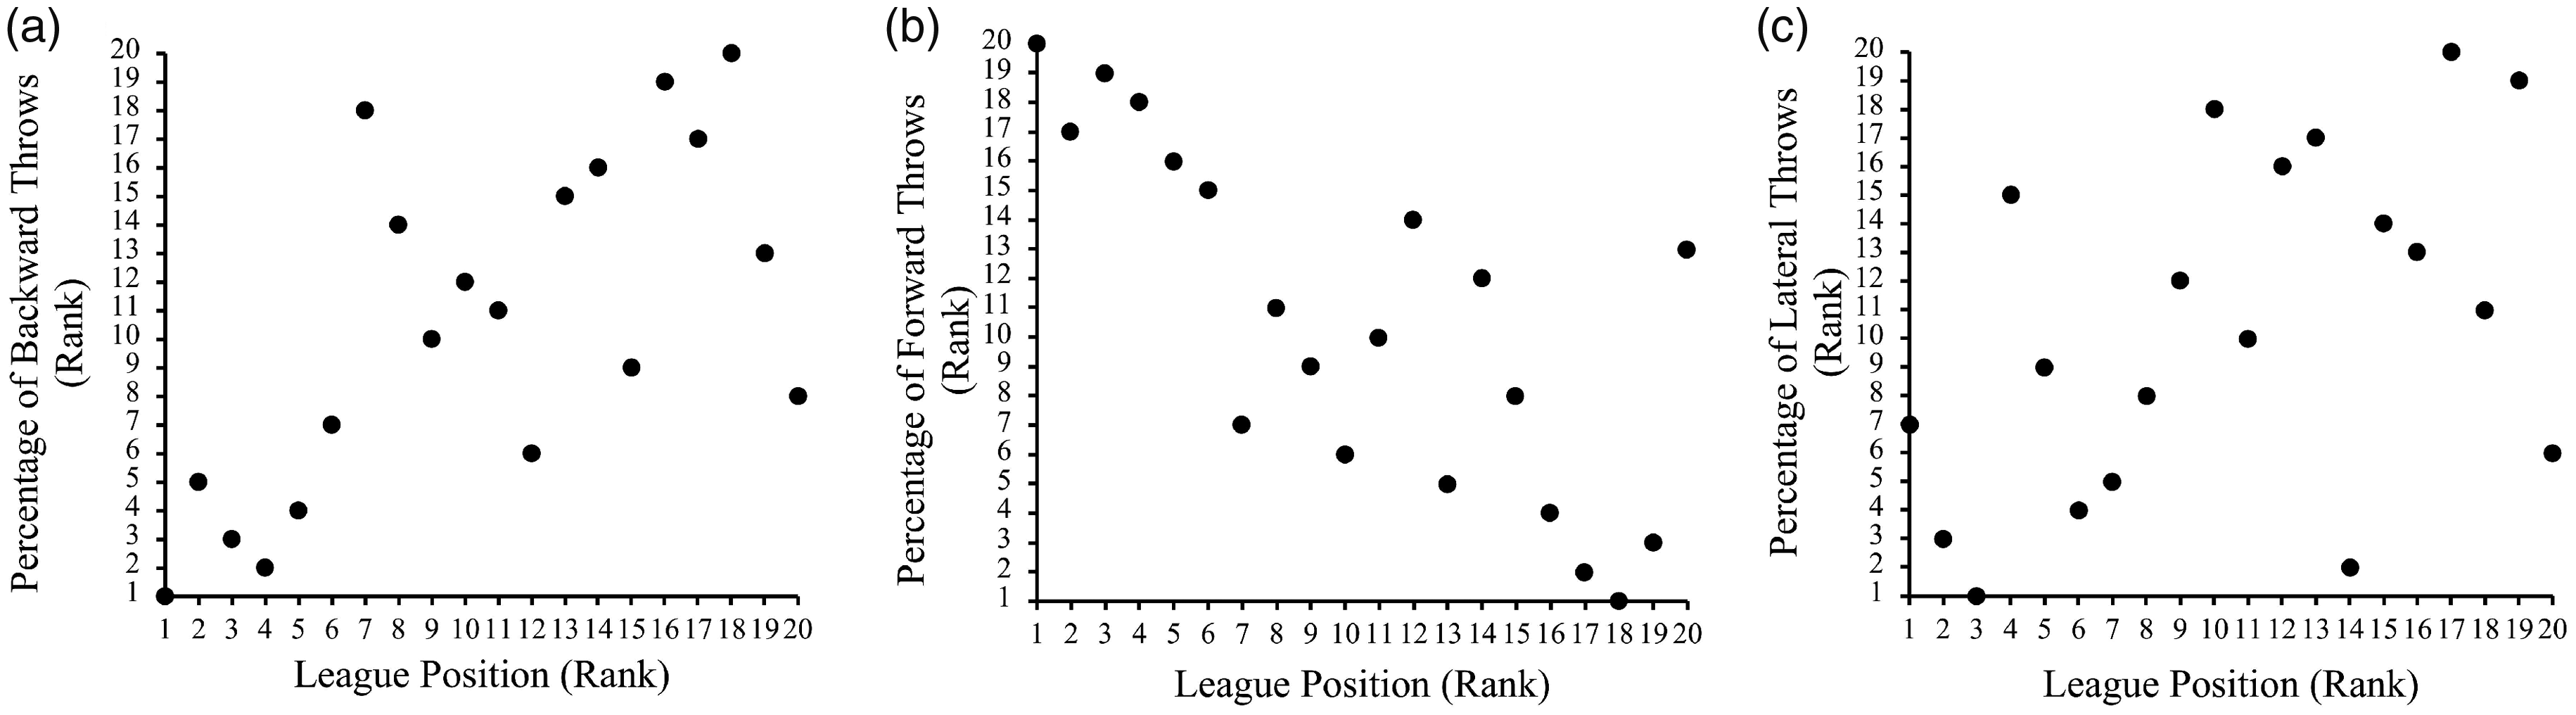
Correlations between final league position and percentage of throw-ins performed in the backwards (a), forwards (b) and lateral (c) direction.
First contact success
The three-way repeated measure ANOVA showed an interaction for direction * length * location for first contact success F(2.623, 49.830) = 20.773, p < 0.001, ηp2 = .522. There was also a two-way interaction for direction * length F(4, 76) = 125.534, p < 0.001, ηp2 =.869 and location * direction F(1.708, 32.452) = 38.617, p < 0.001, ηp 2 = .670 for first contact success. But location * length was not significant F(1.5, 28.504) = 1.964, p > 0.05, ηp2 = .094.
There was a main effects for direction F(1.6, 20.397) = 537.408, p < 0.001, ηp 2 = .966 and length F(1.599, 30.384) = 218.496, p > 0.001, ηp 2 = .920, but no main effect for location F(1, 19) = 2.562, p < 0.05, ηp 2 = .119. Post-hoc tests showed differences between all lengths (all p < 0.05) of the throw-in, with first contact success rate decreasing as throw-in length increased. Post-hoc tests showed a significant difference between the three direction (all p < 0.05) with throwing the ball backwards (99.5%) resulting in the highest first contact success rate with a 24.9% increase compared to throwing the ball forwards (74.6%). Hence, as Figure 4 demonstrates, when throwing backwards, length of throw-in did not affect success rates regardless of location. However, when throwing forwards, as the length increased, there was a reduction in success, with the lowest success rate being forwards and long in the rest of the defensive half.
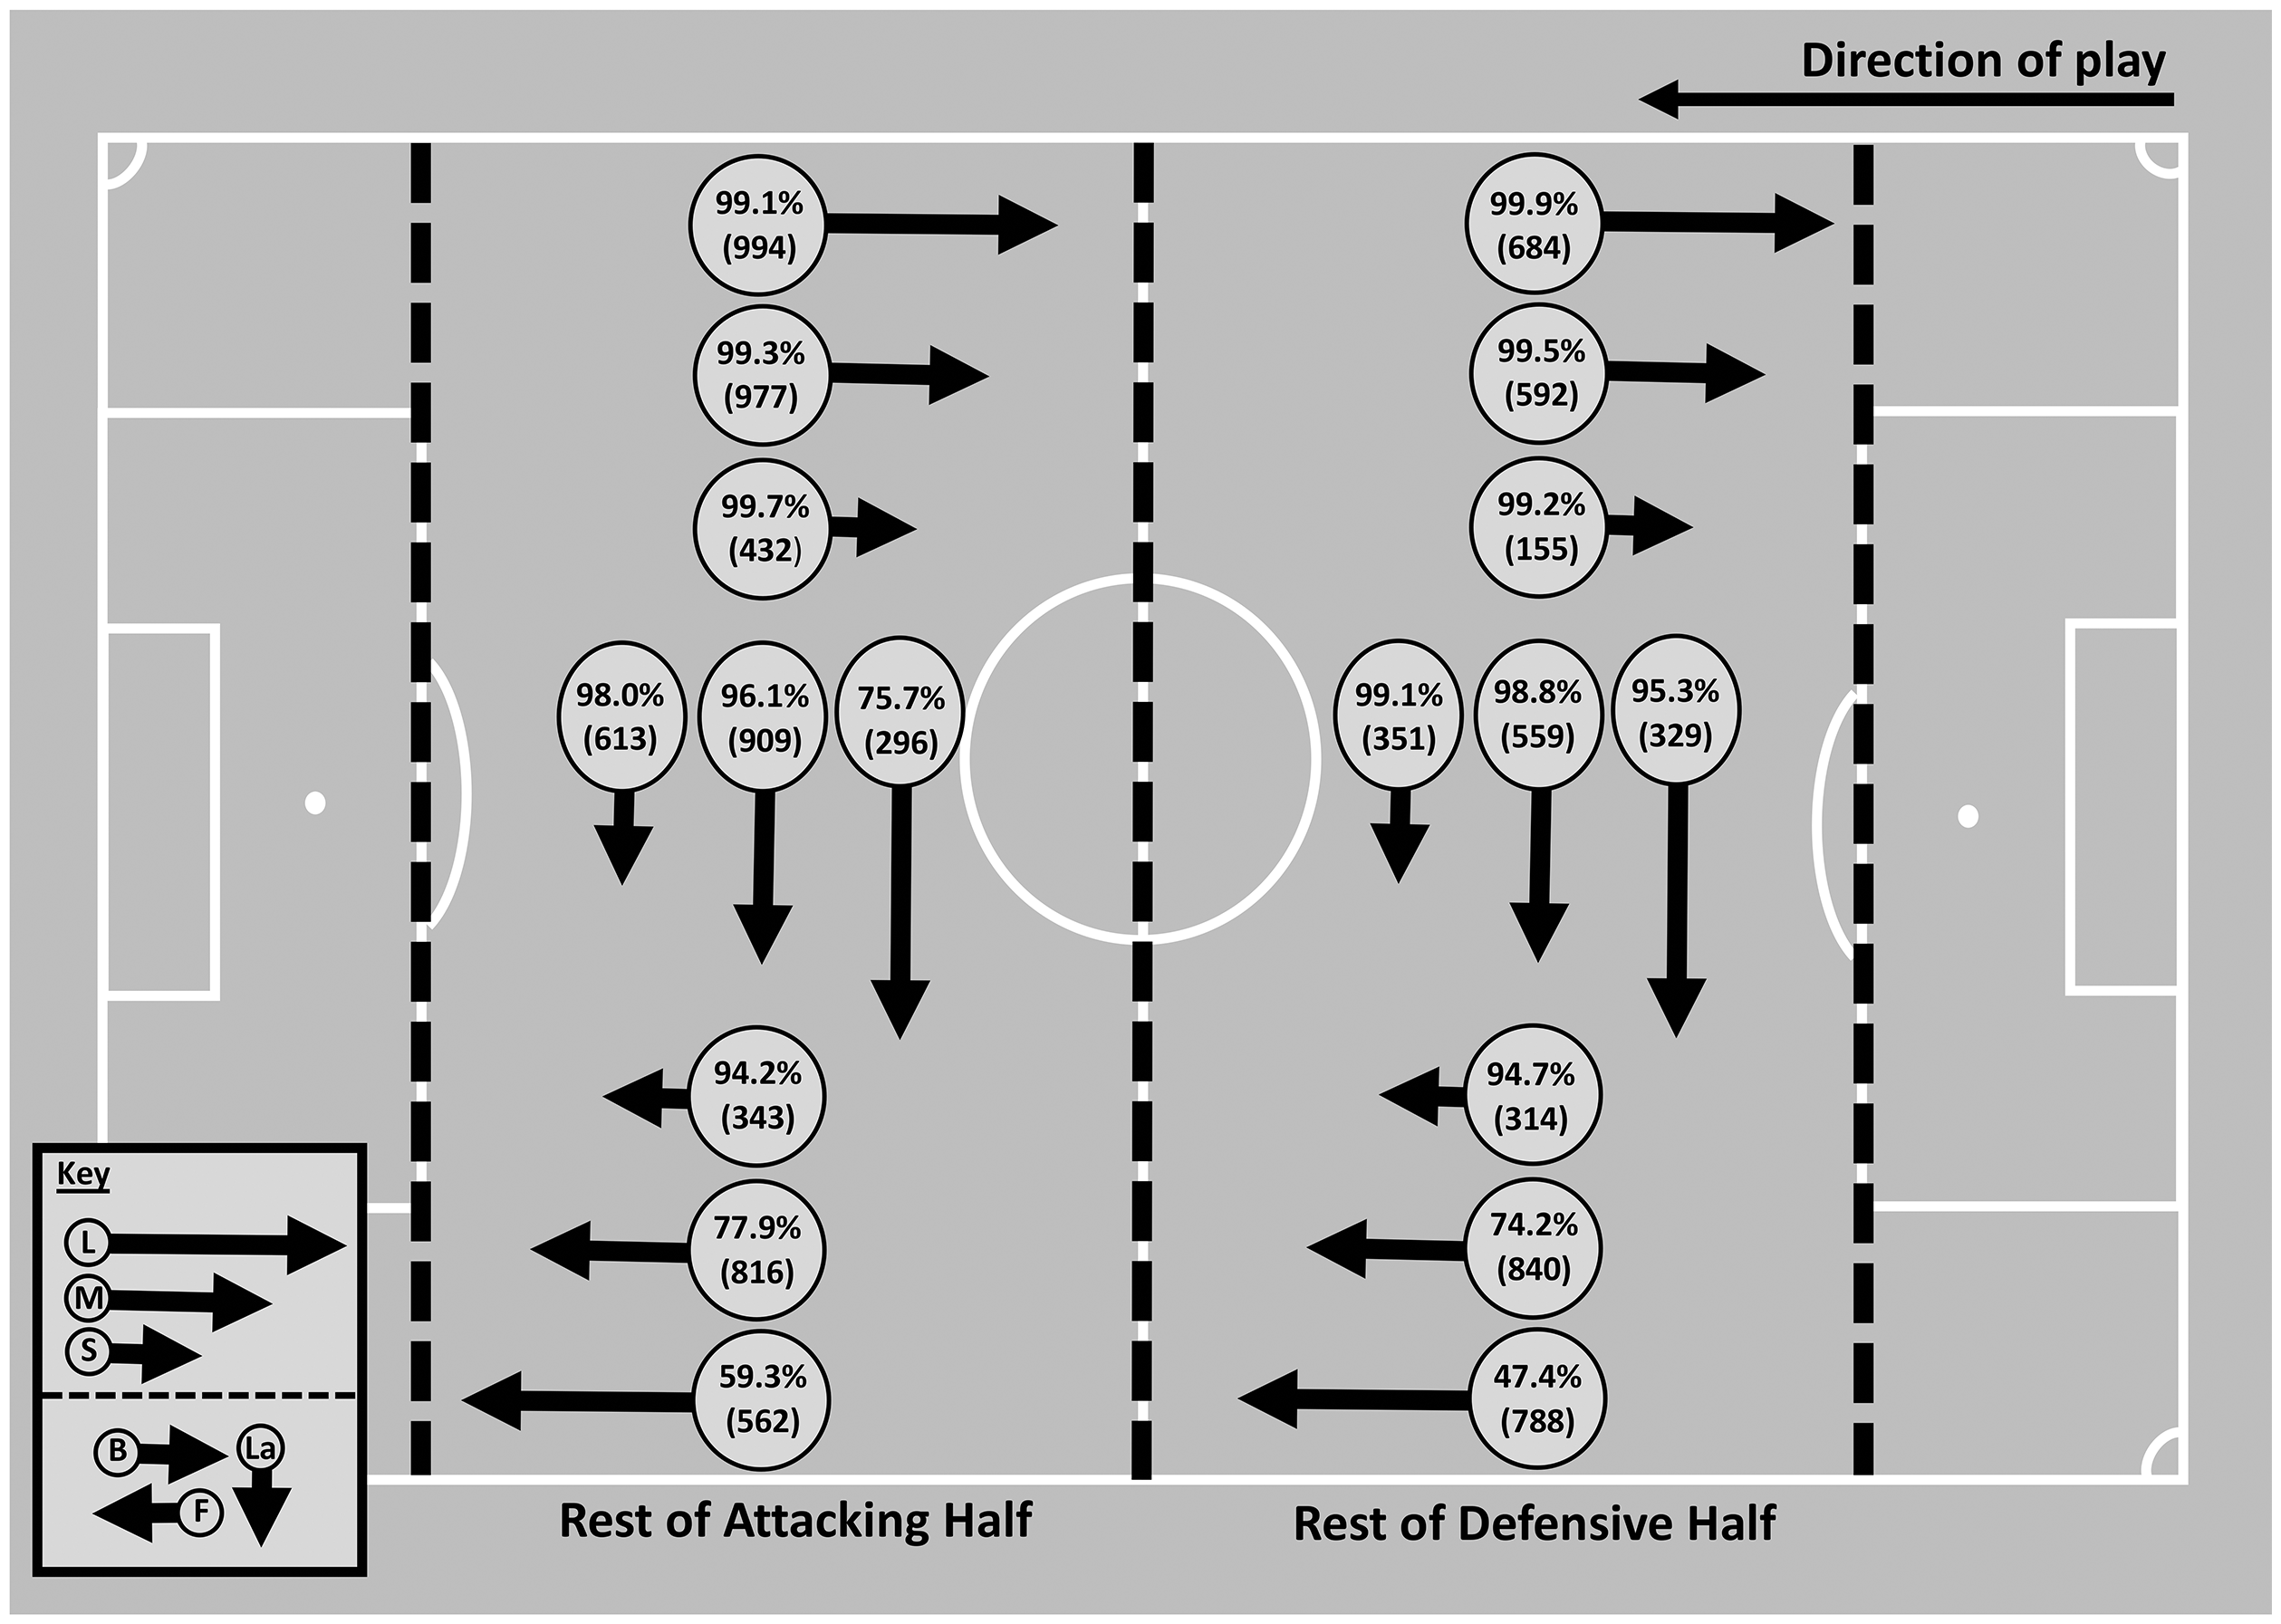
First contact success rate (percentage and absolute values) based on pitch location, throw-in direction and throw-in length.
Retaining possession from a throw-in
The three-way repeated measure ANOVA showed an interaction for direction * length * location for possession retention success F(2.647, 50.292) = 4.02, p < 0.05, ηp2 = .175 (see Figure 5). There was also a two-way interactions for possession retention for direction * length F(2.428, 46.130) = 21.365, p < 0.001, ηp 2 = .529 and location * direction F(2, 38) = 4.221, p < 0.05, ηp2 = .182. However, location * length was not significant F(2, 38) = 2.069, p > 0.05, ηp2 = .098.
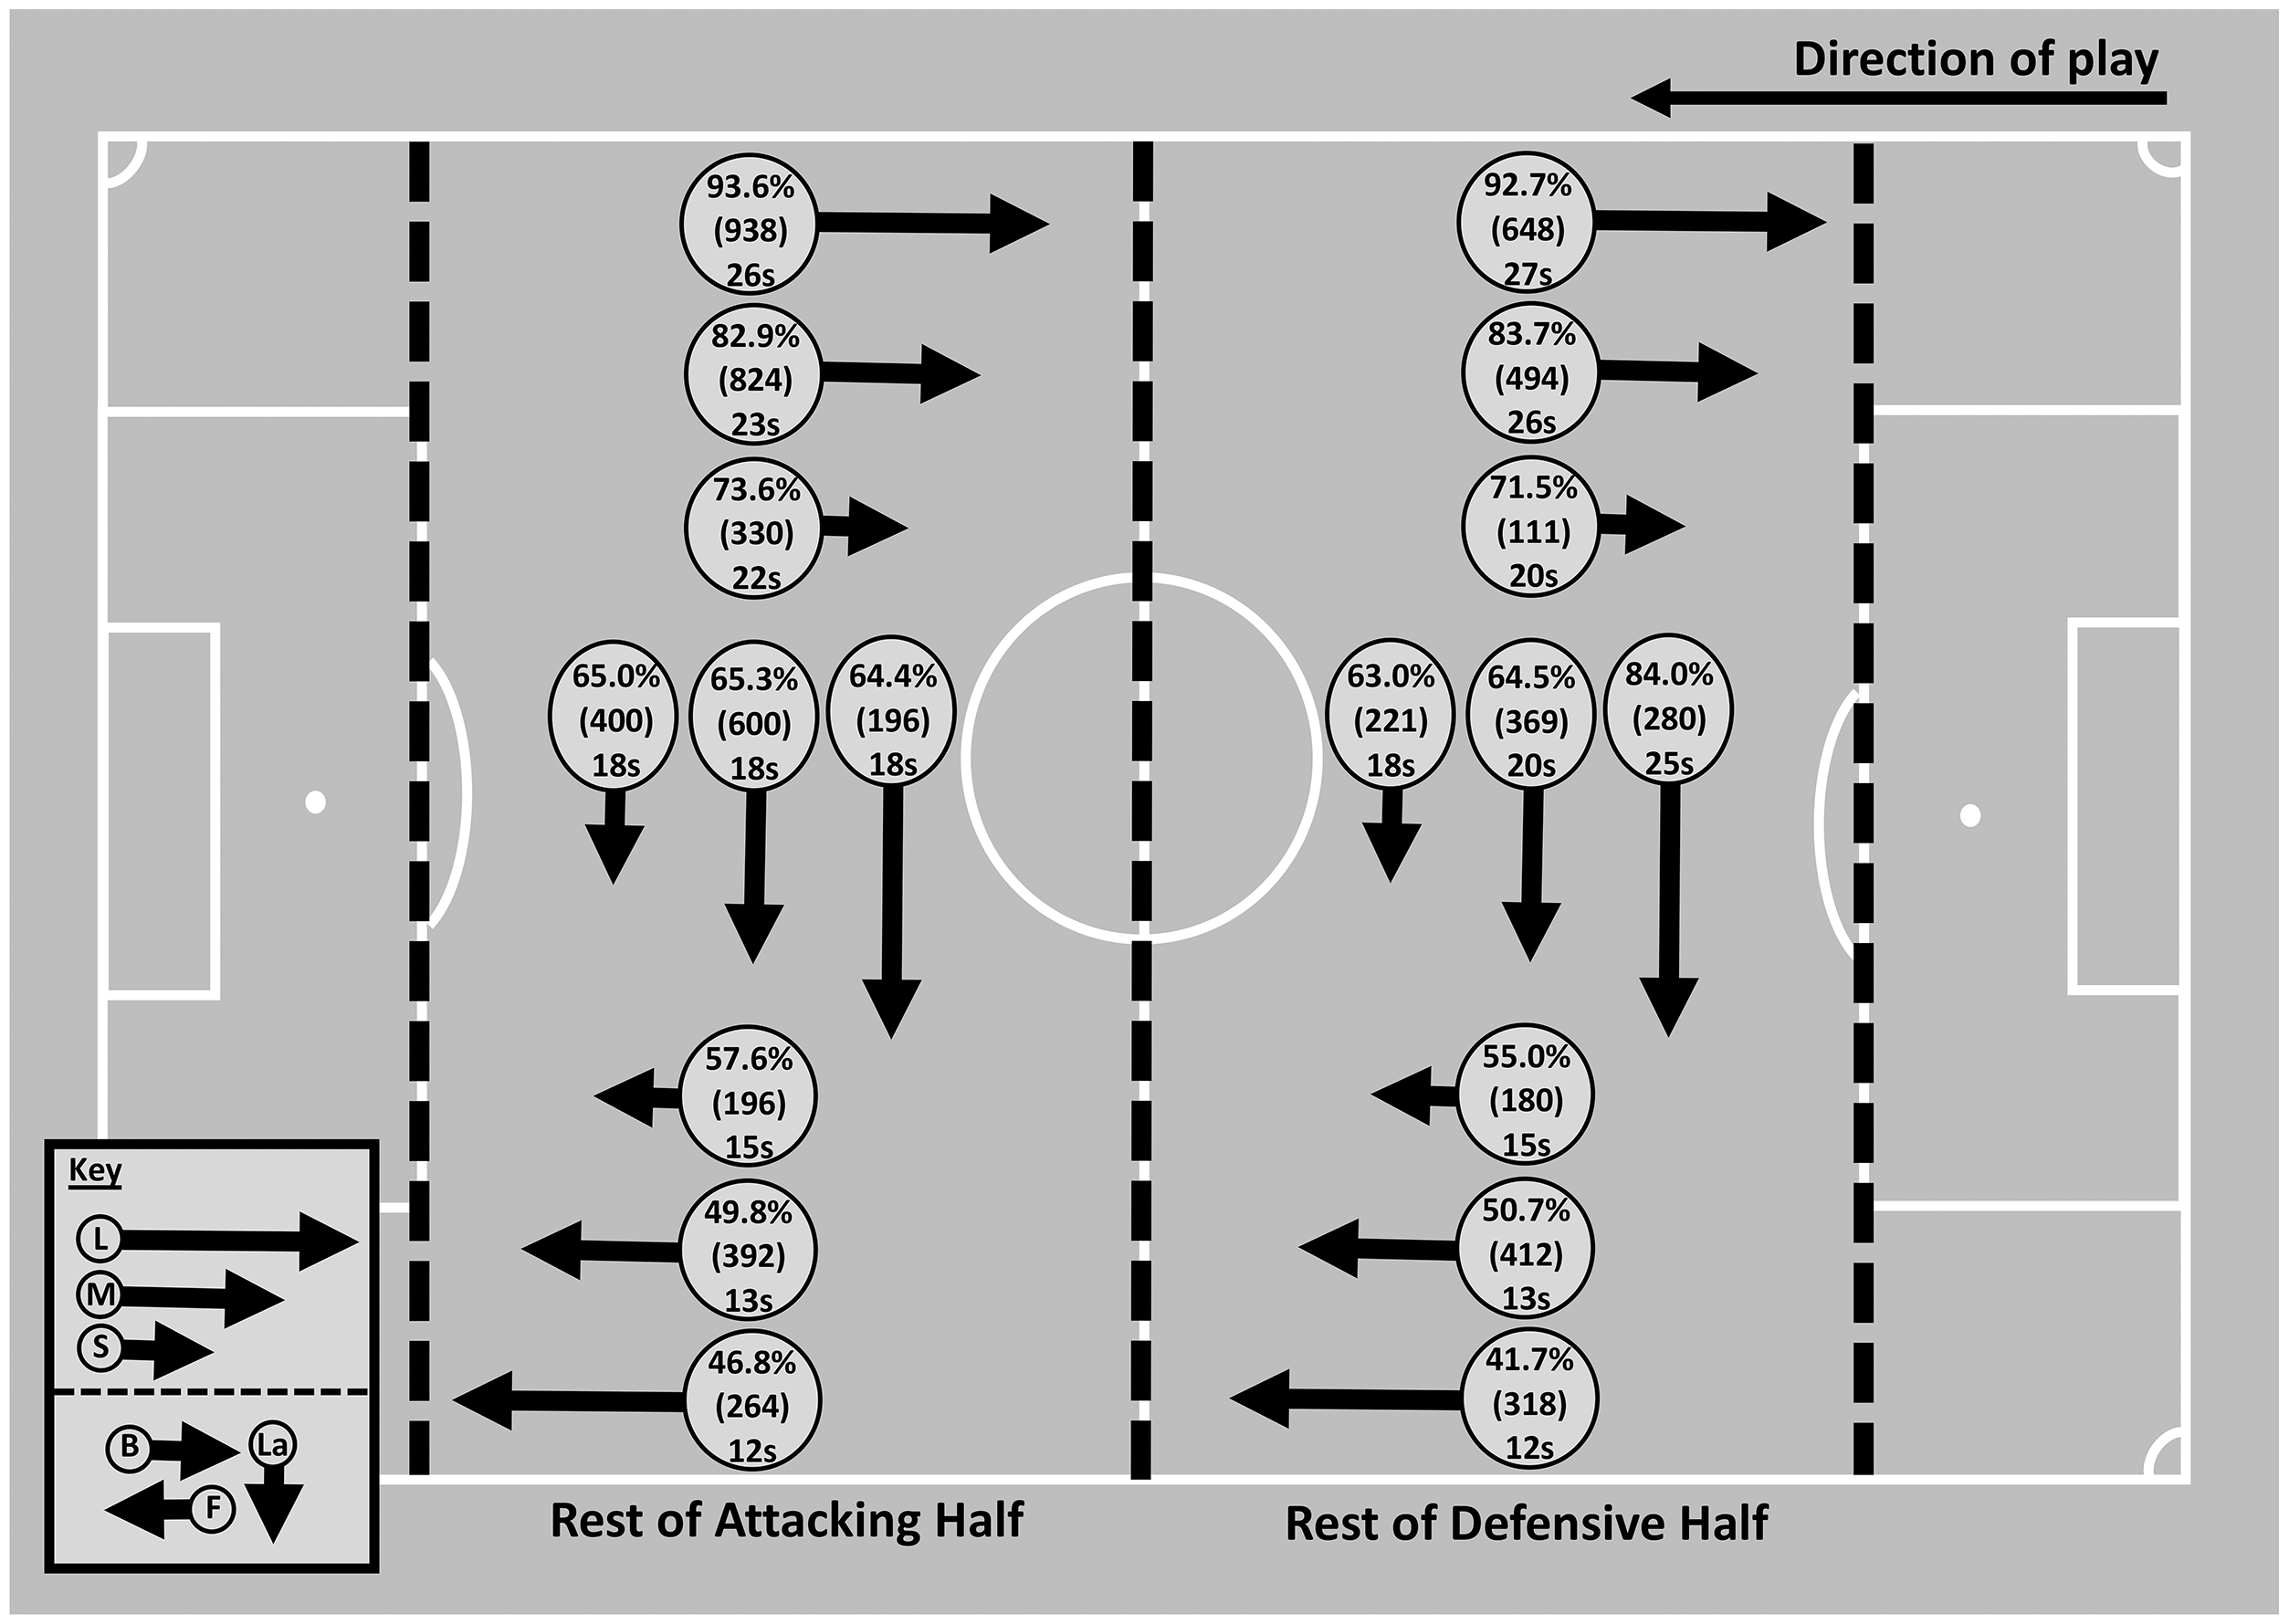
Possession retained success based on pitch location, throw-in direction and throw-in length. Percentage success, absolute values and mean time in possession.
There was a main effect for direction F(2, 38) = 309.484, p < 0.001, ηp2 = .942. Post-hoc tests showed a difference between the three direction (all p < 0.05) with throwing backwards (83.0%) having higher success rates than lateral (67.7%) and forwards (50.3%). There was also a main effect for length F(1.418, 26.934) = 9.90, p > 0.05, ηp2 = .343). Post-hoc tests showed a difference between Short (70.5%) compared to medium (66.2%) and long (64.3%) (p < 0.05). The main effect for location was not significant F(1, 19) = 0.406, p > 0.05, ηp2 = .021.
The three-way repeated measure ANOVA interaction for direction * length * location was non-significant for mean time in possession F(2.428, 46.139) = 2.72, p = 0.066, ηp2 = .125. However, there was an interaction for mean time in possession for direction * length F(2.013, 38.25) = 12.886, p < 0.001, ηp2 = .404, location * length F(2, 38) = 5.154, p < 0.05, ηp2 = .213, and location * direction F(2, 38) = 3.687, p < 0.05, ηp2 = .163.
There was a main effect for direction F(2, 38) = 257.798, p < 0.001, ηp2 = .931. Post hoc analysis showed throwing backwards (24 s) had a longer mean possession than forwards (13 s p < 0.001) or laterally (19 s p < 0.001). Laterally also had a longer mean time than forwards (p < 0.001). The main effect for length was significant F(2, 38) = 8.381, p > 0.05, ηp2 = .306. Post hoc analysis showed longer time for short (20.0 secs) compared to long (17.8 secs) (p < 0.005). There was also a main effect for location F(1, 19) = 6.861, p > 0.05, ηp2 = .265 with longer time in possession in the defensive half (19.4 secs) compared to the attacking half (18.4 sec).
Throw-in resulting in a shot
1053 throw-ins resulted in a shot originating from the rest of the attacking and defensive area of the pitch after a first contact was won. Based on all throw-ins taken in the rest of the attacking and defensive half, an interaction for direction * length for shot creation was shown F(4, 76) = 3.230, p = 0.029, ηp2 = .145. The main effect of direction affected shot creation F(2, 38) = 29.080, p < 0.001 ηp2 = .605. Post-hoc analysis showed backwards (11.2%) and lateral (12.2%) throws were more likely to produce shots than forwards throws (6.6%). The main effect for length was not significant F(2, 38) = 3.054, p < 0.05, ηp2 = .138.
Discussion
This research firstly examined if throw-in performance was correlated to final league position, and then how throw-in direction and length affected first contact success rate, possession retention, and shot creation during the English Premier league 2018-2019 season. On average 43 throw-ins were taken per match, meaning throw-ins occur more frequently than corner kicks, 6 free kicks7,8 and goal kicks 14 highlighting the influence throw-ins could have on professional soccer and a need for coaches to focus on this set piece. The importance throw-ins could have on performance was indicated via significant correlations with teams ranked highest in the final league position having increased first contact success, possession retention and shot creation. These correlations suggest either first contact success, possession retention and shot creation results in teams winning or drawing more matches (i.e. gaining more points to be ranked higher in the league), or higher ranked teams use more effective throw-in strategy resulting in greater success. To explore this further, initial data, suggested the differences in success rate were due to changes in throw-in strategy, with higher ranked teams utilising backwards and lateral throw-ins more often, in comparison to lower ranked teams favouring a forward throw-in.
To negate the effect increased skill level of higher ranked teams may have on throw-in outcome, we utilised a repeated measure design to examine how specific throw-in strategies influence success rates. From the 16,154 throw-ins, 83% of throws resulted in a successful first contact, 54% resulted in the team retaining possession for 7 seconds or longer, with a shot being achieved 8.8% of the time from throw-ins after a successful first contact. This is in line with previous data analysing throw-ins from the MSL. 11 The attention of throw-in analysis has typically focused on long throw-ins within the attacking 18-yard box due to similarities with corner kick set pieces. 16 However, the results here show 78.5% of throws come from the rest of the attacking and defensive areas of the pitch. This highlights the importance throw-ins have on restarting, and then building a team’s possession in open play and hence, we further explored these specific pitch locations in more detail.
When exploring the throw-in strategies used in the rest of the attacking and defensive areas a clear pattern of findings emerged. The data here empirically supports anecdotal evidence that a common strategy is to throw the ball forwards and long 15 with the most common direction of throw being forwards, at either medium (10–20 yards) or long (20+ yards) distances. However, the data suggested this throw-in strategy, although being the most common, is also the least effective at both achieving a successful first contact and retaining possession. As Siegle and Lames 14 suggested, the team not in ball possession frequently sees a throw-in in the defensive area as an opportunity to conquer the ball and create pressure. A possible explanation is when throwing the ball forwards, the opposition are set up in a compact shape, outnumbering the attacking team with defensive players. This results in a ‘fight ball’ being thrown down the line into an unfavourable situation and therefore in a loss of first contact and ball possession retention. Furthermore, when throwing forwards the aim might be for players to head/flick the ball onto a teammate, however, as Szczepański and McHale 22 demonstrate headed passes are less accurate and have a negative effect of the following pass, in comparison to those passed from the ground, hence might lead to a loss of possession. The results here, suggest the common coaching principle of throwing the ball forwards and long away from the goal in the defensive half is an ineffective tactic.
In comparison when throwing backwards or laterally, the length of the throw did not affect first contact success rate. Results here demonstrate one way to relieve pressure in the rest of the defensive half is to throw the ball long backwards with a 99.9% first contact success rate, this is over double the success rate compared to throwing long and forwards (47.4%). A key element after a successful first contact, is the team’s ability to retain possession within the central areas of the pitch. This allows them to build either a successful attack or negate conceding possession and defending a fast counter attacking situation from the opposition. 1 In line with first contacts, throwing the ball backwards had the highest association with retaining possession. In the rest of the defensive half throw-ins that went backwards or laterally had the greatest success at retaining possession when thrown long and decreased from medium to short length. Furthermore, examining the length of possession (of those throws with possession retained for a minimum of 7 seconds) shows mean time in possession was longest when throwing backwards (24 s) compared to forwards (13 s). It’s suggested when throwing backwards or laterally, compared to throwing forwards, teams may not apply pressure high up the pitch allowing the receiver to secure possession with time and space to build an effective attack. From an opposition perspective, this highlights the importance of applying pressure high up the pitch, preventing the backwards or lateral throw-in. Therefore, reducing the likelihood of longer possessions and increasing the rate of turnovers from a forward ‘fight ball’ throw-in.
In the rest of the attacking half, when throwing backwards, the length of throw did not affect first contacts. Laterally, when throwing long, there was a reduction in success rate. When throwing forwards, there was a reduction in success from (94.2%) a short length, compared to (59.3%) a long length. Hence, if teams want to increase their chance of achieving a successful first contact, they should throw backwards, or laterally, not forwards in the rest of the attacking half. After first contact success, in the rest of the attacking half, there was also a significant association between the combined direction and length of throw on retaining possession. Throw-ins that went backwards had the greatest success when thrown longer, however, length did not affect possession retained rates when throw-ins went laterally. Forward throw-ins again had the lowest success rates and decreased as the throw-in length increased. There was also significant interaction of mean time in possession for direction and length. The direction showed throwing backwards (24 s) had a longer mean possession than forwards (13 s) or laterally (18 s). With both first contact success and retaining of possession demonstrating clear advantages for throwing backwards or laterally, finally it was explored if these possessions resulted in more successful outcomes (i.e. shots being created).
When examining shot creation, after a successful first contact, throw-ins which went backwards or laterally had more chance of creating shots than throwing forwards. This provides further evidence to emphasise the importance of teams needing to show the composure to throw backwards and go against the common coached principles of throwing forwards down the line towards the opposition’s half. Therefore, increasing both their time in possession but also a chance of creating a shot. From a defensive perspective, the common coached strategy has been to drop off and allow the opposition to throw the ball backwards or laterally to a position which is perceived to be a less threatening area away from their own goal. However, with the finding’s presented here, coaches should examine their own strategy to consider if a different defensive strategy might be more effective. One possible approach could look to force the opposition into throwing the ball long and forwards which may result in regaining possession quicker allowing a counterattack while also potentially conceding less shooting opportunities.
The findings here provide a starting point to support the importance of coaches focusing on the use of throw-in strategy to increase possession and chance creations within professional soccer. However, with limited published data, and one season’s data examined here, the findings should be interpreted with caution and there are many future areas of research that should be examined to explore if similar patterns emerge. Further comparison within and between soccer leagues will enable a greater understanding on the importance throw-ins have on team performance. Furthermore, with backwards and lateral throw-ins appearing to show an advantageous tactic in this data set, further exploration to explain why throwing in these directions has greater success rates should be explored in more detail. For example, lower ranked teams may be willing to concede possession against a higher ranked team, so they remain in a compact defensive shape and do not overcommit players with their set up on the throw-in. Hence, further evaluation on what constitutes a successful throw-in needs investigating. Finally, investigating if score line, or individual match outcome is influenced by throw-in strategy will aid future coaching practice.
Conclusion
In conclusion, results here suggest throw-in success may be associated with final league performance. This data highlights to coaches how throw-in tactics might affect first contact success rates, possession retention and shot creation in professional soccer. Findings demonstrate, throwing the ball laterally or backwards can increase throw-in success rates in comparison to throwing the ball forwards. Furthermore, higher ranked teams utilised this strategy more often and coaches could examine their current throw-in strategies to see if implementing changes may link to an overall improved team performance.
Footnotes
Acknowledgements
The authors would like to thank Dougie Wright for his help during the collection of the raw data presented within this manuscript.
Data availability statement
The datasets generated during and/or analysed during the current study are not publicly available but are available from the corresponding author on reasonable request.
Declaration of conflicting interests
The author(s) declared no potential conflicts of interest with respect to the research, authorship, and/or publication of this article.
Funding
The author(s) received no financial support for the research, authorship, and/or publication of this article.