
Abstract
This study evaluated the validity and within-device reliability of the Metric smartphone application compared to a linear position transducer (LPT). Twenty-five resistance-trained participants (19 male, 6 female) completed incremental loading one-repetition maximum (1RM) assessments in the back squat, bench press, and deadlift. Mean concentric velocity (MCV) and displacement (CD) were measured simultaneously by two Metric devices and one GymAware LPT. The Metric application detected 94.3% of repetitions (F1-score: 0.971) compared to GymAware's 99.5% (F1-score: 0.997). Within-device reliability of Metric varied by exercise: highest in squat (MCV: ICC = 0.994, CV = 3.83%, SDC = 0.05 m/s [4.27% of 1RM]; CD: ICC = 0.991, CV = 1.53%, SDC = 0.02 m), then bench press (MCV: ICC = 0.981, CV = 7.57%, SDC = 0.08 m/s [6.38% of 1RM]; CD: ICC = 0.974, CV = 3.53%, SDC = 0.02 m), and lowest in deadlift (MCV: ICC = 0.941, CV = 13.29%, SDC = 0.13 m/s [14.05% of 1RM]; CD: ICC = 0.753, CV = 27.16%, SDC = 0.10 m). However, Metric did not meet our predetermined reliability criteria for velocity trackers (ICC ≥ 0.997, CV ≤ 3.5%). Substantial-to-perfect agreement between Metric and GymAware was found for squat MCV (CCC = 0.981–0.993), but only poor-to-moderate agreement for bench press and deadlift MCV (CCC = 0.866–0.946), and poor agreement across all exercises for CD (CCC < 0.768). While Metric offers a cost-effective and user-friendly alternative to LPTs, it cannot currently be recommended for research or practice where high precision is required.
Keywords
Introduction
In resistance training, strength and conditioning (S&C) coaches prescribe and manipulate key training variables, including volume, 1 relative load, 2 and proximity-to-failure, 3 among others to elicit specific adaptations in athletes. Traditionally, these variables have been adjusted through pre-planned models, often based on preceding maximal strength tests, to optimise performance at a specific phase of training.4,5 However, pre-planned, percentage-based training does not necessarily account for individual progression rates, daily fluctuations in performance, or interindividual variability in the number of repetitions performed to failure at a given relative load and specific exercise.5,6
Velocity-based training (VBT) has become increasingly popular for monitoring acute changes in neuromuscular performance, 7 allowing for high-frequency estimations of performance at low time and fatigue cost,8,9 as well as prescribing and autoregulating training variables like relative-load, proximity-to-failure and volume. 10 However, to effectively use VBT, valid and reliable velocity measures are essential. Linear position transducers (LPT) are a valid and reliable tool, 11 but come at higher financial investment. These higher costs, in combination with user-friendliness, are an important consideration for S&C coaches. 10 As such, there is a high demand for velocity trackers that are valid, reliable, user-friendly, and available at a lower price. One such application is Metric (formerly MetricVBT), a smartphone application that utilises computer vision to identify and track barbell position using the phone's onboard camera, providing two-dimensional (2D) real-time tracking of mean concentric velocity (MCV) and concentric displacement (CD). While previous studies suggest less-than-desirable validity relative to 3D motion capture12–14 (based on the strict requirements of velocity trackers 15 ), Metric may still be useful for tracking changes in neuromuscular performance if sufficiently reliable.
To date, two studies have explored the reliability of the Metric application.12,16 Both assessed test-retest reliability, a process inherently subject to inflated measurement noise due to biological variation.17,18 These studies yielded less-than-promising results (MCV: intraclass correlation [ICC] = 0.79–0.98, coefficient of variation [CV] = 3.91–30.0%; CD: ICC = 0.67–0.98, CV = 3.07–11.1%). Taber et al. 12 instructed participants to follow a specific movement tempo for slow repetitions; however, no details were provided on how this was standardised. As a result, these findings may be influenced by increased error associated with the Metric application. This error could arise not only from technological noise—where small fluctuations in barbell position (e.g., sensor noise, vibrations, bar play) represent a larger proportion of the total MCV—and from biological variation in neuromuscular performance, but also from the difficulty of maintaining a consistent movement tempo without guidance. Indeed, lower reliability was found for the purposely slow repetitions. 12 Notably, Šagovac and Baković 16 reported better test–retest reliability when repetitions were performed with maximal intended velocity across three loads. However, their study only included bench press three relative loads (45%, 60%, and 75% one-repetition maximum [1RM]), with lower reliability observed at 45% of 1RM. This contradiction highlights the need for further research to address these inconsistencies by examining the reliability and validity of the Metric application for both MCV and CD across a broader range of loads and multiple exercises, using a design that minimises the influence of biological variability and isolates device-related measurement noise, in line with previous work.15,19 Accordingly, the purpose of this study was to investigate the validity and within-device reliability of the Metric application relative to an LPT, using a design that deliberately minimised biological variability and isolated measurement noise across multiple exercises and relative loads.
Materials and methods
Sample size justification
Two sample size estimations were performed to determine the number of participants required to achieve a desired confidence interval (CI) width of 0.05 around the expected ICC between two raters (i.e., devices). Calculations were based on a custom Shiny application for ICC sample size estimation (https://dipro.shinyapps.io/sample-size-icc/).
20
The best-case scenario assumed Metric met the stringent reliability threshold recommended by others
15
(ICC = 0.99), while the worst-case scenario used an ICC of 0.95, reflecting the average test-retest reliability estimates for Metric MCV during maximal-effort lifts.12,16 These scenarios yielded initial sample size estimates of 22–33 and 59–70 participants, respectively. However, these estimates assumed a single observation per participant.
20
Since our design included ≥15 repeated repetitions per participant, we adjusted the sample size using the Spearman–Brown prophecy formula
21
to account for the increased precision conferred by repeated measures. First, we computed the required single-measure ICC to yield a desired composite ICC (ICCtarget) across 15 trials (k):

Next, this ICCsingle was used to adjust the original sample size estimate using:

Applying this correction to the upper bounds of the original estimates (n = 33 and n = 70) resulted in adjusted sample size requirements of 24 and 42 participants, respectively. These adjustments ensured sufficient precision to estimate an ICC between 0.95 and 0.99 under our repeated-measures design. Therefore, a recruitment target of 24–42 participants was set, subject to resource constraints related to the primary researcher's dissertation timeline. 22
Participants
To be included, participants had to: i) be 18–60 years old, ii) be free of disease or injury that would interfere with the study protocol, iii) participate in regular resistance training, and iv) be able to achieve at least a 1.25 × body mass (BM), 1.0× BM, and 1.5× BM 1RM in the back squat, bench press, and deadlift, respectively, for males, and 1.00× BM, 0.75× BM, and 1.25× BM for females. Ultimately, 25 participants (19 males, 6 females; age = 26.2 ± 6.4 years; BM = 85.2 ± 14.0 kg; 1RM back squat = 148.0 ± 35.0 kg [1.74 ± 0.30 kg/BM]; 1RM bench press = 102.0 ± 24.2 kg [1.19 ± 0.19 kg/BM]; 1RM deadlift = 166.0 ± 33.5 kg [1.96 ± 0.31 kg/BM]) completed data collection. Prior to data collection, participants were informed of the study procedures, given the opportunity to ask clarifying questions, and provided informed consent. This study was approved by the Auckland University of Technology Ethics Committee (AUTEC no. 24/139).
Incremental loading assessments
Participants reported to our facility once, where incremental loading tests were performed in the back squat, bench press, and deadlift, in that order. Prior to testing, participants provided their estimated 1RM (e1RM) based on their training over the previous six months to calculate the percentage-based loading protocols.
A standardised full-body dynamic warm-up was performed, as described elsewhere. 23 Participants then performed each exercise (back squat, bench press, or deadlift) with the empty barbell (20 kg) using correct technique (see below). All repetitions were performed with a self-determined controlled eccentric tempo and maximal intended concentric velocity. To familiarise participants to lifting with maximal intent, up to three sets of five repetitions with the barbell were performed, during which participants aimed for either consistent (±0.03 m/s) or gradually declining repetition MCVs, assessed using the GymAware LPT. Given the aim of our study, neither intent of maximal concentric velocity nor familiarisation were strictly required. However, by emphasising maximal intent, we aimed to enhance the contrast in MCV across the load spectrum.
The incremental loading test consisted of five sets at 45%, 55%, 65%, 75%, and 85% of e1RM, followed by a 1RM assessment. Load was then increased by 2.5–10 kg per attempt until 1RM was established, in accordance with others. 24 Load selection was determined by the researcher, guided by measured MCV and participants’ ratings of perceived exertion based on their repetitions in reserve. 24 Three, two, and one repetition(s) were performed per set for loads below 60%, between 60% and 80%, and above 80% of e1RM, respectively.
For back squat, participants started in the upright position using their preferred stance and barbell placement. They then lowered themselves until the tops of their thighs were parallel to the floor or deeper. Without pausing in the bottom position, they returned to the starting position. In the bench press, participants lowered the barbell to the chest using their preferred grip before pressing it to full elbow extension, while maintaining contact with the flat bench at the upper back and buttocks. During the deadlift, participants lifted the barbell from the floor to a fully erect position with extended hips and knees, with their feet shoulder-width apart. Inter-set rest periods were three minutes for sets below 80% of e1RM and five minutes for sets above 80% of e1RM. 25 A 10-min rest period was provided between exercises. One spotter and safety pins were present during all back squat and bench press attempts for safety reasons, without obstructing the camera view.
Data collection
To assess validity, the Metric application (v4.8.1; Core Advantage Pty Ltd, Oakleigh, Australia) was compared to the GymAware LPT (GymAware, Braddon, Australia), as GymAware has previously been established as a device with high agreement with 3D motion capture (ICC = 0.966 [0.958, 0.973]) 26 and within-device reliability (ICC = 0.995 [0.995, 0.995], CV = 3.36% [3.29, 3.43%]). 19 Within-device reliability of the Metric application was assessed by comparing measurements obtained from two separate iPhone devices (iPhone 11 and iPhone 13 mini, both running iOS 17.7; Apple Inc, Cupertino, California, USA). Consultation with Core Advantage Pty Ltd clarified that, as long as both devices were running the same iOS and application versions, differences in hardware should not affect measurement results.
All devices measured the lifter's left-hand side to ensure that possible side-to-side asymmetries in barbell movement did not affect results. The GymAware tether was attached to the inside of the left barbell collar, while the iPhone devices were mounted side by side on a dual tripod. The tripod was positioned 2.0 metres away from, and directly perpendicular to the end of the weight plates at a height of 1.17 m for back squat and 0.87 m for both bench press and deadlift. This setup ensured that both the lifter and weight plates remained within the frame throughout the entire movement and that the camera was positioned above hip height for the back squat, in accordance with manufacturer guidelines. 27 The iPhone camera lenses were placed 5.5 cm and 6.0 cm from the middle and top of the tripod, respectively, with the middle of the tripod aligned perpendicular to the weight plates to ensure both iPhone camera lenses were at a similar angle. 13 Recordings were captured in a vertical orientation.
Data collection took place in a well-lit laboratory, where windows were covered with blackout curtains to prevent glare from interfering with recordings. Testing was conducted using a 20 kg power bar (Rogue, Ohio, USA) in a custom-built squat rack, with metal plates (Viking, Wellington, New Zealand) for squat and bench press, and bumper plates (Eleiko, Halmstad, Sweden) used for deadlift. For loads below 40 kg in back squat and bench press, custom plate diameters were manually input into the Metric application, as recommended. The plate diameters in our laboratory were 0.16 m, 0.19 m, 0.23 m, 0.33 m, and 0.40 m for the 1.25 kg, 2.5 kg, 5 kg, 10 kg, and 15 kg plates, respectively. Phantom/error repetitions were manually recorded in Microsoft Excel (Microsoft, Washington, USA).
Statistical analysis
All statistical analyses were performed in R 28 using boot, 29 psych, 30 epiR, 31 moments, 32 car, 33 performance, 34 and lme4 35 packages. Data normality was assessed using Shapiro-Wilk test and homoscedasticity using Levene's test, alongside measures of skewness and kurtosis. Most variables exhibited heteroscedasticity and non-normal, platykurtic (MCV data) or normal-to-leptokurtic (CD data) distributions with a negative skew (Appendices). Given these violations of parametric assumptions, statistical inference for all parameters was conducted using a bootstrap with 10,000 resamples, with results reported as medians and 95% bias-corrected and accelerated confidence intervals (CI). 36
Detection accuracy
Repetition detection accuracy was evaluated for both Metric and GymAware devices, using actual performed repetitions as the ground truth. For each device, true positives (TP; detected repetitions that were performed), false positives (FP; detected repetitions that were not performed), false negatives (FN; missed repetitions that were performed), and true negatives (TN; no detection when no repetition occurred) were determined. Based on these values, we calculated precision (positive predictive value: TP/(TP + FP)), recall (sensitivity: TP/(TP + FN)), F1-score [2 × (Precision × Recall)/(Precision + Recall)], and accuracy [(TP + TN)/(TP + TN + FP + FN)]. However, as the dataset includes only performed repetitions, true negatives and false positives are not possible. Consequently, precision is always 1, and accuracy equals recall. Thus, only recall and F1-score are reported.
Within-device reliability
Within-device reliability of Metric was estimated using multiple reliability parameters: Bland-Altman analysis modified for multiple observations per individual where the true value varies, 37 which quantifies the systematic bias and 95% limits of agreement between devices; ordinary least products (OLP) regression, which estimates fixed and proportional bias, where fixed bias was present if the 95% confidence interval (CI) for the intercept excluded 0, and proportional bias was present if the 95% CI for the slope excluded 1 (residual standard error [RSE] and coefficient of determination [R²] were also extracted); ICC (2,1), 38 which quantifies relative reliability; Lin's concordance correlation coefficient (CCC), 39 which assesses absolute agreement; heteroscedasticity-adjusted CV (100 × SD[log-transformed residuals]), 18 which quantifies relative variability; mean absolute error (MAE) and mean absolute percentage error (MAPE), 40 which describe absolute and relative measurement error, respectively; typical error (TE = SD of differences / √2), 18 which describe the random error attributed to biological and instrumentation noise (instrumentation noise only in this study); and smallest detectable change (SDC = 1.96 × √2 × TE), 41 which represents the minimum change that is unlikely to be due to measurement noise (i.e., a real difference).
While common interpretation heuristics exist for excellent reliability based on ICC (> 0.900) and CV (< 10%) among others,17,38 these thresholds may not be sufficiently strict for velocity trackers. Velocity trackers are commonly used to assess acute changes in neuromuscular performance, 7 guide load prescription, 10 and track strength changes over time, 10 requiring high sensitivity. Some have suggested that ICCs > 0.997 and CVs < 3.5% are necessary for velocity trackers to be considered reliable. 15 Therefore, for us to recommend the Metric application for research as a suitable alternative to LPTs or 3D motion capture, these thresholds had to be met. To aid interpretation for practitioners, given the lower intuitive interpretability of ICCs and CVs, we also expressed the SDC for MCV as the equivalent percentage change in % of 1RM. This was done by fitting individual load–velocity relationships using linear regression for each exercise. To ensure the slope estimates reflected genuine profiles rather than poor model fit, only regressions with R2 ≥ 0.95 were included in these calculations. Group-level bootstrap median slopes were then obtained (using the above-described procedure), and SDCrel was calculated as SDCrel (SDCrel = SDCabs / median slope).
Validity
The validity of Metric against GymAware, as the criterion, was estimated using the parameters mentioned above, except for ICC, CV, TE, and SDC, as these are more appropriate for reliability analyses. To provide overall estimates for Metric relative to GymAware, all analyses were bootstrapped by randomly sampling repetitions from each Metric device, stratified by repetitions within sets within participants, and compared to GymAware. This approach provided robust validity estimates for Metric as a whole relative to GymAware. The level of agreement was interpreted as poor (CCC < 0.90), moderate (CCC = 0.90–0.95), substantial (CCC = 0.95–0.99), and almost perfect (CCC > 0.99). 42
Due to an unintended update of the Metric app (v5.1.0) before data collection for the final two participants, which could not be undone, both iPhones were updated to the latest version. Consequently, all primary results are reported for participants 1–23. However, to examine potential differences between app versions, sensitivity analyses were conducted for participants 24–25 (Supplementary Materials).
Results
Repetition detection ability
The GymAware LPT exhibited the highest performance metrics, with a recall of 0.995 and an F1 score of 0.997. In absolute terms, the GymAware LPT correctly identified 984 out of 989 repetitions, missing only 5 repetitions.
The Metric applications showed slightly lower, but still excellent performance, with a recall of 0.942–0.943 and an F1 score of 0.970–0.971. They correctly detected 932–933 repetitions while missing 56–57, with the missed repetitions not always overlapping between devices. This suggests that detection may be influenced by other factors, such as lifting technique or lighting conditions. 78.6–82.5% of the Metric missed repetitions occurred during sets using smaller diameter plates (less than 45 cm) across all participants, suggesting potential challenges in velocity tracking with non-standard weight plate dimensions.
Load-velocity relationships
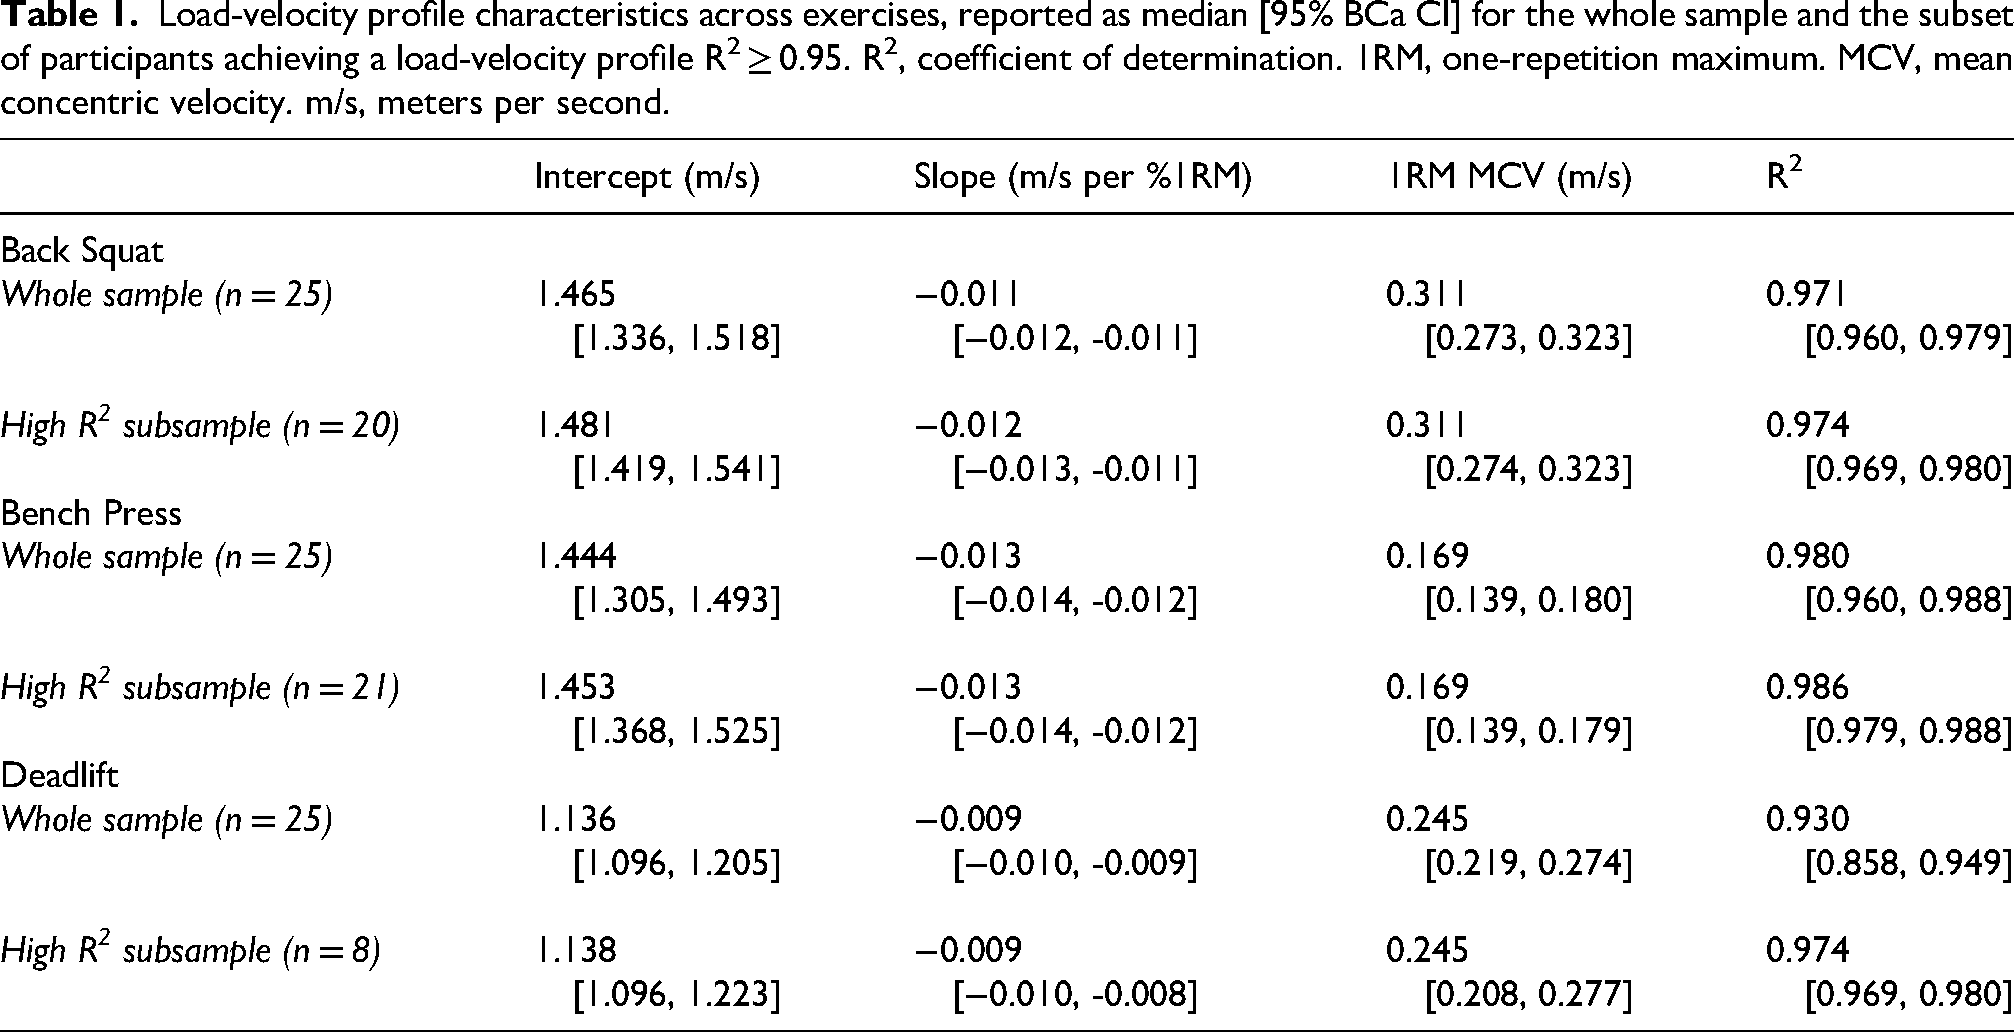
All but five, four, and 17 participants achieved individual load-velocity relationships that were strongly linear (R2 > 0.95) for back squat, bench press, and deadlift, respectively (
Load-velocity profile characteristics across exercises, reported as median [95% BCa CI] for the whole sample and the subset of participants achieving a load-velocity profile R2 ≥ 0.95. R2, coefficient of determination. 1RM, one-repetition maximum. MCV, mean concentric velocity. m/s, meters per second.
Within-device reliability
MCV
Metric exhibited high ICCs and low CVs (except for deadlift) for MCV, with values of 0.994 and 3.83%, 0.981 and 7.57%, and 0.941 and 13.29% for back squat, bench press, and deadlift respectively. Except for a small systematic bias of 0.01 m/s in bench press, no evidence of systematic, fixed, or proportional bias was found across exercises,. However, none of the exercises satisfied the stricter reliability criteria required for research purposes (ICC > 0.997, CV < 3.5%). Reliability was highest for back squat, followed by bench press and lastly deadlift, as evidenced by tighter LoAs, and lower CV, RSE, absolute errors, and SDCs (
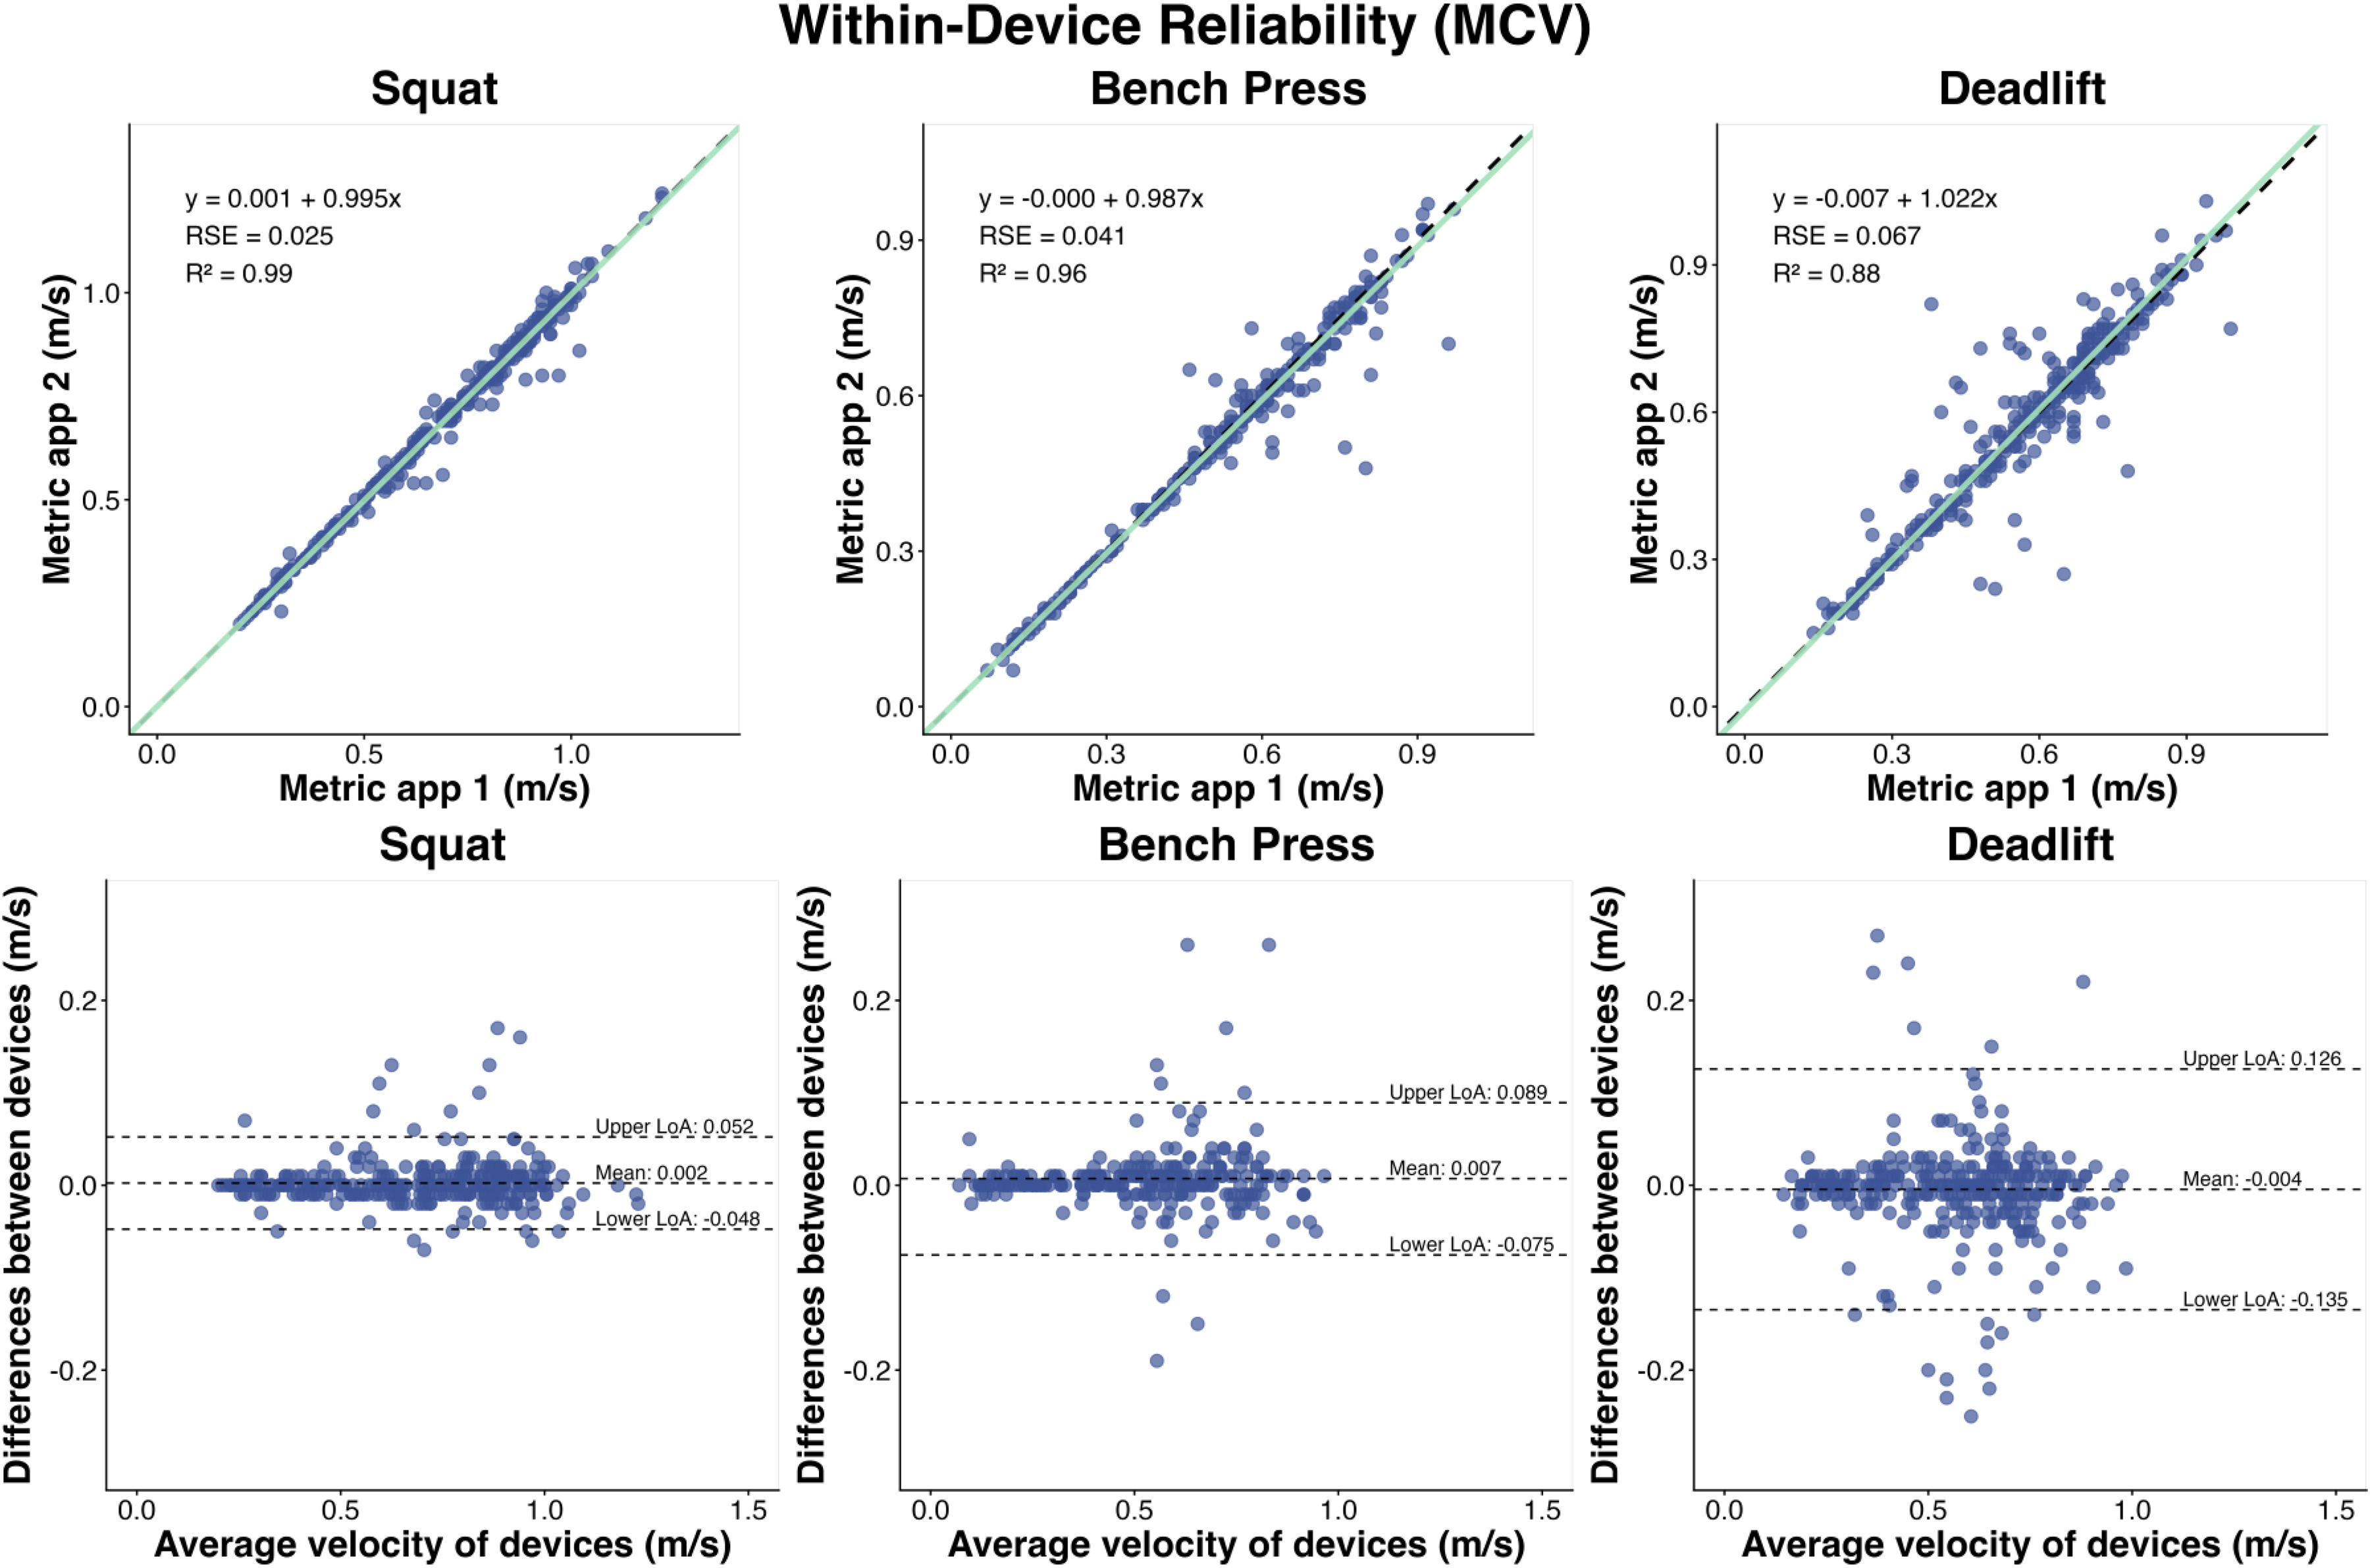
Within-device reliability for mean concentric velocity (MCV). The top three panels display the ordinary least products regression for the back squat, bench press, and deadlift (left to right). The green line represents the regression line between devices, while the dashed black line denotes the line of identity (45-degree diagonal), indicating perfect agreement. The bottom three panels show the Bland-Altman plots, where the dashed lines represent the mean systematic bias and the upper and lower limits of agreement. RSE, residual standard error. R2, coefficient of determination. m/s, meters per second.
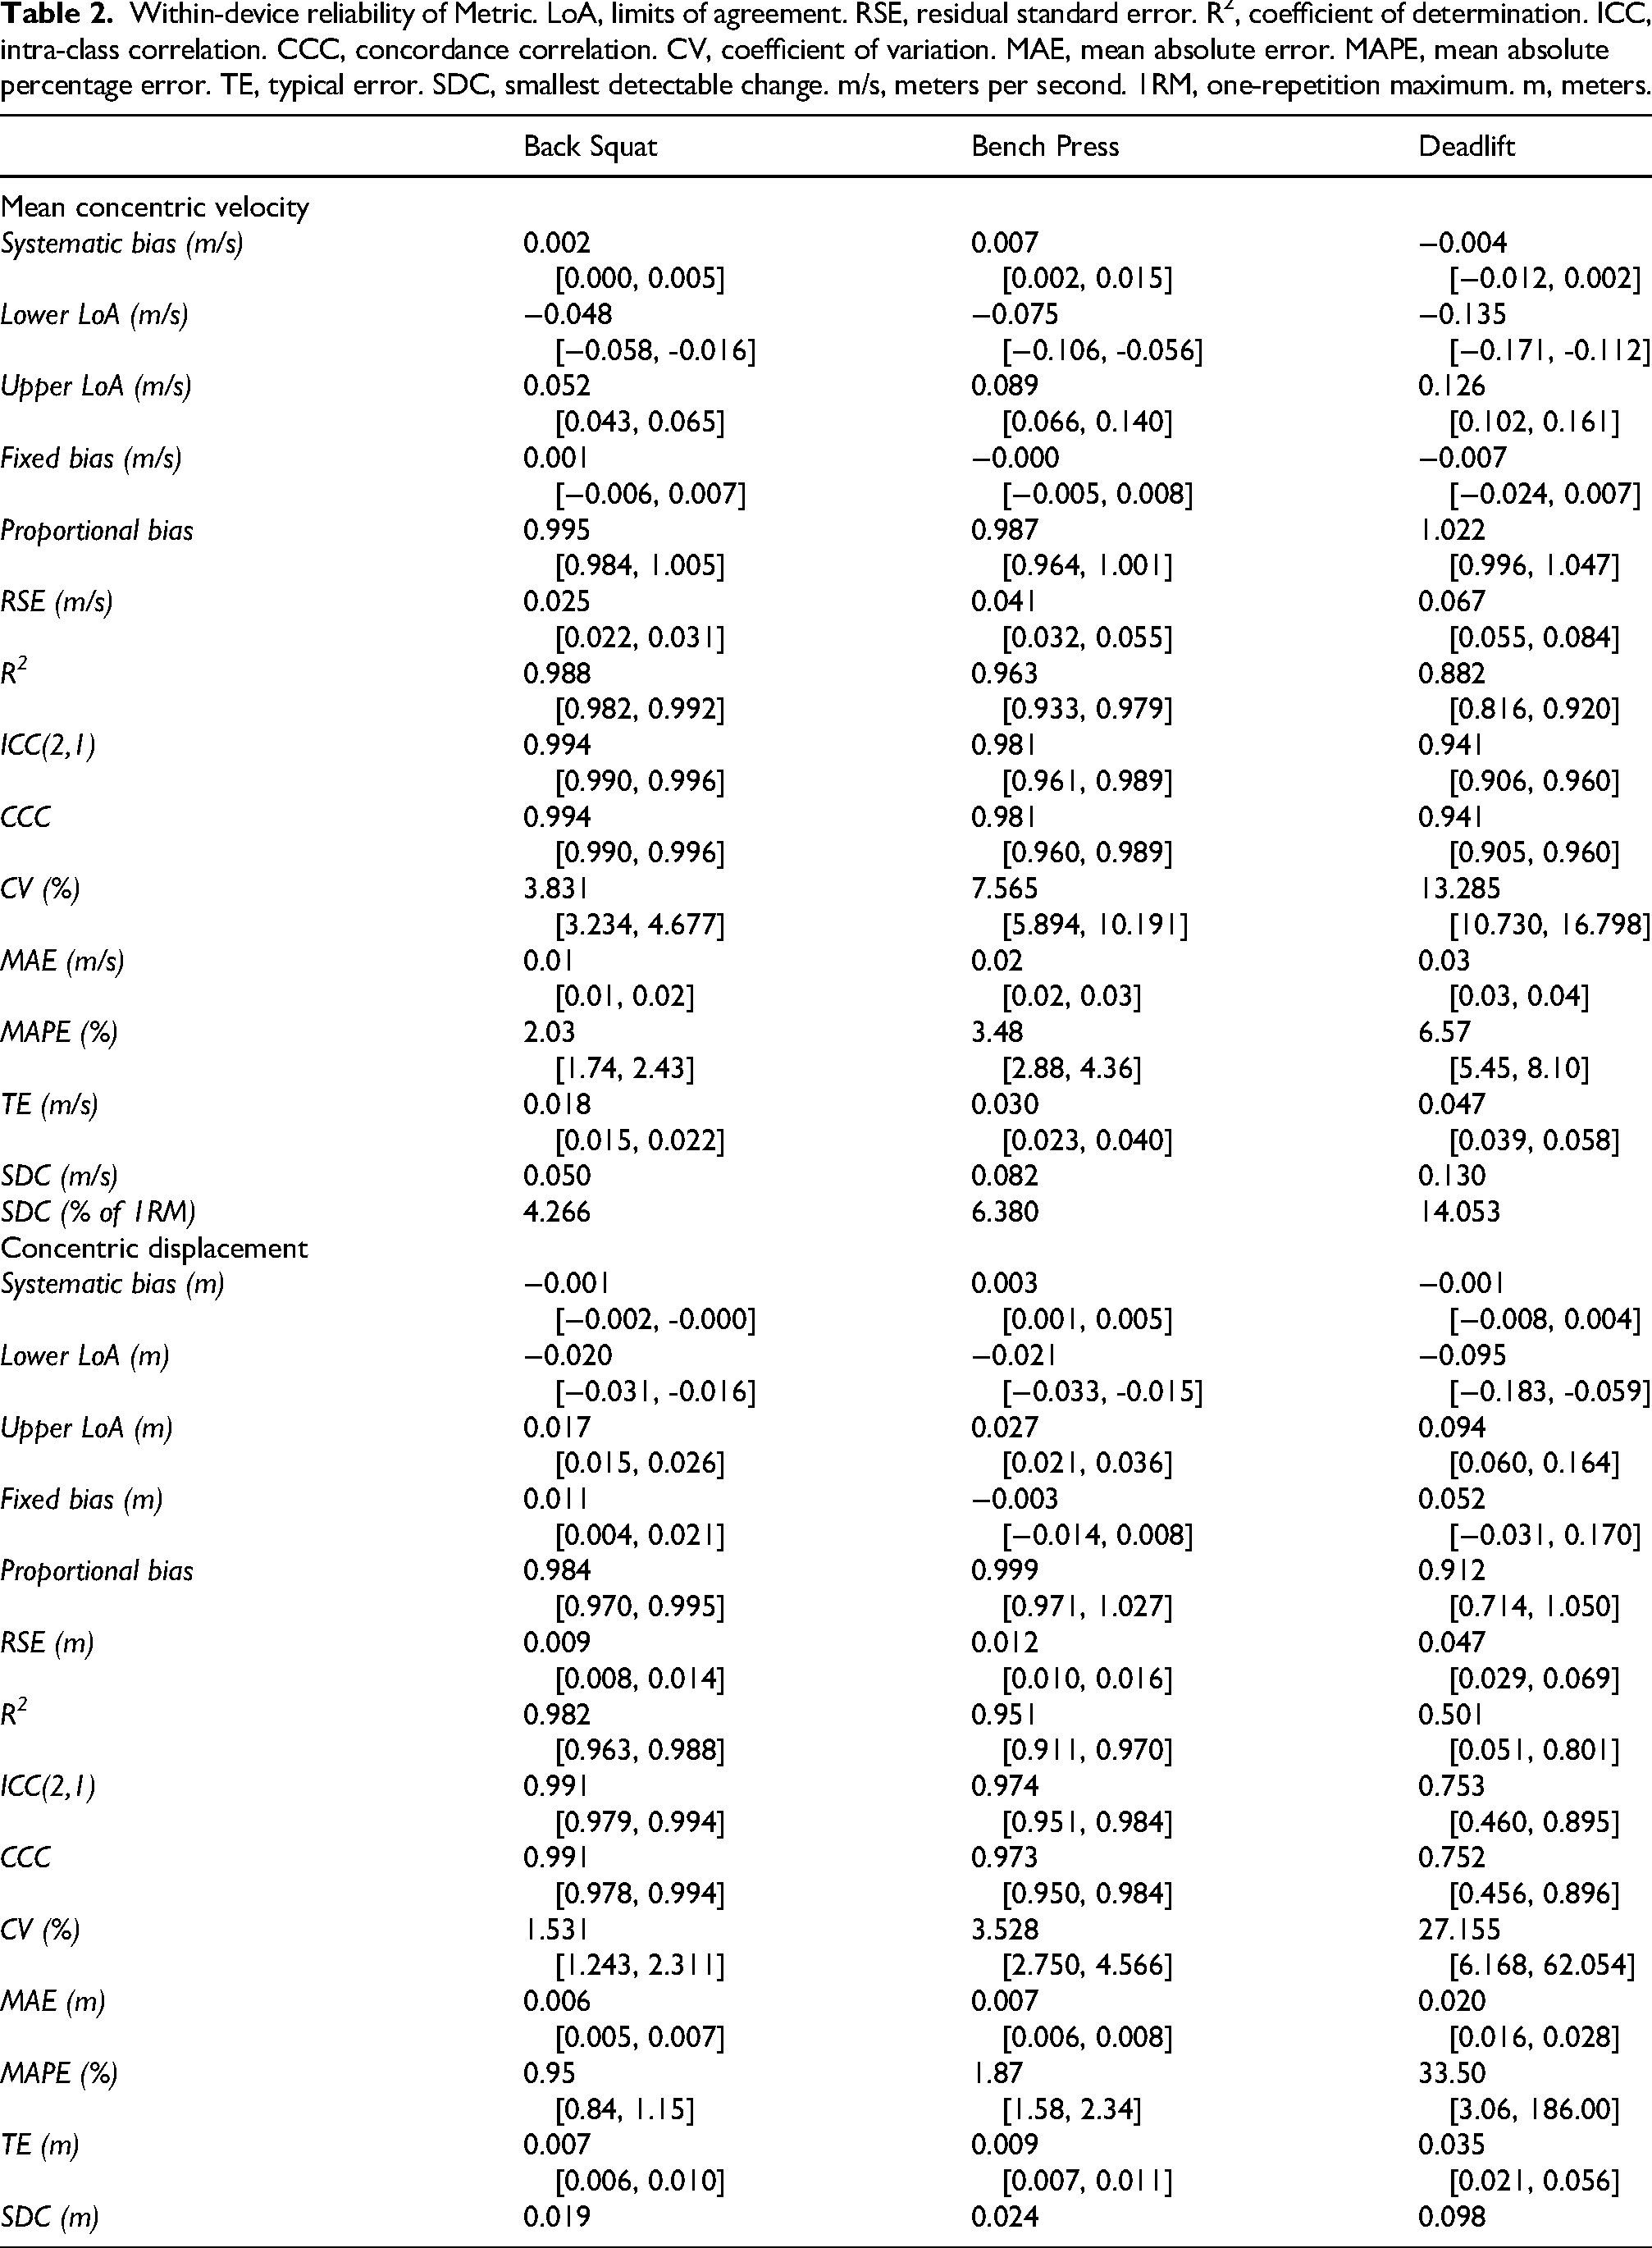
Within-device reliability of Metric. LoA, limits of agreement. RSE, residual standard error. R2, coefficient of determination. ICC, intra-class correlation. CCC, concordance correlation. CV, coefficient of variation. MAE, mean absolute error. MAPE, mean absolute percentage error. TE, typical error. SDC, smallest detectable change. m/s, meters per second. 1RM, one-repetition maximum. m, meters.
CD
Metric exhibited high ICCs and low CVs for back squat (ICC = 0.991, CV = 1.53%) and bench press (ICC = 0.974, CV = 3.53%), but not deadlift (ICC = 0.753, CV = 27.16%). Only the CV for back squat was sufficiently low to satisfy research thresholds, while ICC values for all exercises fell below the 0.997 criterion. The back squat exhibited small but significant systematic bias (−0.001 m), fixed bias (0.011 m), and proportional bias (0.984). For the bench press, only a small but significant systematic bias was observed (0.003 m). Similarly to MCV, reliability was highest for back squat, followed by bench press and lastly deadlift (
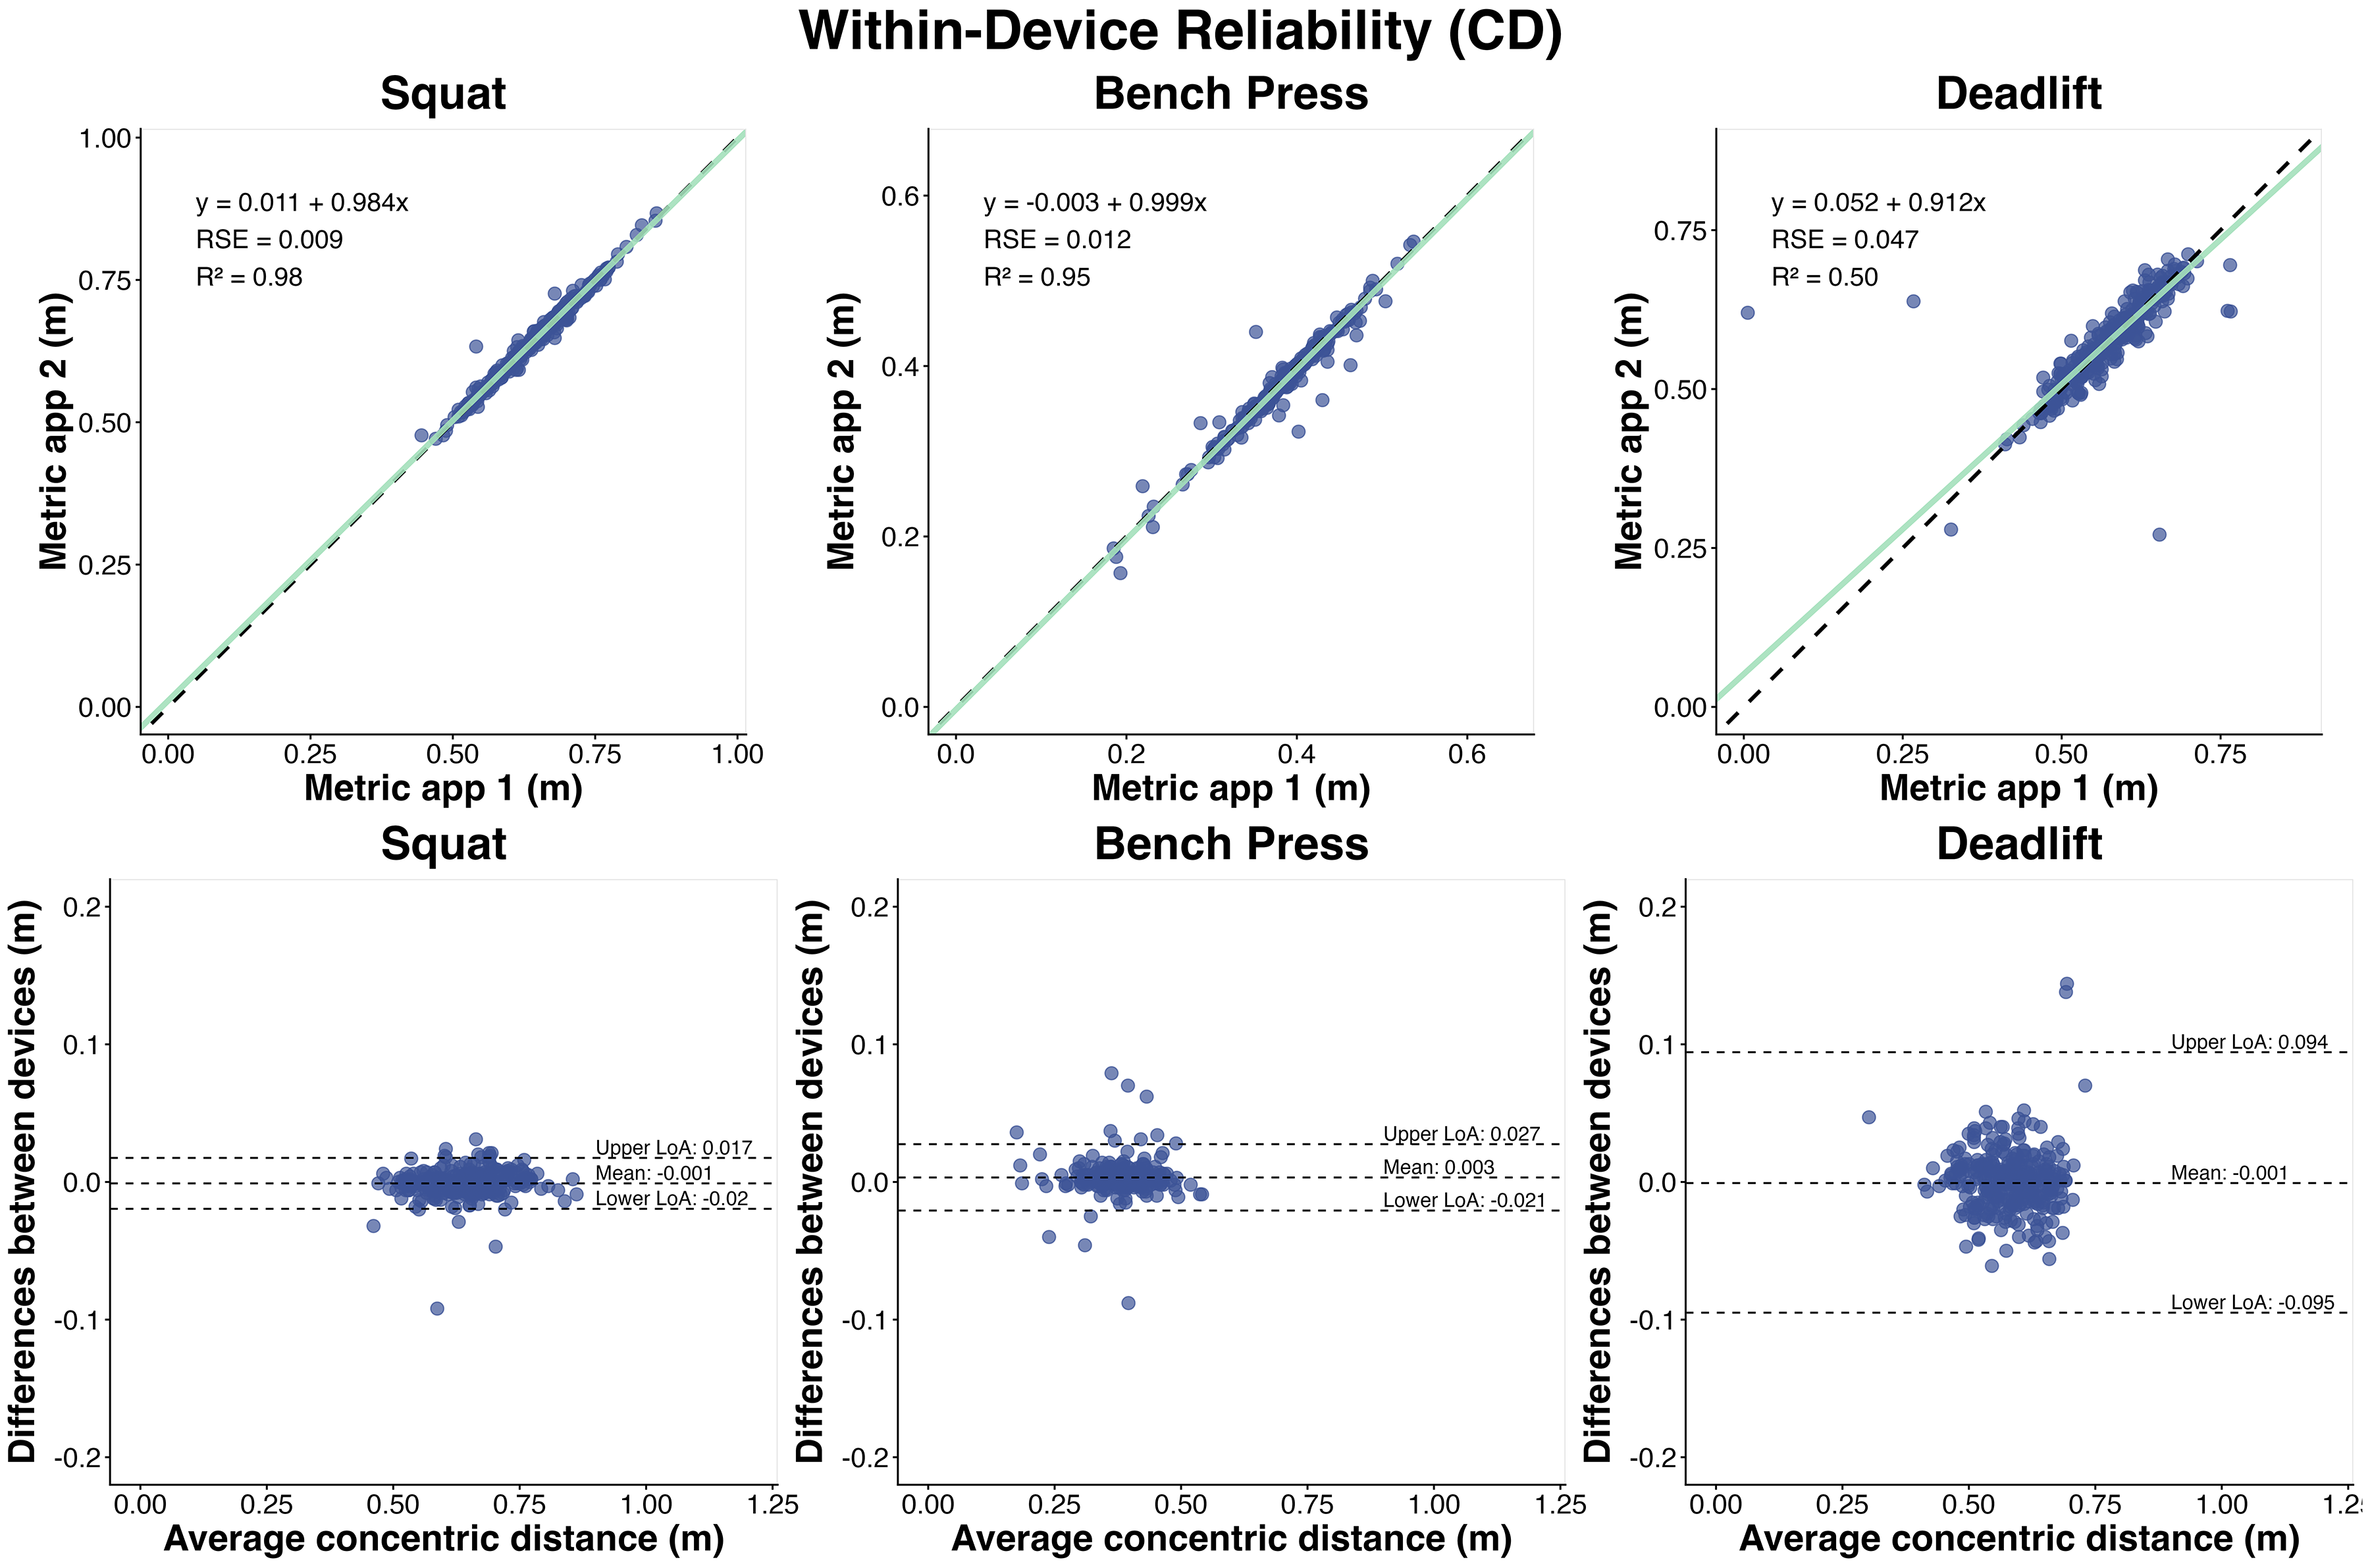
Within-device reliability for concentric displacement (CD). The top three panels display the ordinary least products regression for the back squat, bench press, and deadlift (left to right). The green line represents the regression line between devices, while the dashed black line denotes the line of identity (45-degree diagonal), indicating perfect agreement. The bottom three panels show the Bland-Altman plots, where the dashed lines represent the mean systematic bias and the upper and lower limits of agreement. RSE, residual standard error. R2, coefficient of determination. m, meters.
Validity
MCV
Metric demonstrated substantial-to-almost perfect agreement with GymAware for MCV in back squat (CCC = 0.986, 95% CI [0.981, 0.993]), with minimal systematic (0.01 m/s), fixed, or proportional bias. In contrast, agreement was poor-to-moderate for bench press (CCC = 0.935, 95% CI [0.868, 0.946]) and deadlift (CCC = 0.931, 95% CI [0.873, 0.941]). For bench press, Metric generally overestimated MCV (0.04 m/s) and showed more pronounced proportional bias (0.858), indicating underestimation at higher velocities. For deadlift, Metric found no clear evidence for systematic, fixed, or proportional bias. Higher validity was observed for back squat than for bench press and deadlift, as indicated by tighter LoAs, higher R2 and CCC, and lower RSE, MAE, and MAPE (
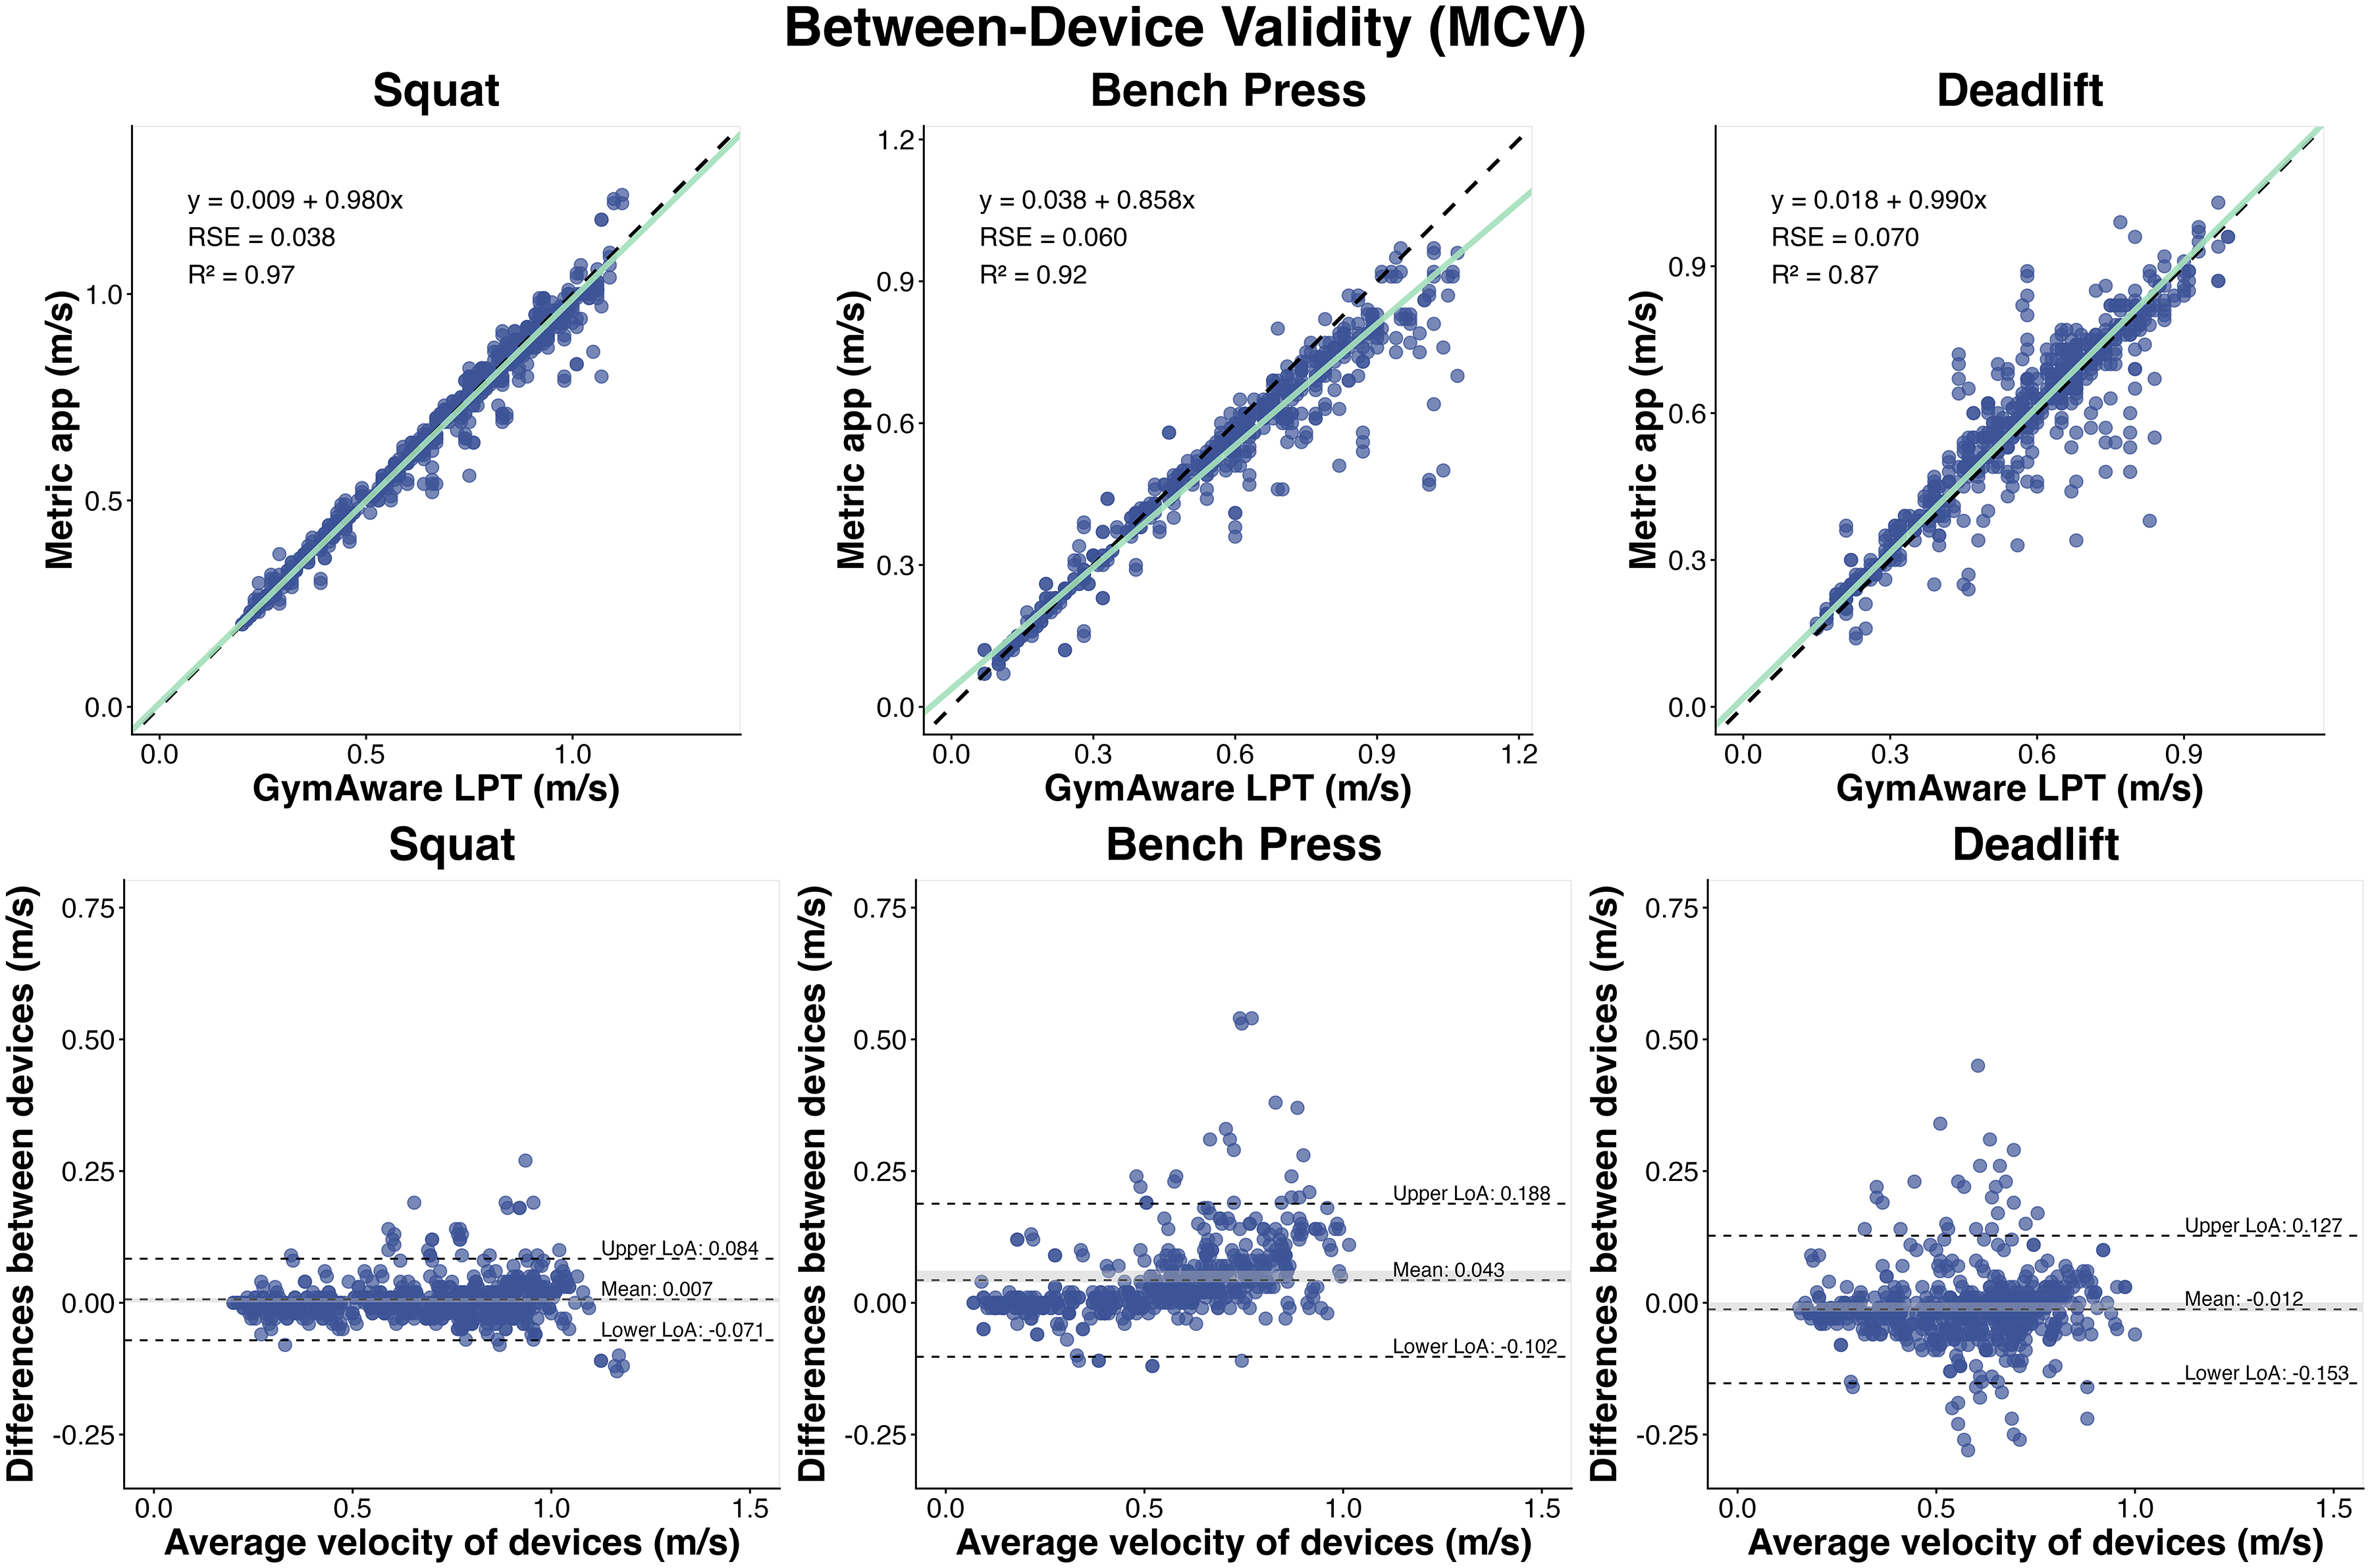
Between-device validity for mean concentric velocity (MCV). The top three panels display the ordinary least products regression for the back squat, bench press, and deadlift (left to right). The green line represents the regression line between devices, while the dashed black line denotes the line of identity (45-degree diagonal), indicating perfect agreement. The bottom three panels show the Bland-Altman plots, where the dashed lines represent the mean systematic bias and the upper and lower limits of agreement. RSE, residual standard error. R2, coefficient of determination. m/s, meters per second.
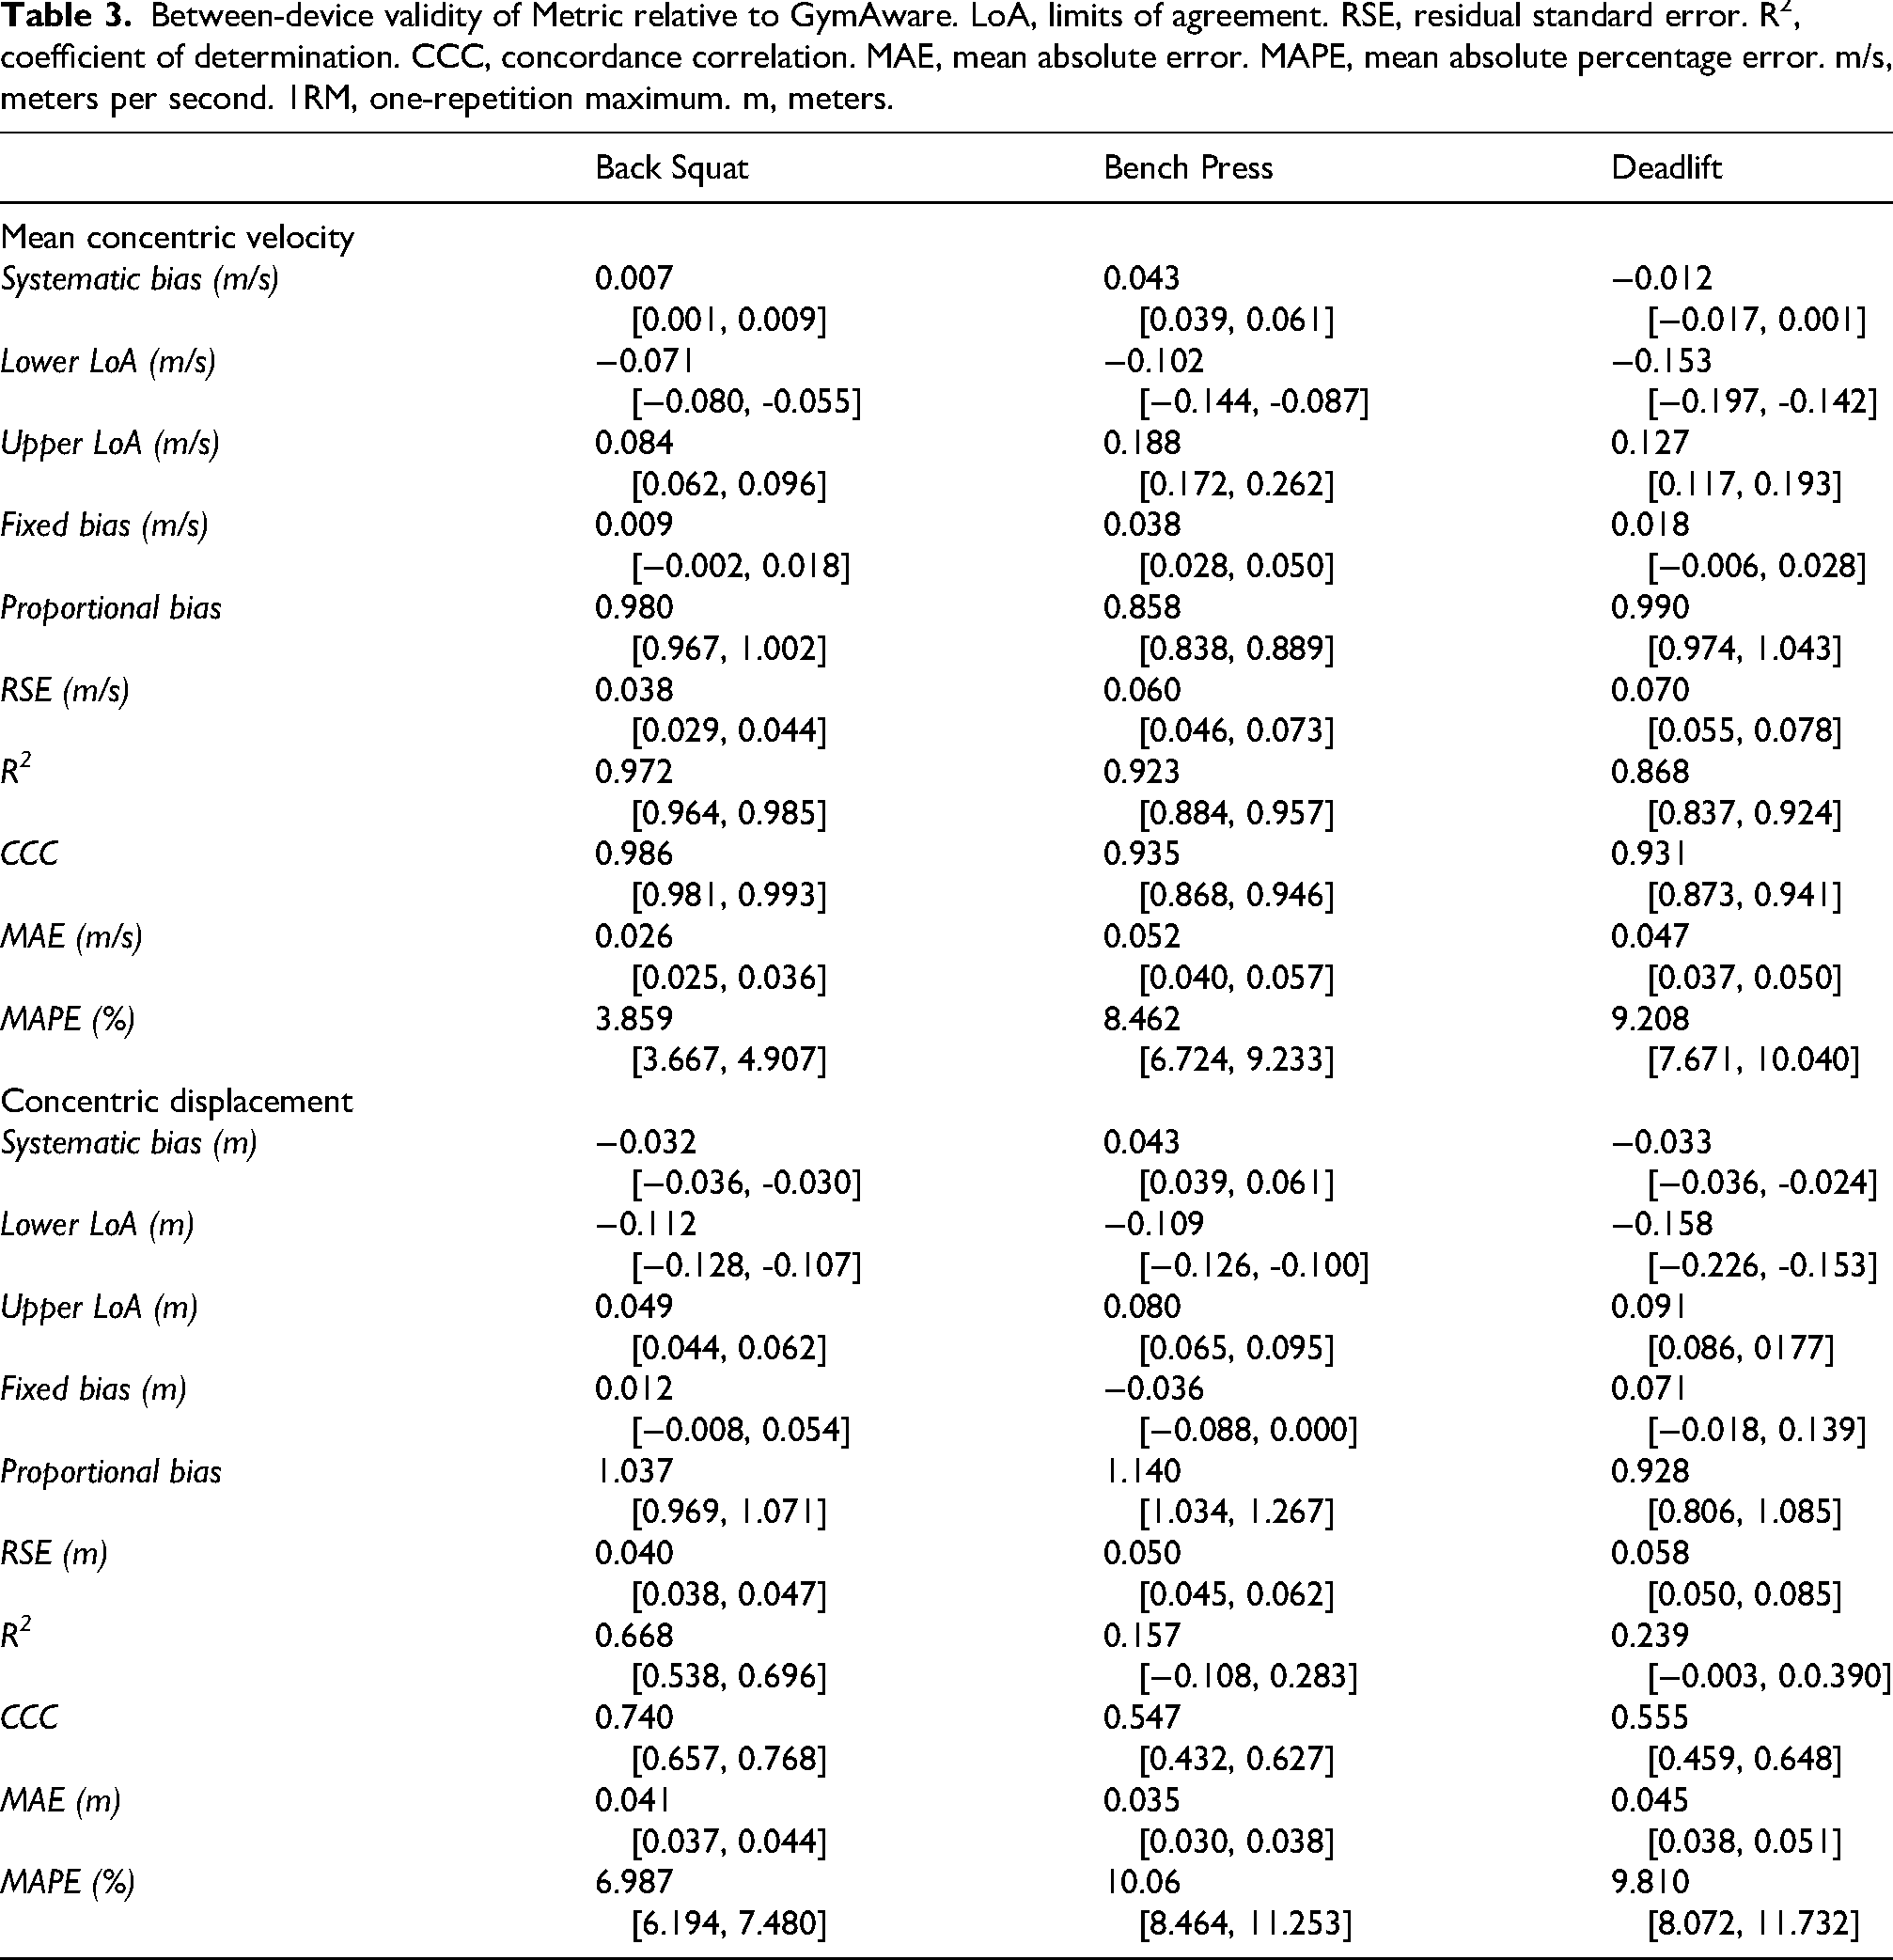
Between-device validity of Metric relative to GymAware. LoA, limits of agreement. RSE, residual standard error. R2, coefficient of determination. CCC, concordance correlation. MAE, mean absolute error. MAPE, mean absolute percentage error. m/s, meters per second. 1RM, one-repetition maximum. m, meters.
CD
Metric demonstrated poor agreement with GymAware for CD across all exercises (CCC < 0.740). It underestimated CD in the back squat and deadlift (−0.033 to −0.032 m) but overestimated CD in the bench press (0.043 m). A proportional bias was observed for the bench press (1.140), indicating greater overestimation at higher displacements, while no other clear fixed or proportional biases were evident. Agreement was slightly better for back squat (CCC = 0.740) than for bench press (CCC = 0.547) and deadlift (CCC = 0.555) (
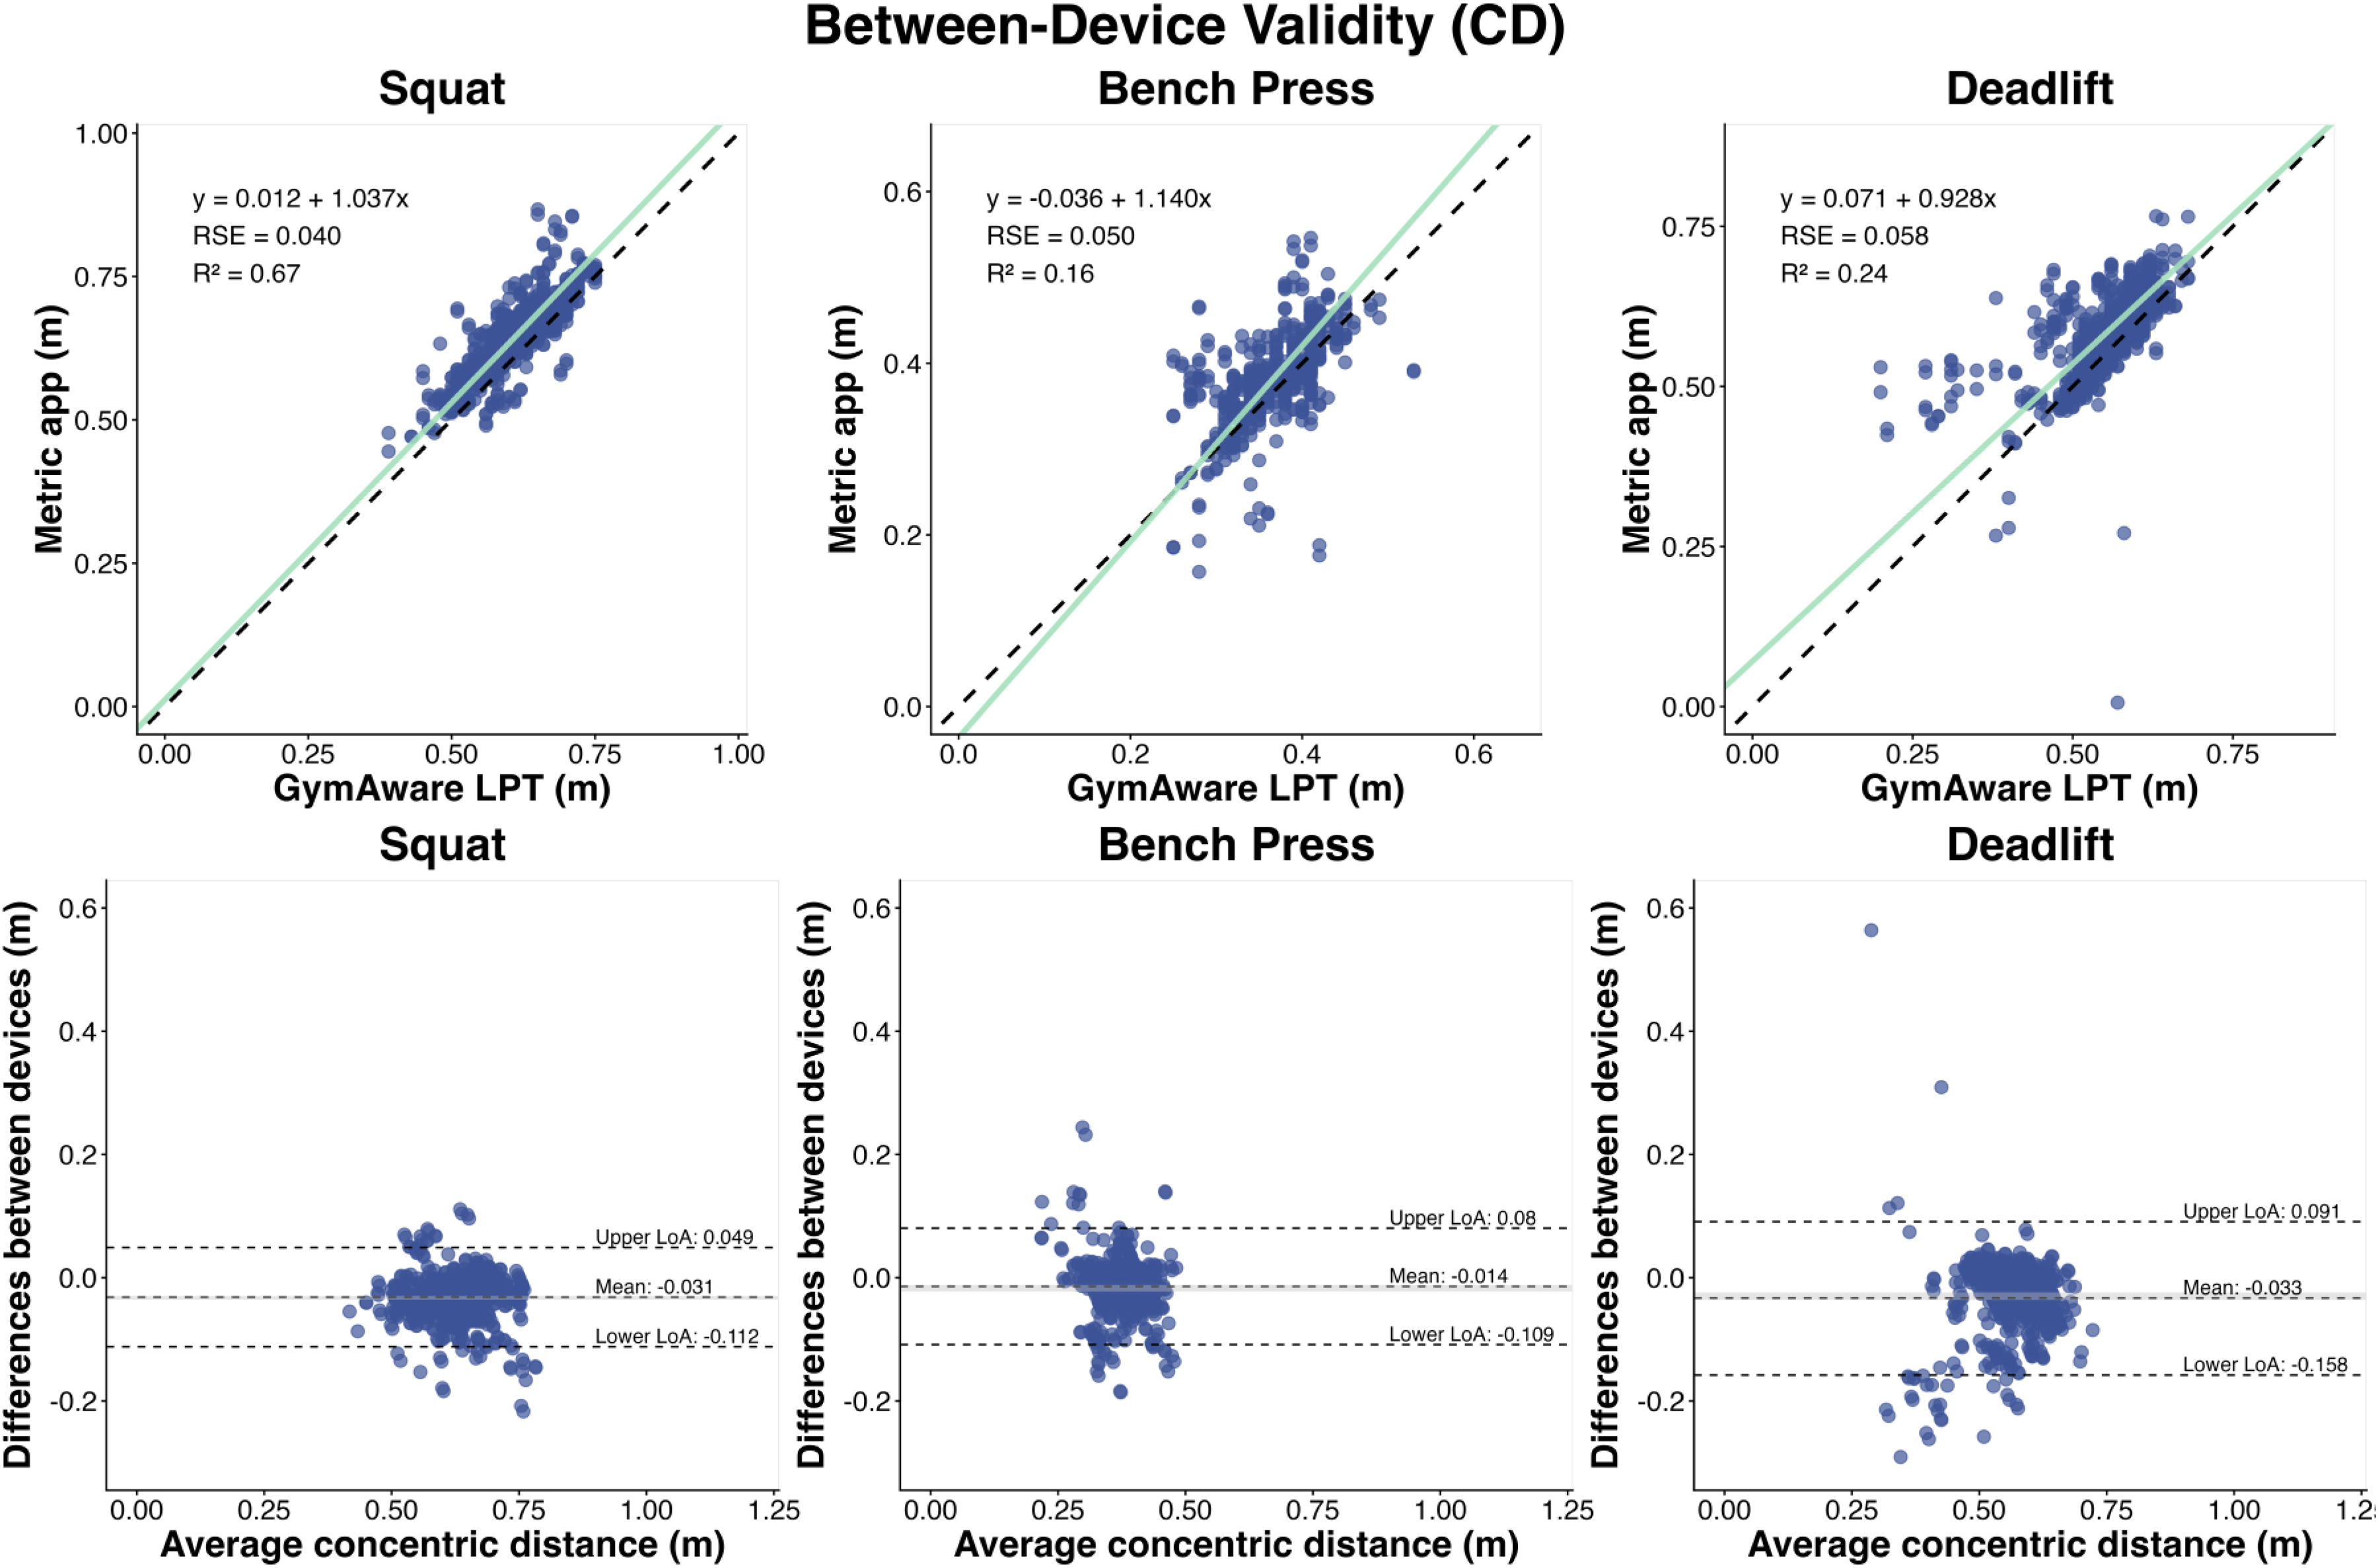
Between-device validity for concentric displacement (CD). The top three panels display the ordinary least products regression for the back squat, bench press, and deadlift (left to right). The green line represents the regression line between devices, while the dashed black line denotes the line of identity (45-degree diagonal), indicating perfect agreement. The bottom three panels show the Bland-Altman plots, where the dashed lines represent the mean systematic bias and the upper and lower limits of agreement. RSE, residual standard error. R2, coefficient of determination. m, meters.
Sensitivity analyses
Our sensitivity analysis indicated improved performance of Metric following the software update (v5.1.0). Briefly, Metric successfully detected all repetitions, whereas GymAware missed seven, all during a single participant's bench press. This participant, an experienced powerlifter, had a markedly shorter range of motion (0.24 ± 0.04 m) compared with other participants (0.38 ± 0.06 m), suggesting that shorter ranges of motion may impair detection. Post-update, Metric also demonstrated improved within-device reliability (ICC: MCV from 0.941–0.994 to 0.952–0.999; CD from 0.753–0.991 to 0.886–0.991; CV: MCV from 3.83–13.29% to 1.74–12.71%; CD from 1.53–27.16% to 1.33–16.22%) and stronger agreement with GymAware (CCC: MCV from 0.931–0.986 to 0.945–0.990; CD from 0.547–0.740 to 0.522–0.875). As a result, Metric met our reliability criteria for back squat MCV with certainty (ICC = 0.999 [0.997, 1.000]; CV = 1.74% [1.29, 2.32]). However, these findings should be interpreted cautiously given the small sample (2 participants, 80 repetitions) and requires replication. Full results are presented in the Supplementary Materials.
Discussion
The primary aim of this study was to investigate the validity and within-device reliability of the Metric smartphone application (v4.8.1) relative to a GymAware LPT, using a design that isolates measurement noise across multiple exercises and relative loads. Our main findings were as follows: (1) Both Metric and GymAware successfully recorded 94.3% and 99.5% of performed repetitions, respectively; (2) Metric's within-device reliability for MCV and CD were highest in the back squat, followed by bench press, and then deadlift. However, Metric did not meet our predefined reliability criteria for use in research; and (3) Metric had high agreement with GymAware for back squat MCV measurements, but not for the bench press or deadlift, nor for CD in any of the exercises. These results call into question the practical utility of Metric for high-precision velocity-based training, given the potential for large 1RM prediction errors arising from small differences in MCV.
The Metric application successfully detected 94.3% of performed repetitions, while GymAware detected 99.5%. These results are an improvement on those reported by others, 14 who found that Metric only detected 91.0% of repetitions across exercises, with the highest detection rate observed in the squat, followed by the bench press and then the deadlift. As we primarily encountered detection issues with small-diameter plate sizes – relevant only during the bench press – it is unclear why such a discrepancy exists. One possible explanation may be differences in software versions (v2.3.1 in Renner et al. vs. v4.8.1 in the current study). Indeed, our sensitivity analyses suggest improved repetition detection accuracy after updating to v5.1.0. However, this post-update sample was small, and findings should be interpreted with caution. Nevertheless, given the relative ease of updating smartphone applications, it is essential that researchers continually evaluate the reliability and validity of these tools to ensure published data remains current and relevant.
To our knowledge, this is the first study to investigate the within-device reliability of the Metric application isolating measurement noise from biological variation across a wide spectrum of practically relevant loads. Reliability was highest for the back squat, followed by the bench press, and lowest for the deadlift, for both MCV and CD. Only the back squat approached our more stringent reliability criteria for research applications (ICC > 0.997 and CV < 3.5%), but ultimately did not satisfy them. Previous studies have reported less-than-promising test–retest reliability (MCV: ICC = 0.79–0.98, CV = 3.91–30.0%; CD: ICC = 0.67–0.98, CV = 3.07–11.1%).12,16 Furthermore, these studies examined only a limited range of velocities – either by instructing participants to lift maximally at 40 kg or by enforcing fixed two-second eccentric and concentric tempos – and restricted testing to loads between 45% and 75% of 1RM. None of these conditions are heavy or fatiguing enough to induce a sticking region (i.e., the portion of the lift between the point of maximal barbell velocity and the first local minimum),43,44 thereby limiting the generalisability of their findings to the broader spectrum of lifting velocities encountered in training. Importantly, the absence of detectable (i.e., ≤ 0.01 m/s) systematic, fixed, or proportional biases in our data suggests that Metric exhibits consistent measurement reliability across a range of velocities – reflecting stable performance under varying loading conditions. While our findings indicate excellent and acceptable within-device reliability, according to conventional thresholds (i.e., ICC > 0.90, CV < 10%),17,38 for MCV and CD in the back squat and bench press, it is crucial to recognise that these values represent isolated measurement noise from the Metric application. In practice, measurement error will be greater when used across multiple sessions and over time due to biological variation. For instance, GymAware's within-device CV (3.4%) 19 contrasts notably with its test–retest CV (9.8%). 45 Therefore, we recommend that the Metric application not be used for research or high-performance monitoring where low measurement error is essential, particularly for the bench press and deadlift, unless more reliable tools are logistically or economically unfeasible and the expected error is appropriately accounted for in the study design.9,46
Our results indicated that within-device reliability was exercise-dependent. For MCV, the SDCs were 0.05 m/s for the back squat, 0.08 m/s for the bench press, and 0.13 m/s for the deadlift—corresponding to approximately 4.27%, 6.38%, and 14.05% of 1RM, respectively, based on our sample's load-velocity profiles with R2 over 0.95. For CD, the SDCs were 0.02 m, 0.02 m, and 0.10 m for the back squat, bench press, and deadlift. These findings partially align with previous research, 12 reinforcing that Metric's reliability is highest for the back squat. However, in contrast to prior work, we observed lower reliability for the bench press than the deadlift. The reason for this discrepancy is unclear, though differences in software versions (v0.5.4 in Taber et al. vs v4.8.1 in the present study) may play a role. Another possibility lies in Metric's detection algorithm, which identifies repetitions based on a y-axis velocity threshold of 0.1 m/s.13,16 Velocities below this threshold are common during maximal load or high fatigue back squat,47,48 bench press,49,50 and deadlift50–52 efforts, with slower MCVs generally found for bench press and deadlift than for squat. 50 This suggest that the algorithm may not be optimised for maximal lifts in trained lifters, particularly for bench press and deadlift. Additionally, minimum barbell velocities typically occur at the start or end of the concentric phase of maximal deadlifts, 52 whereas in the back squat and bench press, the sticking region usually appears around 15% into the concentric phase.43,44 Unlike Taber et al., 12 we included maximal lifts, which may have influenced our findings. The algorithm may detect back squat repetitions more reliably due to higher velocities and greater absolute displacements before the sticking point. In contrast, the start of a repetition in bench press and especially the deadlift may be harder to detect accurately. The deadlift, notably, also lacks a preceding eccentric phase, which may hinder accurate identification of the concentric onset and potentially result in truncated repetitions, as evidenced in the CD results. Thus, lifters may find Metric useful for monitoring performance, especially in the back squat. However, they should consider whether the observed SDCs are practically acceptable, keeping in mind that biological variation adds further noise. Given that novice lifters typically gain ∼30–50% maximal strength in their first year of resistance training, and powerlifters ∼7.5–12.5% in their first year of powerlifting-specific training,53,54 Metric may only be able to detect true changes in back squat strength after approximately one month in novices and six months in powerlifters. For the deadlift, these timeframes may extend to around three months and one year, respectively. In its current form, therefore, Metric appears unlikely to provide greater precision than subjective exertion ratings for adjusting training based on daily performance,24,55 than direct 1RM testing for assessing maximal strength, 25 particularly for bench press and deadlifts. However, in situations where lower loads with maximal intended speed and immediate velocity feedback are desired in the back squat, Metric may provide a free alternative to higher-cost LPTs to enhance motivation and effort,56,57 particularly as subjective exertion ratings are known to be less precise when further from failure. 55
We observed substantial-to-perfect agreement with the criterion for back squat MCV, with minimal systematic bias – suggesting slight overestimation (
This study has several limitations. First, we used two different mobile devices. Although both recordings were captured using smartphones running identical iOS versions and Metric applications, and with matching camera angles, hardware differences may have caused additional random variation – regardless of the manufacturers’ claims. It remains unclear whether adjusting the settings relative to participants’ height would have affected the results. Second, our findings pertain specifically to Metric v4.8.1. Given the frequency of software updates, these results may not generalise to more recent versions. Indeed, due to an unintended software update, the final two participants completed their testing using version 5.1.0, which appeared to offer modest improvements in both reliability and validity, though not enough to alter interpretation. However, these findings are preliminary and based on a very small subsample, underscoring the need for ongoing studies with larger cohorts to stay current with software changes. Third, while the Metric application was evaluated under controlled laboratory conditions – filming perpendicular to the plates – its reliability in more ecologically valid settings remains uncertain. In practical settings, measurement accuracy may be affected by inconsistent camera positioning, 13 the presence of other gym users or objects within the frame, and variable lighting conditions. As such, practitioners should exercise caution when generalising these findings to real-world training environments. Fourth, while our study was sufficiently powered to estimate ICC, had the Metric application met our criteria for research use (ICC = 0.99), it may not have been adequately powered to detect the actual ICC with high precision, as reflected in the wider confidence intervals – particularly for the bench press and deadlift. Therefore, readers are encouraged to interpret the full confidence intervals rather than relying solely on point estimates. Future studies should aim to recruit larger samples and/or increase the number of repetitions per participant to enhance the precision of their estimates.
Conclusion
In conclusion, the Metric smartphone application did not demonstrate adequate reliability for MCV or CD according to the threshold proposed by Courel-Ibáñez et al.. 15 While substantial-to-perfect agreement with the GymAware LPT was observed for back squat MCV, this was not the case for the bench press, deadlift, or for CD across any exercise. These findings suggest that Metric's algorithm may struggle to accurately detect the initiation and termination of repetitions. If practitioners can tolerate the associated SDCs in addition to biological variation, Metric may offer a cost-effective and user-friendly alternative to LPTs, particularly for the back squat. However, it is not sufficiently reliable to replace LPTs in research or high-performance contexts where high precision is required, and its measurements should not be used interchangeably with those from other tracking devices. Future research should evaluate the validity and reliability of subsequent software updates in adequately powered study designs, and examine performance across a broader range of loads, exercises, and ecologically valid settings with variable lighting and potential background interference.
Supplemental Material
sj-docx-1-spo-10.1177_17479541251391967 - Supplemental material for Validity and within-device reliability of the Metric application for assessing barbell velocity and displacement
Supplemental material, sj-docx-1-spo-10.1177_17479541251391967 for Validity and within-device reliability of the Metric application for assessing barbell velocity and displacement by Nathan Fane Tanira Puppyn, Stuart Hofmeyr, Matt Brughelli, and Christian Houmann Amdi in International Journal of Sports Science & Coaching
Footnotes
Acknowledgements
The authors would like to thank the participants who generously volunteered their time to take part in this research.
Funding
The authors received no financial support for the research, authorship, and/or publication of this article.
Declaration of conflicting interests
The authors declared no potential conflicts of interest with respect to the research, authorship, and/or publication of this article.
Disclosure statements
The authors declare that they have no competing interests, and received no external funding or support for this project. The full dataset and R-code that support the findings of this study are openly available in Open Science Framework [DOI: 10.17605/OSF.IO/XHQDM].
Supplemental material
Supplemental material for this article is available online.
References
Supplementary Material
Please find the following supplemental material available below.
For Open Access articles published under a Creative Commons License, all supplemental material carries the same license as the article it is associated with.
For non-Open Access articles published, all supplemental material carries a non-exclusive license, and permission requests for re-use of supplemental material or any part of supplemental material shall be sent directly to the copyright owner as specified in the copyright notice associated with the article.