
Abstract
All Abilities Touch Football (AATF) is a modified version of touch football for players with intellectual and/or physical impairments. Its rapid growth has revealed structural limitations, highlighting the need to move beyond rule modifications and a two-tiered competition system to better accommodate players’ diverse abilities. This study assessed the physical and technical demands of AATF players and explored associations with functional and field-based performance measures. Twenty-one players participated in four matches over two days at the National Touch League competition. Significant differences were observed between Tier 1 and Tier 2 players for maximum speed (p = 0.042), accelerations (p = 0.041), distance in the jogging zone (p = 0.010), dummy half pickups (p = 0.002), and successful passes (p = 0.018). A subgroup of 11 players completed assessments measuring flexibility, balance, coordination, strength, power, speed, change of direction speed (CODS) and endurance, showing strong associations between match maximum speed and power (r = 0.77, p = 0.006), speed (rs = 0.90, p < 0.001), and CODS (rs = 0.82, p = 0.002). These findings highlight performance differences within and across tiers and suggest the importance of power, speed and CODS in AATF performance, offering preliminary insights that may guide the future development of the sport.
Introduction
Touch football is a popular team sport played internationally, characterised by intermittent high intensity periods of speed and power, interspersed with low-intensity activities, such as walking and jogging.1,2 Unlike traditional rugby codes, touch football eliminates the contact components (i.e., tackles, scrums) 3 and is played on a smaller field (70 × 50 m), allowing for greater accessibility across a diverse range of participants.
In recent years, All Abilities Touch Football (AATF) was introduced in Australia, aiming to maximise participation and engage individuals with intellectual and/or physical impairments in the sport. To address the diverse range of player abilities, rule modifications have been introduced in an attempt to balance participation and performance opportunities. Under these modifications, players are registered either as certified or non-certified athletes. Certified athletes meet disability eligibility criteria by holding either a National Disability Insurance Scheme registration, a Sport Inclusion Australia registration, or a letter from a doctor. Non-certified athletes (players without a disability) are included to facilitate game play and are not subject to any eligibility requirements. However, they face certain restrictions, such as not being allowed to run from dummy half, in an effort to minimise their impact on the game.
The AATF NTL competition is divided into two tiers. Tier 1 matches consist of two 20-min halves with a maximum of one non-certified athlete on the field, while Tier 2 matches comprise a single 20-min half allowing up to three non-certified athletes simultaneously. Both tiers follow standard touch football rules, with six players on the field at any given time. However, a key limitation of this structure lies in the method of tier allocation. In the absence of formal criteria to differentiate player abilities, placement is currently based on subjective coach evaluations. 4 Although Tier 1 is generally for higher-ability players and Tier 2 for lower-ability players, the subjective nature of tier allocation complicates efforts to ensure close competition and meaningful participation, as individuals with varying types and severities of impairments are competing against each other.
One approach to addressing this challenge is the development of an objective classification framework. In many sports, classification is used to promote fairer competition and facilitate broader participation by grouping individuals based on observable characteristics. 5 While other ambulant team sports such as cerebral palsy (CP) football employ a selective classification system tailored to specific physical impairments, 6 AATF faces the unique challenge of accommodating players with intellectual and/or physical impairments within the same game. Therefore, a performance-based divisioning model, similar to the one used in the Special Olympics, may offer a more suitable alternative. However, developing such a system requires a foundation of empirical evidence, beginning with a clearer understanding of the physical and technical demands placed on AATF players during match play.
To support this understanding, microtechnology (i.e., Global Positioning System (GPS)) is widely used in team sports to objectively quantify external loads during training and competition. 7 For example, in CP football, GPS technology has been used to not only describe match demands but also validate the current sport classes (FT1, FT2, FT3). Para-athletes in higher sport classes have been shown to cover greater distances at high speeds and engage in more high-intensity actions compared to those in lower classes.8–12 Strong correlations have also been found between match performance metrics and skills like change of direction ability, horizontal jumps, coordination and speed.10,11 Additionally, assessing technical demands, such as passing accuracy and defensive actions, may enhance our understanding of players’ tactical proficiency. Although such technical measures can be influenced by contextual factors, they may still provide complementary information that contributes to a more complete understanding of player performance.
While research has explored the match demands of touch football players at various levels,1–3,13 there is currently no research focused on AATF. Additionally, while match play demands and their relationship with performance measures have been examined in disability team sports focusing on individuals with a singular impairment (e.g., physical impairment),10,11,14 no research has addressed these aspects in sports involving individuals with multiple impairment types. Therefore, the purpose of this study was twofold; (a) to evaluate the physical and technical demands of match performance across the two tiers of AATF players, and (b) to explore associations between these performance aspects and a set of functional and field-based measures, offering preliminary insights that may guide the future development of AATF.
Methods
Participants
Twenty-one players (16 certified athletes and 5 non-certified athletes) were recruited from two NTL teams (1 x Tier 1, 1 x Tier 2) representing one regional association at the 2023 NTL competition. Both teams participated in four matches over two days. The Tier 1 team consistently had one non-certified athlete on the field (alongside five certified athletes), while the Tier 2 team consistently had two non-certified athletes (alongside four certified athletes). Players followed their usual pre-game preparation and post-game recovery routines. All matches were played on the same natural grass sporting ground between 08:00 and 17:00 h. The average temperature and relative humidity across the two days were recorded as 24.6 ± 2.1°C and 63.4 ± 11.2%, respectively. Informed consent was obtained from all players or their respective parents/guardians, and a questionnaire was administered prior to the competition to gather information about their impairment. Ethical approval for this study was granted by the Institutional Human Research Ethics Committee (Approval no. 2022/040).
Physical match performance (GPS)
GPS units (STATSports Apex 10HZ; 62.7 g; 84 × 44 × 20 mm) were activated approximately 30-min prior to each match to synchronise with satellite signals. They were positioned between the scapulae on the upper back and secured within manufacturer-supplied vests worn underneath the players’ shirts. Players were familiarised with vests and units during a light training session the day prior to the competition to assess comfort levels, considering their individual impairments. Each player was assigned the same unit for the competition to avoid interunit variability. The start and end times of each match, as well as the halves of Tier 1 games, were recorded live through hand notation, along with player substitutions.
Following the last match of each day, data was downloaded to determine the physical demands of each player using the manufacturers software (STATSports Sonra, Version 4.4.17). Additionally, the video footage for each match was uploaded into the software and synchronised with the GPS data using the video manager. The data was cropped to include only on-field playing time and included total distance (m), intensity (m/min), maximum speed (m/s), number of accelerations/decelerations and distance covered across four different intensities (walking: 0–6 km/hr, jogging: 6.1–12 km/hr, running: 12.1–18 km/hr, and sprinting: > 18 km/hr). Given this was the first study to investigate the physical demands of AATF players, the establishment of absolute speed zones was based on previous research. The walking zone aligns with the American College of Sports Medicine metabolic equation for walking, 15 while the jogging, running, and sprinting zones were adapted from previous research in rugby league 16 and CP football.9,17
Technical match performance (video)
Each match was recorded using a Sony Handycam FDR-AX43A 4K Camcorder, positioned on the sideline adjacent to the team's substitution box, except for Tier 1 (Game 4), where publicly available footage was used due to broadcasting rights. Each match was coded by author TW using Sportscode (Hudl Sportscode v12.19.0), focusing on game involvements such as passes, catches, roll balls, dummy half pickups and defensive touches. Involvements were divided into successful and unsuccessful (errors) outcomes, 18 with all errors related to ball handling combined into a total count. To minimise potential bias and ensure consistency, standardised definitions for each coded variable were developed prior to analysis. See Supplementary Material 1 for a detailed description of all coded activities.
To determine intra-rater reliability, a random sample of four match videos (2 x Tier 1 and 2 x Tier 2 matches) were analysed by the same author a week later. Reliability was assessed by comparing all coded variables and is presented as a percentage of agreement. Comparison of all variables for intra-rater reliability revealed a percentage agreement of 98% in one match and 99% in three matches.
Functional and field based performance measures (subgroup analysis)
From the 16 players registered as certified athletes 11 (10 male, 1 female; age 25.2 ± 10.6 yrs; height 1.75 ± 0.08 m; weight 78.7 ± 26.0 kg; touch football playing experience 2.8 ± 2.7 yrs) participated in a range of functional and field-based performance measures to assess the association with physical and technical match performance. These measures were primarily adapted from those used to evaluate fitness in the Special Olympics 19 and CP football classification. 6 They were grouped into eight physical performance components and involved: sit and reach 20 (flexibility), single leg balance 21 (balance), nine-hole peg test (9-HPT) 22 (motor coordination), vertical 10 and standing broad jump 23 (power), handgrip squeeze 24 and 30-s chair stand test 25 (strength), 40-m sprint 26 (speed), 505 10 and modified agility test (MAT) 27 (change of direction speed (CODS)) and six-minute walk test (6MWT) 28 (endurance). A detailed description of these assessment methods are provided in Supplementary Material 2.
Statistical analysis
Data were analysed using SPSS (IBM SPSS Statistics for Windows, Version 28.0. Armonk, NY: IBM Corp). The normality of the data was assessed using the Shapiro-Wilk test and the appropriate parametric or non-parametric test applied. Descriptive statistics for normally distributed data are presented as mean and standard deviation (± SD), while non-normally distributed data is presented as median, and interquartile range (IQR). The ranges of data are also reported. Counts and percentages were used for video data to detail certified and non-certified athlete game involvements.
To examine differences in physical match performance across games, a repeated measures analysis of variance (ANOVA) was conducted for normally distributed data, and the Friedman test was used for non-normally distributed data. For normally distributed data, effect sizes were reported using partial eta squared and were interpreted as 0.01 (small), 0.06 (medium), and 0.14 (large). 29 For non-normally distributed data, effect sizes were reported using Kendall's W and were interpreted as 0.1 (small), 0.2 (medium), and 0.3 (large). Bonferroni-adjusted pairwise comparisons were conducted when significant differences were identified.
To account for differences in match duration and enable comparison between the two tiers, physical and technical match data were normalised to per minute of total playing time and averaged across the four games for each player. An independent t-test was performed for normally distributed data with mean differences and 95% confidence intervals reported. Cohen's d effect sizes with 95% confidence intervals were calculated and the effect sizes were interpreted as: 0.2 (small), 0.5 (medium) and 0.8 (large). 29 A Mann-Whitney U test was applied for non-normally distributed data. Effect sizes were calculated using the rank biserial correlation based on the z value from the Mann-Whitney U test and were interpreted as: 0.1 (small), 0.3 (medium) and 0.5 (large). 29
For the functional and field-based performance measures, z-scores were calculated to standardise the data. Each physical component were assigned an equal weighting (12.5%), and a weighted z-score, referred to as total test score was calculated. Missing data for the MAT (n = 1) were excluded from the analysis due to the player not comprehending test requirements. Additionally, z-scores were calculated for normalised physical and technical match performance data, with total test scores representing the unweighted sum of these individual performance metrics. Player performances were ranked from higher to lower scores, with higher scores always indicating better performance.
The relationship between individual physical and technical match performance variables and each physical component were examined by assessing the strength of association between their z-scores. Pearsons (r) and Spearman's (rs) correlation coefficients were used for normally and non-normally distributed data, respectively. The interpretation of correlation coefficients was described based on predefined values: negligible (0 to 0.25), fair (> 0.25–0.50), moderate (> 0.50–0.75) and strong (> 0.75). 30 Statistical significance was set at p < 0.05 for all analyses.
Results
Table 1 provides an overview of player characteristics for each tier. The Tier 1 team had 12 players, which included 10 certified athletes and 2 non-certified athletes. The Tier 2 team had 9 players, consisting of 6 certified athletes and 3 non-certified athletes.
Player characteristics.
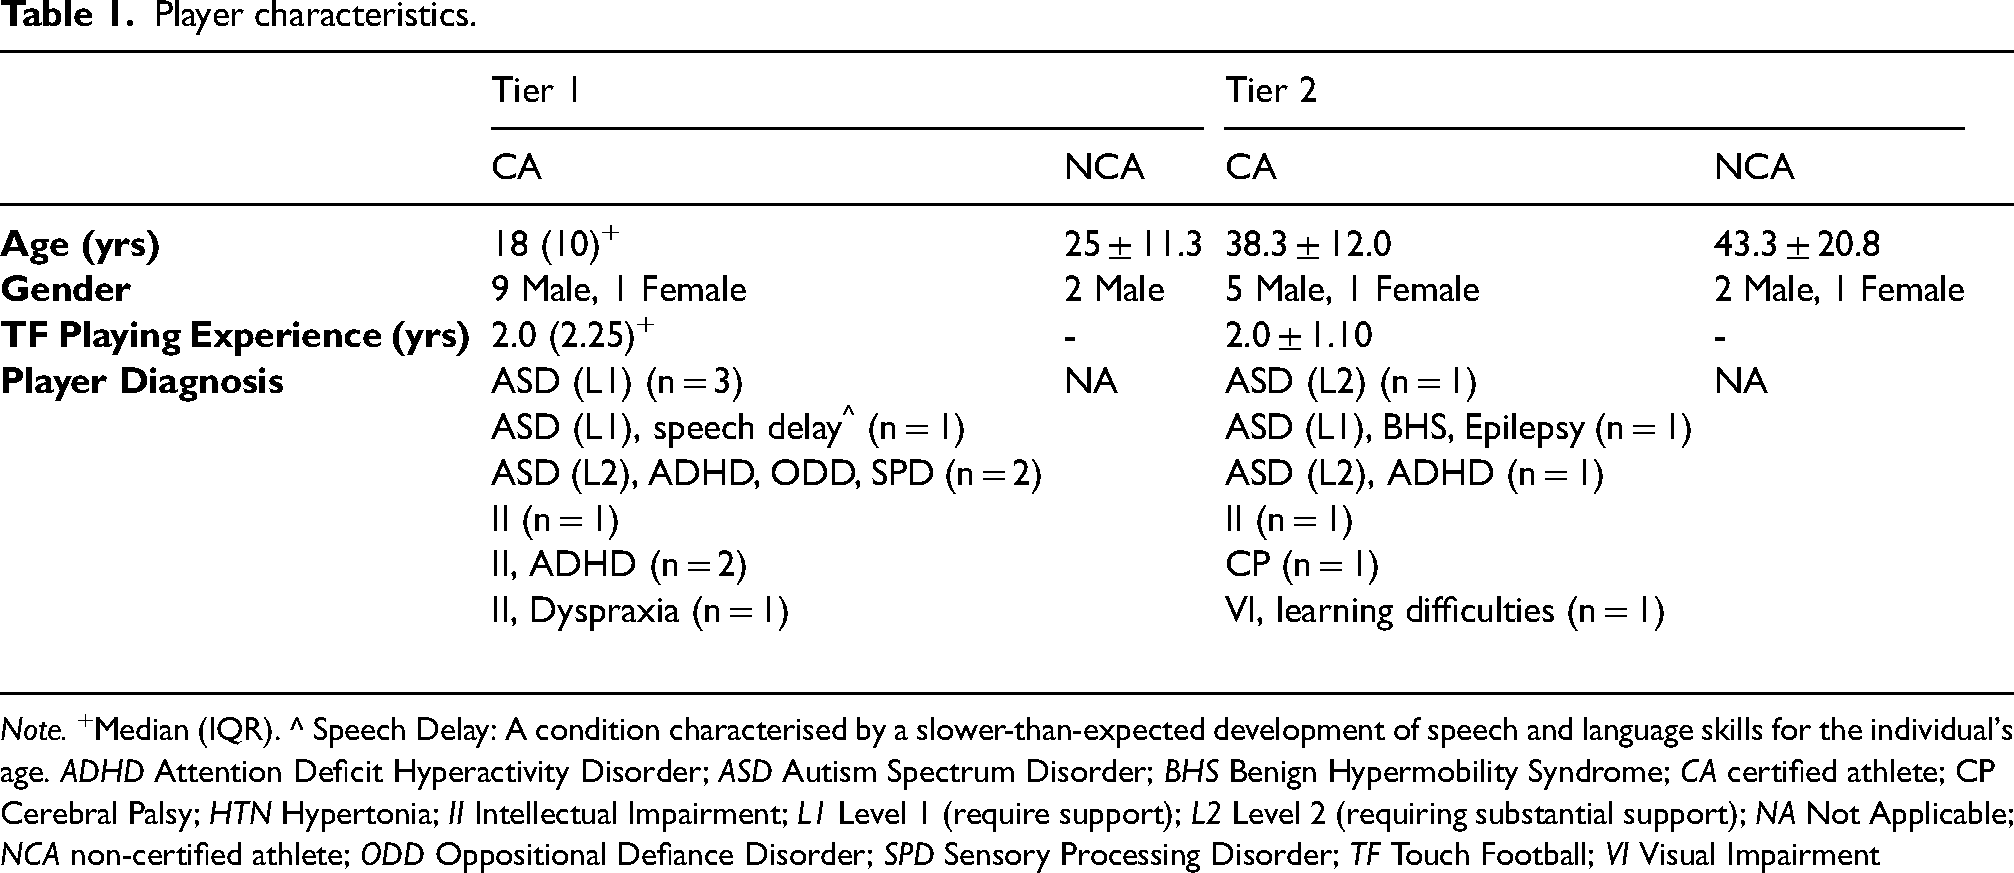
Note. +Median (IQR). ^ Speech Delay: A condition characterised by a slower-than-expected development of speech and language skills for the individual's age. ADHD Attention Deficit Hyperactivity Disorder; ASD Autism Spectrum Disorder; BHS Benign Hypermobility Syndrome; CA certified athlete; CP Cerebral Palsy; HTN Hypertonia; II Intellectual Impairment; L1 Level 1 (require support); L2 Level 2 (requiring substantial support); NA Not Applicable; NCA non-certified athlete; ODD Oppositional Defiance Disorder; SPD Sensory Processing Disorder; TF Touch Football; VI Visual Impairment
Physical match performance
Tier 1 certified athletes averaged 19.7 ± 7.4 min of playing time, covering 1878.7 ± 696.3 m at an intensity of 96.6 ± 5.4 m/min, with a maximum speed of 7.0 ± 1.0 m/s. They recorded 155.0 ± 47.0 accelerations and 147.7 ± 40.6 decelerations per game. In comparison, Tier 2 certified athletes averaged 7.4 ± 2.1 min of playing time, covering 625.4 ± 225.8 m at an intensity of 82.0 ± 9.2 m/min, with a maximum speed of 5.6 ± 1.4 m/s. They recorded 50.1 ± 22.6 accelerations and 50.8 ± 21.8 decelerations per game.
Figure 1 shows the percentage breakdown of distance covered in each speed zone across the games for Tier 1 and Tier 2 certified athletes. On average, Tier 1 certified athletes covered 38% of their total distance in the walking zone, 40% in the jogging zone, 18% in the running zone, and 5% in the sprinting zone. In comparison, Tier 2 certified athletes covered 48% of their total distance in the walking zone, 35% in the jogging zone, 13% in the running zone, and 4% in the sprinting zone.
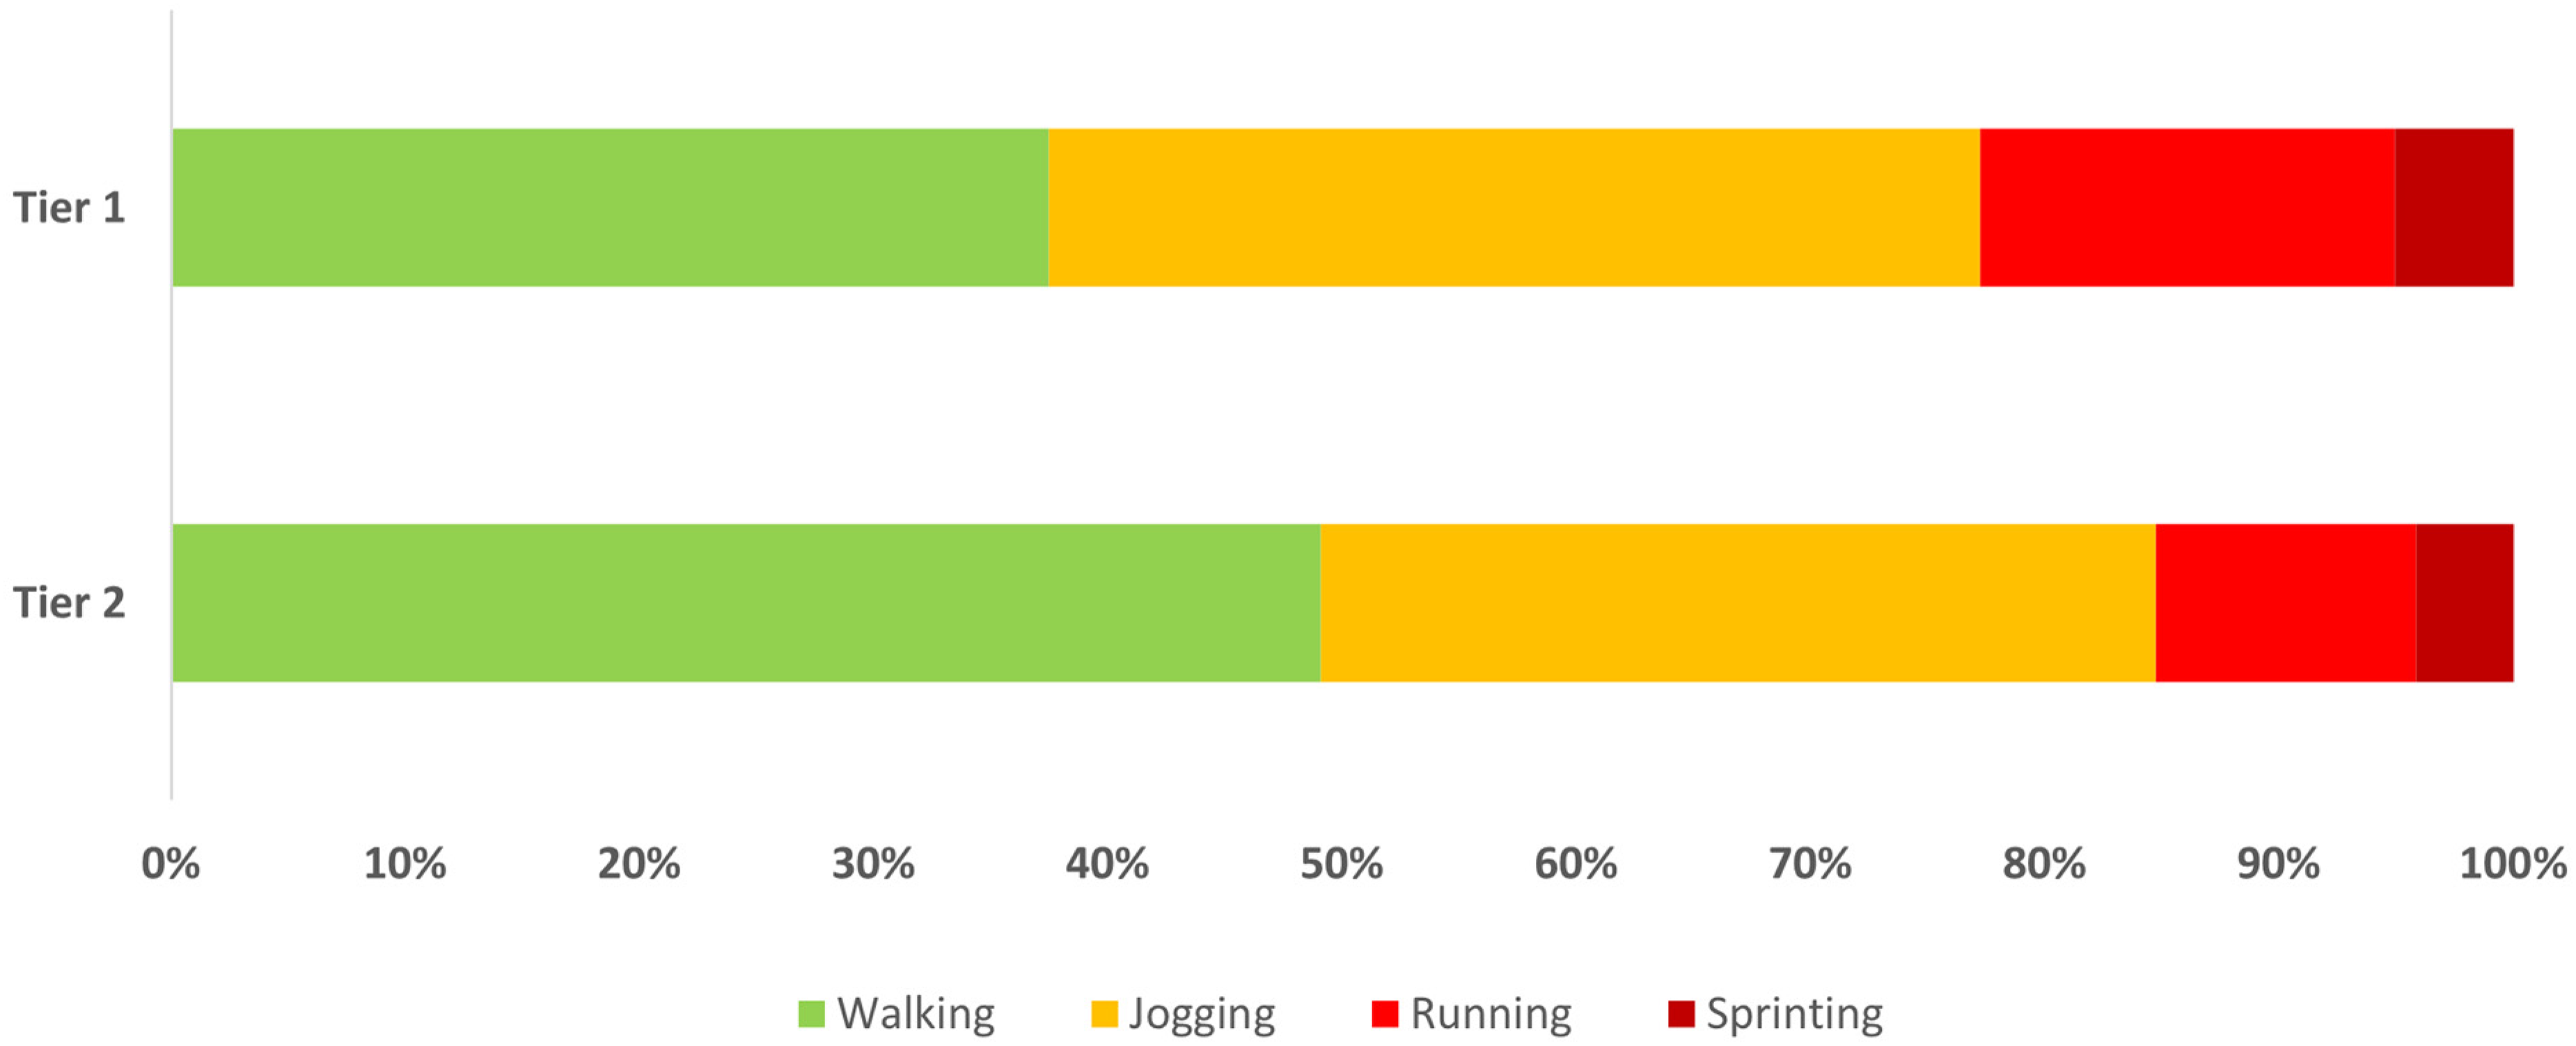
Percentage of distance covered in each speed zone over four games for Tier 1 and Tier 2 certified athletes.
One non-certified athlete from each tier (same player) wore a unit for all games. The Tier 1 non-certified athlete played an average of 16.7 ± 7.3 min, covering 1611.0 ± 745.8 m at an intensity of 96.1 ± 6.0 m/min and reaching a maximum speed of 7.4 ± 0.5 m/s. This player recorded 140.0 ± 74.5 accelerations and 132.3 ± 57.8 decelerations per game, covering 35% of their total distance in the walking zone, 39% in the jogging zone, 19% in the running zone, and 7% in the sprinting zone. The Tier 2 non-certified athlete averaged 12.4 ± 3.5 min of playing time, covering 976.0 ± 244.5 m at an intensity of 79.9 ± 10.5 m/min and achieving a maximum speed of 6.2 ± 0.9 m/s. This player recorded 82.0 ± 20.6 accelerations and 77.5 ± 24.9 decelerations per game, covering 56% of their total distance in the walking zone, 34% in the jogging zone, 7% in the running zone, and 3% in the sprinting zone.
Tables 2 and 3 provide a comparative analysis of the match demands for certified athletes for both tiers, respectively. Most metrics did not show significant differences within each tier, but intensity (m/min) varied significantly. For Tier 1, significant differences were found between Game 1 and 2 (mean difference = 10.2, p = 0.016) and between Game 1 and 3 (mean difference = 8.3, p = 0.012). For Tier 2, significant differences were observed between Game 1 and 2 (mean difference = 17.0, p = 0.050) and between Game 3 and 2 (mean difference = 12.8, p = 0.019).
Tier 1 certified athletes: Comparison of match demands.
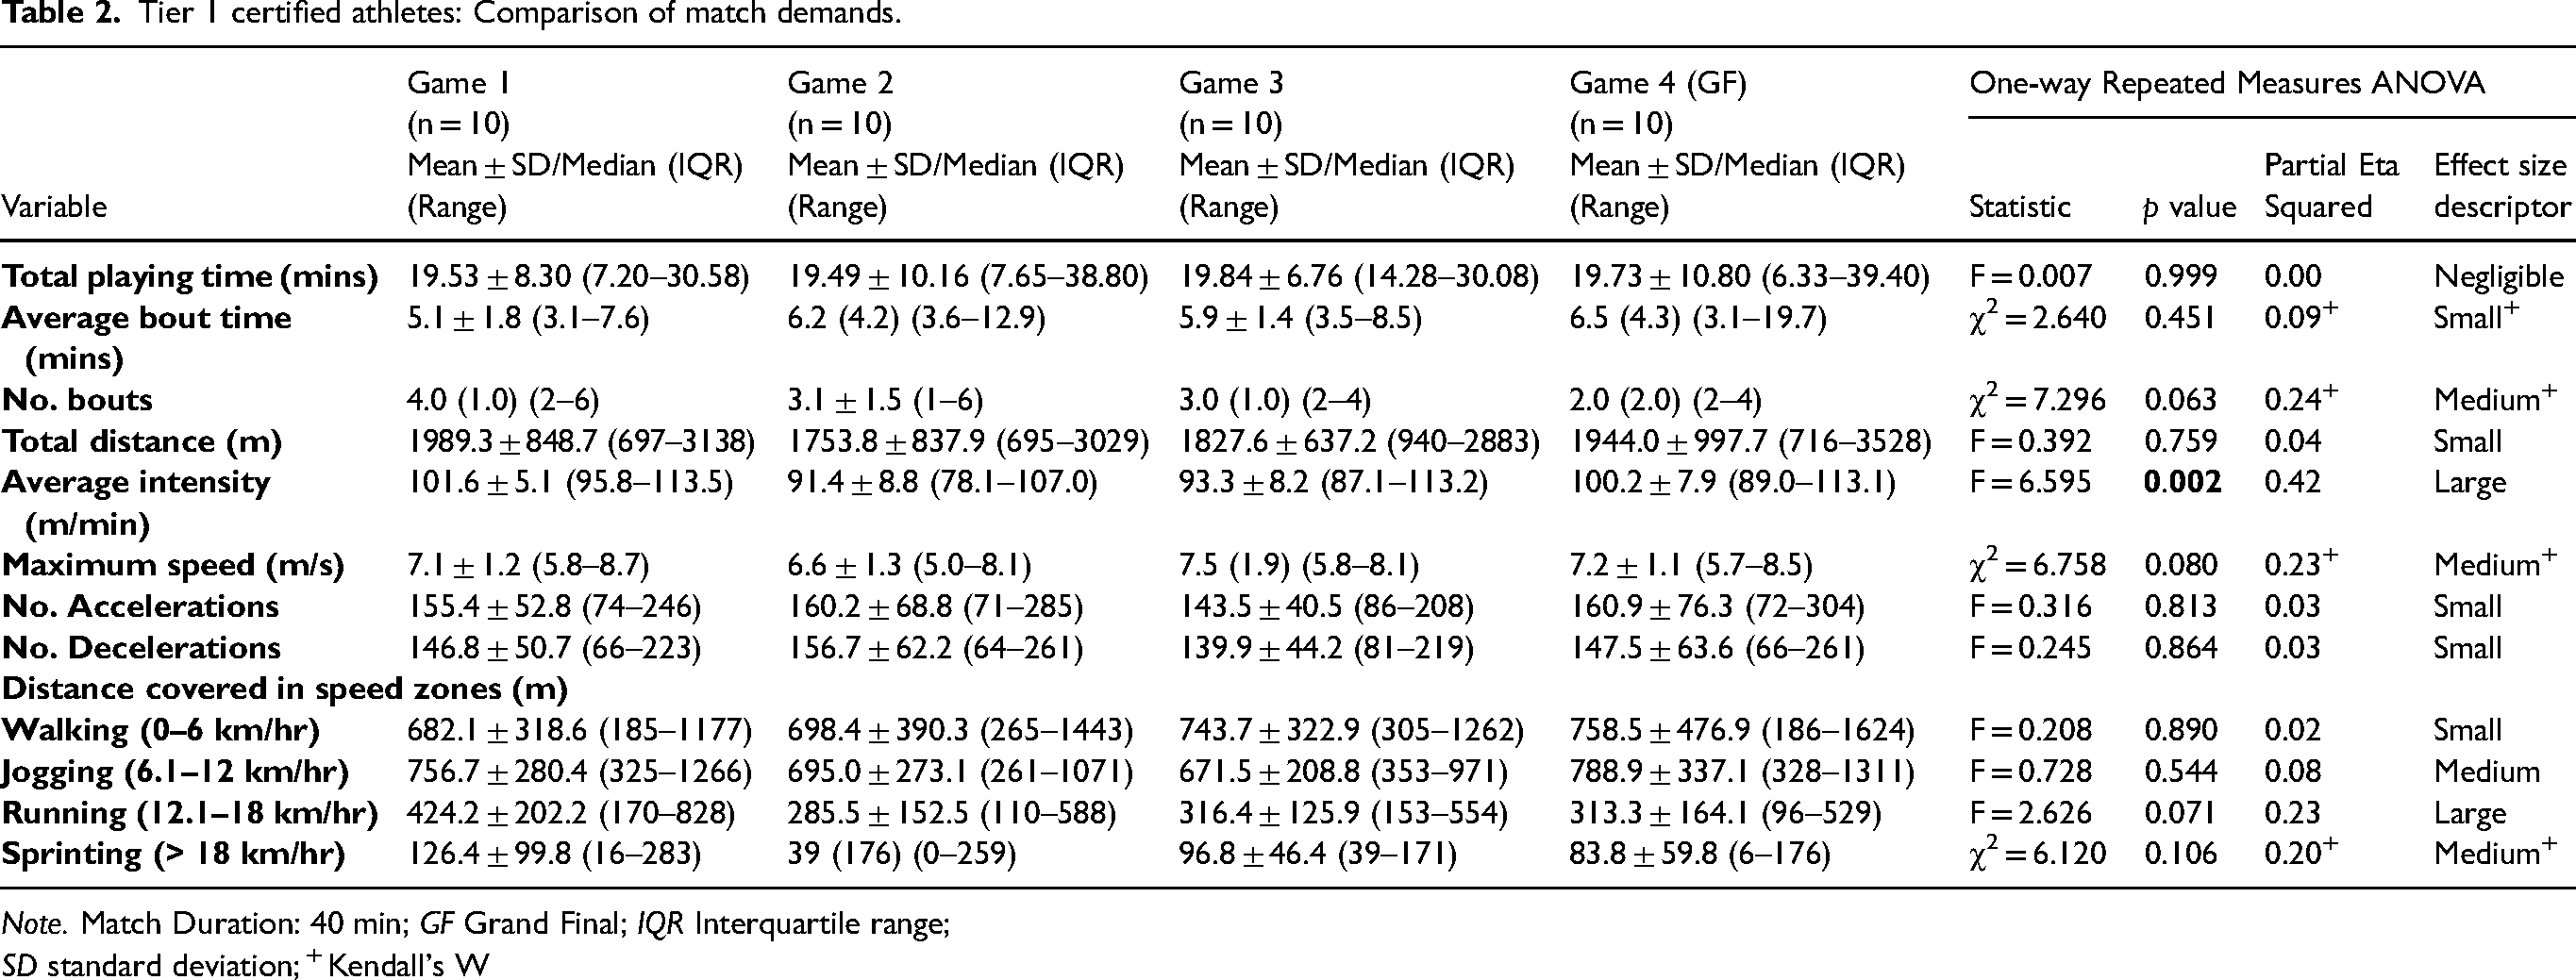
Note. Match Duration: 40 min; GF Grand Final; IQR Interquartile range;
SD standard deviation; + Kendall's W
Tier 2 certified athletes: Comparison of match demands.
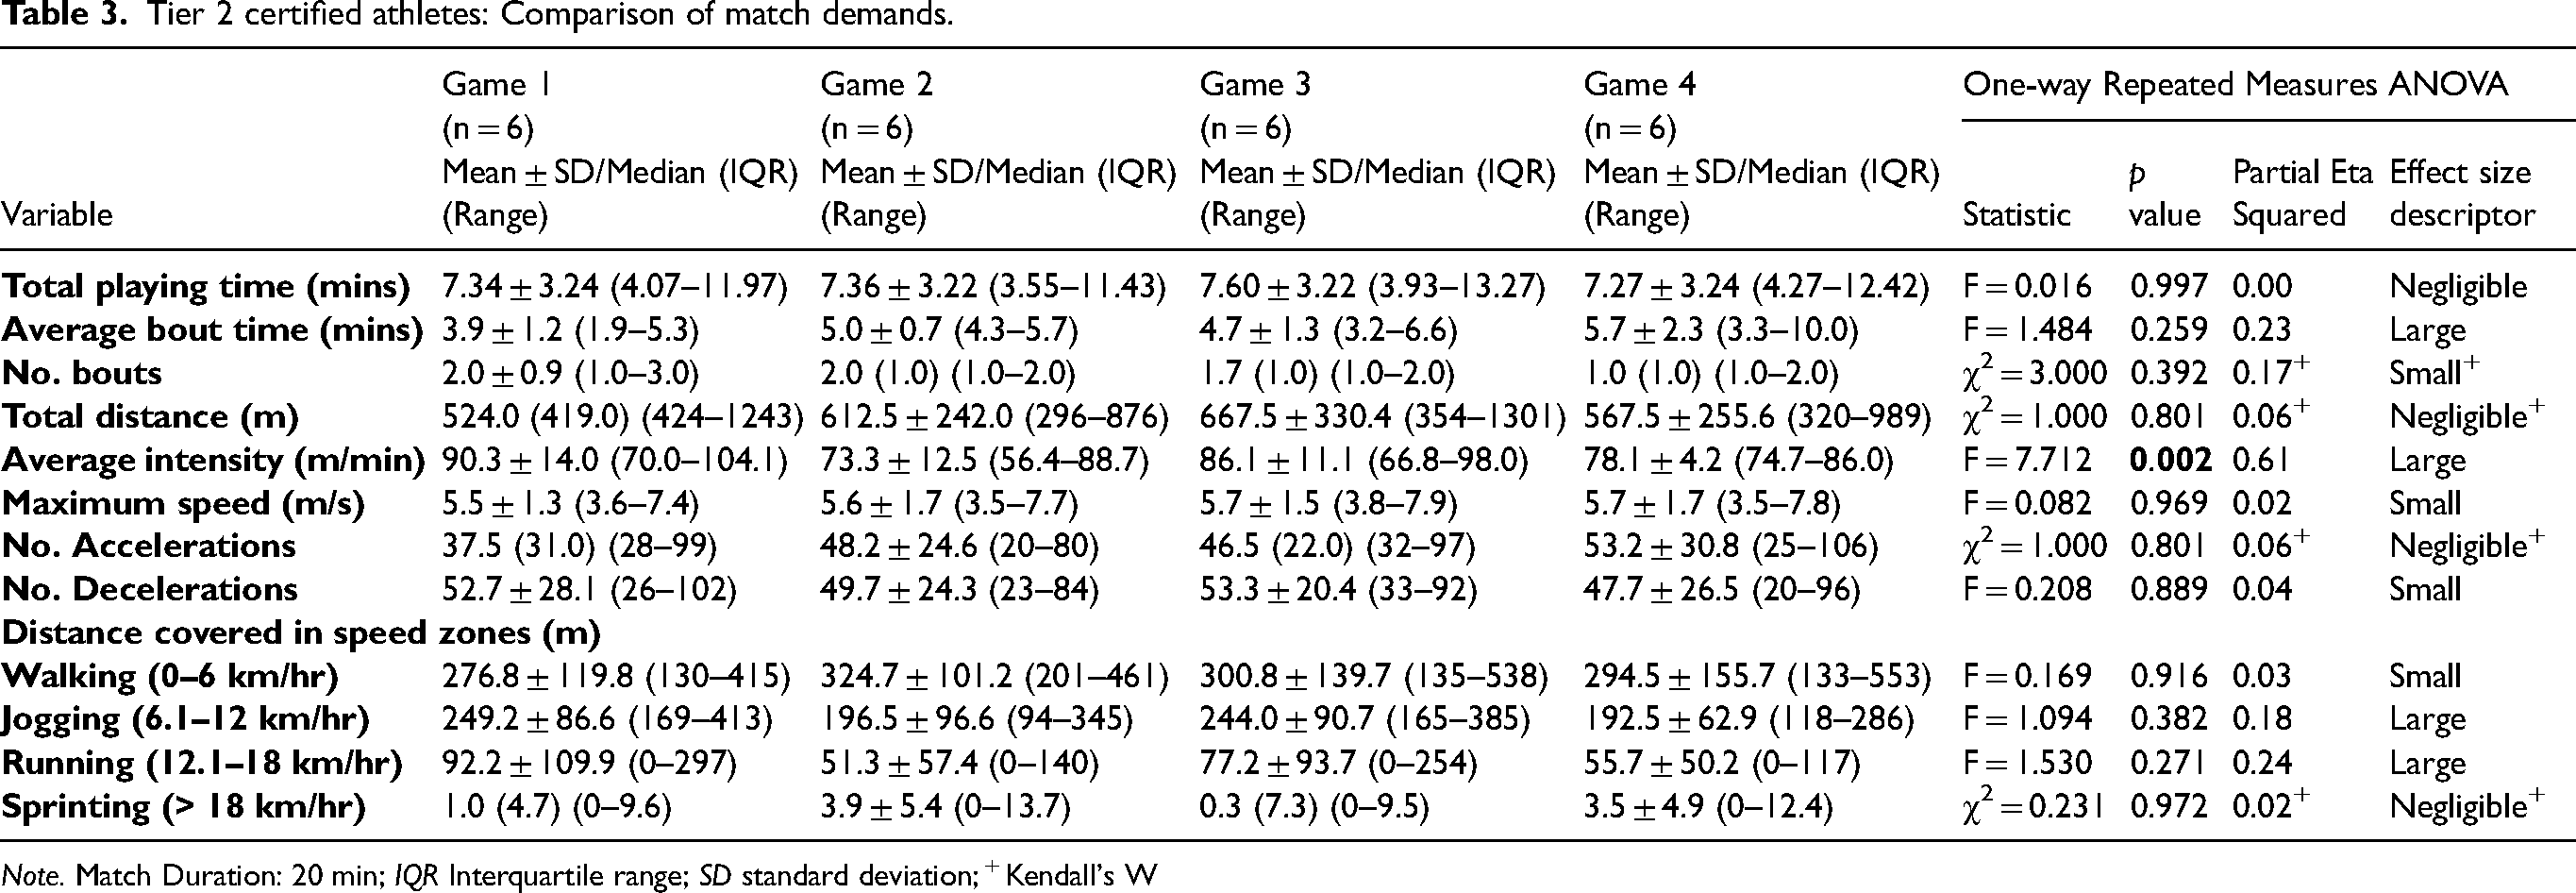
Note. Match Duration: 20 min; IQR Interquartile range; SD standard deviation; + Kendall's W
Table 4 displays the demands per minute of playing time, averaged over games, for both Tier 1 and Tier 2 certified athletes. Tier 1 demonstrated higher values across all variables compared to Tier 2, except for metres covered in the walking zone. Significant differences were observed in maximum speed (p = 0.042), number of accelerations (p = 0.041) and metres covered in jogging zone (p = 0.010). No significant differences were found for intensity (p = 0.127), number of decelerations (p = 0.099), metres covered in walking (p = 0.057), running (p = 0.055) and sprinting (p = 0.611) zones.
Comparison of match demands between Tier 1 and Tier 2 certified athletes, normalised to per minute of playing time and averaged over four games.
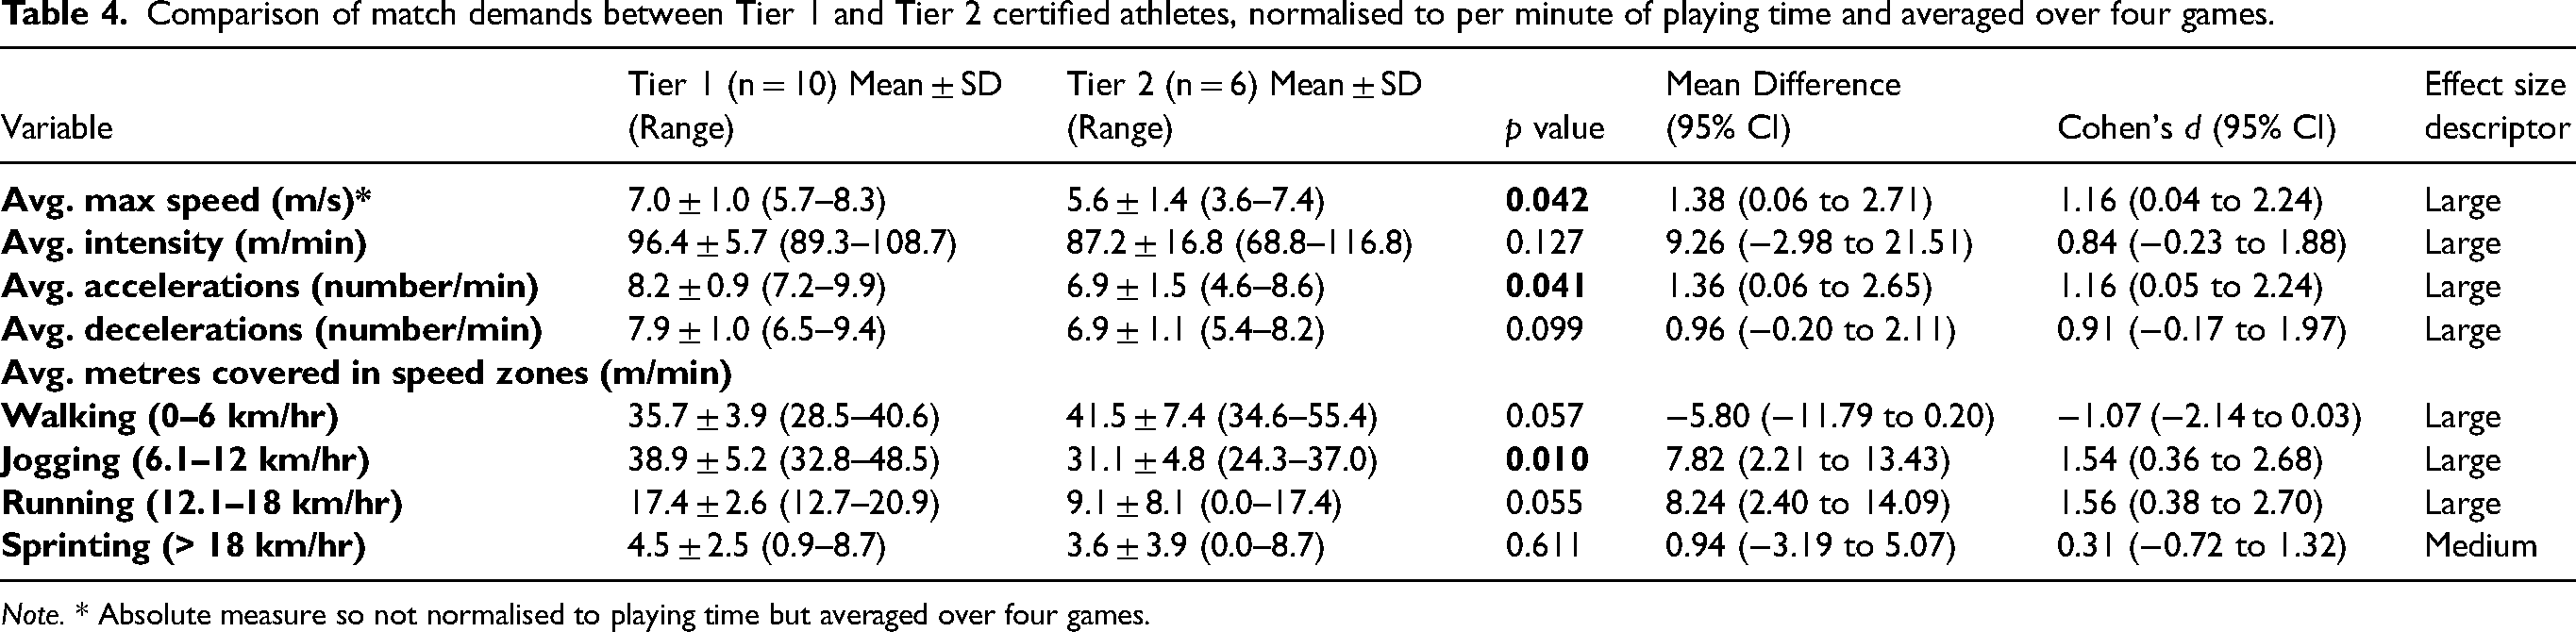
Note. * Absolute measure so not normalised to playing time but averaged over four games.
Technical match performance
Figure 2 displays the percentage breakdown of average game involvements for each tier, highlighting the contributions of each playing group (i.e., certified athletes and non-certified athletes). In Tier 1, certified athletes exhibited a higher percentage of involvement across all variables compared to non-certified athletes: roll balls (89%), dummy half pickups (74%), passes (72%), catches (84%), defensive touches (89%), ball handling errors (91%). In Tier 2, certified athletes had a higher percentage of involvements in roll balls (68%), catches (58%), defensive touches (52%) and ball handling errors (77%). However, non-certified athletes showed greater involvement in dummy half pickups (71%) and passes (71%). A breakdown of total involvements per game for each tier is available in Supplementary Material 3.
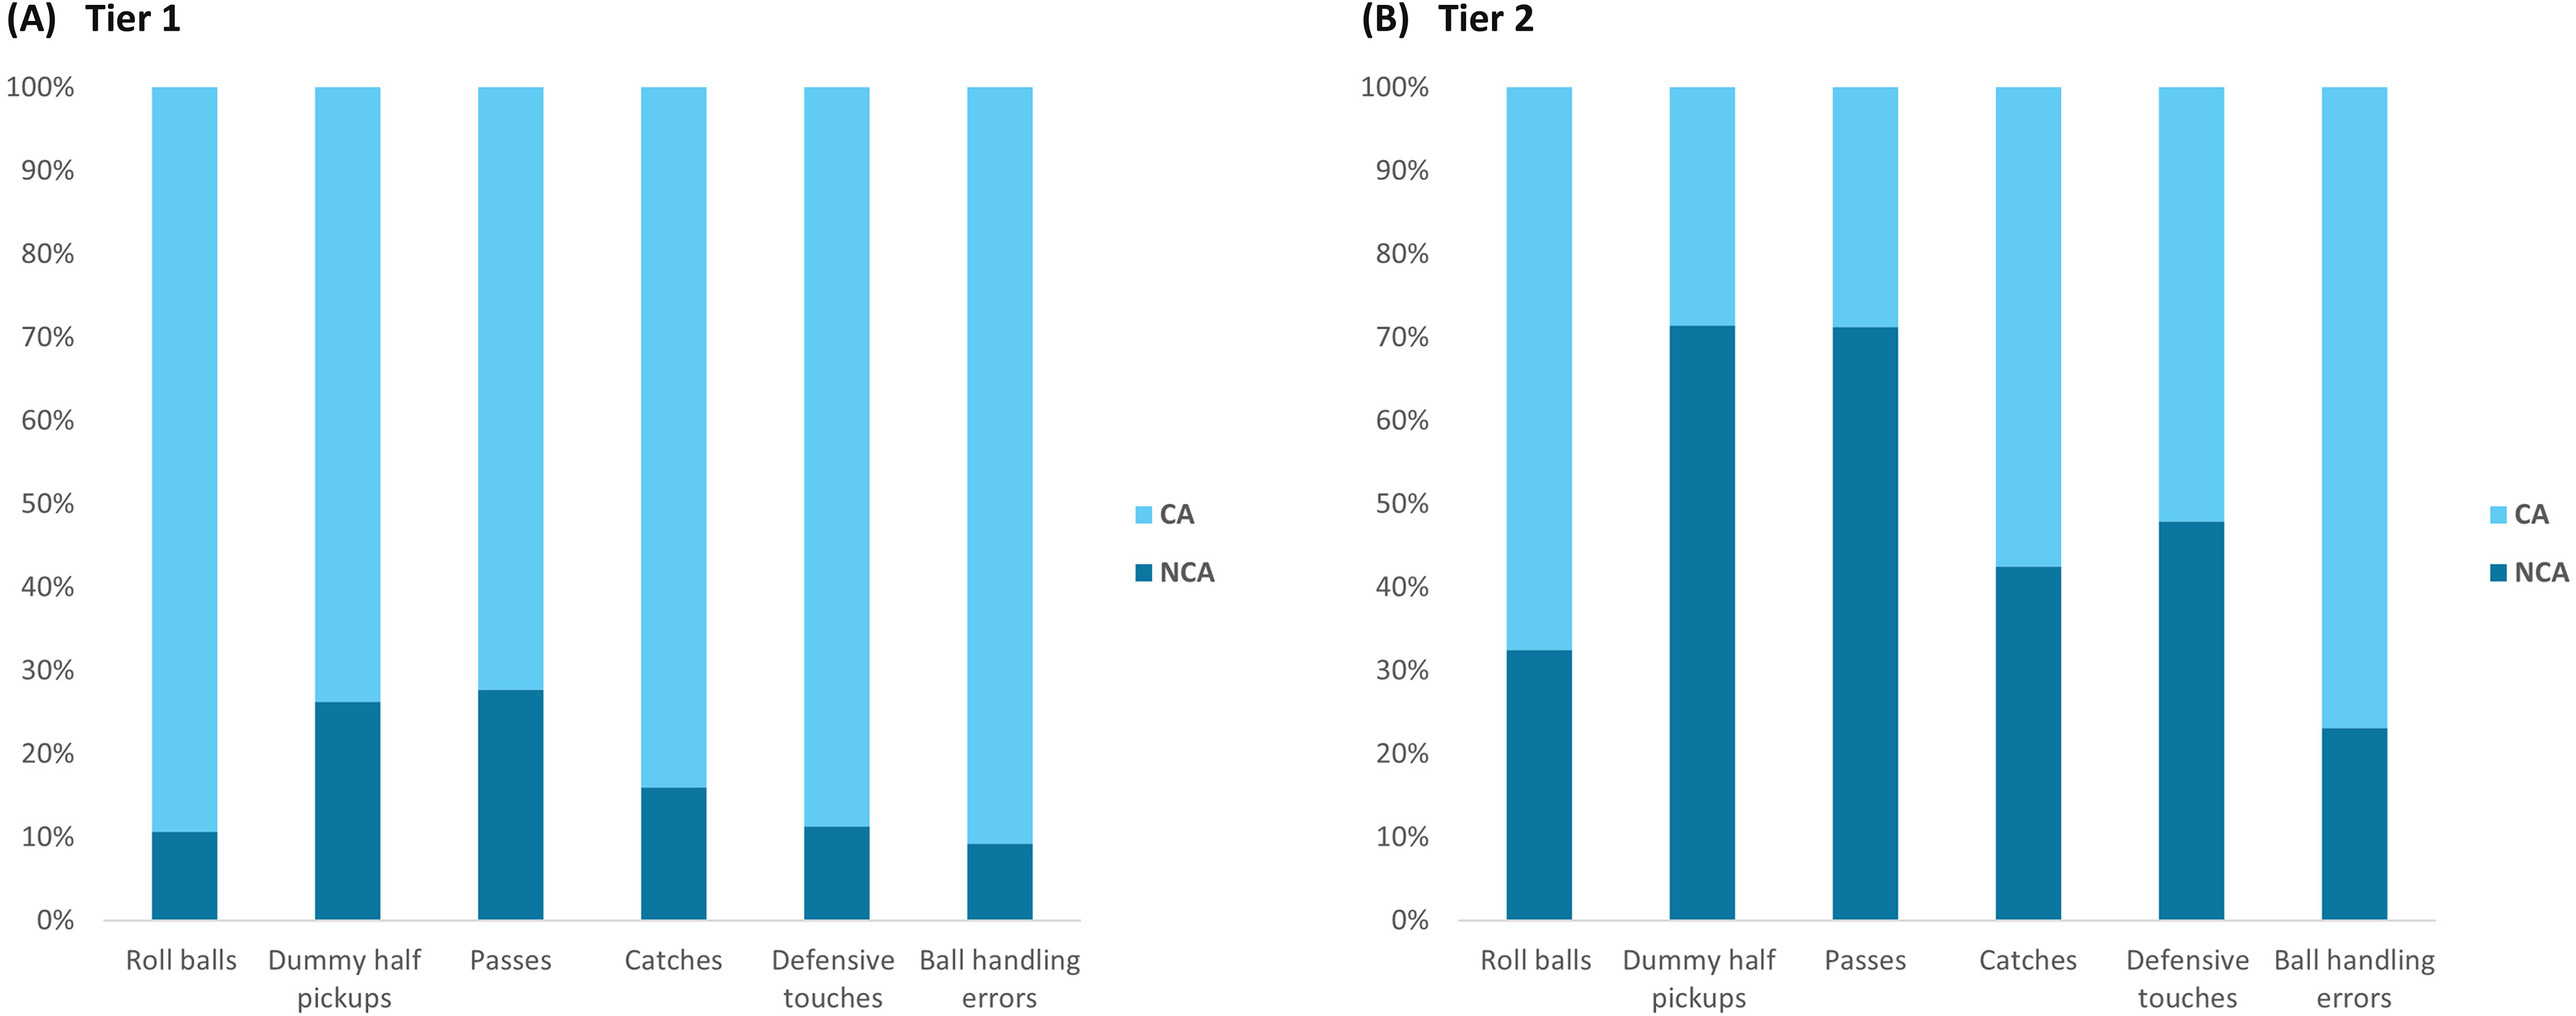
(A) Percentage breakdown of average game involvements for certifed athletes (CA) and non-certified athletes (NCA) in Tier 1; (B) Percentage breakdown of average game involvements for certifed athletes (CA) and non-certified athletes (NCA) in Tier 2.
Table 5 presents the game involvements per minute of playing time averaged across games for both the combined group of certified and non-certified athletes, as well as for certified athletes in Tier 1 and Tier 2. In the combined group, significant differences were found for roll balls (p = 0.026), catches (p = 0.041), and ball handling errors (p = 0.034). Among certified athletes, significant differences between tiers were found for dummy half pickups (p = 0.002) and passes (p = 0.018). No significant differences were found for roll balls (p = 0.077), catches (p = 0.263), defensive touches (p = 0.349) and ball handling errors (p = 0.094).
Game involvements per minute of playing time averaged across games for certified and non-certified athletes combined, as well as certified athletes in Tier 1 and Tier 2.
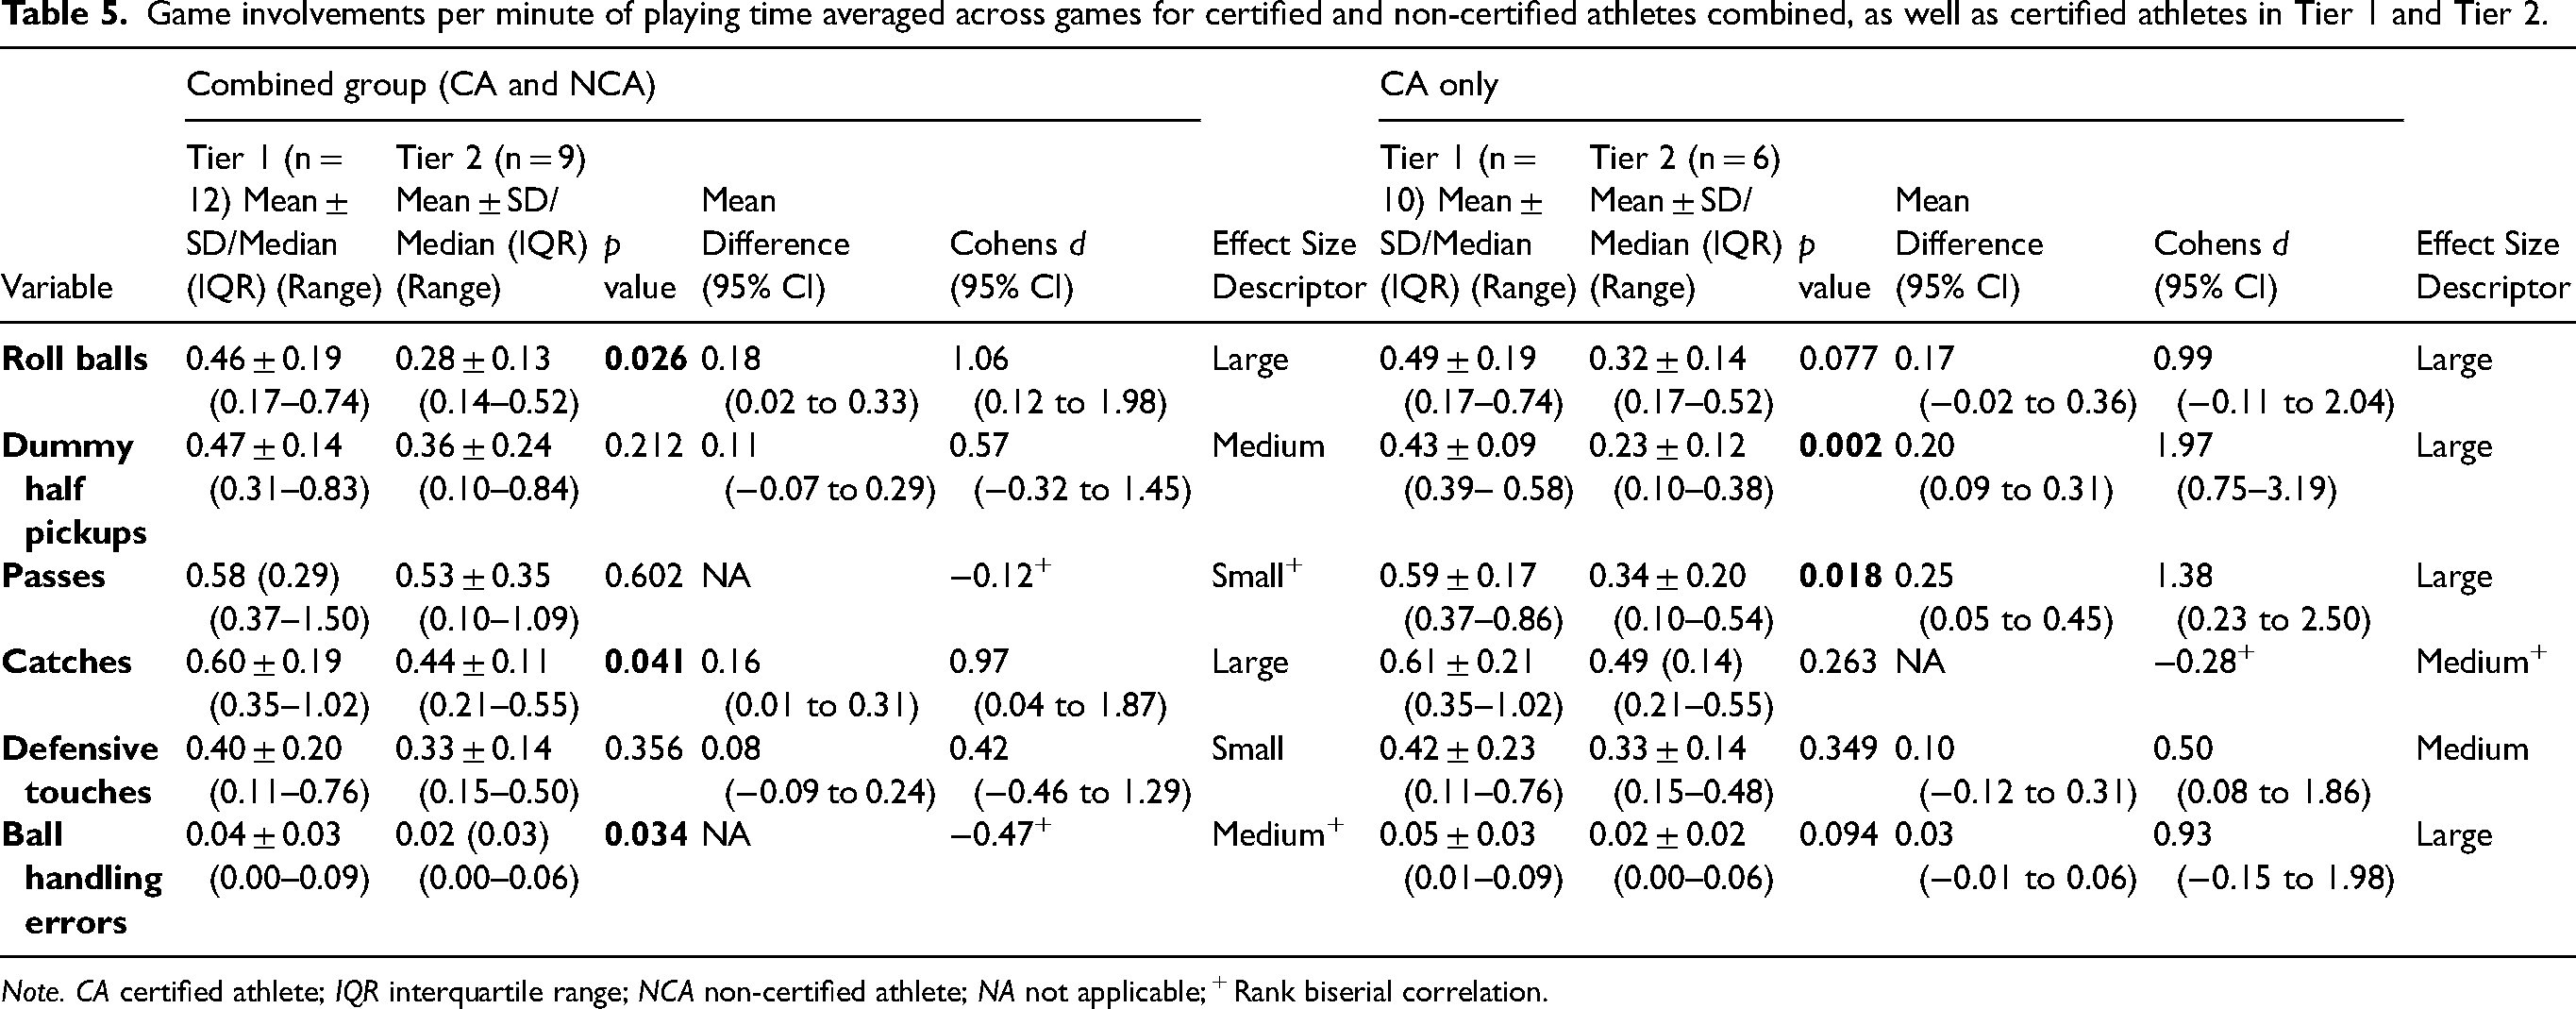
Note. CA certified athlete; IQR interquartile range; NCA non-certified athlete; NA not applicable; + Rank biserial correlation.
Subgroup analysis
Individual z-scores and player rankings for each physical and technical performance variable, along with the physical performance components for the functional and field-based measures, are provided in Supplementary Material 4. Supplementary Material 5 provides the correlations between individual variables and total test scores for physical and technical match performance. Figure 3 displays the player rankings based on the respective total test scores.
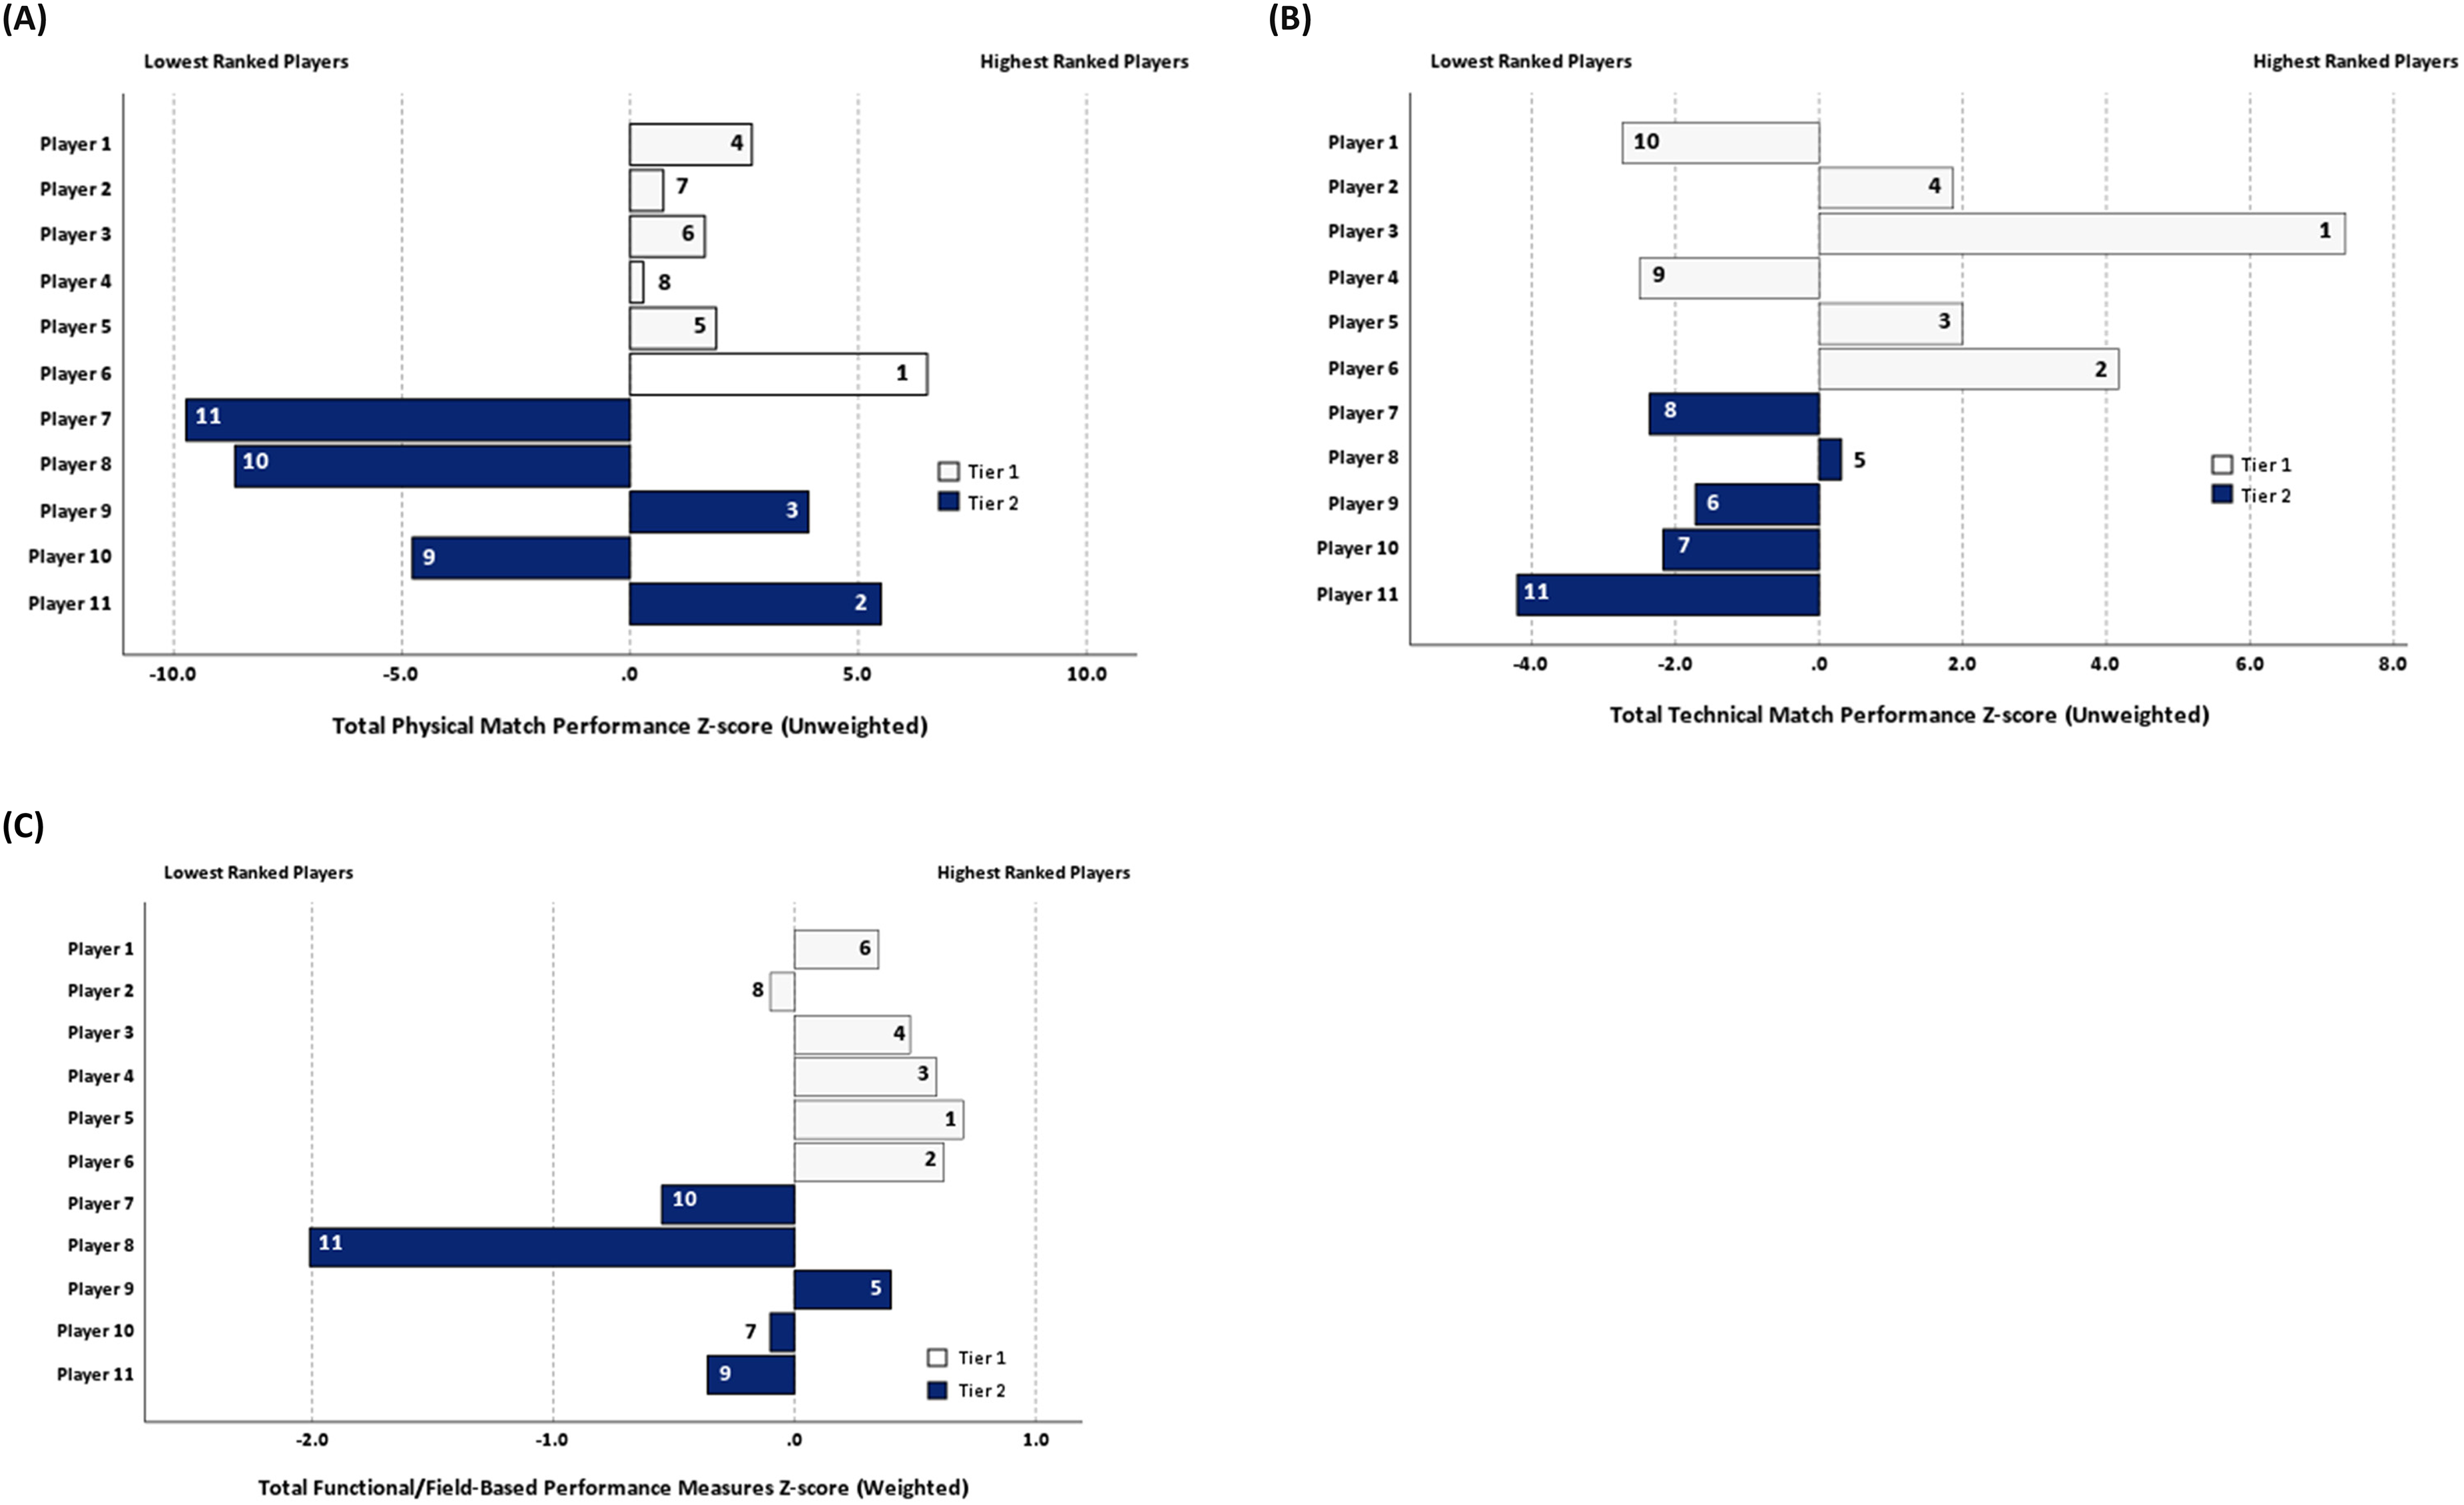
(A) Total physical match performance z-score (unweighted); (B) Total technical match performance z-score (unweighted); (C) Total z-score functional/field-based performance measures (weighted). Player rankings reflect combined performance across all variables. The number on each bar represents the player's rank. Player diagnosis:
Players with intellectual impairments, including those with neurodevelopmental disorders (i.e., autism spectrum disorder), displayed considerable variation in physical match performance. The player with CP ranked in the bottom half across all metrics, with the exception of distance in the walking zone. Notably, four of the six Tier 1 players were among the top six overall for physical match performance (Figure 3A).
Strong significant positive correlations were found between total test score and maximum speed (r = 0.76, p = 0.007), intensity (r = 0.91, p < 0.001) and number of accelerations (r = 0.86, p < 0.001). Moderate significant positive correlations were found between total test score and number of decelerations (r = 0.67, p = 0.024), distance in jogging (r = 0.67, p = 0.023), running (rs = 0.63, p = 0.039) and sprinting zones (r = 0.73, p = 0.011). Among the individual variables, strong significant correlations were found between maximum speed and metres in the sprinting zone (r = 0.83, p = 0.001), the number of accelerations and decelerations (r = 0.85, p < 0.001), the number of accelerations and metres in the jogging zone (r = 0.77, p = 0.006), intensity and the number of accelerations (r = 0.73, p = 0.011) and between intensity and metres in the sprinting zone (r = 0.79, p = 0.004). Moderate significant correlations were found between maximum speed and intensity (r = 0.66, p = 0.027), metres in the running zone (rs = 0.68, p = 0.021); intensity and distance in the jogging zone (r = 0.65, p = 0.029), and the number of decelerations and distance in the jogging zone (r = 0.68, p = 0.023).
Regarding technical match performance, one player with an intellectual impairment consistently ranked first across all successful outcomes. The player with CP consistently ranked in the top half of the cohort for all successful outcomes. Additionally, the player with a dual disability (intellectual impairment, dyspraxia) ranked in the top three for dummy half pickups, passes, defensive touches and ball handling errors (indicating fewer errors). Notably, four of the six Tier 1 players were ranked among the top six players for technical match performance (Figure 3B).
Strong significant correlations were observed between total test score and roll balls (r = 0.76, p = 0.007), dummy half pickups (r = 0.85, p < 0.001), passes (r = 0.85, p < 0.001) and catches (r = 0.79, p = 0.004). Among the individual variables, strong significant correlations were observed between roll balls and catches (r = 0.91, p < 0.001) and between dummy half pickups and passes (r = 0.89, p < 0.001). Moderate significant correlations were observed for dummy half pickups and roll balls (r = 0.64, p = 0.035). A moderate negative correlation was observed between ball handling errors and roll balls (rs = −0.66, p = 0.027). No significant correlations were found between the individual physical and technical match performance variables, or between these variables and touch football playing experience.
Table 6 shows the correlations between each technical and physical variable and the physical performance components of field-based measures. For physical match performance, strong significant correlations were found between maximum speed and power (r = 0.77, p = 0.006), speed (rs = 0.90, p < 0.001), CODS (rs = 0.82, p = 0.002), and between speed and intensity (rs = 0.77, p = 0.005). Moderate significant correlations were observed between maximum speed and strength (r = 0.70, p = 0.017), motor coordination (r = 0.66, p = 0.028) and endurance (r = 0.72, p = 0.012); between motor coordination and number of accelerations (r = 0.70, p = 0.016) and decelerations (r = 0.64, p = 0.034); between metres in the running zone and power (rs = 0.63, p = 0.038), speed (rs = 0.73, p = 0.011) and endurance (rs = 0.64, p = 0.035); and between metres in the sprinting zone and speed (rs = 0.75, p = 0.009). For technical match performance, while moderate correlations with field-based measures were observed, none were statistically significant.
Correlations between technical and physical match performance variables and individual performance components.
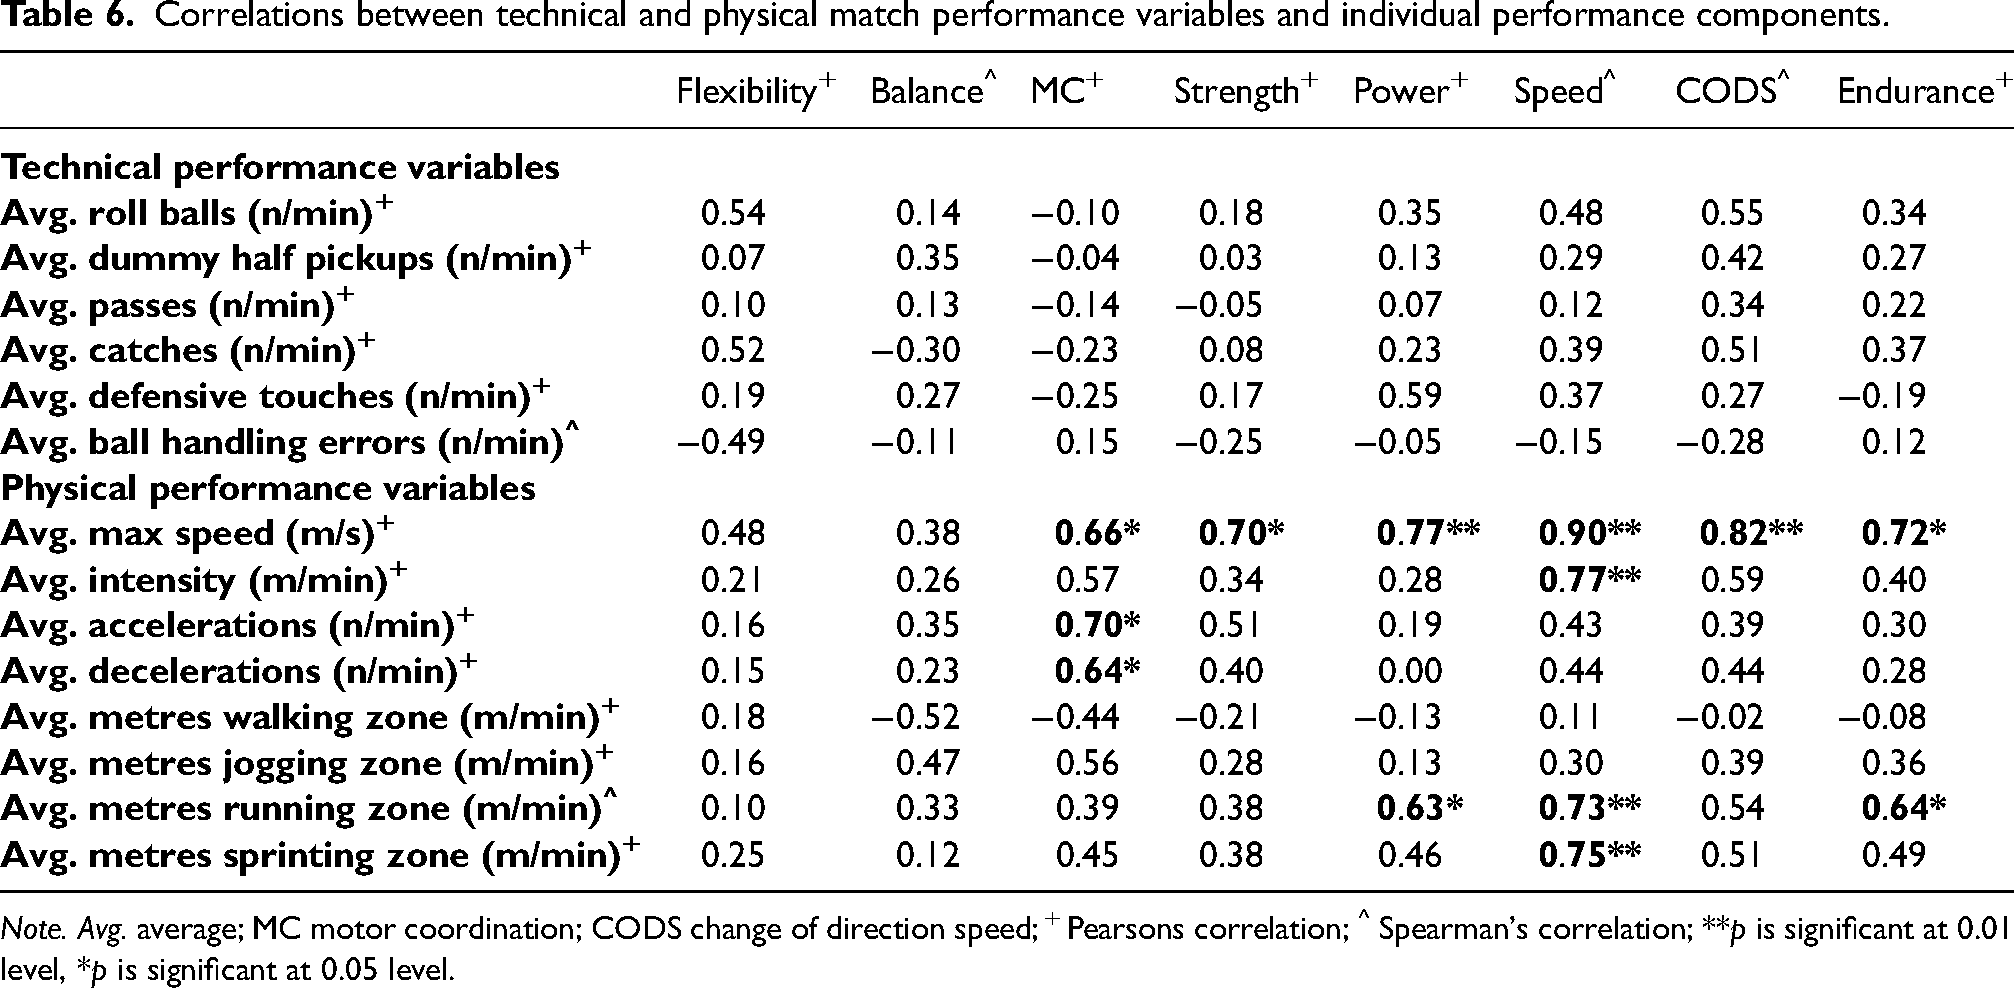
Note. Avg. average; MC motor coordination; CODS change of direction speed; + Pearsons correlation; ^ Spearman's correlation; **p is significant at 0.01 level, *p is significant at 0.05 level.
Discussion
This study offers an initial exploratory evaluation of the physical and technical match demands of AATF players and their associations with various functional and field-based measures. Despite the absence of an existing framework, our findings revealed differences in the physical and technical performances of Tier 1 and Tier 2 certified athletes, with Tier 1 players playing at a higher intensity and demonstrating more frequent game involvements. The observed correlations between motor coordination, strength, power, speed, CODS and endurance with key physical match performance metrics like maximum speed, number of accelerations/decelerations and distance covered in running and sprinting zones suggest the potential importance of these physical components for match performance. These insights may provide a foundation for the future development of a classification framework tailored to the specific demands of AATF.
Tier 1 certified athletes demonstrated a higher intensity of play, characterised by greater distances covered in jogging, running, and sprinting zones, along with higher maximum speeds, and more frequent accelerations and decelerations compared to Tier 2 certified athletes (Table 4). Conversely, Tier 2 certified athletes covered more distance in the walking zone, suggesting a lower intensity of play. While these patterns may reflect differences in player ability, they could also be shaped by broader team dynamics or match conditions that vary between tiers. Compared to previous research on 40-min matches, Tier 1 players covered fewer metres per minute, engaged in fewer bouts, and had longer bout durations than international and regional male touch football players. 1 These differences are likely attributed to variations in playing levels and competition standards. Although the speed zones defined in this study limit direct comparisons with earlier touch football research,1–3,13 it is important to note that both our study and previous research consistently show that most distance covered occurs at lower intensity levels, reflecting the intermittent nature of touch football.
The higher intensity observed in Tier 1 games may be associated with a greater number of game involvements, such as more frequent ball handling, errors, and defensive actions. However, despite these observations, the subgroup analysis, which includes both Tier 1 and Tier 2 certified athletes, did not establish a clear relationship between physical and technical match performance measures. This finding could be influenced by several factors, including the specific demands of the game, the ability of the opposition, team tactics, individual impairments, or the inclusion of non-certified athletes. For example, in international CP football players, physical performance metrics have been shown to vary depending on contextual factors such as team ranking, the quality of the opposition, and match outcomes. 31 Similarly, individual impairments may also play a role. Impairments such as autism spectrum disorder can result in slower processing speeds, 32 which may affect a player's ability to quickly understand and react to game situations. This cognitive challenge might hinder technical performance despite demonstrating strong physical capabilities. On the other hand, a player with a physical impairment might possess a better understanding of the game but face limitations due to mobility constraints.
The wide range of physical and technical performance measures observed both within and across tiers points to the potential value of developing a classification framework that can accommodate the diverse abilities within AATF. The current absence of such a framework has led to rule modifications aimed at balancing participation and performance opportunities, notably through the inclusion of non-certified athletes. The role of non-certified athletes’ involvement is evident in the number of dummy half pickups and passes observed in the combined Tier 2 group compared to Tier 2 certified athletes alone, demonstrating their role in facilitating play by organising the ruck and supporting on-field decision-making, particularly for players with intellectual impairments (Table 5). This pattern may also be influenced by existing rules that prevent non-certified athletes from running directly from dummy half. In Tier 1, with only one non-certified athlete on the field, their contribution appears less significant. This raises questions about the necessity of their inclusion. While non-certified athletes may provide valuable support for players with greater support needs, their presence could also limit opportunities for those capable of performing at higher levels, suggesting a need to reevaluate the current rules regarding non-certified athlete participation.
Functional and field-based performance measures showed associations between maximum speed and motor coordination, strength, power, speed, and CODS (Table 6). Strength and power are crucial for generating the explosive force required for high-intensity movements such as sprinting, 33 which may explain the correlation between 40-m sprint test, intensity, and the distance covered in running and sprinting zones. A similar relationship has been observed in international CP football players, where a 30-m sprint test demonstrated moderate to strong correlations with the distance covered at moderate (12–21 km/hr) and high-intensity (> 21 km/hr) velocities during match play. 34 Additionally, effective execution of high-intensity movements relies on precise muscle coordination, 33 which may be reflected in the association between motor coordination and the number of accelerations and decelerations during matches. Although our study assessed motor coordination using the 9-HPT, which primarily evaluates fine motor skills, research in CP football has shown that moderate to high-intensity accelerations in match play are associated with motor coordination tasks like split jumps and side-stepping. 11 While endurance measures are typically excluded from classification batteries, the distance covered in the running zone showed a significant association with performance on the 6MWT. This finding aligns with previous research on national touch football players, where the Yo-Yo Intermittent Recovery Test (Yo-Yo IR1) was positively associated with relative distance (m/min) and high-speed running distance (> 14 km/hr), 35 suggesting that players with higher fitness levels may sustain longer periods of moderate to high-intensity efforts during a game. Similarly, findings in CP football have shown a positive association between Yo-Yo IR1 performance and the distance covered at high intensity (> 21 km/h) during match play. 34
While this study establishes a foundation for understanding the physical and technical variables during AATF match play and their associations with functional and field-based performance measures, it is important to acknowledge its limitations. The small sample size, which represents approximately 15% of the AATF NTL population, along with the inclusion of two teams from the same association, may limit the generalisability of the findings due to specific coaching strategies and team tactics. Additionally, GPS data were collected from only one non-certified athlete in each tier, which assumes that all non-certified athletes exhibit similar movement patterns on the field. Although their inclusion provides insights into the current game dynamics, it is important to consider that non-certified athletes impact on certified athletes performance may vary, and future research is needed to better understand their influence. The inclusion of both male and female players may have introduced additional variability in physical responses, as potential sex-based differences were not accounted for despite the mixed-sex format of AATF. Future research should aim to establish individualised thresholds for these players to accurately quantify their physical and physiological demands. Additionally, research should explore the relationship between performance measures and match performance in a larger sample of AATF players, while considering the influence of contextual factors. This research could offer valuable insights into integrating various technical and physical performance measures into a framework, though determining the appropriate weighting of these measures to reflect their significance will be a key challenge.
Conclusion
This study provides an initial exploration of the physical and technical performances of AATF players and offers preliminary insights into their associations with various functional and field-based performance measures. Although a classification framework does not currently exist, this study revealed key differences in physical and technical match performance variables between and across tiers and highlights the importance of physical measures such as motor coordination, strength, power, speed and CODS for AATF performance. Incorporating objective performance data into future efforts may help establish a more structured tiering system, improve player pathways, promote equitable playing opportunities, and support the future direction of AATF.
Supplemental Material
sj-docx-1-spo-10.1177_17479541251357946 - Supplemental material for Physical and technical demands in All Abilities Touch Football: Preliminary insights for sport development
Supplemental material, sj-docx-1-spo-10.1177_17479541251357946 for Physical and technical demands in All Abilities Touch Football: Preliminary insights for sport development by Taylor M. Wileman, Daniel A. Hackett, Marnee J. McKay, Michael Psarakis and Ché Fornusek in International Journal of Sports Science & Coaching
Footnotes
Data availability statement
The authors confirm that the data supporting the findings of this study are available within the article [and/or] its supplementary materials.
Declaration of conflicting interests
The authors declared no potential conflicts of interest with respect to the research, authorship, and/or publication of this article.
Ethical approval
Ethical approval was granted by the Human Research Ethics Committee at The University of Sydney (Approval no. 2022/040).
Funding
TW is funded by the Australian Government Research Training PhD scholarship and received the Sydney Musculoskeletal Health, Diversity, Inclusion. Culture and Equity Award, which supported this research. No other sources of funding were used to assist in the preparation of this manuscript.
Supplemental material
Supplemental material for this article is available online.
References
Supplementary Material
Please find the following supplemental material available below.
For Open Access articles published under a Creative Commons License, all supplemental material carries the same license as the article it is associated with.
For non-Open Access articles published, all supplemental material carries a non-exclusive license, and permission requests for re-use of supplemental material or any part of supplemental material shall be sent directly to the copyright owner as specified in the copyright notice associated with the article.