
Abstract
In racquet sports, the serve is considered an important aspect of performance and tactical match play. This is also the case in Para table tennis, yet the advantage of the server and how it differs across impairment classes has not been established. This study aimed to model serve advantage in Para table tennis, as well as provide a framework for identifying serve-return tactics. A convenience sample of shot-level data from 71 Para table tennis matches completed during the 2021–2024 Paralympic cycle were analysed. The win probability of the server, conditioned on shot turn and shot number, was modelled using Bayesian hierarchical logistic regression. A two-step clustering process was used to identify recurring point characteristics using the bounce locations of the first four shots of a rally. The estimated advantage within a point alternated such that the point win probability was lower for whichever players turn it was to play a shot. The exception was the serve, meaning that the server had a higher point win probability for the first two shots in a rally before the alternating pattern began. There were no clear differences in the serve advantage model between impairment classes. Point cluster frequencies differed by class in the sample of matches analysed. These findings suggest that, in the sample of athletes considered, the magnitude of serve advantage does not differ between impairment classes, despite potential differences in shot location characteristics.
Introduction
Para table tennis was included in the first Paralympic games in 1964 and has been part of every games since. 1 Para table tennis modifies standard table tennis for athletes with impairments through a classification system based on functional ability, such as wheelchair use or standing impairments. Athletes are classified based upon their impairment into one of 11 classes, with classes 1–5 consisting of wheelchair players, 6–10 of standing players and 11 of players with an intellectual disability. 2 The core scoring and gameplay remain consistent with able-bodied table tennis. 1 Despite its long history of competition, para table tennis, like many other para sports, remains an under-researched subsection of elite-level sport. 3 An important aspect of the sport that forms a common area of investigation across all racquet sports is the serve, a critical factor in the point.
The presence of an advantage to the server in racquet sports is well established, including in table tennis,4–6 tennis,7–10 badminton 11 and padel.12,13 In these sports, the server is afforded the opportunity to dictate the beginning of the point, and it has proposed that this extra control is the mechanism by which the server can gain an advantage in a rally. 9 The magnitude of server advantage has been estimated by comparing average point win proportions.5,10,13 A more nuanced view of server advantage, and how it changes throughout the length of a rally, was provided by Montagna et al. 9 using a multilevel regression model in able-bodied tennis. Their model was also able to account for extraneous factors such as server, returner and court surface through the incorporation of multilevel parameters. 9 This approach has not yet been adapted to other racquet sports.
Compared to tennis, the characteristics of serve advantage in table tennis are less established, with current evidence suggesting it has a more muted serve advantage.6,14 The singular previous study on serve advantage in Para table tennis examined rally lengths and the point win probability for the server, and compared between sexes and impairment classes. 3 Rally lengths were typically shorter for females in sitting classes, and shorter in sitting class C1 (most impaired) compared to other sitting classes. 3 The mean winning percentage of the server was above 50% and did not significantly vary between classes. 3 However, when server winning percentage was compared after conditioning on the rally length (≤3 or 5 shots) some differences between classes were observed, suggesting that the nature or serve advantage may vary. 3 The duration of points (in seconds) was also shown to be vary between classes (shortest in class C1) at the 2016 Paralympic games. 15
Serve and return tactics are another area of research in racquet sports. Players can manipulate the direction, speed, and spin of serves and returns for tactical reasons in order to gain an advantage in a point.11,12,16–18 In tennis, spatiotemporal data from the Hawkeye system has facilitated cluster analyses of serve and return strategies.11,12,16 Tactical research in table tennis and Para table tennis is not as common due to less availability of shot location data.17–20 A study of the first four strokes in table tennis (including the serve) identified over 300 tactics when factoring in shot location and spin, 20 highlighting the diversity of tactics available and the need for practical tools that can be interpreted by coaches and athletes.
This study aimed to estimate the magnitude of serve advantage in a convenience sample Para table tennis matches, and how it changes with rally length and impairment class. A secondary aim was to explore a framework for identifying recurring serve-return patterns and tactics that coaches can use to compare trends between classes and establish effective tactics.
Methods
Data collection and processing
Data from 71 international Para table tennis singles matches played within the most recent Paralympic cycle (2021–2024) were analysed. This included matches from 62 athletes from 23 different countries, chosen based on their perceived importance for preparation of Australian Athletes for the 2024 Paris Paralympic Games. As such this represents a convenience sample, and results should be interpreted accordingly. Video of each match was sourced from public streams or filmed independently by Table Tennis Australia (TTA) analysts. Match footage was subsequently analysed using HUDL SportsCode to extract the following match, point, and shot-level data. Rally shot number, rally length, impairment class, server ID, returner ID, point winner (1 denotes server win, 0 denotes loss) and the (x, y) location of the ball bounce on the table. The bounce coordinates were collected in centimetre units using a half table coordinate system (152.5 cm wide and 137 cm long) with (0, 0) being the bottom left-hand corner from the perspective of the player receiving the shot. For analyses of shot location sequences the data were transformed to official full table dimensions of 152.5 cm wide and 274 cm long, with (0,0) being the bottom left-hand corner from the perspective of the server. All data analyses were performed using R (version 4.4.1). 21
Serve advantage model
A Bayesian multilevel logistic regression model was used to estimate the server advantage in Para table tennis. The outcome variable was whether the server won the point (1 = win, 0 = lose). A fixed effect for shot turn (server or receiver) was included in the model because points ending in errors (one player hits the ball out or into the net) are significantly more common than clear winners (a point won by a shot that the opponent does not touch). A fixed effect for the serve (binary indicator) was included because the serve has a significantly lower probability of error compared to other shots within a rally. The change in win probability as a rally progresses was modelling using a random intercept for rally turn number, allowing for information to be shared across the different levels of turn number, and shrinking estimates for high turn numbers with fewer observations. Random effects for server and returner were included to account for repeated observations from the same players. Additionally, the impairment class was included as a random intercept and a random slope conditioned on shot turn. Impairment class was included in the model to allow for the potential of serve advantage curves to vary between classes, and to account for the unbalanced number of observations from each class. The model is described below:
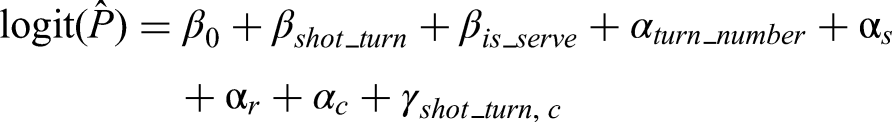
Where
Detecting shot sequence patterns
A two-step clustering approach was used to explore and identifying recurring tactical patterns of play stemming from the serve and return.
First, the (x, y) coordinates of each serve bounce were clustered using K-means clustering (serve clustering). The optimal number of clusters was determined using the elbow method, examining the total within sum of square differences. Points were then separated based on their initial serve cluster. Secondly, agglomerative hierarchical clustering was used to group points (within each serve cluster) that unfolded in a similar way using the bounce coordinates of the first four shots in each rally (rally clustering). Euclidean distance was used as the similarity metric between points. Only points with four or more shots were included in this secondary shot sequence clustering analysis (1748 points, 40% of all points).
For presentation of results the hierarchical clustering as cut at 10 clusters, resulting in 40 total tactical clusters (four serve clusters were chosen based on the elbow method), and descriptive statistics of cluster win percentage and proportion of use were generated. A Pearson χ2 test was used to investigate whether the point cluster frequencies differed by class. This two-step approach to grouping points was informed by discussions with Para table tennis domain experts to align with tactical planning that is first concerned with the location of the serve, then how a point unfolds. In this study we used a data-informed criteria for the number of serve clusters (elbow method), however a practitioner designed grouping (such as a fixed 3 × 3 grid) could also be used. In an attempt to account for different handedness in the players, the shot location data for right vs. right-handed players was left unchanged, and left vs. left matches were reflected in the x-axis so they resembled right vs. right (in that the right-hand side of the table was the forehand side). Mixed handedness matchups were oriented so that the receiver appeared right-handed (because the first stage of the clustering was based on where the serve was received), however no secondary mirroring of server shot locations was applied to avoid distorting cross table and down-the-line shot trajectories. These data were combined for the exploratory clustering analysis, however future studies may benefit from splitting same and mixed handedness matches when profiling tactical patterns.
Results
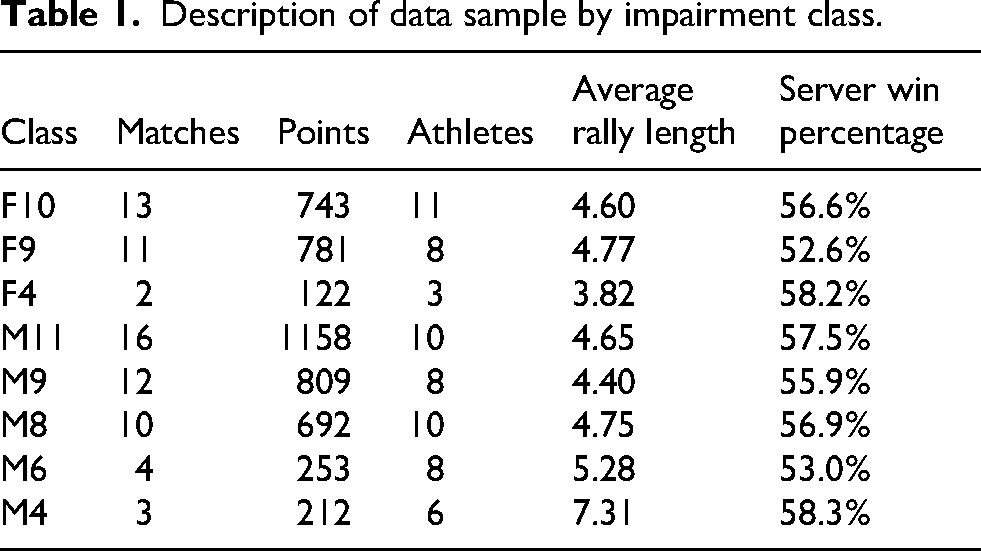
The available data consisted of 4770 points, with the server winning 56% of points. Data included matches from 8 of the 22 singles impairment classes, the distribution of observed points across each class, average rally length and server win percentage are shown in Table 1.
Description of data sample by impairment class.
Serve advantage model
The multilevel Bayesian regression model converged with all R-hat values equal to 1.00 (Supplementary Table 2). Posterior predictive check visualisations and model parameter estimates are provided in Supplementary Figure 1 and Supplementary Table 2. The estimated serve advantage relationship, which shows the estimated probability of a server winning the point throughout a rally, broken down by class, is shown in Figure 1. Dark grey points and intervals in Figure 1 show the estimates unconditioned on class. There was considerable overlap in the 95% credible intervals of the posterior predictions for each class with the class agnostic distribution. Credible intervals for all class random intercepts and slopes (Figure 2 (a)-(b)) included zero and estimates of the class random effect standard deviations were skewed towards zero (Supplementary figure 1 e-f), indicating that the serve advantage relationship did not differ between classes.
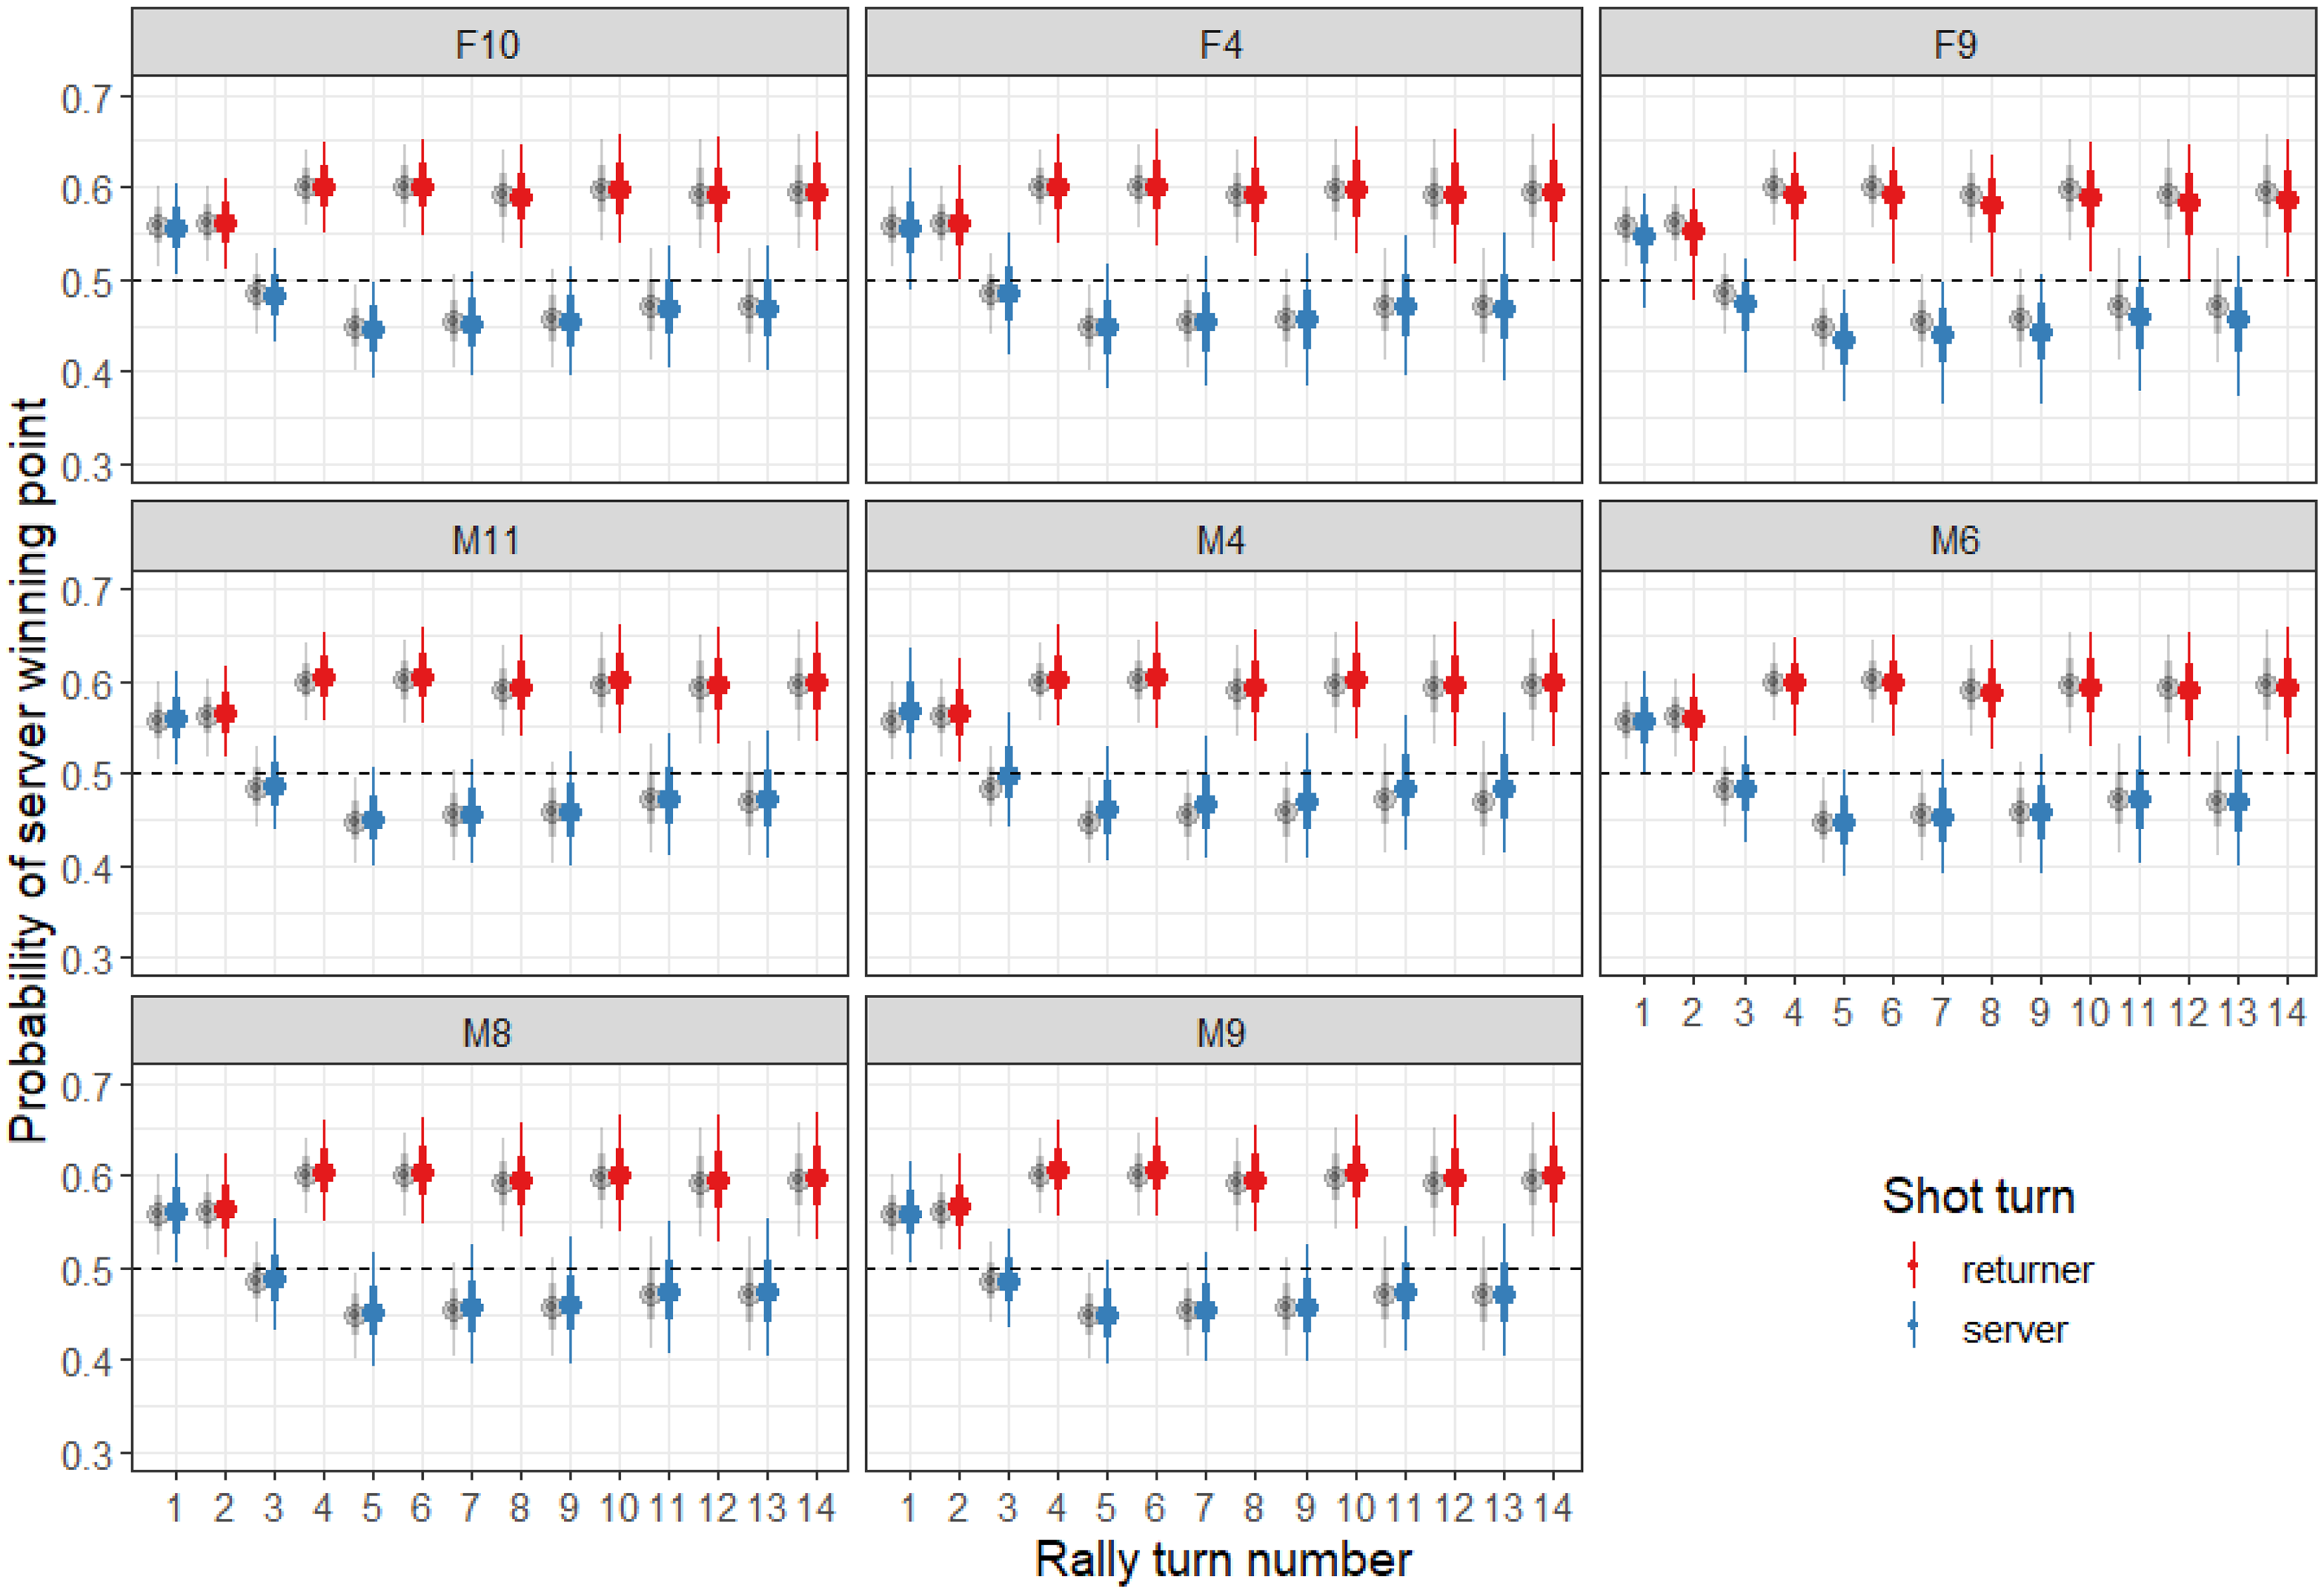
Modelled relationship between rally turn number (where turn 1is the serve) and point win probability from the perspective of the server, stratified by class. Points are the posterior medians, and vertical lines show the 66% (thicker) and 95% (thinner) credible intervals. Dark grey points and intervals are the estimates without the class random effects. All estimates are unconditioned on athlete specific serve and return random effects.
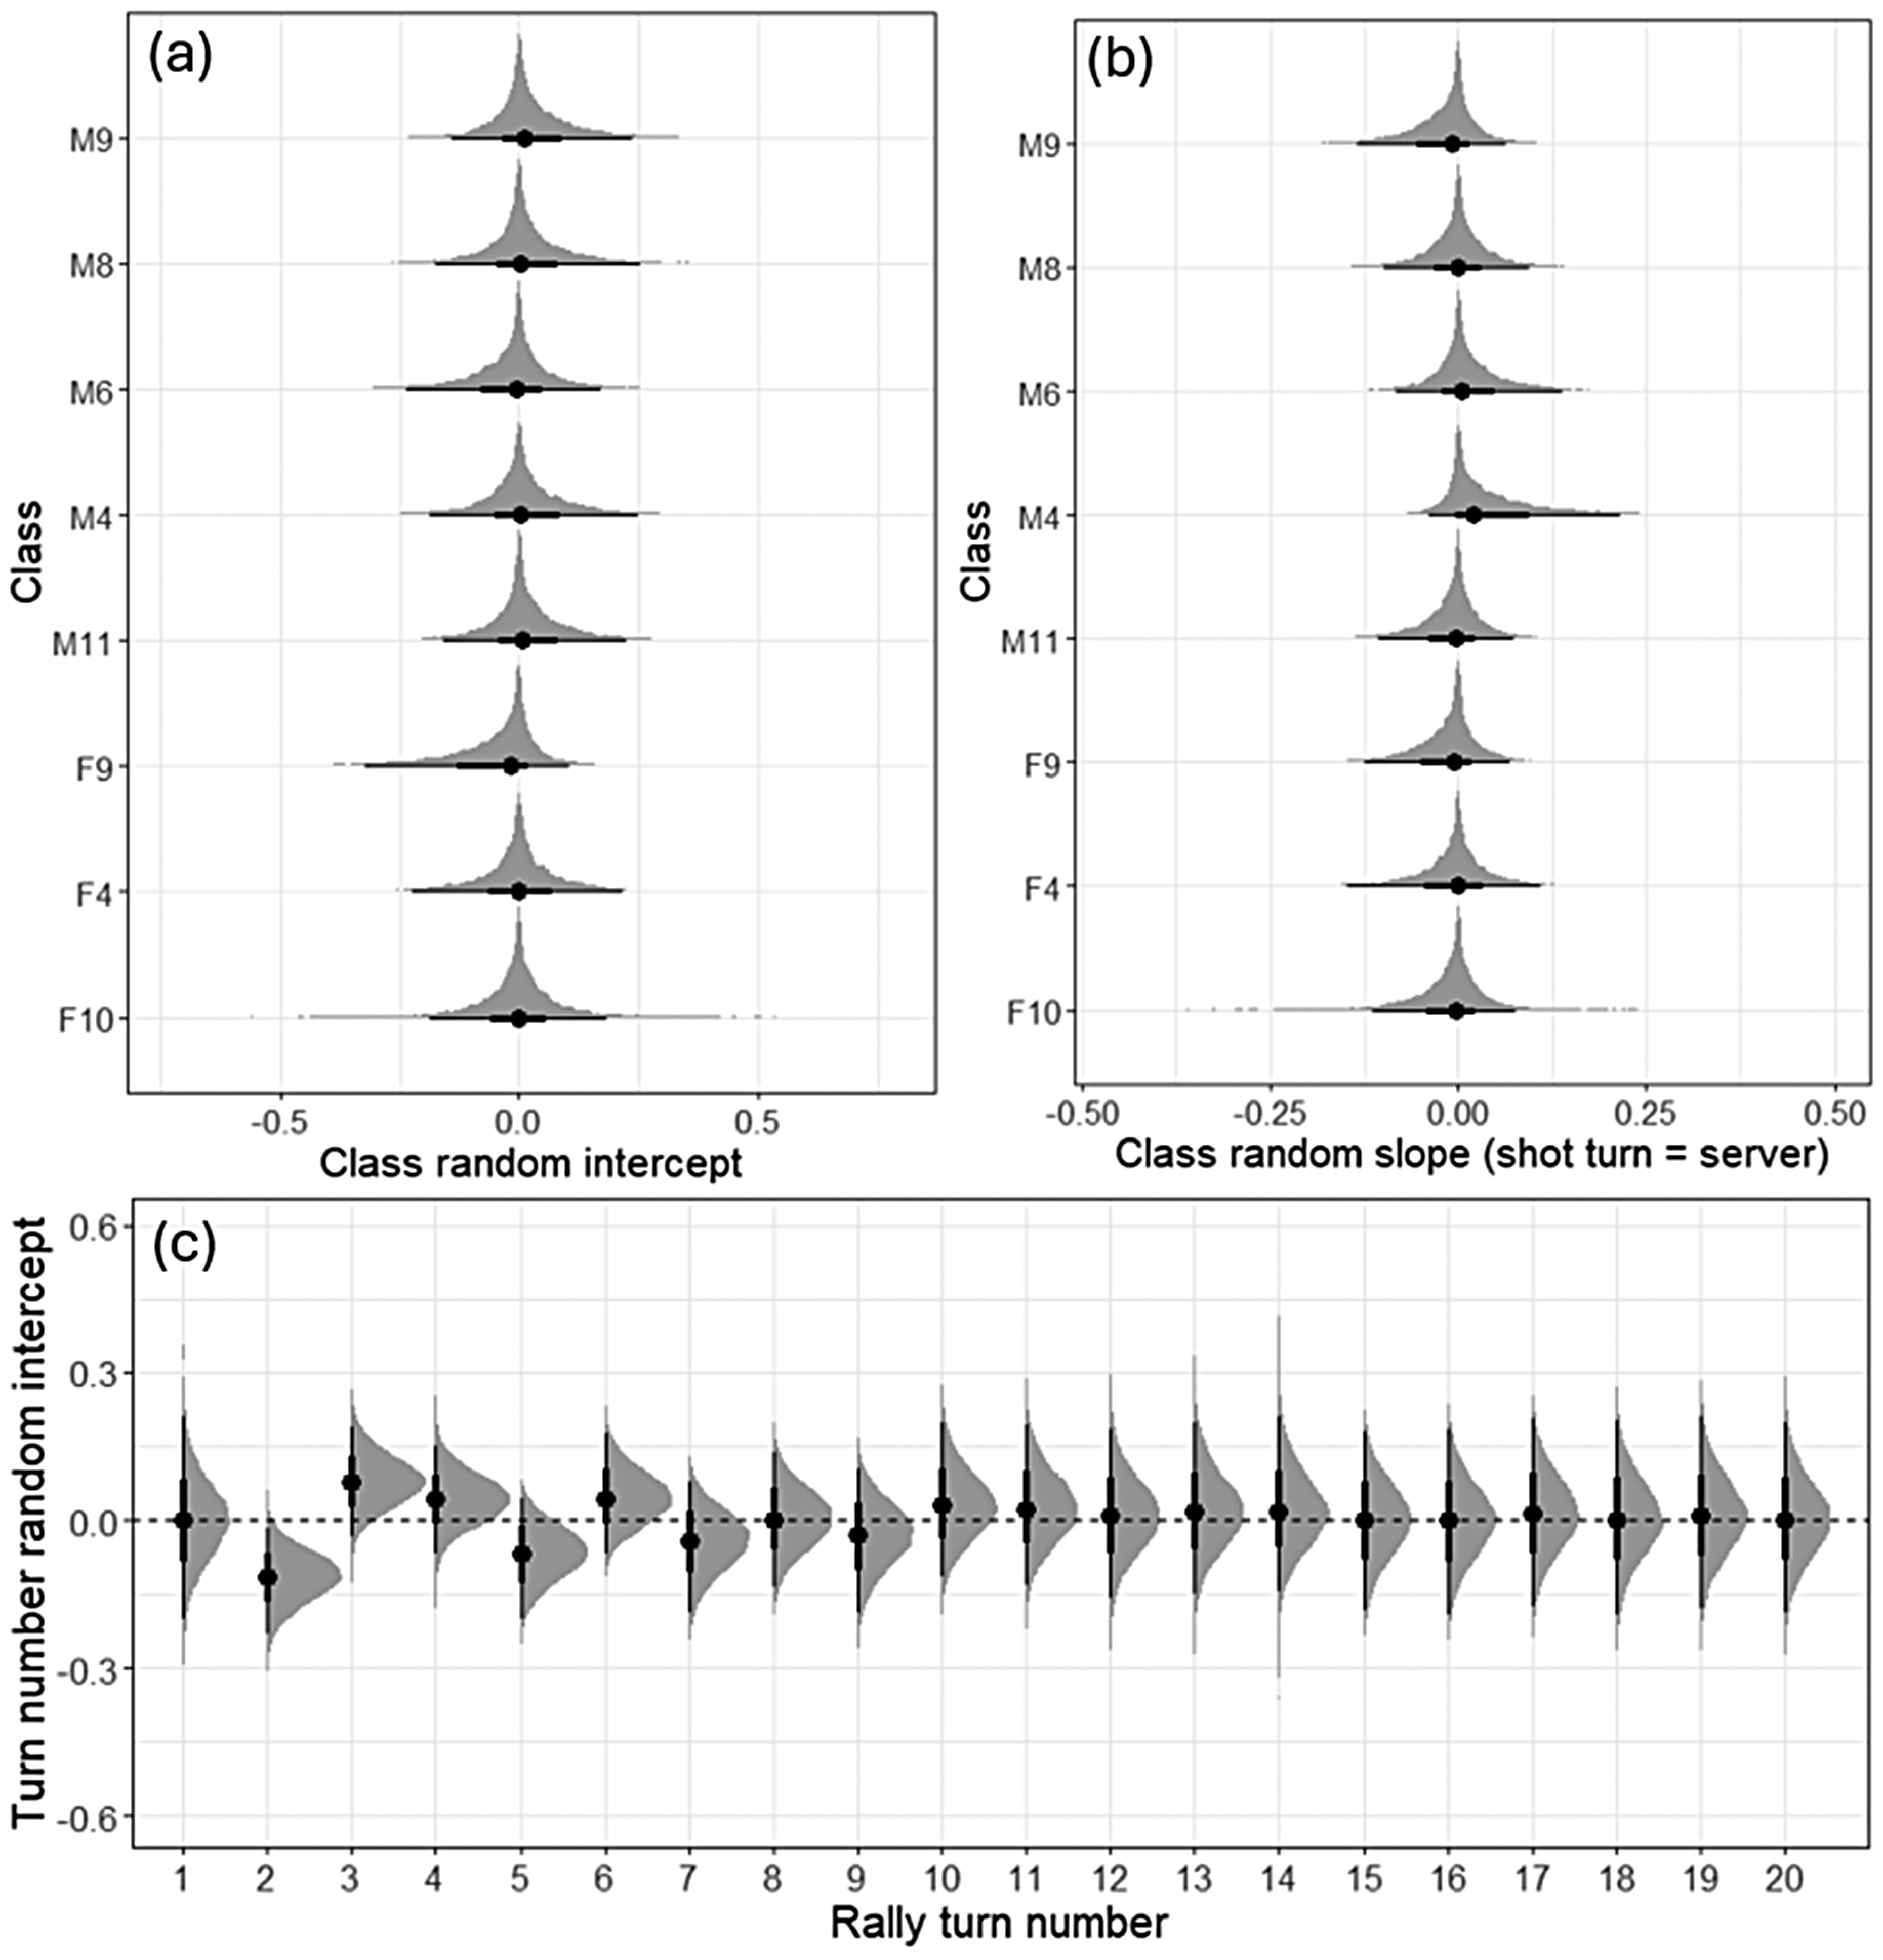
Posterior distributions of a) class random intercepts, b) class random slopes on shot turn, and c) rally turn number random intercepts (up to turn number 20, where turn 1is the serve). Points are the posterior medians, and lines show the 66% (thicker) and 95% (thinner) credible intervals.
The combination of shot turn and serve indicator fixed effects resulted in a predicted relationship where the server had a point win probability greater than 50% for the first two turns in the rally. After that there was an alternating pattern such that the point win probability was lower for whichever players turn it was to play a shot, reflecting that only when it is their turn to play a shot, can a player make an error that loses them the point. The shot turn number random effects are shown in figure 2(c). These suggested that there was less advantage to the server at rally turn two (the receivers first turn), compared to when the receiver is playing a shot later in the rally (random effect median = −0.12, 95%CI −0.23 to −0.01). The serve has unique properties within a rally, such as the constraint to bounce on both sides of the net, and the affordance given to the receiver to be in a stable position. These factors, as well as others, should be considered when interpreting the serve and return error rate. The random effect for shot turn number 3 (the server's second shot) estimated they had a higher server win probability than when it was their turn to play later in the rally (random effect median = 0.08, 95%CI −0.03 to 0.19). This may also be reflective of a lower error rate early in rallies that has been found in able bodied table tennis.4,24 Random effect estimates for shot turns 4–6 were smaller and posterior distributions contained more uncertainty in the turn level effects. Estimates for later in the rally were all centred on zero.
Figure 3 shows the posterior distributions of the serve (figure 3(a)) and return (figure 3(b)) parameters for each player. The x-axis of the return effect plot has been reversed because a negative return random effect corresponds to a reduction in the predicted server win probability when facing that returner, as such a lower value can be interpreted as better returning ability. Multiple players in the sample had estimated serve or return distributions that were clearly non-zero, suggesting distinctly different serve and return abilities exist between players. Figure 3(c) shows the mean estimate of the serve and return parameters for each player, as well as whether they medalled at the 2024 Paris Paralympic Games. There was a moderate positive relationship (r = 0.45, 95%CI 0.22 to 0.63) between serve and return parameters, suggesting that serve and return abilities are correlated. However high performing athletes (Paralympic medallists) were not all clustered in the top right quadrant, indicating that these effects in the model do not fully capture all important aspects of Para table tennis performance.
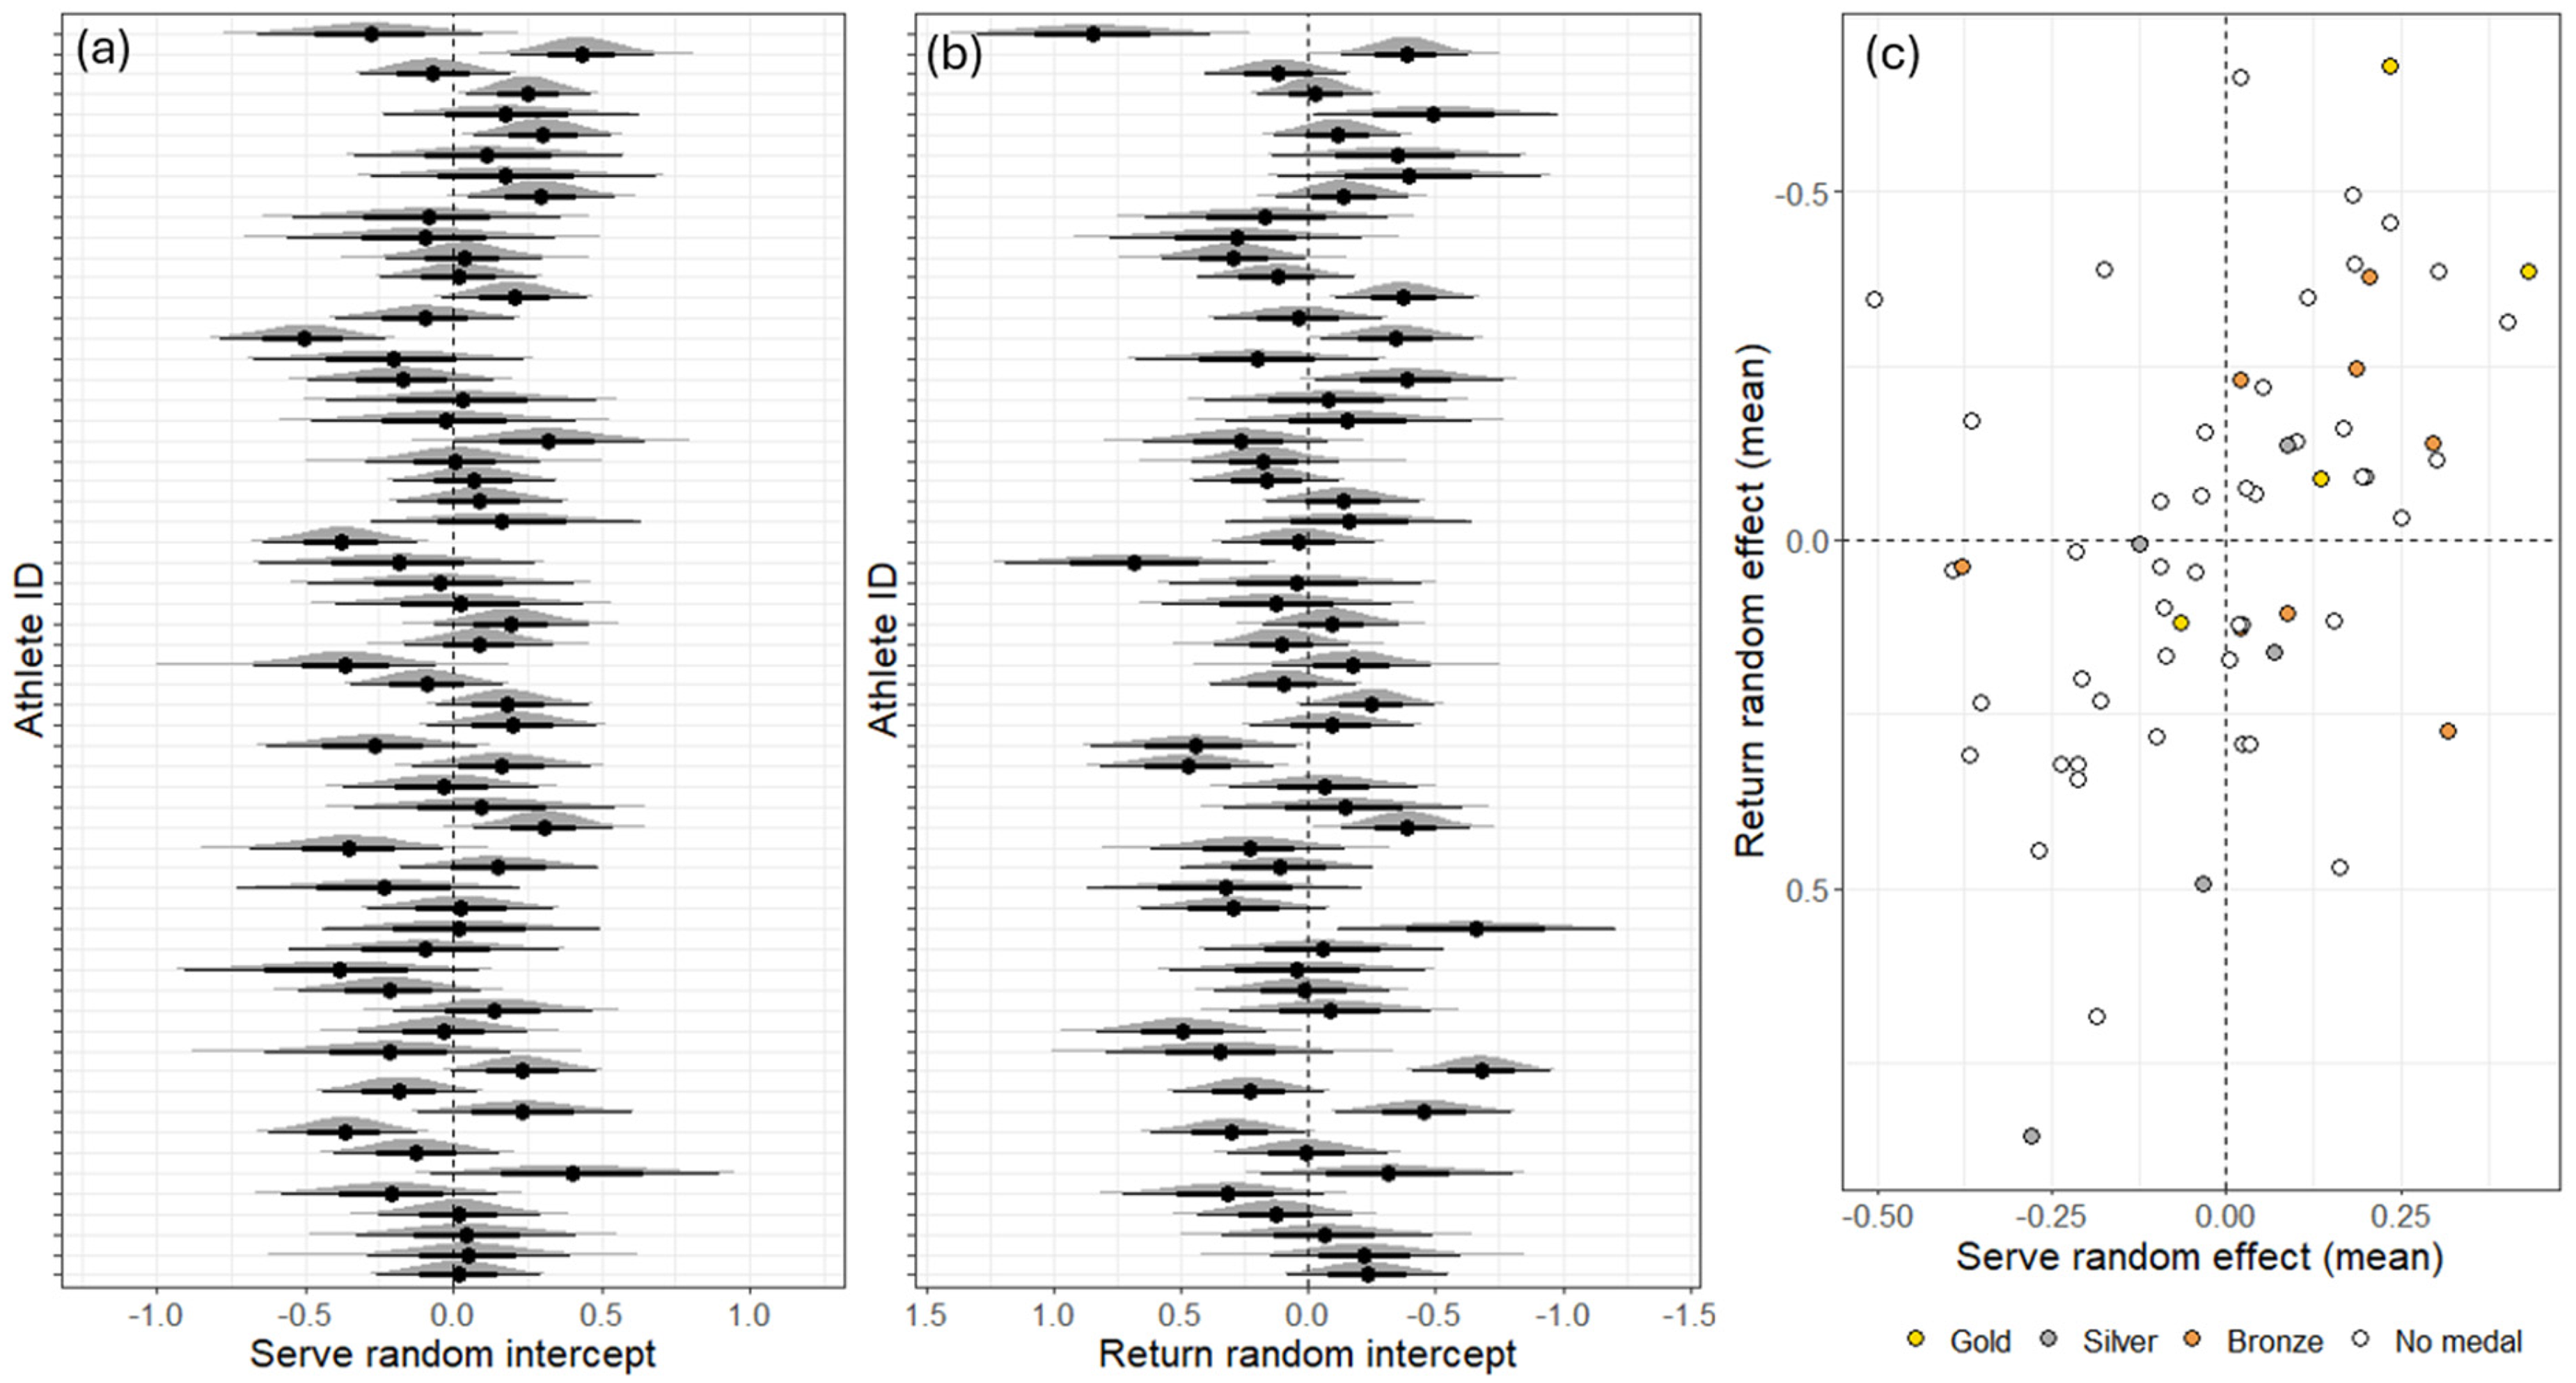
Posterior distributions of athlete (a) serve and (b) return random intercepts. Points are the posterior medians, and lines show the 66% (thicker) and 95% (thinner) credible intervals. (c) Correlation between serve and return random effects (means). Note that the x-axis of (b) and y-axis of (c) have been reversed because a negative return effect can be interpreted as higher returning ability for that athlete.
Clustering shot sequences
Serve location clustering
Inspection of the elbow point of the K-means total within sum of squares differences plot (supplementary figure 2) resulted in the choice of four clusters to represent serve location. These four clusters are plotted in Figure 4, and can be broadly grouped into quadrants (long, short, backhand, and forehand).
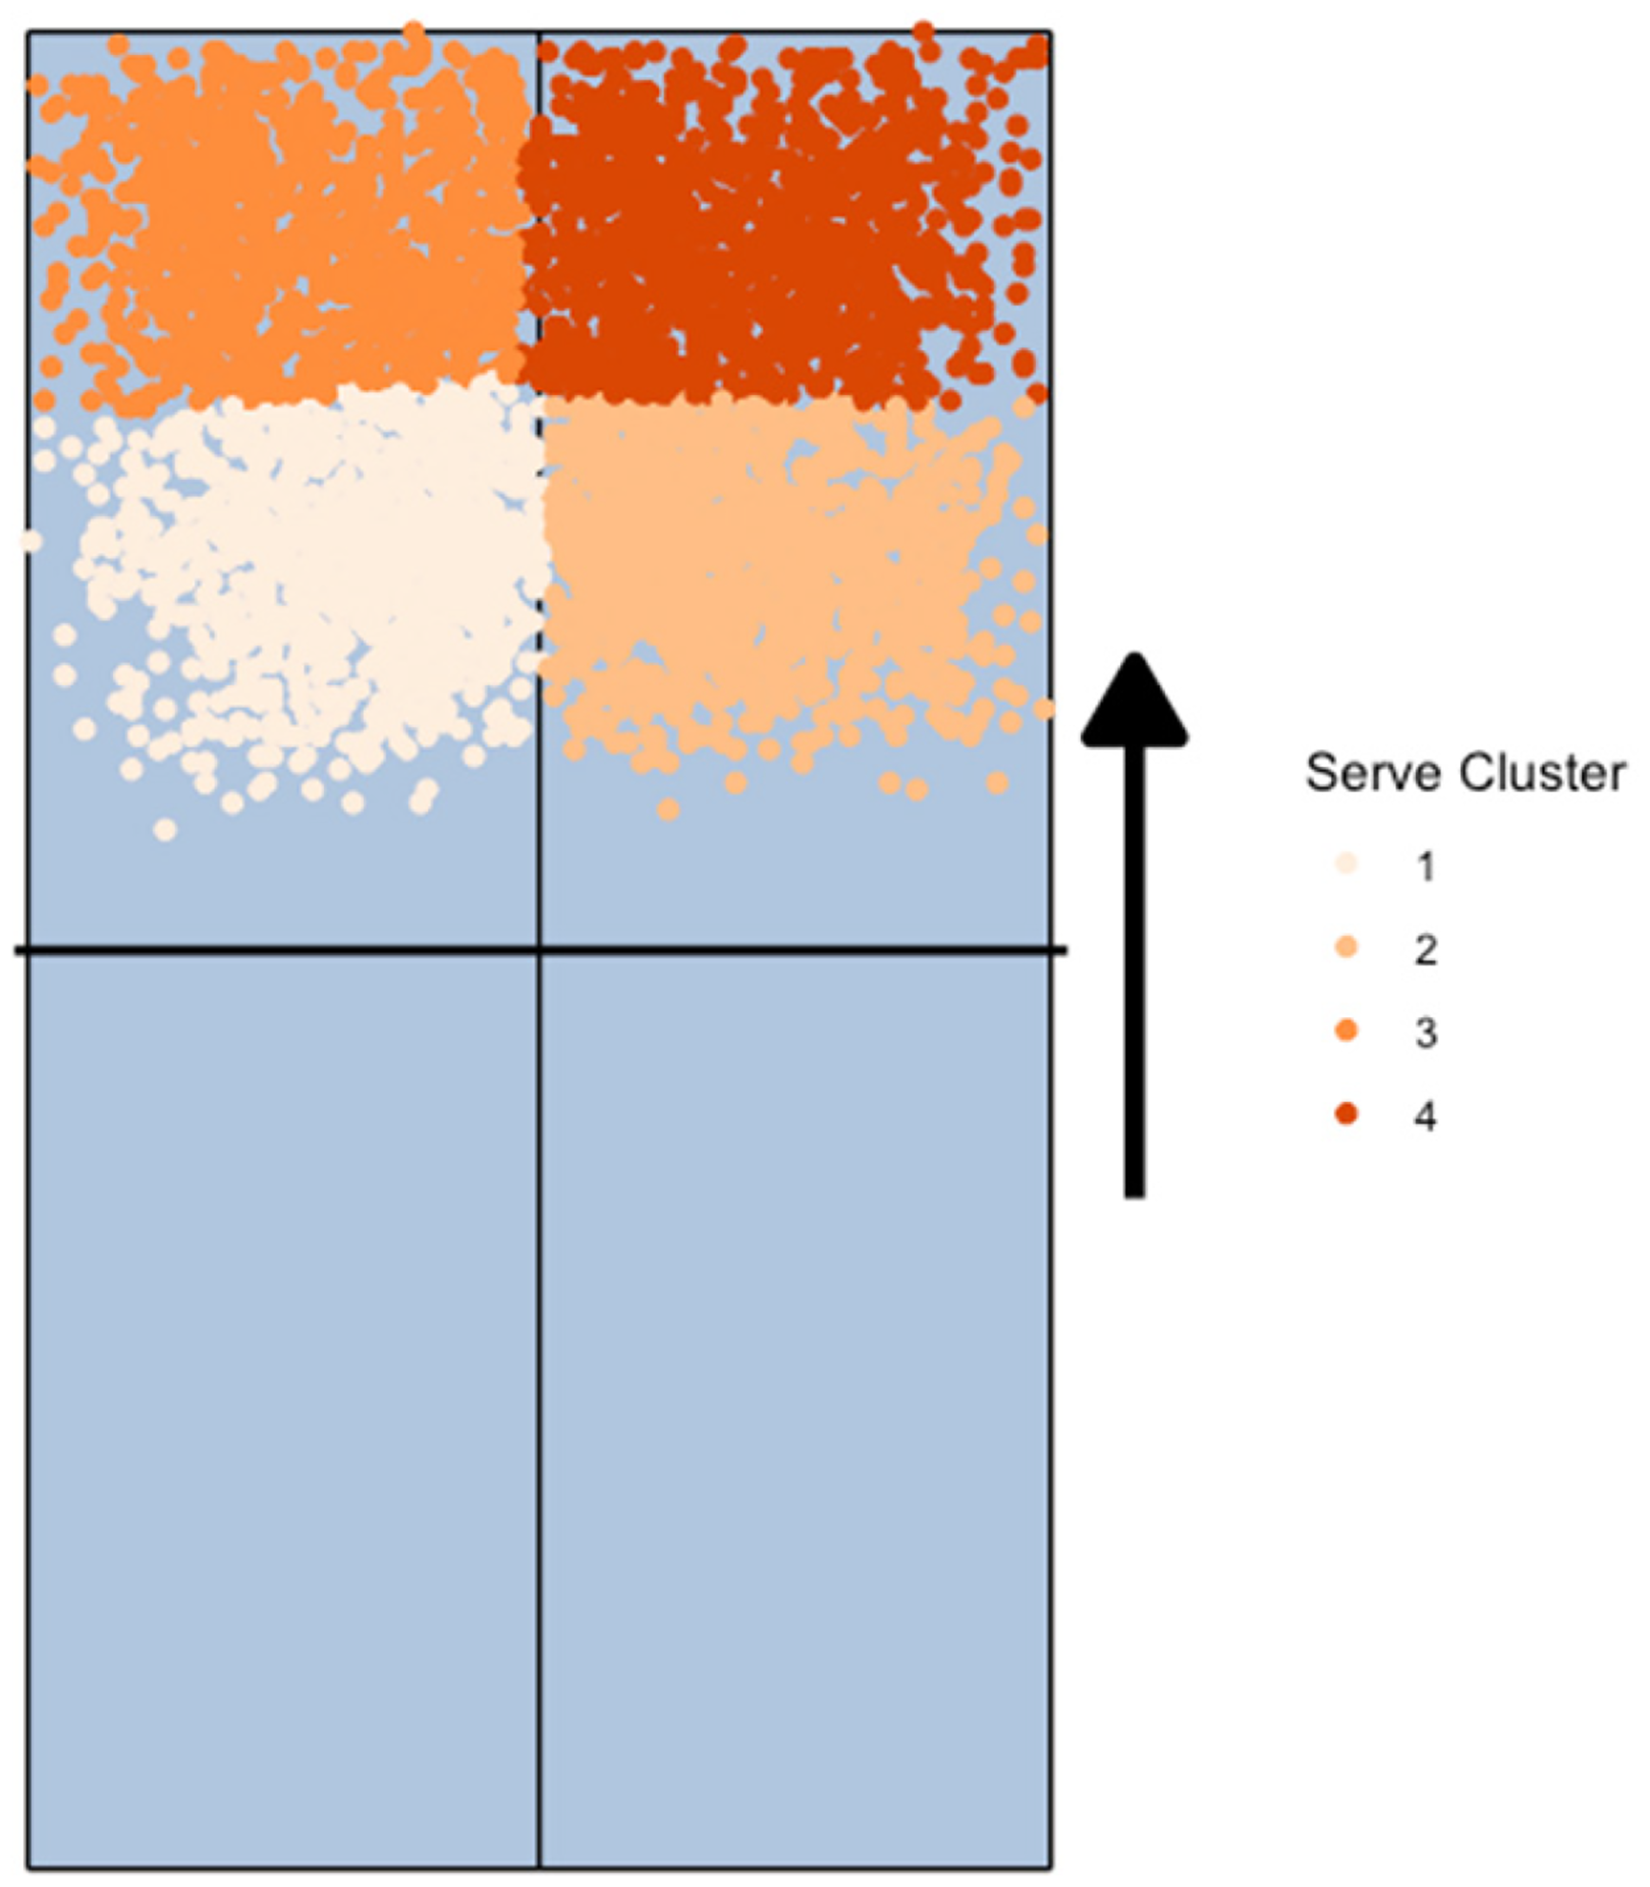
Visualisation of the serve cluster locations on the table. Each point is a serve bounce location coloured by which serve cluster it belongs to. Arrow denotes the direction of serve.
Rally sequence clustering
After partitioning the data into four clusters based on serve location, hierarchical clustering was applied to each group and cut at ten clusters to explore the different ways that the first four shots of a rally were played. Table 2 shows the number of points and the server win percentage in each of the 40 clusters (supplementary figure 3 shows all 40 point clusters). The cluster frequencies differed by class (χ2 = 811.54, p = 0.0005). Overall, the server win percentages are lower because this part of the analysis is restricted to points lasting four shots or longer and figure 1 shows that the server is at a disadvantage at the fifth shot turn. This part of the analysis was intended to be exploratory, and as such minimal statistical comparisons are made because of the limited sample size and the bias in the sample towards a relatively small subset of athletes.
Server win percentage across point clusters.
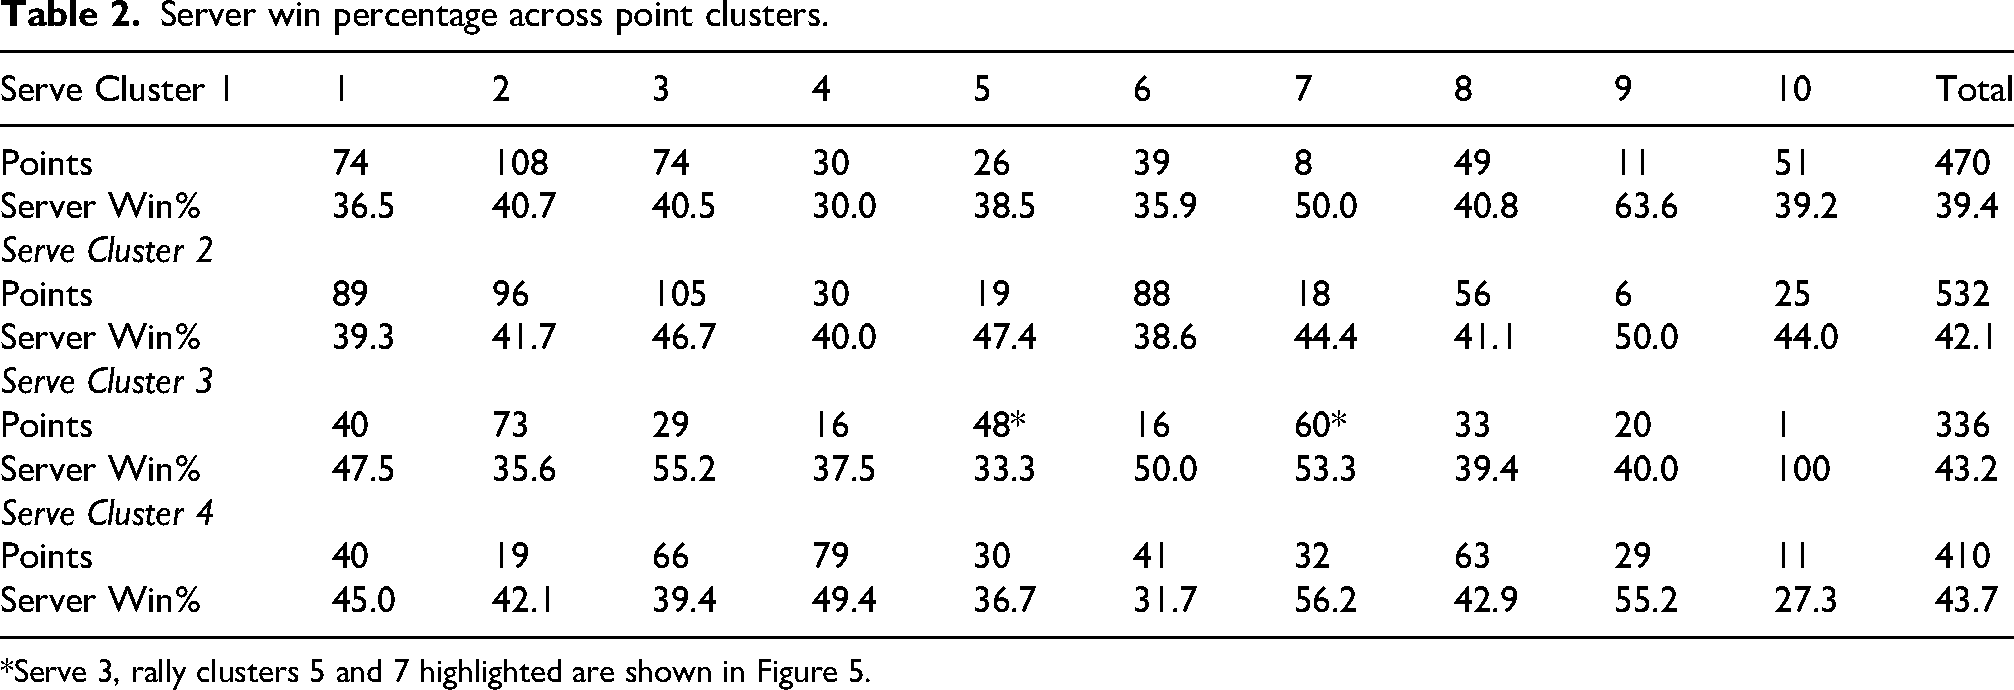
*Serve 3, rally clusters 5 and 7 highlighted are shown in Figure 5.
The primary objective of the two-stage point clustering approach was to propose a way to group points based on the spatial characteristics of shots in a manageable way to facilitate tactical performance analysis by coaches, analysts or players. To illustrate this, two examples are presented; a comparison between the shot locations in two clusters with different server win rates, and a comparison between the cluster frequencies in two different classes. The shot characteristics of two clusters with low and high server win percentages are explored in Figure 5. For serves to the long forehand (serve cluster 3), rally cluster 7 had the second highest percentage of points won by the server and cluster 5 had the lowest percentage of points won by the server (highlighted cells in Table 2). The higher advantage rally cluster 7 (figure 5(a)) shows an initial serve deeper into the corner and a subsequent return that is more spread and drops shorter compared to the return of rally cluster 5 (figure 5(b)), which is concentrated deeper into the right corner. Rally cluster 7 then shows a more concentrated third ball back into the returner's forehand corner and a dispersed fourth ball favouring the left side. The wider and deeper serve may allow the server to make a strong attack on the third shot, leading to the tighter and deeper shot dispersion observed. Conversely, rally cluster 5 shows a more spread third ball, with the returner then able to direct the fourth ball more focused into the left side.
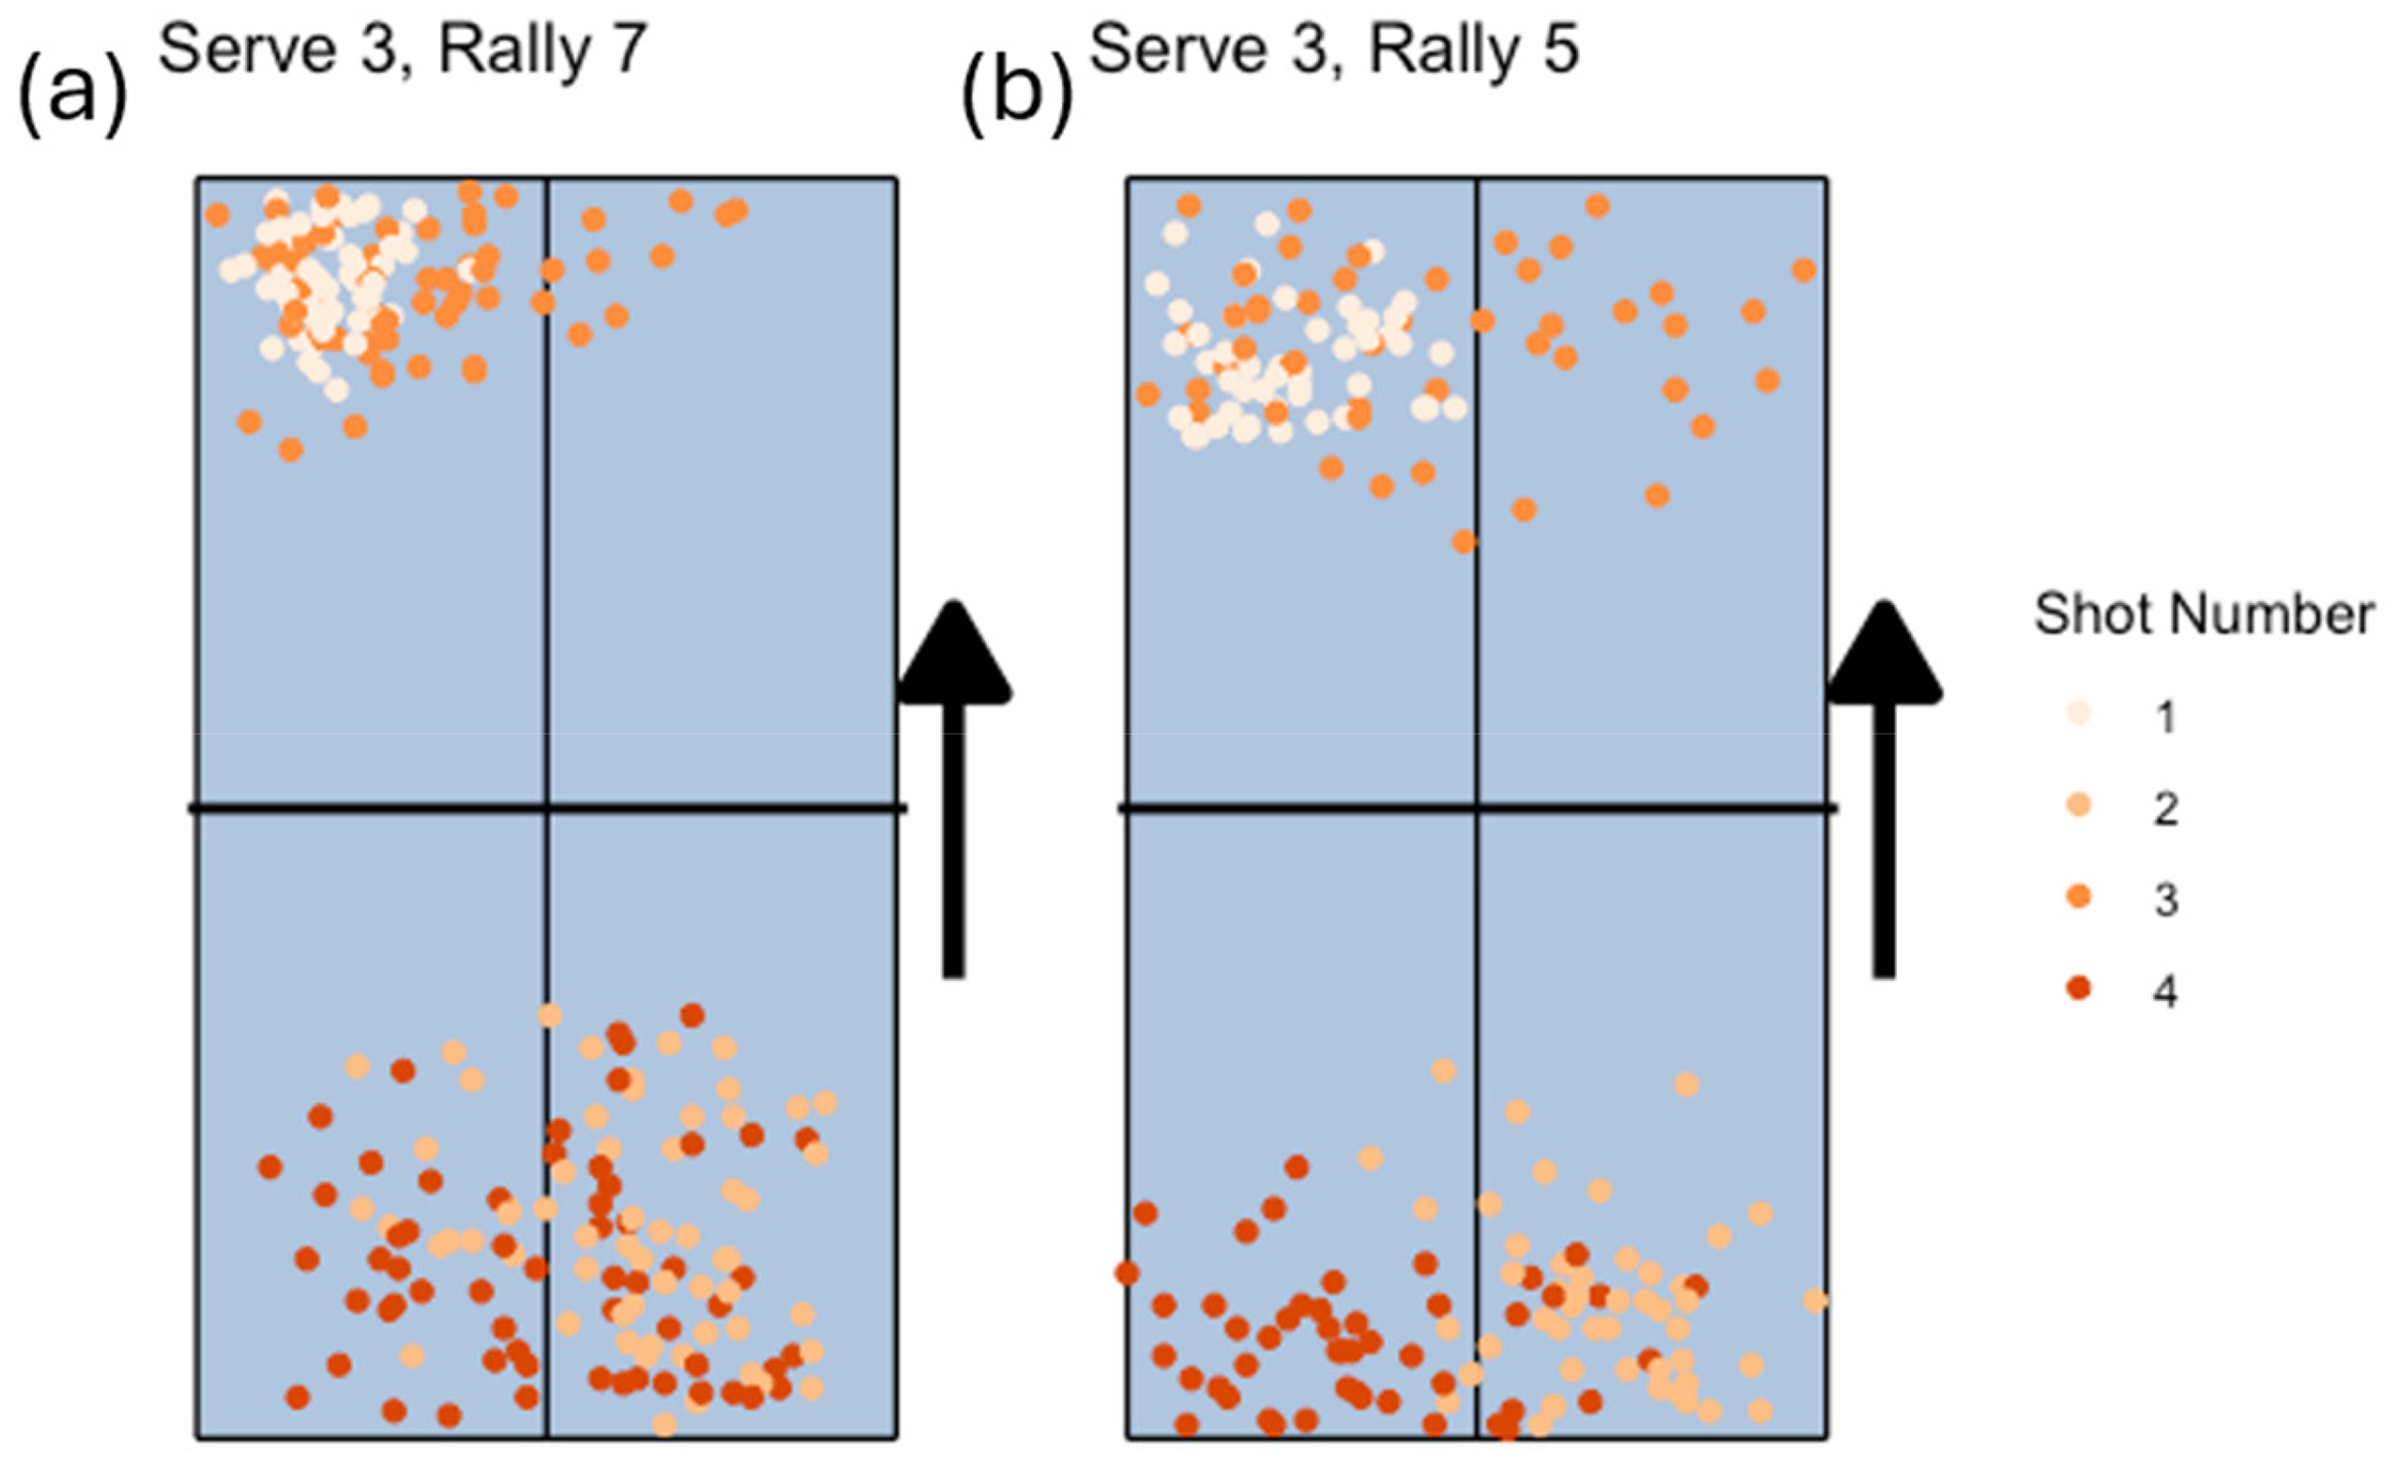
Comparison of the shot bounce location patterns of the rally clusters with (a) the highest (Rally 7) and (b) lowest (Rally 5) server win percentage for serves to the long forehand (serve cluster 3). Arrow denotes the direction of serve.
As another example application of this clustering approach, a comparison between the cluster proportions in the observed M8 and M9 matches is shown in Figure 6. These classes were chosen because they are adjacent in categorisation and were two of the better represented classes in the sample of points analysed. M8 players favoured serves to the long backhand (serve cluster 4), after which rallies commonly resembled those in rally clusters 4 and 3. In comparison, servers in the M9 class favoured short serves (serve clusters 1 and 2), with rallies then commonly belonging to the rally clusters 1–3.
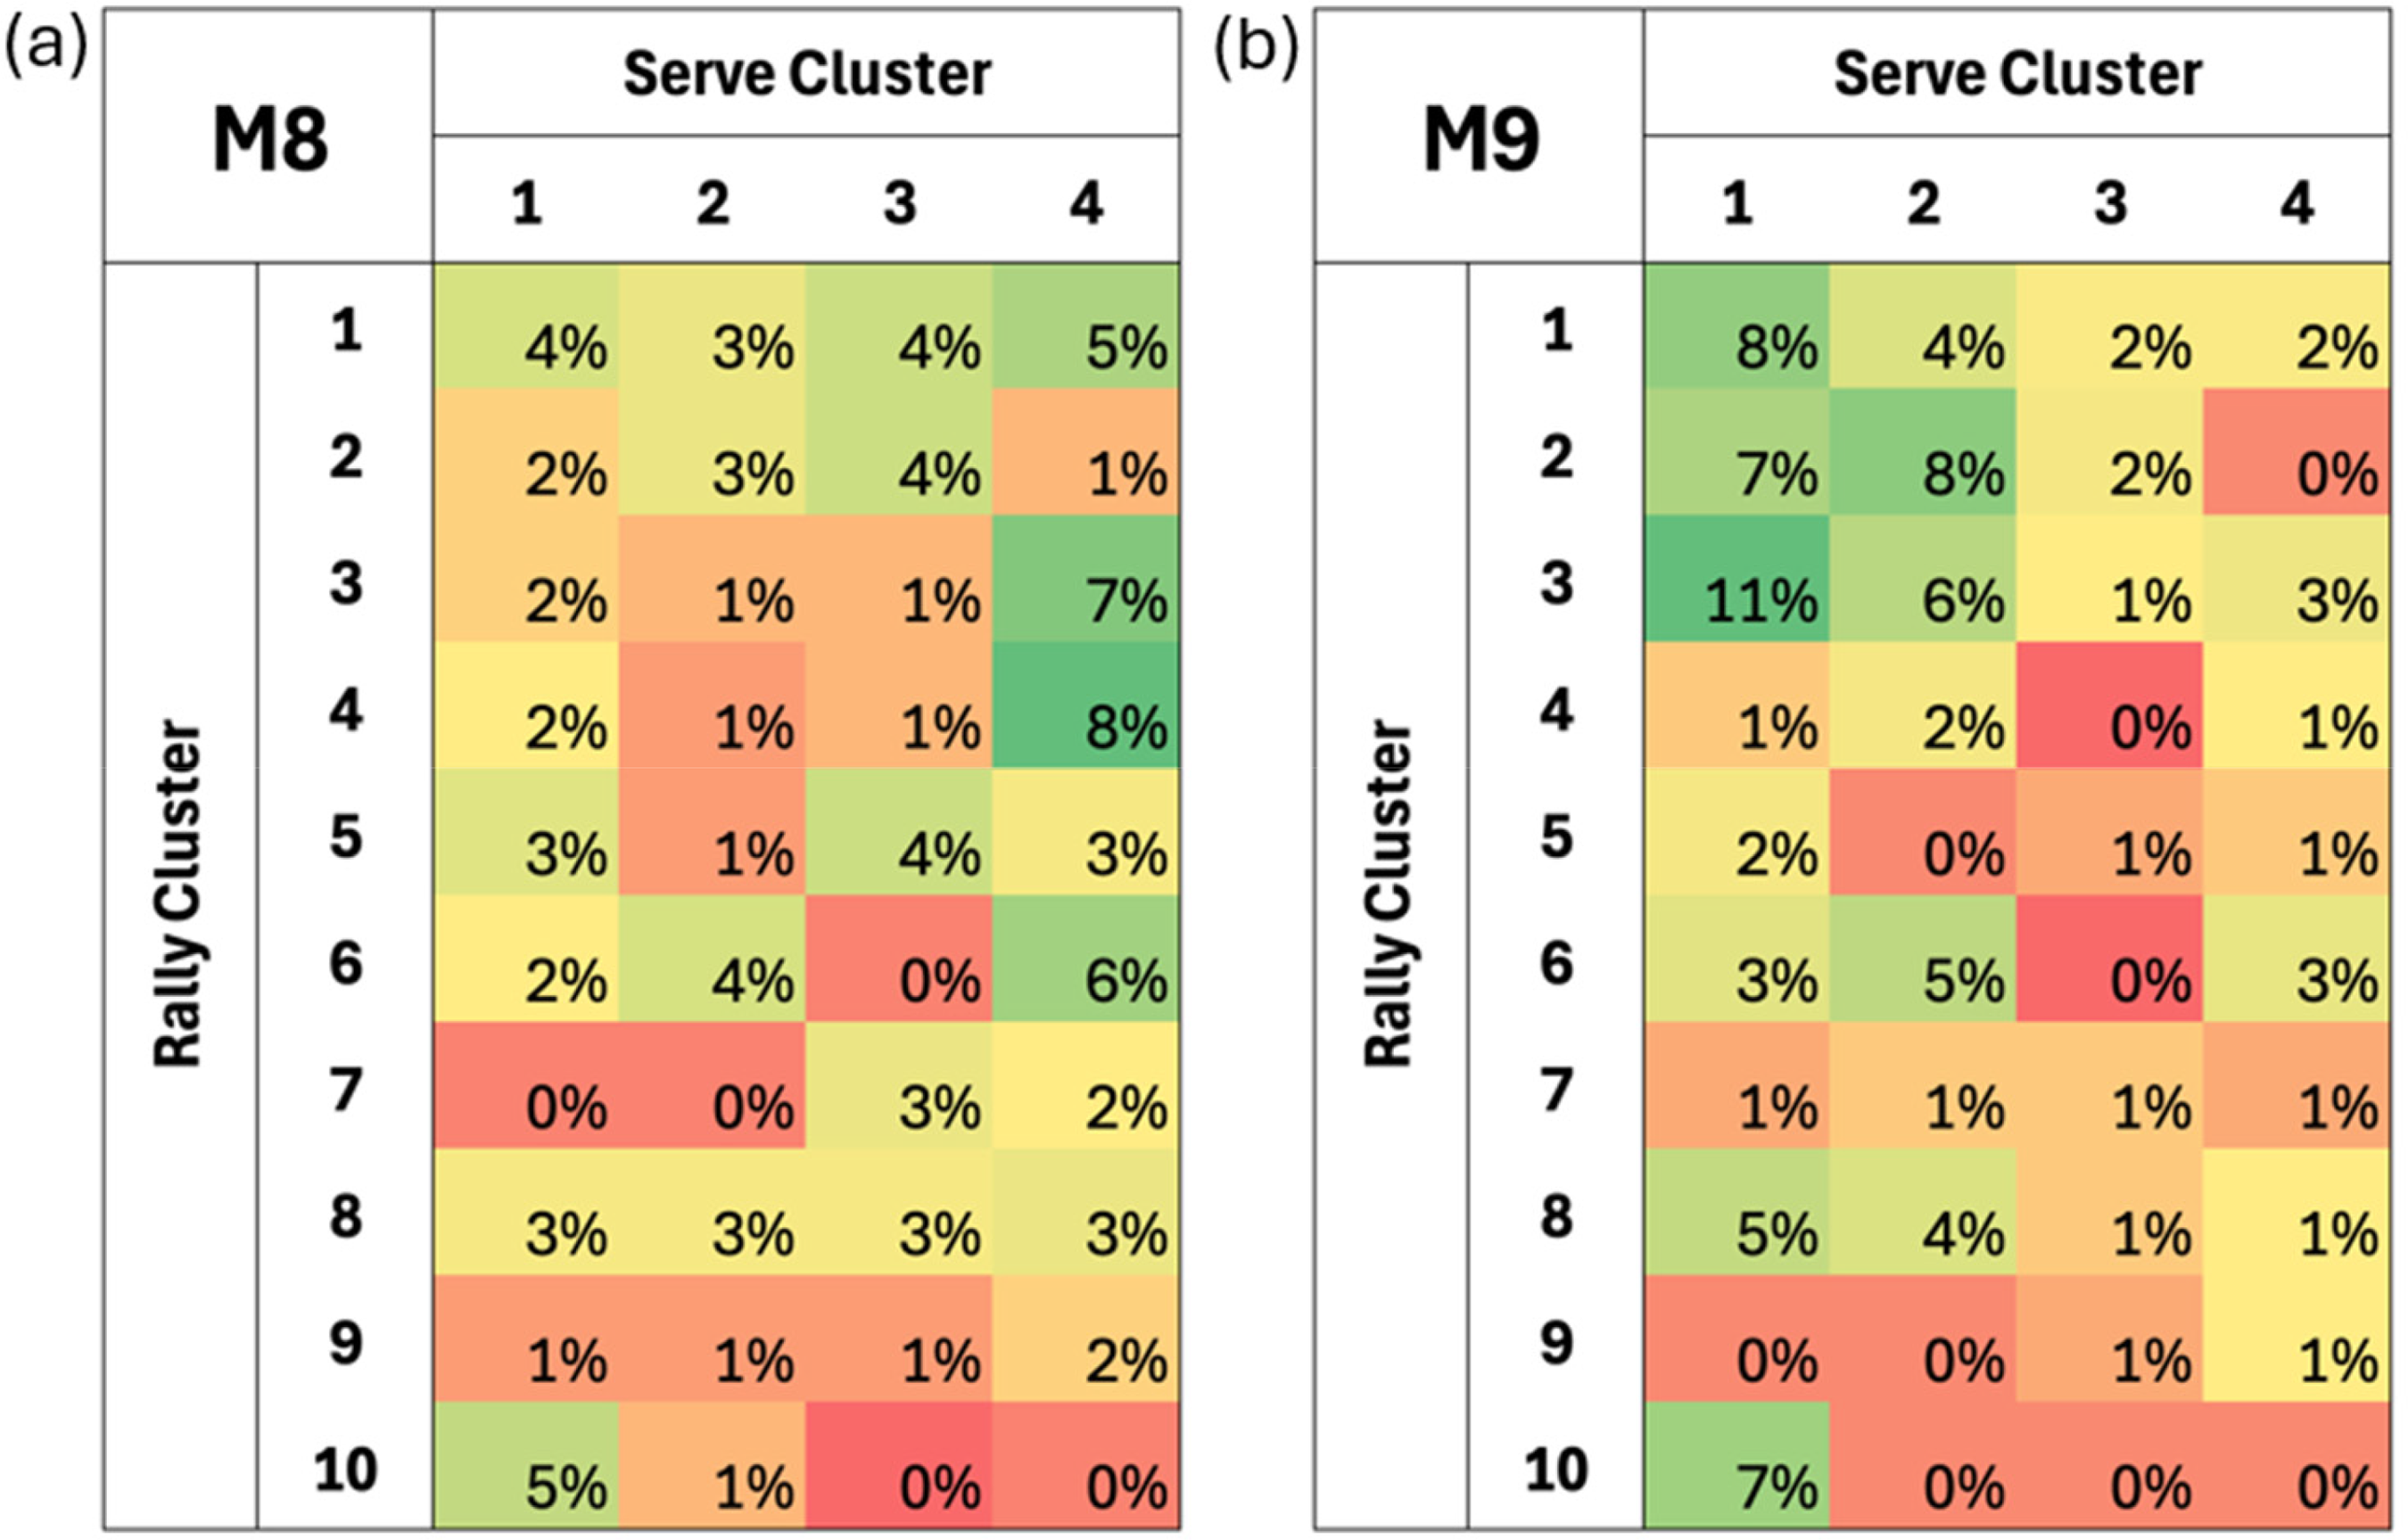
Heatmap of serve and rally cluster proportions in the (a) M8 and (b) M9 classes (values within cells are the proportion of points lasting four shots or longer that were assigned to each of the clusters).
Discussion
The primary aim of this study was to characterise serve advantage in Para table tennis. In the convenience sample analysed the overall win percentage of the server across the data (56%) was similar to that previously reported in both able and Para table tennis.3,4,6 The serve advantage model in this study extends these analyses and provides new information about the change in serve advantage as a point increases in length. Additionally, it provides estimates of class differences and gives a method to rate the serving and receiving abilities of individual athletes. Using these methods, a larger and more representative dataset could permit stronger inferences about the characteristics of serve advantage in Para table tennis more generally. The exploration of serve and return shot location patterns using a two-stage clustering method provides a potential method for further investigation into how the server advantage is executed (or not) in a rally.
Serve advantage
The hierarchical logistic regression model estimated that the point win probability for the server varied depending on the shot turn number in the rally (figure 1). The server was predicted to have the advantage at turn one, corresponding to when they get to serve, a shot they are in control of that has low error rate, 4 that allows them to put the responsibility on the receiver to then play a shot without error. At shot turn two the returner must play a shot without the control afforded by the serve, and the advantage remains with the server. It was estimated that the magnitude of the server advantage (related to the returner error rate and the server win rate) at this stage was lower than later in the rally (figure 2(c) – rally turn 2). Potential contributing factors may include the extra constraints on the serve (bounce on both sides of net), that the returner is not trying to recover position after playing a previous shot, and that the server can control the first shot of the rally. At rally turn number three the server win probability dropped below 50% because the server now must play a shot that has been directed at them by the returner, increasing the expected error rate. Compared to later in the rally, the advantage to the returner at this stage is lower (figure 2(c) – rally turn 3) suggesting that some of the advantages of the serve may be persistent in the point. Rally turn numbers from four onwards were then predicted to follow an alternating pattern of advantage based on shot turn, with the magnitude of advantage estimated to stay relatively constant on average, reflecting the lower likelihood of a direct winner compared to an error in general rally shots. This is also similar to shot number characteristics in table tennis presented by Tamaki et al., 4 whose calculated metrics of effectiveness, scoring rate and losing rate indicated a shift after the initial three shots in a rally. Uncertainty in model estimates regarding rally turn numbers 4 and 5 (figure 2(c)) preclude definite conclusions but offer some points of comparison with previous tactical analyses of table tennis, suggesting shot number three was likely to be a successful attacking shot 4 leading to a higher server advantage for turn number four. A possible explanation for the lower server advantage on turn number five could be embedded in the tactical nature of the serve-return, where a poor serve or a strong return on the second shot may set up the rally for the returner to then capitalise after the fourth shot (receiver's 2nd shot), on rally turn 5, resulting in the observed advantage to the returner. This follows some of the tactical arguments posed by Lanzoni et al., 25 who reasoned that the serve plays a key role in both setting the server up to win the point and also negating the receiver's attack. This is where the addition of further tactical analysis can be beneficial to understanding dynamical serve advantage.
Effects of class and individual
There was not strong evidence to suggest differences in serve advantage between impairment classes (figures 1 and 2 (a-(b))). The posterior distributions of class intercepts and slopes in the model were centred on zero, and server advantage relationships were similar. Previous analyses comparing server win rates in Para table tennis also found minimal differences between classes. 3 However, it was proposed that female wheelchair classes had a higher advantage from serve than their male counterparts. 3 This finding was not replicated in this study, however, the data used for this study included only five wheelchair class matches and did not contain any data for several classes. A more complete and comprehensive data set may find greater differences between impairment classes.
There was evidence of separation between athletes with respect to serve and return abilities (figure 3 (a-(b))). As well as correlation between the serve and return ability estimates, aligning with previous findings that better players won more often on both serve and return. 6 Other studies have reported significant differences in win percentages between players of different abilities in table tennis, 5 and a study of tennis serve and return ability using a similar model to this study, but much larger sample, found clear evidence of non-zero player-level effects. 9 A larger sample of Para table tennis athletes and matches analysed using the same approach as this study may find more variation in the individual serve and return ratings and the model could be extended to include player-specific shot turn number effects to investigate how particular players gain or lose advantage in a point.
Rally clustering
With modelling results indicating that the serve advantage curve does not differ significantly between classes, further analyses may be required to explore the mechanisms of a rally and the shot sequence characteristics of the classes. The two step clustering method proposed in this study is an exploratory approach that may provide coaches and analysts a structured way to conduct tactical pattern mining to better understand the nuances of elite Para table tennis. It combines approaches from other studies regarding the initial clustering of the serve11,16 and extends upon that by clustering the ensuing rally. Treating the serve and rally separately allows for querying first on the serve type (an aspect of the point controlled by the server) then viewing the common ways that a point plays out given the initiating serve. This may help manage the size of the search space of points ‘types’, shown to be large in previous pattern mining research. 20
Preliminary results with the current data demonstrate the computational feasibility of this approach, however the practical utility of the method has not been empirically shown, and further research is needed to determine if the resulting clusters align with tactics recognised by practitioners. Although limited by the sample, the two-step clustering in this study has identified point clusters that could be examined in the context of coaching analysis. This includes differentiating between favourable and unfavourable tactics from the perspective of the server, such as in Figure 5. However, clusters still exhibited some spatial overlap, indicating that cluster boundaries may not be readily interpretable or distinguishable by human observers. Furthermore, the method may be explored for differentiating the characteristics of play between classes based on identified serve-return rally tactics (Figure 6). This extension is important, as examining the serve alone has proven not enough to differentiate between classes. Another extension requiring further investigation for the clustering framework provided would be to assign rallies with incomplete data across the first four shots (short rallies) to clusters post-hoc. This may enable grouping and evaluation of shorter rallies, along with projecting how those rallies might have continued to play out.
Limitations and future directions
A limitation of the current study is the potentially unrepresentative data sample. The data was collected for Australian athletes’ preparation for the 2024 Paris Paralympic Games, hence, the data contains matches with perceived significance to their preparation. Biasing the sample towards a subset of the classes and selected players. The analysis attempted to control for the player and class when estimating serve advantage, however, the sample is still lacking information from multiple classes. To more thoroughly understand differences in serve advantage, representative data should be collected from every class. This would also aid in the application of the tactical clustering framework, as more data for each class may begin to reveal differences in the tactical style of play between classes.
A limitation of the exploratory clustering analysis was the restriction to points lasting four or more shots, which may have excluded interesting tactical point patterns that resulted in short rallies. Future analysis of table tennis tactics may benefit from considering all rally lengths or focussing on short rallies to better understand how players gain or lose advantage early in a rally.
To further build on the findings of the current study, integrations of the two methods could provide novel insights into the true effectiveness of identified tactics. Identifying stronger tactical patterns with more representative data, along with assigning shorter rallies with incomplete data to clusters post-hoc, would provide the ability to include this in the modelling of serve advantage. The inclusion of tactical clusters may better differentiate serve advantage or tactical effectiveness between classes. More data collected on the speed and spin of shots, and comparing mixed and matched handedness of players could also facilitate more in-depth characterisation of the playing styles present in elite Para table tennis.
Conclusion
This study presented a model for serve advantage throughout a rally in Para table tennis. The predicted point win probability alternated to favour either the server or returner depending on shot turn, with the player whose turn it was the play the shot less likely to win the point. The exception to this pattern was the serve, providing an advantage to the server over the first two shots in a point. The magnitude of point win probability fluctuations were lower during the first four shots of a rally. In the convenience sample analysed there was negligible evidence that the serve advantage varied between classes and between athlete variance with respect to serve and return ability was higher. A two-stage clustering framework, treating the serve and rally shot locations separately was proposed and used to explore differences in point characteristics between classes.
Supplemental Material
sj-docx-1-spo-10.1177_17479541261426425 - Supplemental material for Analysing serves in para table tennis: Modelling advantage and clustering points
Supplemental material, sj-docx-1-spo-10.1177_17479541261426425 for Analysing serves in para table tennis: Modelling advantage and clustering points by Matthew Johnson, Samuel Wells and David L Carey in International Journal of Sports Science & Coaching
Supplemental Material
sj-docx-2-spo-10.1177_17479541261426425 - Supplemental material for Analysing serves in para table tennis: Modelling advantage and clustering points
Supplemental material, sj-docx-2-spo-10.1177_17479541261426425 for Analysing serves in para table tennis: Modelling advantage and clustering points by Matthew Johnson, Samuel Wells and David L Carey in International Journal of Sports Science & Coaching
Footnotes
Acknowledgements
The authors would like to acknowledge Table Tennis Australia for providing access to the data used in this study.
Ethical considerations
Ethical approval was granted by the relevant University Ethics Committee (HEC25215).
Consent to participate
A waiver of consent was approved by the relevant University Ethics Committee (HEC25215).
Funding
The authors received no financial support for the research, authorship, and/or publication of this article.
Declaration of conflicting interests
The authors declared no potential conflicts of interest with respect to the research, authorship, and/or publication of this article.
Data availability
The data used in this study is not available to be shared.
Supplemental material
Supplemental material for this article is available online.