
Abstract
This study examined how cooperation and opposition dynamics influenced ball progression during open-play defensive transitions in football. Ninety-four matches from the top three teams in the Portuguese First League (2022/23) were examined, focusing on episodes beginning in the offensive midfield of teams that lost ball possession, with a balanced scoreboard, and where possession was not regained. A five-second time criterion was used to define the endpoint of each transition. Thirty-six predictor variables, related to interpersonal angles, distances, and Voronoi diagrams were analysed using three Linear Mixed Models, based on each episode's type of progression (dribbling, passing, or mixed). Results indicated that a greater average distance between the first defender and the ball reduced progression through passing (β = −0.15; CI = −0.24, −0.06), while greater variations in distances between the first two defenders and the ball generally hindered progression. Larger Voronoi areas for the third defender correlated with greater opponent spatial advances (β = 0.19; CI = 0.11, 0.27), likely reflecting attacking success rather than defensive failure. Unexpectedly, higher spatial dominance around the first defender was associated with reduced defensive success (β = 0.15; CI = 0.08, 0.22 and, β = 0.10; CI = 0.03, 0.18), possibly due to lack of compactness or an episode's selection bias. Wider angles between defenders and their own goal positively correlated with all types of progression, emphasising the importance of maintaining defensive alignment. Overall, these findings reveal how specific defensive patterns near the ball can be used to obstruct opponents’ progression during defensive transitions.
Introduction
In association football, players continuously explore their surroundings, adapting and coordinating their movements with teammates and opponents, 1 in a goal-directed manner. Success at the elite-level demands proficiency across technical, physical, psychological, and tactical domains, which are constantly employed during match play. These skills manifest, for instance, through precise on-the-ball actions, adequate decision-making, or physical preparedness, enabling players to execute coaches’ strategical plans, follow action guidelines, or respond effectively to opponents’ behaviours. The ultimate objective is to disrupt the opposition's tactical organisation and either create or prevent goal-scoring opportunities, depending on the ball possession status. Despite the inherent dynamism of the game, performance-related evidence suggests an overall stability, evidenced by low-scoring outcomes and synchronised inter-team movements along both longitudinal and lateral axes. 2 Within this context, capitalising on moments of uncertainty, such as when opponents become momentarily disorganised, emerges as a critical determinant of success.
Transitions, defined as “the actions performed by teams and players in the instants following a possession exchange”, 3 may be one of those pivotal moments. In particular, offensive transitions refer to actions executed immediately after regaining possession, whereas defensive transitions involve adapting to newly required playing roles after a ball loss a . Transitions can be further categorised as open-play or set piece episodes, depending on whether the “dynamic flow” of the game is maintained (e.g., a possession exchange through a tackle; open-play transition) or interrupted (e.g., a possession exchange through an offside call; set piece transition).4,5
Present research confirms the criticality of open-play transitions for competitive success (for a comprehensive review on present findings, see Eusebio, Prieto-González and Marcelino 6 ). For instance, match winning teams in FIFA World Cup 2018 were found to hinder opponents’ ball progression more effectively than losing sides, when transitioning to defensive tactical roles. 7 Additionally the ability to swiftly regain possession following its loss impacted teams’ end-of-season rankings in German Bundesliga. 8 Actions permitted after losing the ball may have also influenced the probability of conceding goal-scoring opportunities, in UEFA Champions League. 9 Consequently, elite-level teams increasingly focus on transitional instants, 10 to exploit temporary disorganisation. The relevance of these instants is also acknowledged by elite-level coaches. 11 For example, Pep Guardiola implemented a 5 s rule, dictating specific procedures to be executed during said episodes. 12 The Federation Internationale de Football Association (FIFA) also asserts in its coaching manuals that “good teams exploit this short window of opportunity before any team organisation can take place”, emphasising transitions as “key to winning football matches”.13 (pp. 13,83) In sum, research- and practice-based evidence on the significance of transitions is compelling and mounting. Nonetheless, its related corpus remains both scarce and largely reliant on notation methods. While notational-based analysis may provide valuable insights, it possesses inherent limitations in capturing the complexities of within- and between-teams interactions. To overcome these limitations, high-sampling-rate matrices derived from position-tracking data14,15 may be required, enabling a more comprehensive understanding of movement patterns, spatial configurations, and team interactions.
Recent technological strides on position-data collection permit an increasingly detailed examination of football interactive behaviours. Within this realm, several metrics and concepts have been recently used to analyse the game's interactional dynamics: e.g., interpersonal angles, interpersonal distances and dominant regions. For instance, Carrilho, Couceiro 16 addressed the properties of player-ball-goal angles, revealing how movement synchronisation is altered by match location, ball possession status and players’ instantaneous field positioning. Travassos, Monteiro 17 examined how certain distances and angles near the ball relate to passing success. Rein, Raabe and Memmert 18 employed Voronoi diagrams – a type of “proximity map”, identifying pitch areas that a player can reach before any teammate or opponent – to analyse the impact of spatial dominance on competitive outcomes. Increased offensive control near the opponent's goal was positively associated with match success. As coaches continually provide augmented feedback on individual positioning and collective dynamics, which can be characterised by interpersonal distances, angles or dominant regions, these studies offer “actionable” information that can inform training design, and support game management. Nonetheless, position-data-based research disproportionately focused on the offensive phase of the game, leaving defence comparatively underexplored. 19
Research on defensive play remains sparse and varied, focusing on topics as defensive pressure,20,21 synchronisation,22,23 and ball recoveries.24,25 Its corpus faces several limitations, including: small sample sizes, a reliance on highly descriptive analysis, and underrepresentation of competitions outside major European leagues. 19 These challenges are particularly evident in the context of defensive transitions, due to its research paucity. Notable exceptions in this domain include the works of Bauer and Anzer 26 and Forcher, Forcher, 27 which provided valuable insights into key variables influencing transition effectiveness. Future studies could explore underutilised position-based metrics, as interpersonal distances, interpersonal angles, and dominant regions to better understand defensive transitions dynamics’. These insights may supply coaching staff with relevant information for improving teams’ performance.
Another topic of interest concerns the spatial scales of interaction – e.g., patterns observed near the immediate ball location may differ from those farther away. Existing group-level research on defensive play has focused on players’ positioning within specific pitch areas (e.g., those closer or farther from the own goal) and the behaviours of structural lines (e.g., defenders, midfielders, or attackers) – a comprehensive discussion is found in Forcher, Altmann. 19 However, coaches often assign tactical roles based on players’ distances to the ball, adhering to core tactical principles.28,29 Analysing transitions through this perspective, focusing on subsets of players, defined by their proximity to the ball, could reveal useful patterns and provide contextualised, game-relevant information. 30
As posited by Woods, Mckeown, 31 player's decision-making, and subsequent on- and off-the-ball movements “do not appear in a vacuum” (p. 2). Individuals act within ever-changing game-settings, bound to the locally available sensory information. 32 Specifically, and regarding the immediate ball-holder, his decision-making is operationalised through one of two technical actions: (1) ball passing or (2) dribbling. As to the former, position-based evidence suggests that the availability of different passing types (e.g., penetrative or backwards passes) varies according to the pitch location, with each type being at players’ disposal over different time intervals (shorter or longer intervals).32,33 Pertaining dribbling, limited evidence from 1-vs.-1 episodes indicates that high-levels of unpredictability in interpersonal coordination might be key to attacking success, with offensive players often disrupting dyads with opponents by adjusting their instantaneous velocity.34,35 However, to the extent that we are aware, no published research has directly addressed the landscape differences between episodes where ball progression occurs through passing, through dribbling or by a combination of both (henceforth named mixed progression).
Based on previous considerations, this study aimed to clarify how players performing specific core tactical principles (i.e., those executed in the spaces that surround the ball; within the game centre) ought to perform during open-play defensive transitions to hinder ball spatial progression by opponents, through each of the possible attacking technical means (i.e., passing, dribbling or mixed progression).
Methods
Sample and data collection
The sample of this study consisted of ninety-four matches from the Portuguese First League (Liga Bwin), season 2022/23. Specifically, the analysis targeted the top-3 ranked teams from said season, henceforth referred to as focus teams. Each team contributed with a minimum of 30 matches to the sample, from across the 34 matches they each played throughout the season. Data used were gathered by Footovision (Paris, France), through a computer vision tracking system, at an acquisition rate of 25 fps. Apart from bi-dimensional coordinates of players and ball positioning at each instant (longitudinal and lateral coordinates), data also included information regarding the goals’ locations, the team in possession, events data (e.g., passing or dribbling actions), and whether the ball was alive or dead (meaning that match was running or stopped). The study was approved by the Ethics Committee of the Faculty of Human Kinetics, University of Lisbon (approval no. 25/2021) and conformed to the recommendations of the Declaration of Helsinki.
Data processing and variables
Initially, preprocessing involved merging data from the files providing match metadata (e.g., team identification, attacking directions) and files with time and location of tagged events (e.g., passes, dribbles, scoring of goals). To identify relevant open-play defensive transition episodes, the following criteria were employed: (1) eligible sequences began through a possession loss by one of the focus teams, with opponents maintaining its control during at least five seconds; (2) the ball loss occurred in the focus team's offensive midfield (the one farther from their own goal); (3) the instantaneous goal difference between competing sides was less than three goals (< 3 goals); (4) no players were previously sent-off by the referee (n = 22 players in the pitch); (5) the defensive episode lasted a minimum of five seconds. These criteria were used to ensure that defensive transitions analysed were of the most common type in elite-level football – (1) possession losses occurring far from the own-goal; (2) episodes concluded without a ball possession recovery2,7 – and that both teams still had a chance to win the match when each specific episode occurred (an “open scoreboard” and balanced numerical relations had to be evident).
In episodes where previous criteria were observed, the initial five seconds after possession swap were selected for further analyses. Given this study's large sample size, we opted for a time-based criterion for the identification of defensive transition's ending instant (i.e., five seconds after the possession exchange). This contrasts with more comprehensive qualitative criteria, considering team's interaction dynamics. 7 However, this time-based criterion is consistent with “applied” definitions of defensive transitions – a short period following a possession exchange13,20 – and with research findings revealing that most of these episodes last circa five seconds. 7 During this process, missing or invalid data (e.g., erroneous timestamps or NaN values) were checked. For the intervals of interest, no missing or invalid data was found.
Afterwards, to examine the match-play landscape, several intra- and inter-team predictor variables were calculated, addressing players’ relative distances, angles, and dominant regions. To do so, at each time frame we identified the closest, second closest and third closest defender to the ball, positioned between the ball and their goal (named as first, second and third defender, respectively). Following, the ensuing metrics were calculated for each of these players in every defensive transition instant:
Relative distance to the ball - computed as the Euclidian distance of the focus player (i.e., first, second, or third defender) to the ball. Individual Voronoi cell area – computed as the Voronoi cell (VC) area of the focus player. VC area was calculated using the procedures described by Kim.
36
Team's spatial dominance – calculated as the difference between the sum of VC areas of teammates and the sum of adversaries’ VC areas, in the space bordering the focus player's region (see Figure 1). Player-environment angle – calculated as the angle formed by the focus player, the own team's goal centre and an additional game-play element. For the first defender we chose this element as the match-ball, for the second defender we elected the first defender, for the third defender we considered the second defender (see Figure 2). This was decided based on the notion that the first defender is strongly attracted by opponent's on-the-ball actions, with the second defender aiming to provide “security” to the first defender, and the third defender to the second one. In all angles, the own team's goal-centre was used as the angle's vertex.
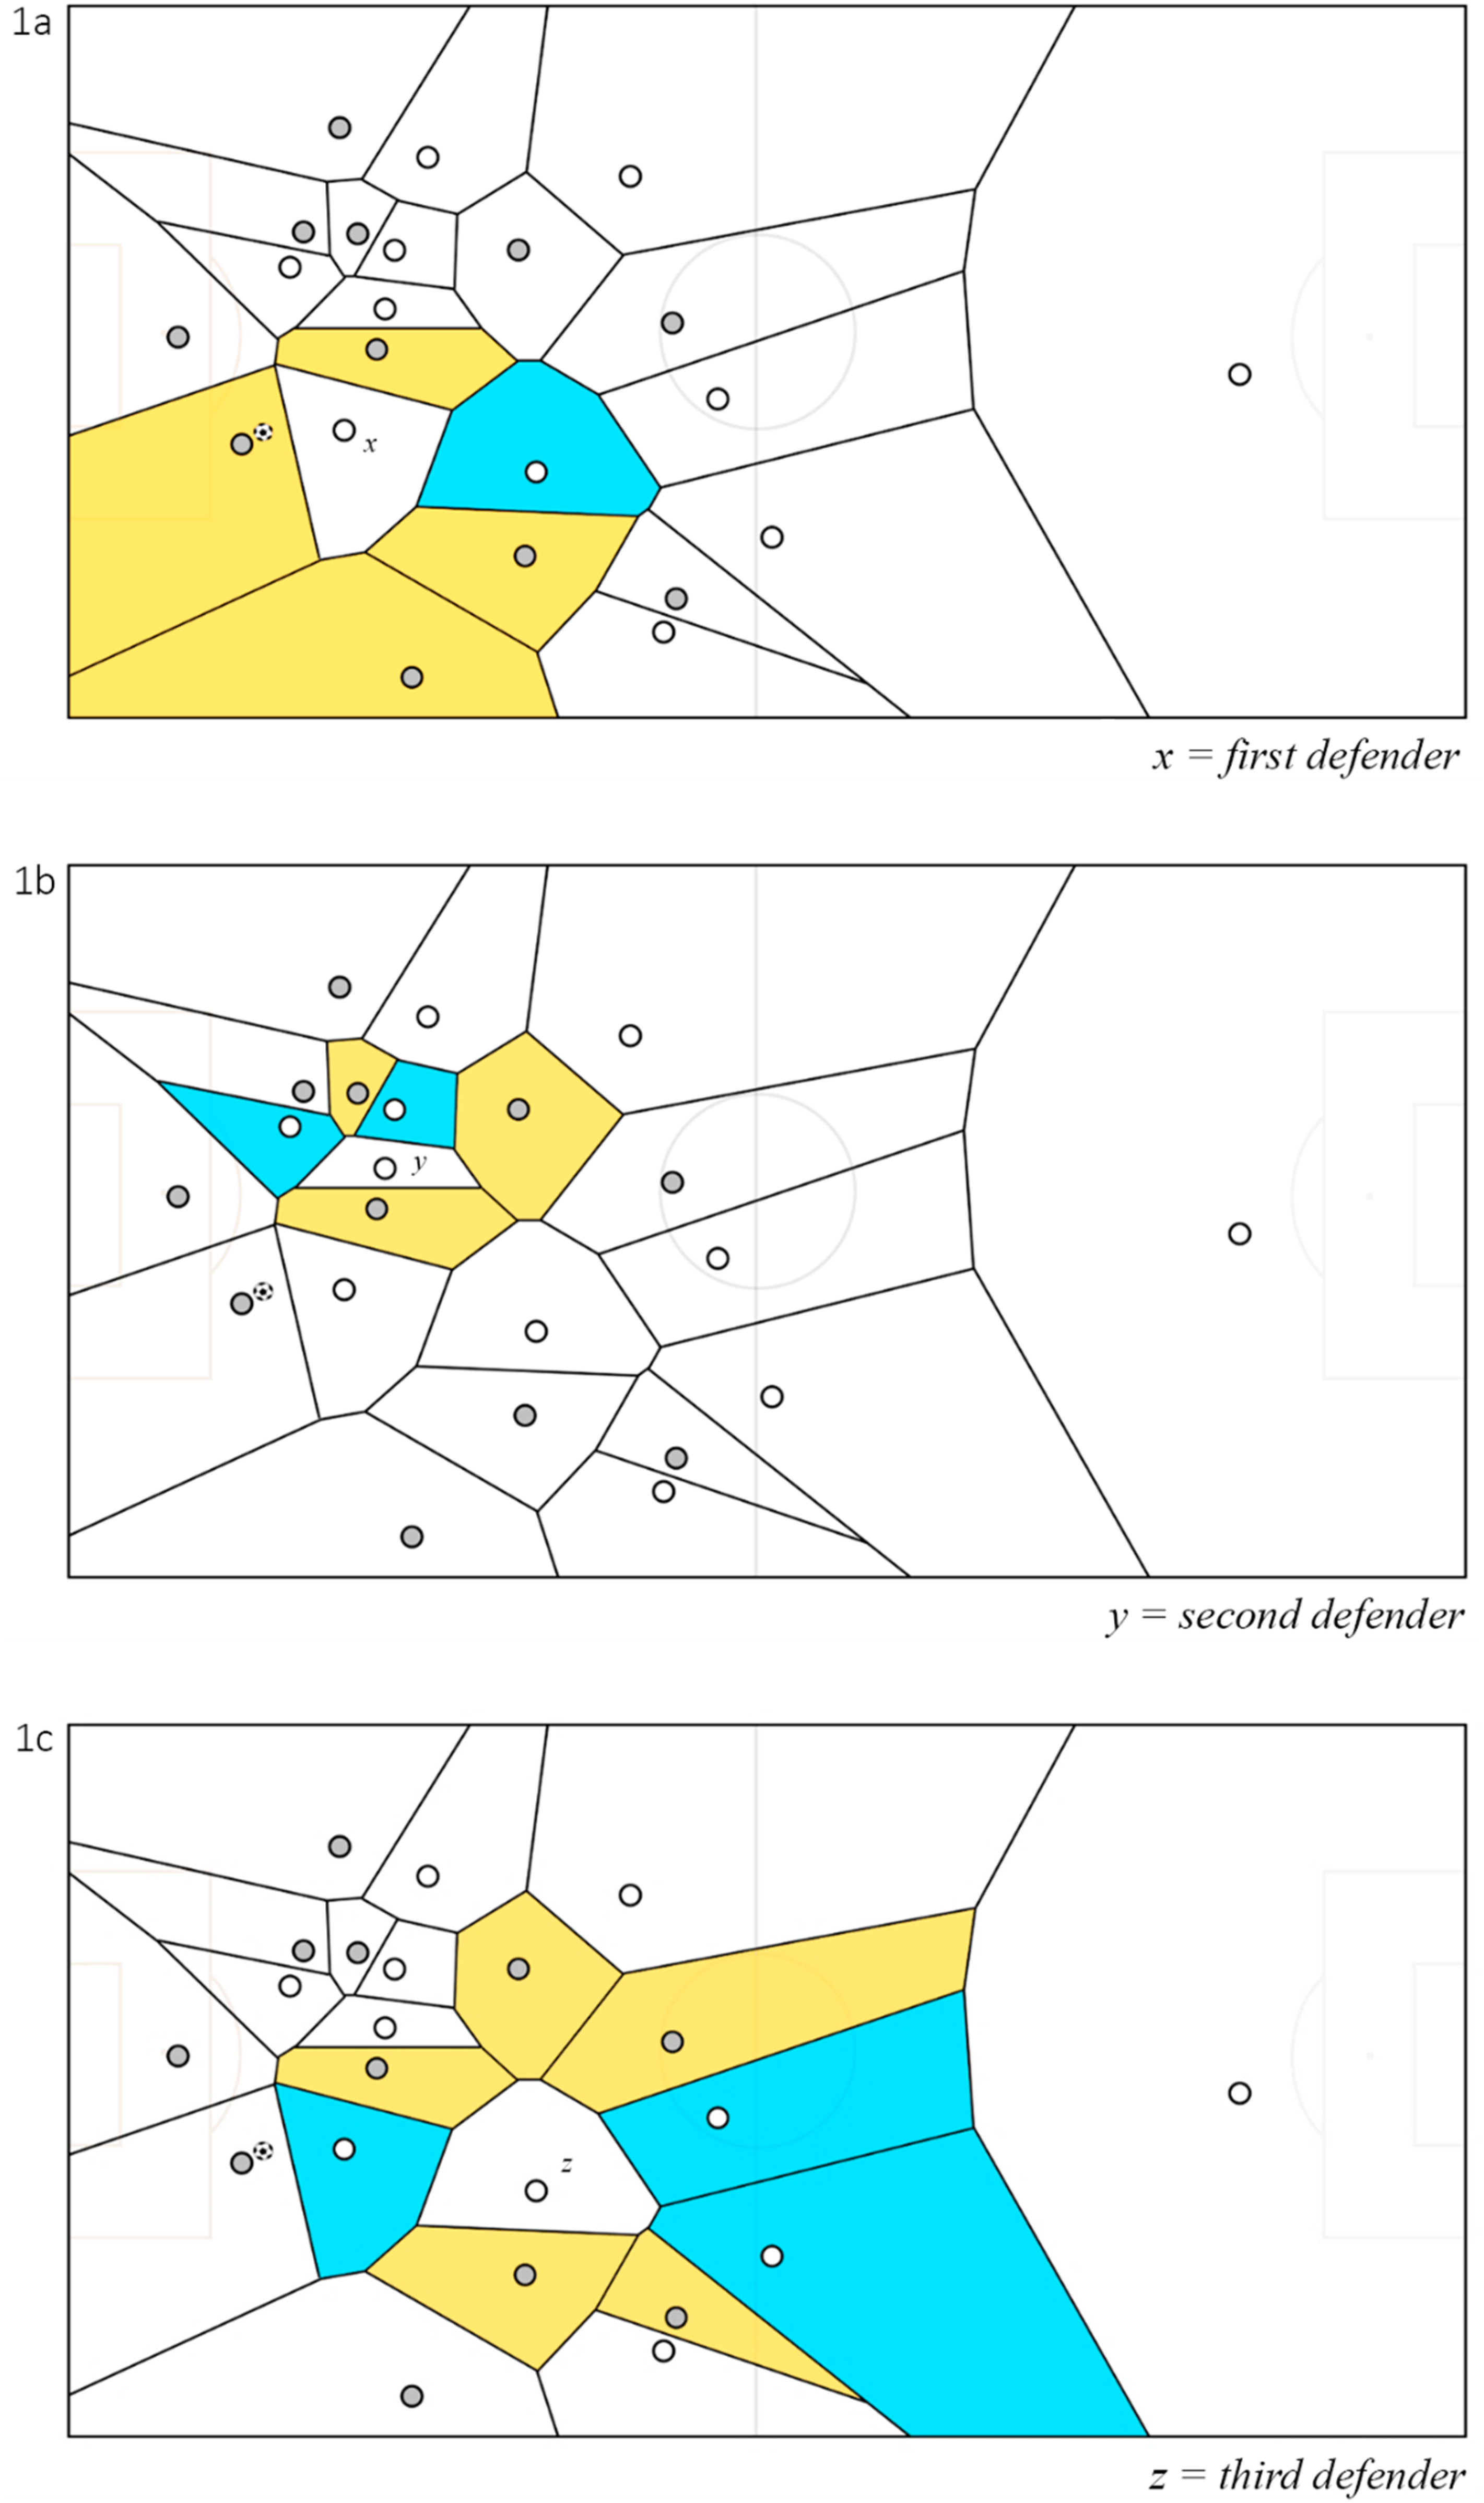
Examples of team's spatial dominance in areas surrounding the relevant defenders. (a) Spatial dominance around the first defender. (b) Spatial dominance around the second defender. (c) Spatial dominance around the third defender.
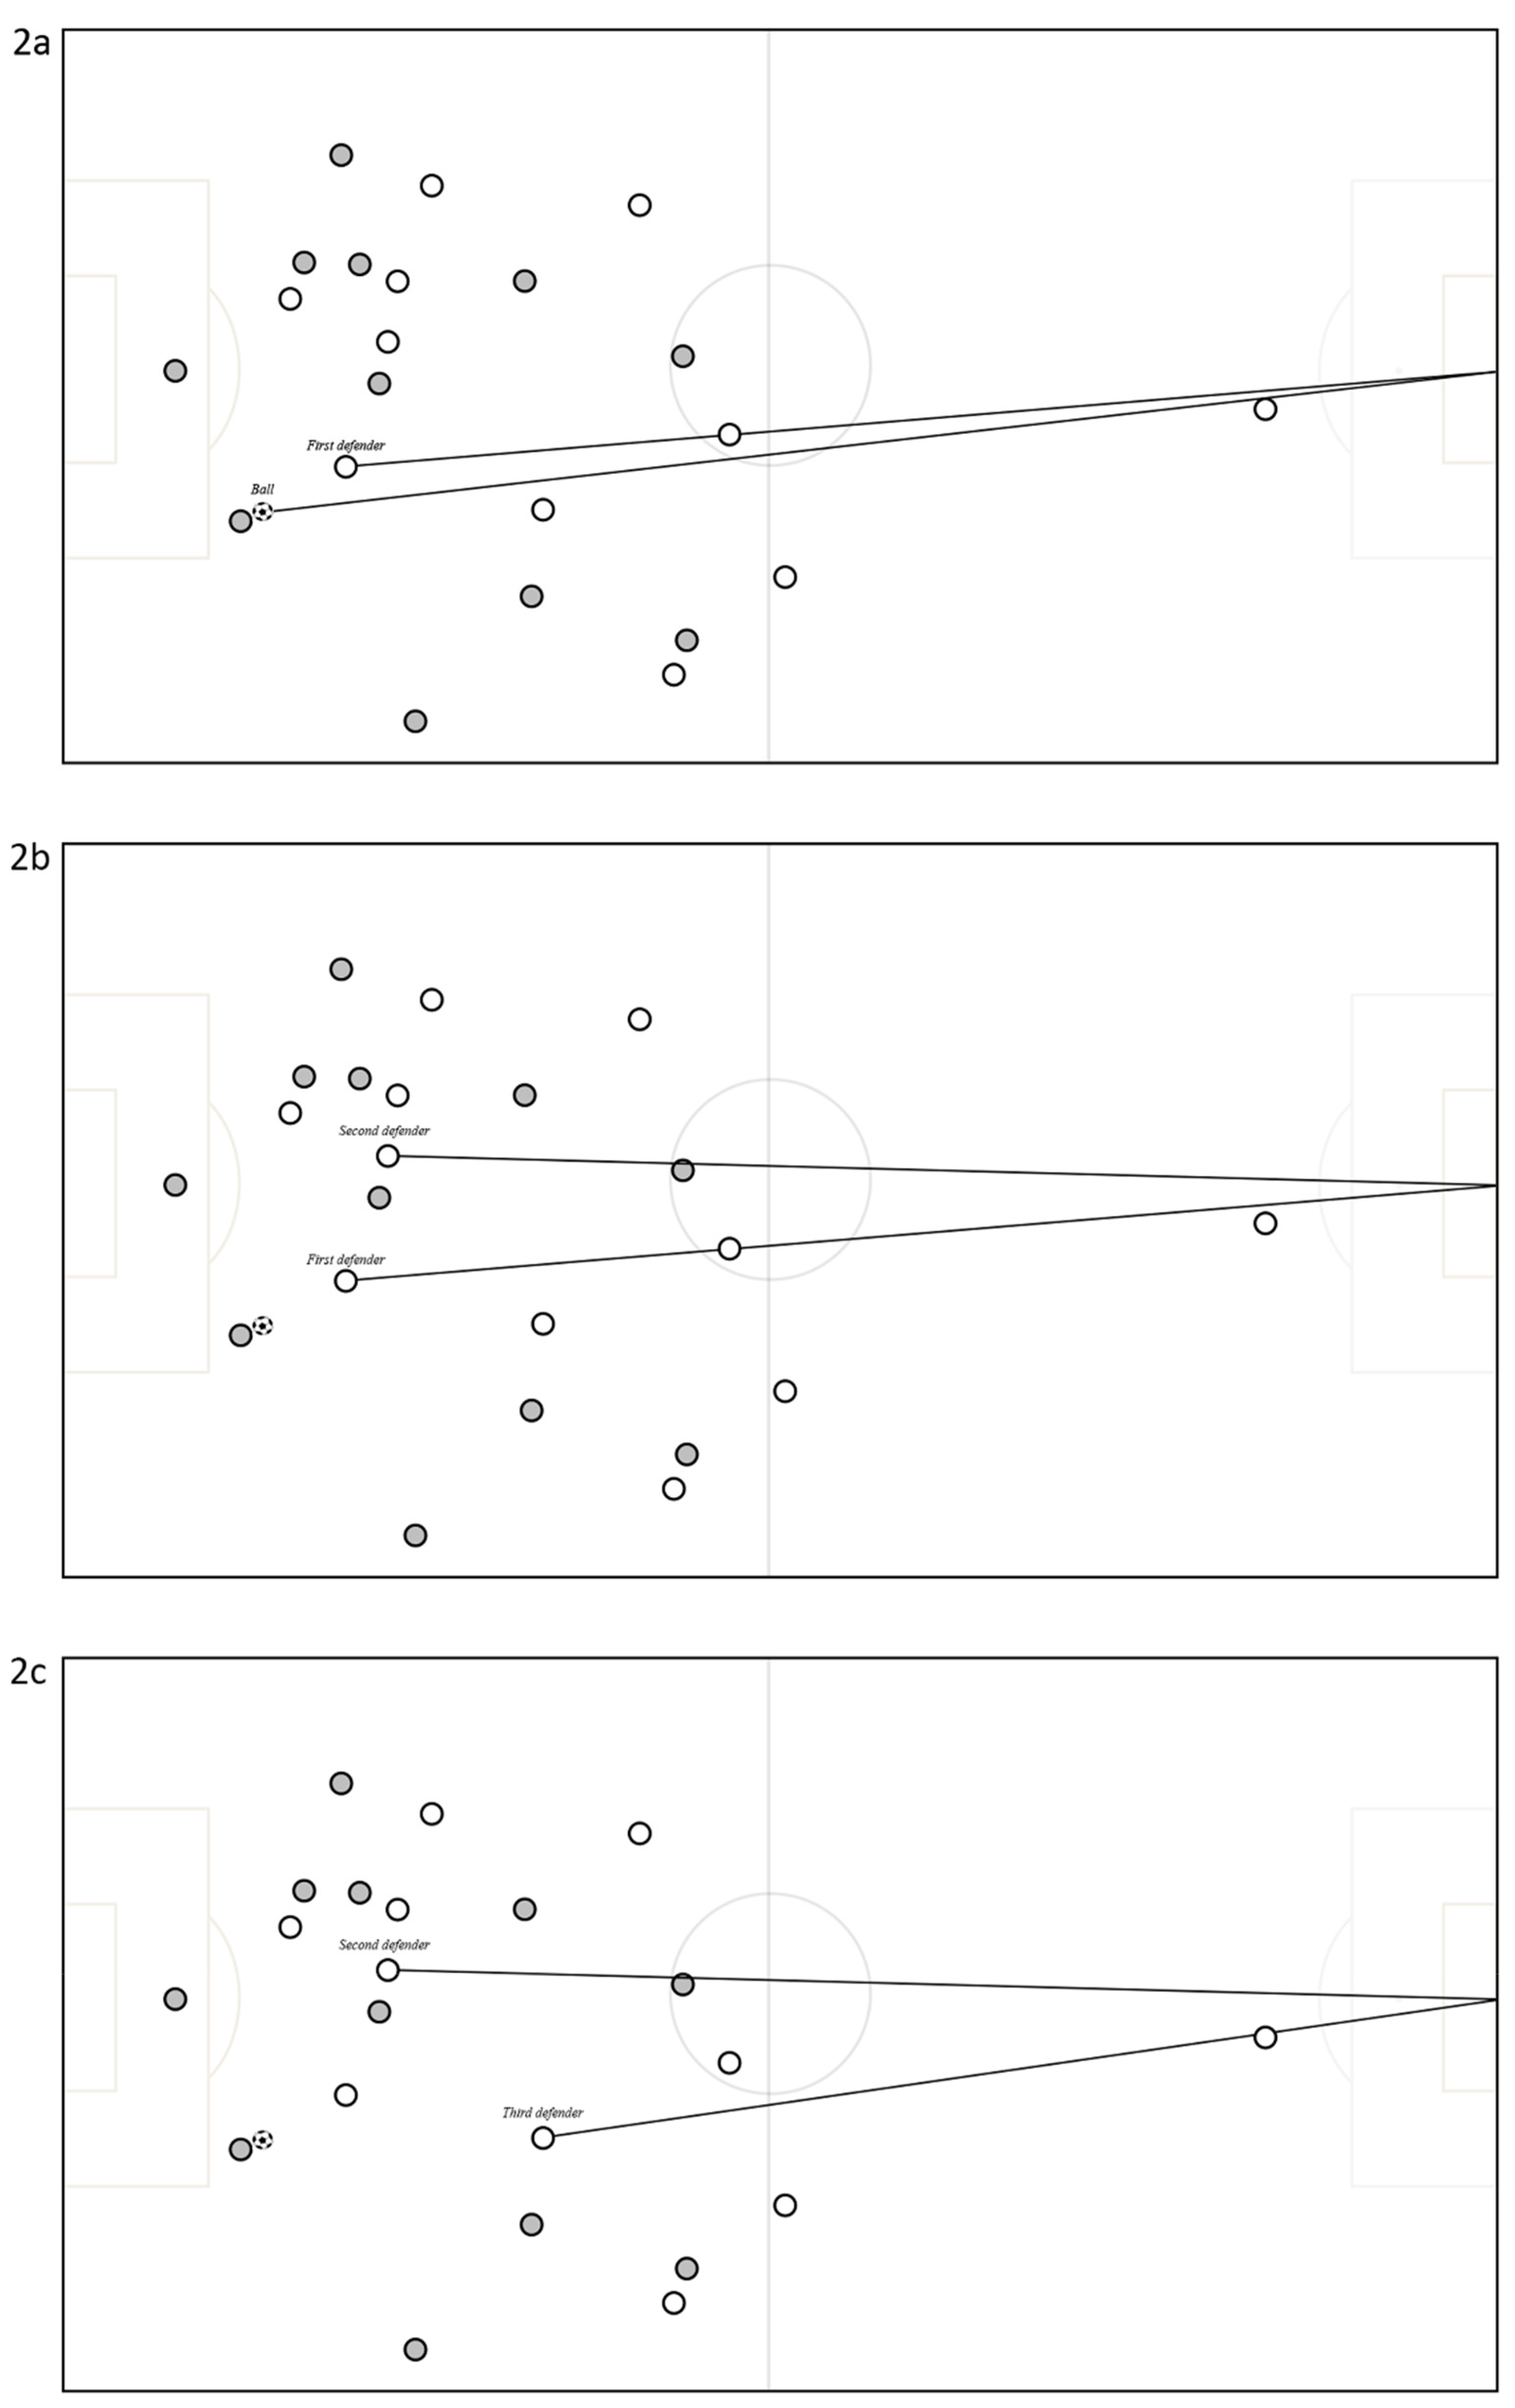
Examples of player-environment angles. (a) Angle between the ball, the own-goal, and the first defender. (b) Angle between the first defender, the own-goal, and the second defender. (c) Angle between the second defender, the own-goal, and the third defender.
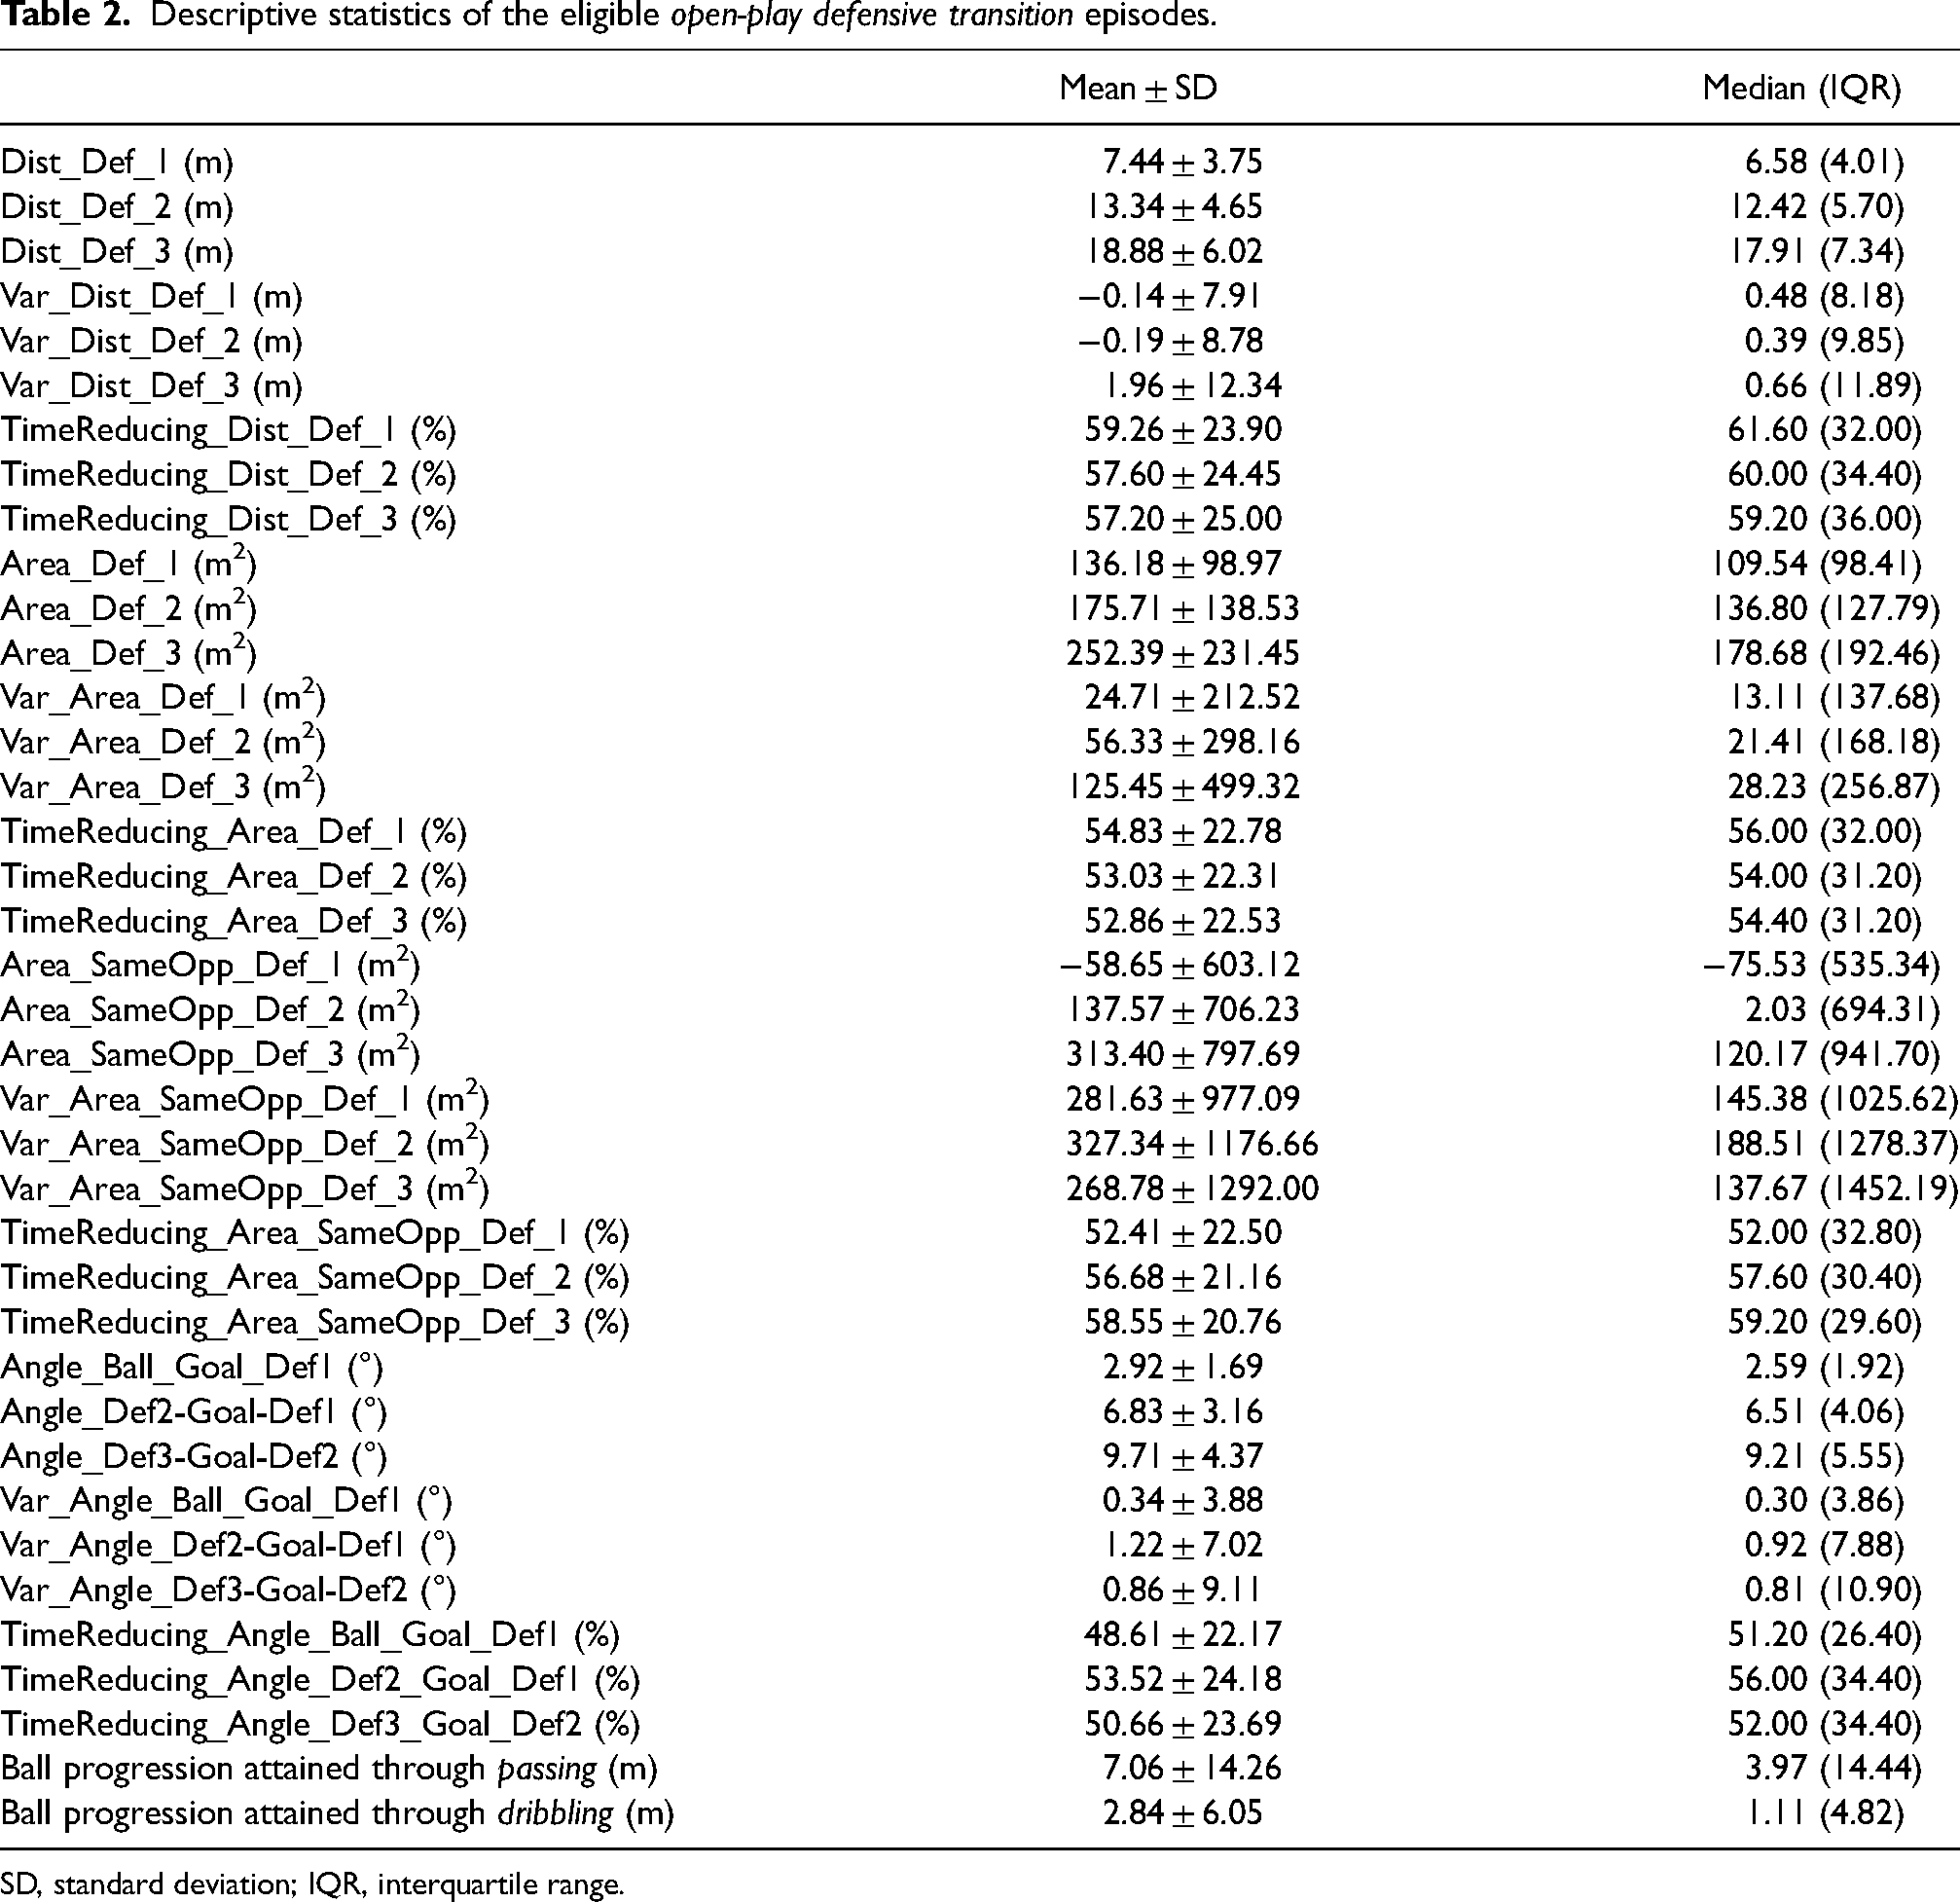
Afterwards, to synthesise the data matrix, and in accordance to current suggestions on how to improve match analysis, 37 derivatives of these variables were calculated, examining their ranges and temporal evolution throughout each episode. These derivatives included: (1) each episode's mean, (2) the difference between the episode's start and ending instants, and (3) the percentage of the episode duration during which the measured value decreased. The operational definitions, measurement units, abbreviations, and an interpretation guide to the resulting thirty-six metrics are presented in Table 1.
Synthesis of the intra- and inter-teams’ predictor variables.
As to the response variable, total ball progression (regardless of the technical means used by opponents) was initially considered. After thoughtful consideration and data exploration, two other metrics were collected in each episode (starting at instant
Statistical analysis
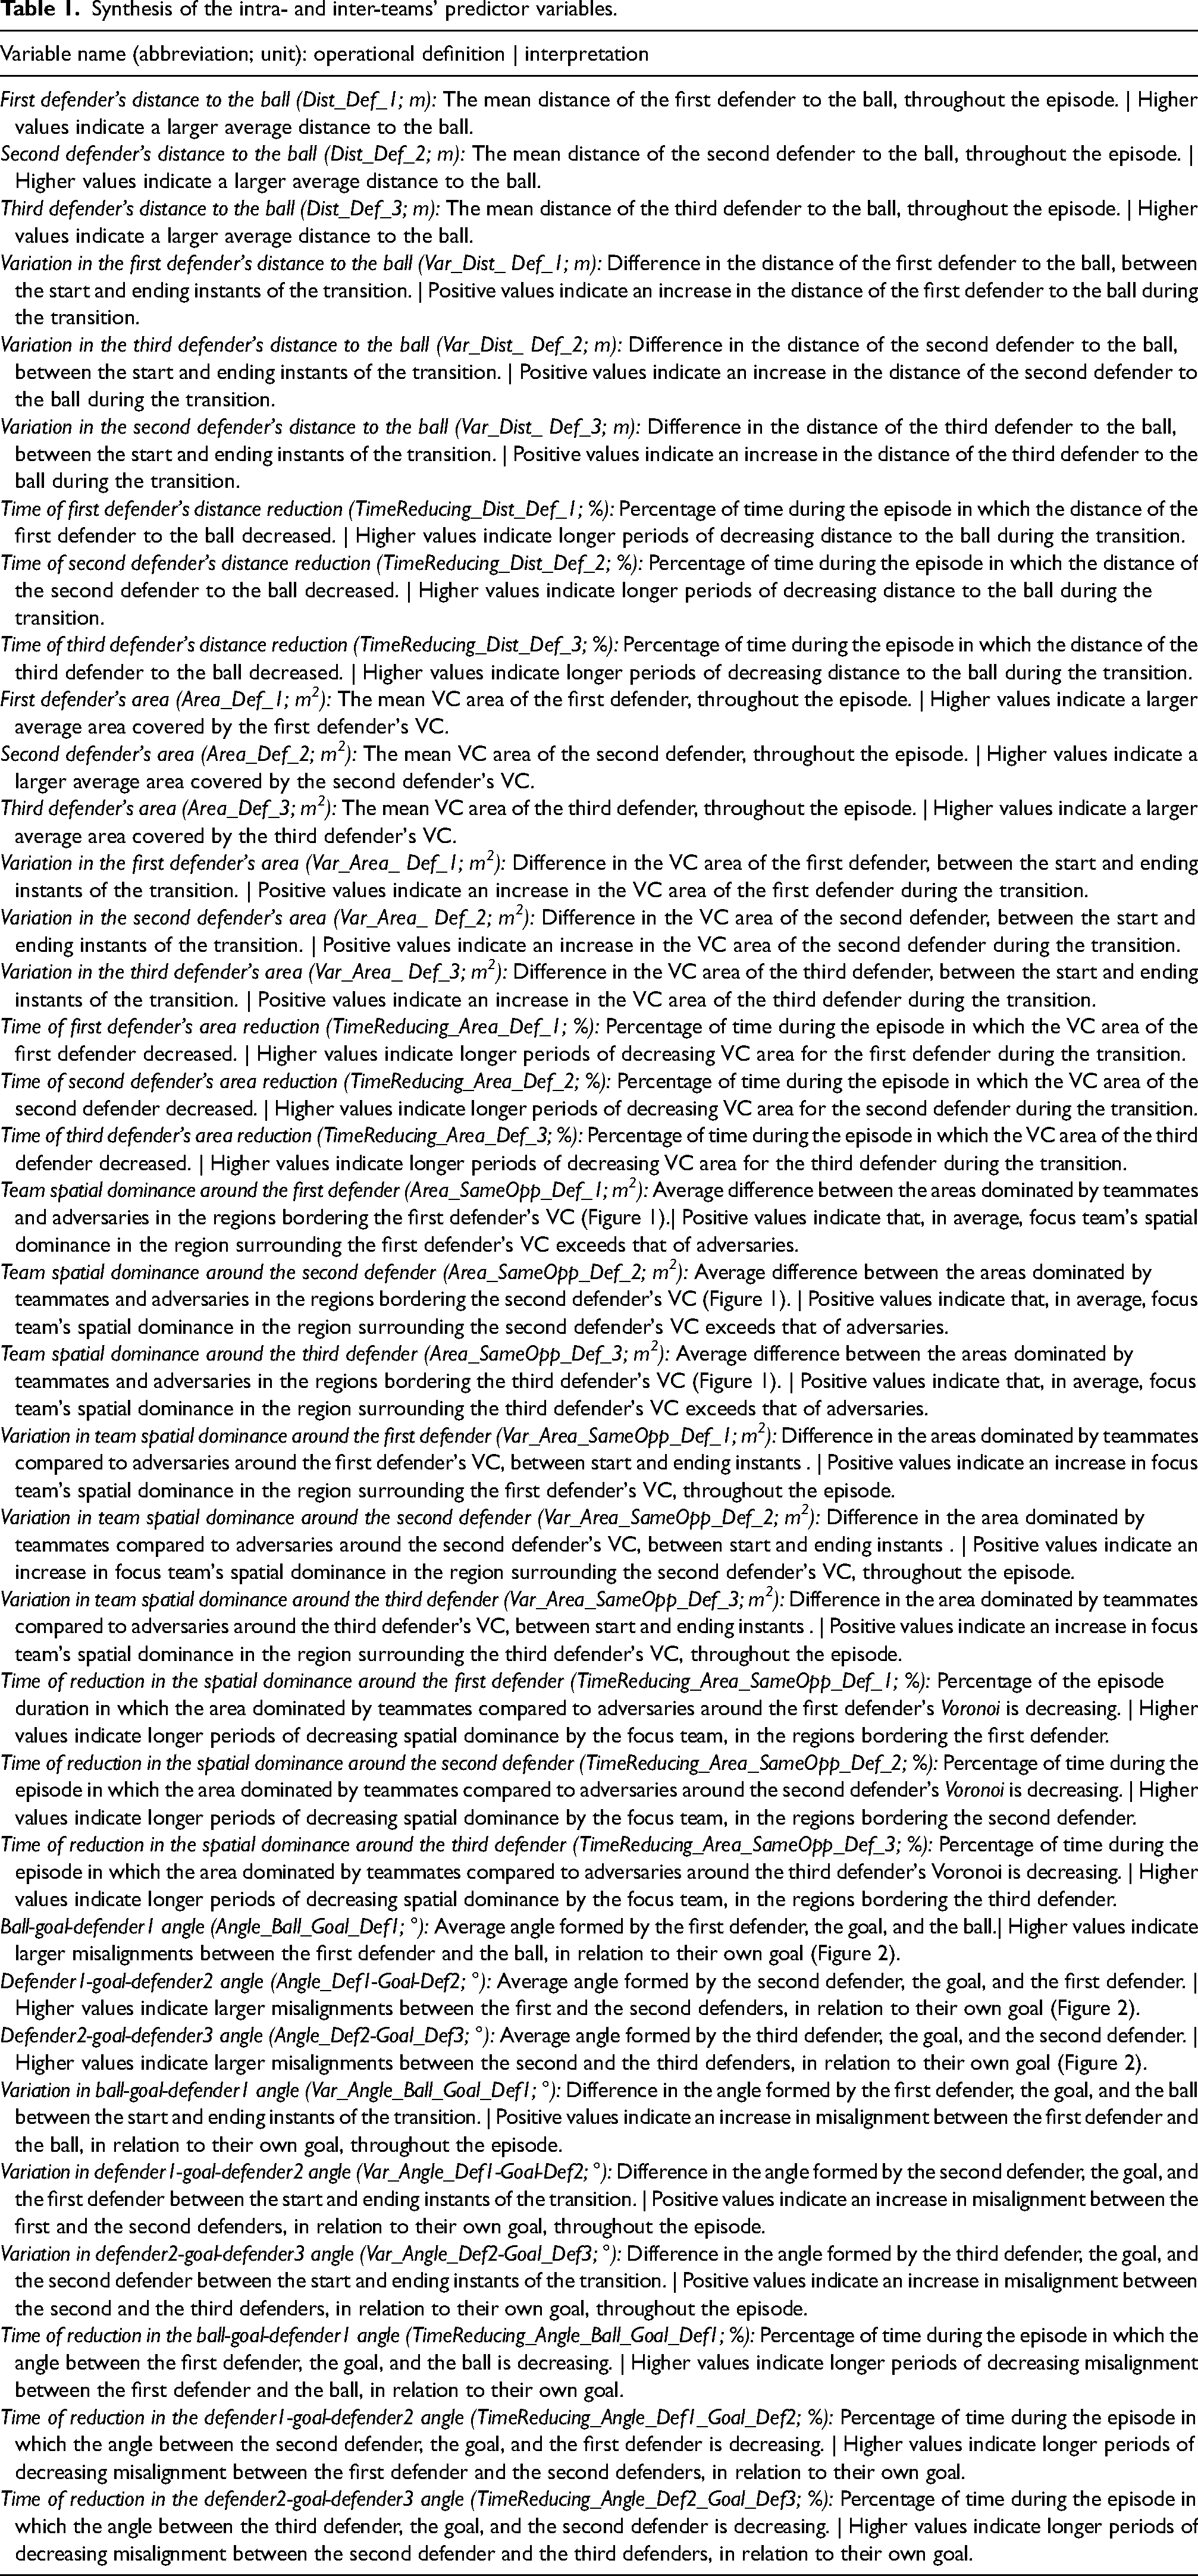
Initially, the thirty-six metrics related to the match-play landscape, as well as the ball progression permitted to opponents, were imported into SPSS Statistics 28.0 (SPSS® Inc., USA) for the calculation of descriptive statistics (see Table 2). Afterwards, to explore the hypothesis of linearity in the relationship between the predictor variables and the opponent's progression, scatterplots were produced and examined. The variance inflation factor (VIF) was used to assess potential collinearity in predictor variables, with a threshold value set at ≥ 10. 38 Since all metrics had values significantly below the threshold, none were initially excluded from the models. Detailed VIF values for the thirty-six predictor variables can be found in supplementary tables. Prior to the models’ calculation, all predictors variables were standardised through min-max scaling, using the preprocess function from the caret library (version 6.0.94), in R (version 4.3.2). Outliers were identified using the interquartile range (IQR) method, where values exceeding 1.5 times the IQR above the third quartile or below the first quartile were flagged. However, the number of outliers identified was considered negligible and did not necessitate additional adjustments.
Descriptive statistics of the eligible open-play defensive transition episodes.
SD, standard deviation; IQR, interquartile range.
To test the effects of predictors on each type of ball progression (passing-, dribbling- or mixed-progression), three separate Linear Mixed Models (LMM) were conducted using a forward stepwise procedure, through the lmer function from lme4 package in R. 39 Each LMM was estimated using solely data from episodes where the corresponding type of progression was observed (passing-, dribbling- or mixed-progression). LMM extend linear regression, by incorporating both fixed and random effects. Fixed effects are analogous to linear predictors in standard linear regression. In this study, the thirty-six variables (see Table 1) and the team factor were selected as fixed effects. The team factor was used to determine whether any of the focus teams, on their own, facilitated different levels of opponent's progression by any type, compared to the team arbitrarily chosen as the reference. As to random effects, they are not directly estimated, but summarised by their estimated variances and covariances. 40 Considering the individuality of each game - “every match has its own story” - and aligning with previous football performance related research,18,41 this element was modelled as a random effect. The decision to use match as the sole random effect was based on its ability to account for repeated measures within each match, and the nested and complex nature of situational variables, such as opposition quality and match location. The Akaike Information Criterion (AIC) 42 was used to compare model fits and select the optimal LMM, ensuring a balance between model complexity and goodness-of-fit. The final models, presented in Table 3, were chosen based on better AIC values. An R2 value was also computed, following procedures from Nakagawa and Schielzeth, 43 to provide a measure of goodness-of-fit (Table 3). The models’ goodness-of-fit, the identification of eligible transitions, the data processing and the statistical testing were all conducted in R (version 4.3.2).
Linear mixed model results, with landscape variables and team as fixed effects, and match as random effect.
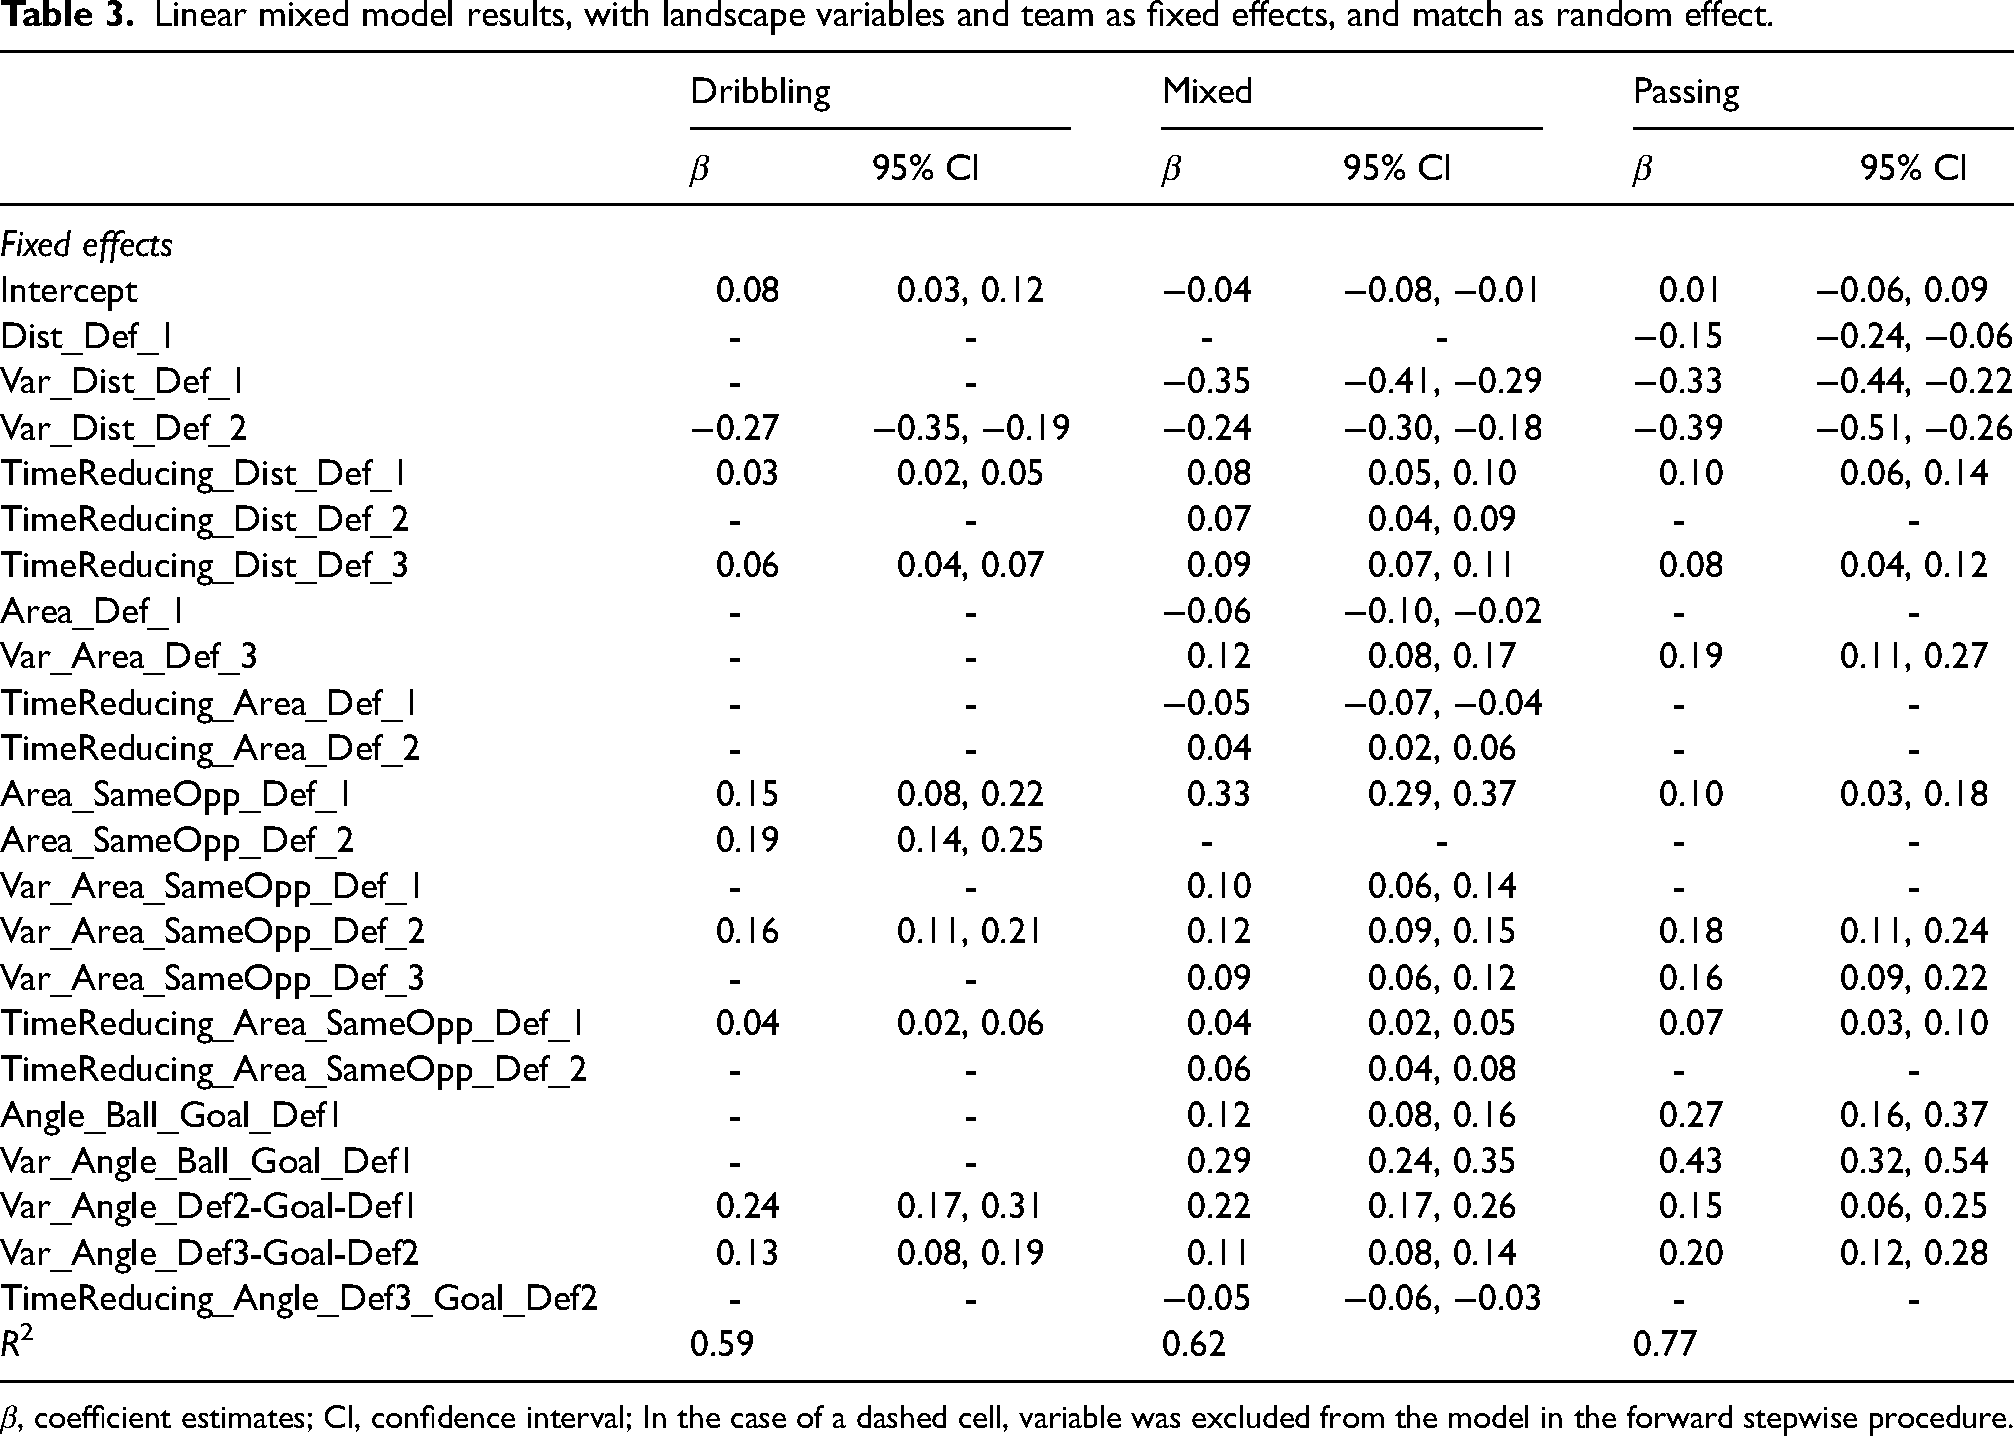
β, coefficient estimates; CI, confidence interval; In the case of a dashed cell, variable was excluded from the model in the forward stepwise procedure.
Results
Three-thousand two-hundred and fifty-five (n = 3255) open-play defensive transition episodes were found eligible for this paper. The frequency of progression types permitted to opponents revealed that mixed progression was most prevalent (n = 2199 episodes), followed by progression solely through dribbling (n = 623) and passing (n = 423).
Descriptive results
As to descriptive results, most relevant findings suggest that ball spatial advances through dribbling tended to be lower than those allowed via passing. Specifically, each episode's passing-related progression averaged 8.03 m, whereas the dribbling-related averaged only 2.86 m. Additionally, focus players (first, second, and third defenders) typically spent most of each episode decreasing their distances to the ball, with their responsibility areas (i.e., individual Voronoi cell area) augmenting as they positioned themselves farther from the ball – the average VC area of the first defender tended to be smaller than that of the second and third defenders. Furthermore, VC areas usually increased throughout the episode, being larger at the fifth second (t = 5 s), than at the transition's start (t = 0 s). The focus team's spatial dominance around the first defender was lower than that of the opponent. In contrast, in regions surrounding the second and third defenders, the focus team dominated a greater area than the opponent. This suggests that the first defender's actions might have increased difficulty than those of its nearby teammates (i.e., the second and third defenders). In addition, the first defender's mean angle with the ball (Angle_Ball_Goal_Def1) tended to be smaller than the other computed angles computed (Angle_Def1-Goal-Def2 and Angle_Def2-Goal-Def3), implying a greater alignment of this player with the goal being defended. Table 2 presents a comprehensive overview of the descriptive results from the thirty-six predictor variables. Inferential analysis results from the LMM are displayed in Figure 3 and Table 3.
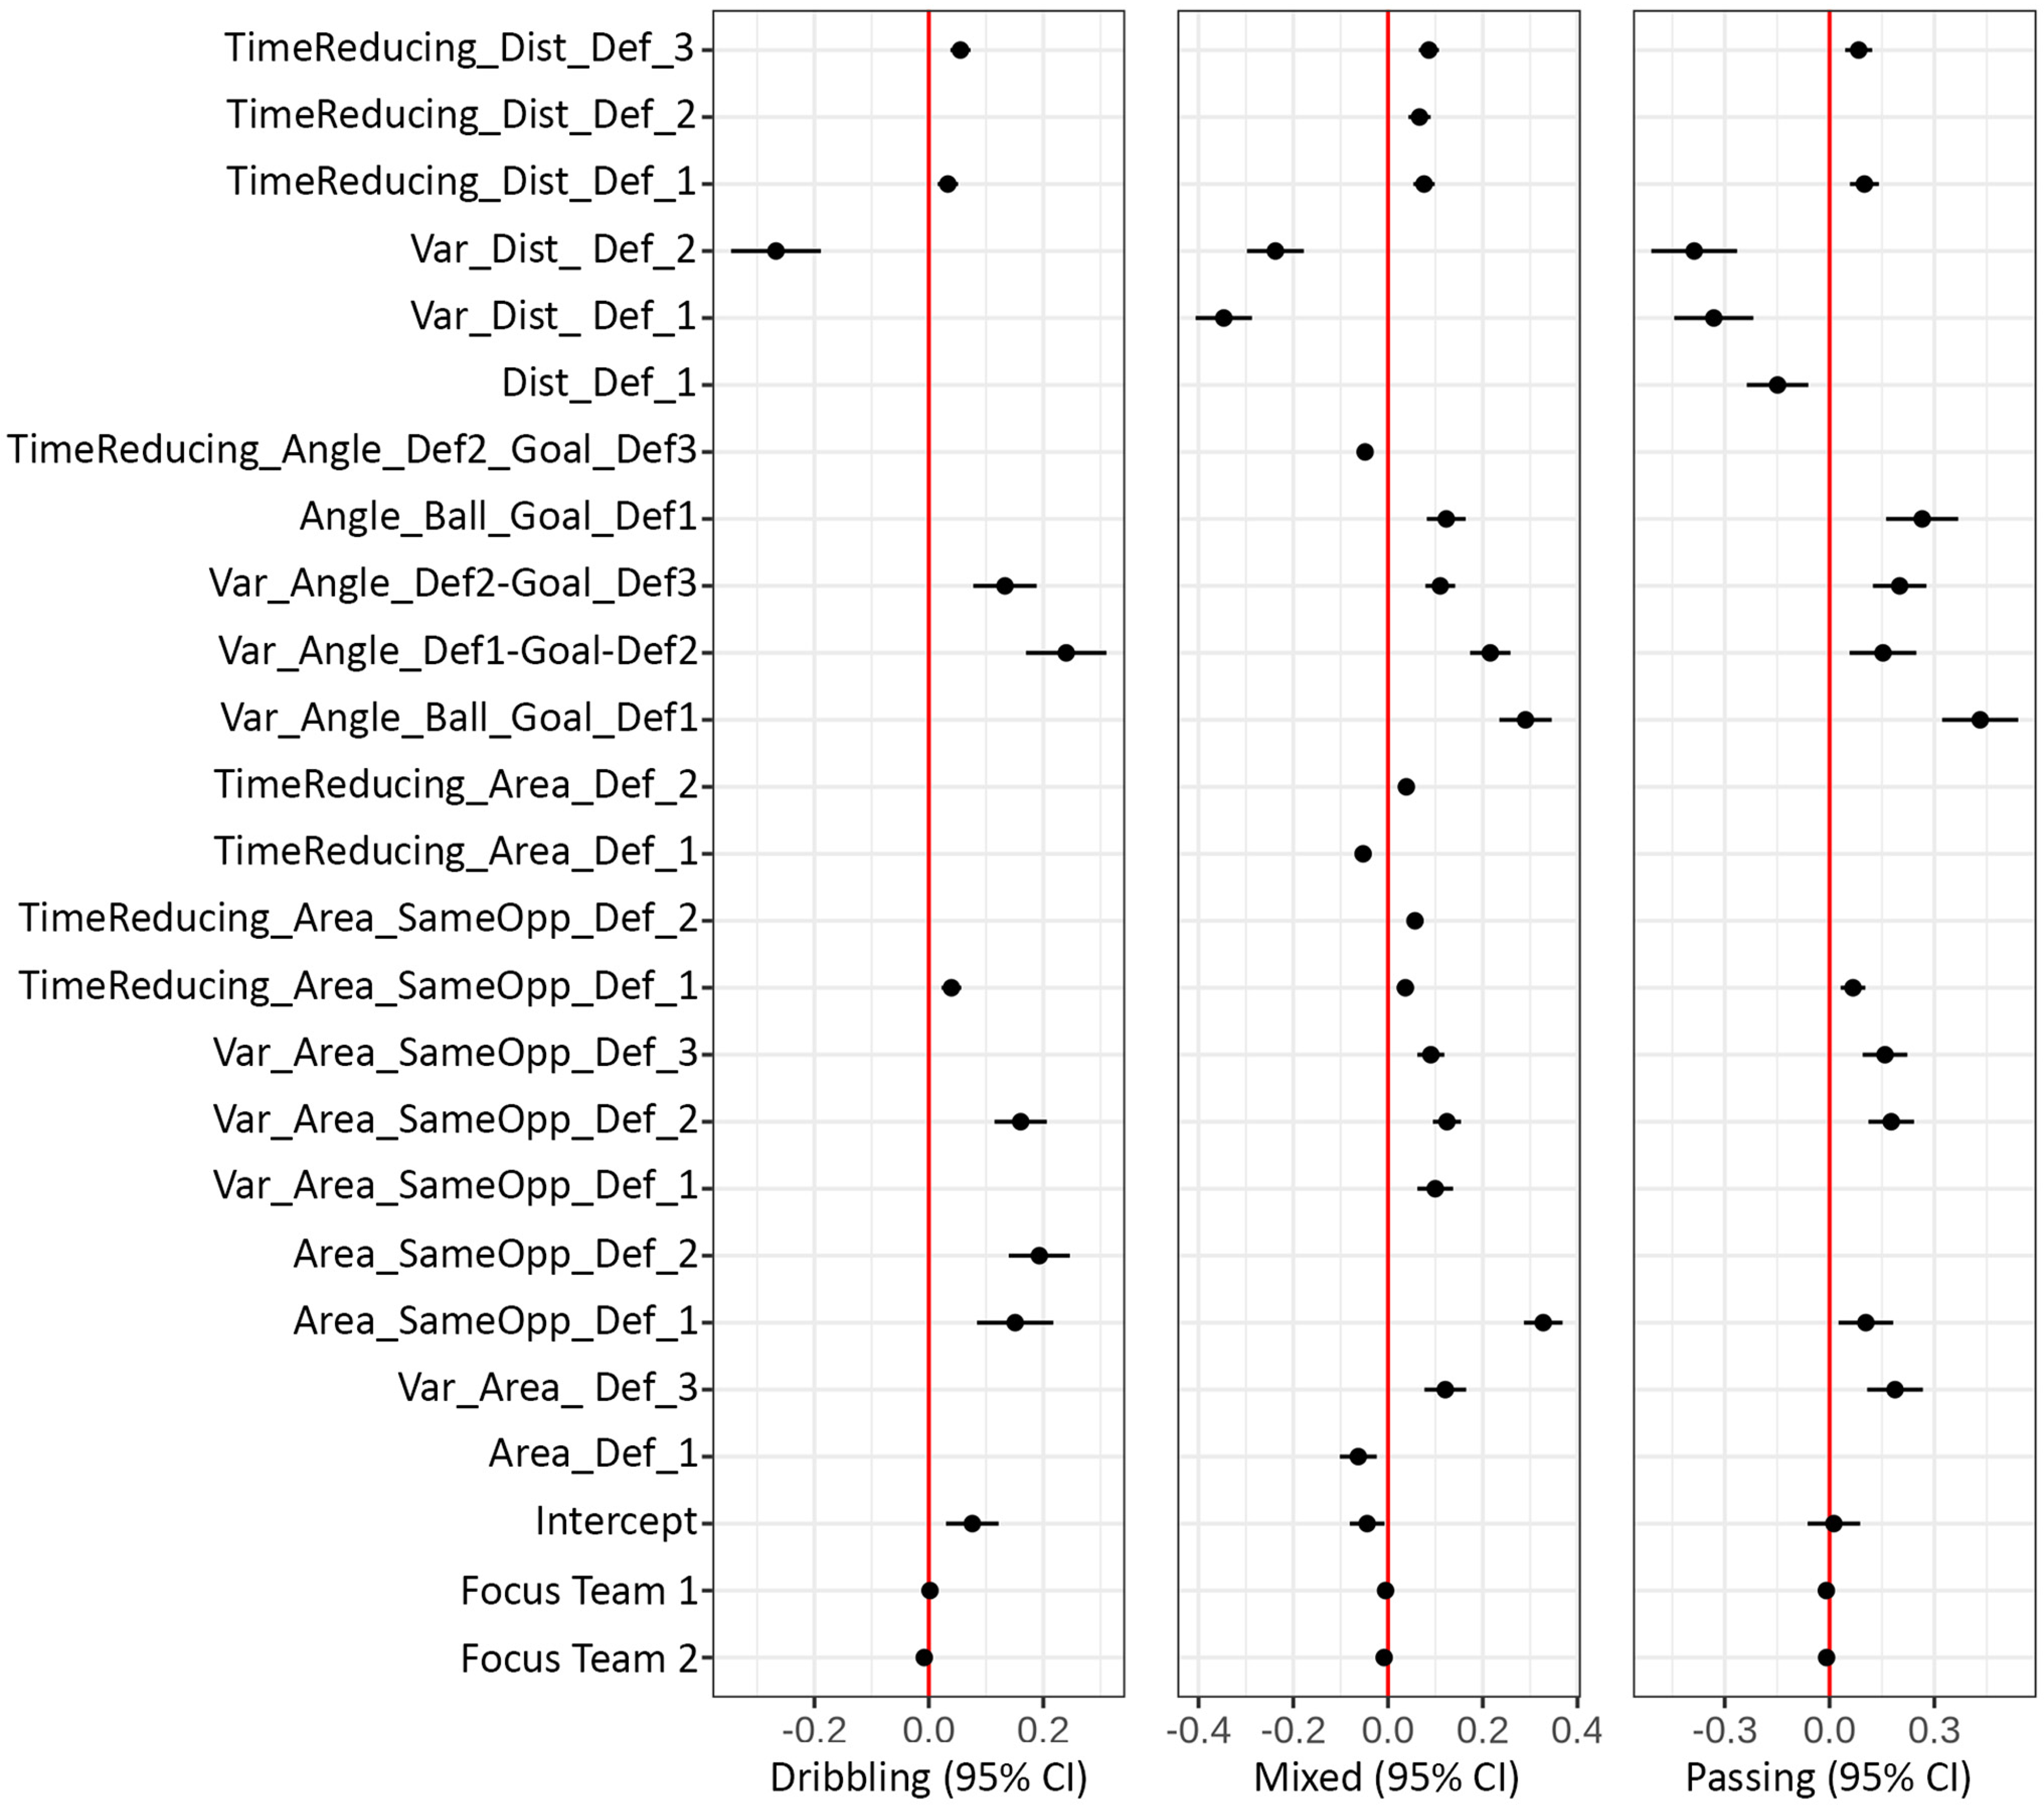
Regression coefficients for the Linear Mixed Models.
Dribbling-based progression
Pertaining the LMM on dribbling-based progression, the analysis of data revealed an inverse association between the magnitude of opponents’ advances and the variation in the second defender's distance to the ball (Var_Dist_Def_2). In practical terms, the focus teams conceded more ball progression when the distance from this player to the ball decreased throughout the episode. This metric emerged as the most significant tactical behaviour to determine dribbling-based advances (β = −.27; 95% CI = −0.35, −0.19). Additionally, the angles between the first and second defenders (Var_Angle_Def2_Goal_Def1), and between the second and third defenders (Var_Angle_Def3_Goal_Def2) displayed a strong positive association with ball progression (β = 0.24; 95% CI = 0.17, 0.31 and β = 0.13; 95% CI = 0.08, 0.19, respectively). The average spatial dominance around the first and second defenders (Area_SameOpp_Def1 and Area_SameOpp_Def2, respectively), and the variation in the dominance surrounding the latter (second defender; Var_Area_SameOpp_Def2) also influenced opponents’ advances throughout the pitch. These positive associations were characterised by coefficients of β = 0.15; (95% CI = 0.08, 0.22), β = 0.19 (95% CI = 0.14, 0.25) and β = 0.16 (95% CI = 0.11, 0.21), respectively. Metrics related to the percentage of time during which the first and third defenders reduced their distances to the ball (TimeReducing_Dist_Def_1 and TimeReducing_Dist_Def_3), as well as the interval during which a reduction in the focus teams’ space dominance around the first defender occurred (TimeReducing_Area_SameOpp_Def_1), were also comprised in this model. However, they exhibited minor coefficients and, consequently, modest impacts on dribbling-based progression. Notably, most variables concerning the third defender's actions were not included in the LMM, except for TimeReducing_Area_SameOpp_Def_3. Thus, tactical behaviours farther from the immediate ball location have a reduced to null influence on defending success achieved, when facing this on-the-ball skill (i.e., dribbling).
Mixed-based progression
In the model developed to estimate progression through a combination of passes and ball-dribbling (i.e., mixed-progression episodes), most relevant variables were the variation in the distance of the first defender to the ball (Var_Dist_Def_1; β = −0.35; 95% CI = −0.41, −0.29) and the focus team's mean spatial dominance around this player (Area_SameOpp_Def_1; β = 0.33; 95% CI = 0.29, 0.37). Several other metrics related to the variation of behaviours from the beginning to the end of the episode also impacted the ability to impede the opponent's advances. Specifically, these involved: Var_Angle_Ball_Goal_Def1 (β = 0.29; 95% CI = 0.24, 0.35), Var_Dist_Def_2 (β = −0.24; 95% CI = −0.30, −0.18), Var_Angle_Def2_Goal_Def1 (β = 0.22; 95% CI = 0.17, 0.26), Var_Dist_Def_3 (β = 0.12; 95% CI = 0.08, 0.17) and Var_Area_SameOpp_Def_2 (β = 0.12; 95% CI = 0.09, 0.15). Lastly, variables concerning the percentage of time during which areas and angles were reduced (i.e., TimeReducing_Area_SameOpp_Def2; TimeReducing_Area_Def_1; TimeReducing_Angle_Def3_Goal_Def2; TimeReducing_Area_Def_2; TimeReducing_Area_SameOpp_Def1) were also included in the LMM, although with small coefficients. It is noteworthy that “time-reducing variables” were encompassed in all three LMM (passing-, dribbling- and mixed-approaches), however they consistently exhibited the lowest impacts on the ball progression estimation, independently of the model observed (always β = <.10).
Passing-based progression
As to the passing-based progression, the variation in the angle formed by the first defender, the ball and the own-goal (Var_Angle_Ball_Goal_Def1) was the most impactful metric. In fact, it displayed the highest coefficient amongst variables in all models (β = 0.43; 95% CI = 0.32, 0.54). Therefore, increases in this angle throughout the episode appear severely linked to augmented opponent's progression. This was followed by the variation in the distances of the first and second defenders to the ball (Var_Dist_Def_1; β = −0.33; 95% CI = −0.44, −0.22 and Var_Dist_Def_2; β = −0.39; 95% CI = −0.51, −0.26) and by the average angle formed by the first defender, the ball, and the goal being defended (Angle_Ball_Goal_Def1; β = 0.27; 95% CI = 0.16, 0.37). Essentially, the five most influential metrics to predict ball advances through passing were those related to the variation in the distances of the first two defenders to the ball, and to the angular relations of said players with the environment. Metrics concerning each player's responsibility area and the team's spatial dominance in the game centre were also included in this model, nevertheless they appear less relevant for defending success against passing.
The following fourteen metrics were not included in any model: Dist_Def_2, Dist_Def_3, Var_Dist_Def3, Area_Def_2, Area_Def_3, Var_Area_Def_1, Var_Area_Def_2, TimeReducing_Area_Def_3, Area_SameOpp_Def_3, TimeReducing_Area_SameOpp_Def_3, Angle_Def2_Goal_Def1, Angle_Def3_Goal_Def2, TimeReducing_Angle_Ball_Goal_Def1, and TimeReducing_Angle_Def1_Goal_Def2. Therefore, concurring with observations that match analysis is improved when variables’ ranges and temporal evolution are examined, 37 we note that the variables addressing the episode's average value for a specific tactical behaviour were the least frequently included type of predictor variable across the three LMM (solely 5 out of those 12 metrics were incorporated in the models).
Discussion
In this paper, we examined the relationship between types of ball progression during open-play defensive transitions and the underlying cooperation and opposition dynamics. To systematise our discussion of findings, the four types of predictor variables alluded to in Data processing and variables subsections - (1) relative distances to the ball, (2) individual Voronoi cell areas, (3) team's spatial dominance and (4) player-environment angles - will be used as subheadings hereon:
Relative distance to the ball
A greater average distance between the first defender and the ball, reduced opponents’ advances via passing. This finding could be attributed to, at least, three game centre related reasons. First, a larger distance might allow this defender sufficient time to anticipate and react to the adversary's passing trajectory, thereby inhibiting forward passing. Second, a greater distance may denote a less aggressive defending approach, potentially “inviting” opponents to explore security-based passes, with sideways or backwards directionality. Third, increased pressure by the first defender (i.e., a smaller distance to the ball) might “force” opponents into long passes, which could result in augmented ball progression. However, this contradicts previous evidence, reporting greater success when “intense pressure” employed.7,44–46 This could be due to methodological differences, as said research evaluated success based on different criteria – i.e., the ability to regain possession or hinder adversaries’ shots. So, elements conducive to success should not be generalised, as they may differ according to the success criterion employed. Based on the present data, when ball possession recovery is unattainable (as in the episodes comprised in our sample), the first defender should avoid closing in on the immediate ball holder, as this diminished opponent's passing progression. Future analysis should incorporate additional game-elements (e.g., defensive block positioning, team-level compactness, or the number of attacking runs behind the last defensive line), to provide a more nuanced understanding of this predictor's influence on defensive transitions’ outcomes.
When the first and second defenders reduced their distances to the ball throughout an episode, all types of spatial advances were facilitated. The only exception was the non-inclusion of the first defender's distance (Var_Dist_Def_1) in the dribbling model.
As to this exception, and considering results from the previous paragraph, it appears that neither the mean nor the variation in this player's distance to ball were relevant for predicting dribbling progression. So, deterring advances in 1 vs. 1 duels may depend on the occurrence critical interpersonal distances between this defender and the ball holder, or in the detection of pressing triggers (e.g., an incorrectly executed attacking skill, or a specific opponent's body positioning), rather than on average or variation-related values. The criticality of interpersonal distances to competitive success has been highlighted in several sports codes.34,47–49 Regarding pressing triggers, expert practitioners’ recommendations on this topic merit further investigation. The remainder of findings suggest, unexpectedly, that greater progression is allowed when defenders reduce their distance to the ball. For the second defender (Var_Dist_Def_2) in dribbling episodes, this may reflect an effort to attain “stability”
50
near the ball. Two game-based scenarios can clarify this: (1) if the game context permits (e.g., low defensive compactness is evident) and the ball carrier is already advancing, the second defender might need to approach the ball to support the first defender, in accordance with football's core principles of play.
29
(2) Conversely, in scenarios where a certain “order” is evident, the second defender may not need to approach, or can even distance himself from the ball. The first and second defenders would stay farther from the ball, focusing on blocking forward passing lines. Future research should examine variables related to distances between defenders, team-level proximity, and ball velocity circulation (to ascertain the presence of “stability”) to better clarify this topic.
More time reducing distances to the ball by the first and third defenders consistently led to increased ball progression. As to dribbling, this likely reflect game-contexts which, by themselves, afford opponents with opportunities to advance. The first defender would need to close down on the ball-holder, and the third defender to “balance” the team's spatial occupation. As to passing scenarios, this might indicate the use of medium- or long-distance passes by opponents, requiring defenders to approach the new ball location. Interestingly, the second defender was absent in both passing and dribbling models. This suggests that the percentage of time the second defender spends reducing its distance to the ball is neither a positive nor a negative feature to impede ball advances. Perhaps the role of a second defender relates mostly to the maintenance of a certain “structural balance” near the ball – a sort of biotensegrity 51 –, that is not fully captured by the metric herein discussed.
Individual Voronoi cell area
Most variables related to players’ individual Voronoi cell areas were either excluded from the models or displayed negligible coefficients. This aligns with the accepted idea that individual behaviours – examined either through notation or position-based metrics – when analysed without adequate game-related contextualisation (team-specific, inter-teams or environmental elements), have limited predictive ability for performance results, 2 or in this specific case, for predicting ball progression during transition episodes.
However, increases in the VC area of the third defender (Var_Area_Def_3), were positively related to mixed and passing progression. We argue that this finding should be interpreted cautiously, as it is likely a consequence of the opponents’ ability to progress, rather than its root cause. Clarifying, the player identified as the third defender may change during an episode, as this identification was based on players’ distance to the ball. As opponents advance through the pitch, withdrawn areas of the defending team are invaded, with the third defender likely becoming a part of the team's last structural line. This line controls the “space behind” (i.e., offside areas), being typically positioned over thirty metres from the own-goal, 52 leaving defenders with large areas to cover. Therefore, we hypothesise that reducing the variation in the third defender's area is not an objective per se. This metric may only serve as a proxy for opponent's mixed- and passing-based advances.
Team's spatial dominance
Surprisingly, a higher average spatial dominance around the first defender (see Figure 1) was positively associated with all types of progression. This suggests that controlling the areas near the ball is a feature to avoid. These findings might be influenced by a survivorship bias, stemming from our episodes’ inclusion criteria. To clarify, increased control near the ball was positively linked to passing advances, concededly through medium- or long-distance passes. However, these technical actions are known to lead to more frequent possession swaps.53,54 Episodes where possession swaps occurred were excluded from our sample, originating said bias on findings – only episodes in which the more technically demanding medium- and long-passes were successful were retained. Additionally, larger spatial control might also indicate an absence of defending proximity. In such cases, a single attacking player near the ball might receive a progressive pass unopposed. So, the relationship between spatial dominance and passing progression warrants further investigation, accounting for these elements. The positive association between spatial control and ball progression also applies to dribbling. This likely correlates to larger intra-team distances, which allows opponents to advance through via dribbling, as defensive support is farther from the ball's direct opposer (i.e., the first defender).
Increasing the spatial dominance around the second and third defenders throughout the episode led to greater ball advances. We argue that this is a similar issue to the one mention in subsection 4.2: findings are a direct consequence of opponent's progression, with its root cause being elements not captured by these variables. To enlighten this topic, future research should address (1) solely the areas between the ball and the goal being attacked, (2) incorporate metrics related to the number of outplayed defenders, and (3) account for the instantaneous ball location – for an apt example, see Rein, Raabe and Memmert. 18 Based on our findings, instead of striving for ever-increasing spatial dominance around the ball, team should aim for “sufficient” dominance, while also maintaining compactness to constrain opponents and provide within-team defensive support. As argued by José Mourinho, “there are principles of play that have to be permanent… one of them is staying compact” b .
Player-environment angle
When angles between the (1) first and second defenders and (2) the second and third defenders increased from the beginning to the end of an episode - meaning they become increasingly misaligned with their goal during the transition - opponents advanced more often, regardless of the technical means used. This concurs with research that suggests that greater dealignments afford passing its directionality, allowing for the exploration of penetrative passes by opponents.17,55 Additionally, this misalignment means that the opposing ball holder can easily progress through dribbling, as the defender aiming to protect its more advanced teammate has greater difficulty “sealing off” forward dribbling routes. A detailed analysis indicates that the relationship between the first and second defenders was more relevant to impede dribbling advances, with the second and third defenders’ being critical to hamper passing progression. This is likely because in dribbling episodes, ball-holder actions are opposed by its neighbouring adversaries (first and second defenders), whereas in passing, greater misalignments in retreated areas (e.g., between the second and third defenders) “invite” adversaries to use penetrative, more direct passing lines.
The first defender's angular relation with the ball and the own goal (see Figure 2(a); Angle_Ball_Goal_Def1 and Var_Angle_Ball_Goal_Def1) was crucial for impeding passing advances, not being a significant factor to deter dribbling progression. Interestingly, variables related to the percentage of time during which defenders reduced their angles (i.e., TimeReducing_Angle_Ball_Goal_Def1, TimeReducing_Angle_Def1_Goal_Def2 and TimeReducing_Angle_Def2_Goal_Def3) were mostly excluded from the models. This suggests that instead continually reducing angles, defenders should be able to swiftly adjust their positioning, coordinating actions to maintain angles continually low and in alignment with the goal being defended.
Practical applications
To expand on the practical significance of previous paragraphs, the following suggestions for coaching staff may be presented:
To deter dribbling advances, the first defender should only press at key instants (e.g., immediately before an opponent receives the ball) or under specific game scenarios (e.g., when an opponent performs an incorrect ball reception). Identifying these instants and pressing triggers may enhance defending effectiveness against dribbling. When possession recovery is unattainable, defenders near the ball should refrain from closing in on the ball carrier. While “intense pressure” is emphasised in other studies, this may depend on the teams’ goal (e.g., impeding advances vs recovering possession). Players should assess ball recovery likelihood, using intense pressing when likely to regain the ball, and opting for safety-based positioning in disadvantageous scenarios (e.g., numerical inferiorities). Teams should aim to “sufficiently” control the areas surrounding the ball, not neglecting on compactness, to constrain opponents and provide within-team support. Larger dominance areas often correlated with opponents’ progression. Wider angles between defenders increased ball advances. A zonal marking, relying on teammates’ positioning and pitch references (e.g., the goal location) for defensive coordination, may be preferable. In a man-to-man approach, opponents may manipulate defenders’ positioning, to “drag” them and create progressive passing lanes for teammates. The angle between the first and second defenders was crucial for impeding dribbling-progression. Second and third defenders were key to halt passing advances. Overall, defenders should be able to maintain alignment, under variable game-scenarios – e.g., (1) as they transition between tactical roles near the ball location (e.g., changing from being the first defender to being the second one), or (2) as they adjust to opponents “switch of play” (e.g., changing the ball from one corridor to the other).
Limitations
While this study provided novel insights into the dynamics of open-play defensive transitions in elite-level football, several limitations should be acknowledged. First, the analysis was limited to data from the top-three ranked teams in the Portuguese First League, which may affect generalisability of findings. Results may not be applicable to teams of different quality teams within the same league (e.g., lower-ranked teams), other competitions, or distinct age groups (e.g., youth-football). Second, a predefined time criterion of five seconds was used to identify the end of defensive transitions. While this provided consistency, it excluded episodes where possession recoveries occurred before the time cut-off, also yielding different findings compared to if alternative time criteria (e.g., six seconds) were employed. The identification of first, second, and third defenders relied on their immediate proximity to the ball. While proximity is a key factor, other dynamical elements - e.g., players’ displacement speed and body orientation - were not considered. These may ultimately influence how tactical roles are defined during match-play. Finally, pitch sublocations, tactical systems, and offensive behaviours (e.g., number of attacking runs behind the defenders line) were not contemplated in this paper. Omitting these factors may have overlooked important influences on ball progression during defensive transitions.
Conclusions
This study explored an extensive database from the 2022/23 Portuguese First League season, to clarify how defenders within the game centre should perform during open-play defensive transitions to hinder adversaries’ spatial advances through various technical actions (i.e., dribbling, passing or a combination of both). As far as we are aware, this was the first study addressing said research topic.
The findings revealed the importance of not “closing in” on the immediate ball holder when possession recovery is unlikely. Additionally, teams should only aim for a “sufficient” spatial dominance near the ball, with defenders maintaining interpersonal angles continually low. The analysis also highlighted the specificity of tactical roles within the game centre, by demonstrating how different variables impact off-the-ball success depending on the player's specific role. These innovative and actionable results expand on the still limited corpus regarding open-play defensive transitions. Also, the proposed directions for future research may ensure that forthcoming studies on cooperation and opposition contexts offer greater “explanatory power” regarding the factors that contribute to success during defensive transitions.
Supplemental Material
sj-docx-1-spo-10.1177_17479541251353215 - Supplemental material for Elite-level cooperation and opposition dynamics during defensive transitions: Using computer vision data to estimate the pass and dribbling progression conceded
Supplemental material, sj-docx-1-spo-10.1177_17479541251353215 for Elite-level cooperation and opposition dynamics during defensive transitions: Using computer vision data to estimate the pass and dribbling progression conceded by Rui Freitas, Rui J Lopes, Jani Sarajärvi and Anna Volossovitch in International Journal of Sports Science & Coaching
Supplemental Material
sj-docx-2-spo-10.1177_17479541251353215 - Supplemental material for Elite-level cooperation and opposition dynamics during defensive transitions: Using computer vision data to estimate the pass and dribbling progression conceded
Supplemental material, sj-docx-2-spo-10.1177_17479541251353215 for Elite-level cooperation and opposition dynamics during defensive transitions: Using computer vision data to estimate the pass and dribbling progression conceded by Rui Freitas, Rui J Lopes, Jani Sarajärvi and Anna Volossovitch in International Journal of Sports Science & Coaching
Supplemental Material
sj-docx-3-spo-10.1177_17479541251353215 - Supplemental material for Elite-level cooperation and opposition dynamics during defensive transitions: Using computer vision data to estimate the pass and dribbling progression conceded
Supplemental material, sj-docx-3-spo-10.1177_17479541251353215 for Elite-level cooperation and opposition dynamics during defensive transitions: Using computer vision data to estimate the pass and dribbling progression conceded by Rui Freitas, Rui J Lopes, Jani Sarajärvi and Anna Volossovitch in International Journal of Sports Science & Coaching
Supplemental Material
sj-docx-4-spo-10.1177_17479541251353215 - Supplemental material for Elite-level cooperation and opposition dynamics during defensive transitions: Using computer vision data to estimate the pass and dribbling progression conceded
Supplemental material, sj-docx-4-spo-10.1177_17479541251353215 for Elite-level cooperation and opposition dynamics during defensive transitions: Using computer vision data to estimate the pass and dribbling progression conceded by Rui Freitas, Rui J Lopes, Jani Sarajärvi and Anna Volossovitch in International Journal of Sports Science & Coaching
Footnotes
Authors contributions
RF, AV and RJL conceptualised the article. RJL performed the data processing and analysis. RF drafted the article. JS made substantial contributions to the intellectual content of the manuscript. All the authors revised and approved the final manuscript. The corresponding author attests that all the listed authors meet authorship criteria and that no others meeting the criteria have been omitted.
Ethical considerations
The study was conducted in accordance with the Declaration of Helsinki and was approved by the Ethics Committee of the Faculty of Human Kinetics, University of Lisbon (approval no. 25/2021), with the need for written informed consent waived.
Consent to participate
Not applicable.
Consent for publication
Not applicable.
Data availability statement
The dataset analysed during the current study are not publicly available, as they were used under an NDA between corresponding author and Footovision (Paris, France). Data may be available at ![]() , with the permission of Footovision. The codes used for the statistical analysis presented in this paper will be made available upon request to the corresponding author.
, with the permission of Footovision. The codes used for the statistical analysis presented in this paper will be made available upon request to the corresponding author.
Declaration of conflicting interests
The authors declared no potential conflicts of interest with respect to the research, authorship, and/or publication of this article.
Funding
The authors disclosed receipt of the following financial support for the research, authorship, and/or publication of this article: RJL was partly supported by FCT – Fundação para a Ciência e Tecnologia, I.P. by project reference UIDB/50008/2020, and DOI identifier https://doi.org/10.54499/UIDB/50008/2020 awarded to Instituto de Telecomunicações.
Supplemental material
Supplemental material for this article is available online.
Notes
References
Supplementary Material
Please find the following supplemental material available below.
For Open Access articles published under a Creative Commons License, all supplemental material carries the same license as the article it is associated with.
For non-Open Access articles published, all supplemental material carries a non-exclusive license, and permission requests for re-use of supplemental material or any part of supplemental material shall be sent directly to the copyright owner as specified in the copyright notice associated with the article.