
Abstract
This study aimed to compare the perceptual state, physical, technical, and tactical performances of youth female football players in small-sided and conditioned games (SSCG) across different menstrual cycle phases.
A total of twenty-seven under-19 players were monitored over 3 months using daily questionnaires and basal temperature to track menstrual phases. Players with synchronized cycles (n = 6, age: 16.5 ± 0.76 years) participated in 3-a-side with goalkeepers SSCGs, under follicular (FOL) and luteal (LUT) conditions.
No significant effects were found in perceptual scales, though motivation scores were higher in the FOL phase (effect Cohen d = 0.80 [0.04; 1.57]). Technical performance was higher during FOL for shooting decision (p < .01, Cohen d = 0.71 [0.26; 1.16]) and target orientation (p < .05, Cohen d = 0.50 [0.10; 0.90]) compared to LUT. Positional analysis revealed greater distance to the nearest teammate (p < .01, Cohen d = 0.49 [0.14; 0.84]) but lower variability (CV, p < .001, Cohen d = -0.82 [-1.17; −0.47]) in FOL. No physical performance differences were detected.
These findings suggest that while physical and perceptual performance remains stable across menstrual phases, subtle variations in technical and positional behavior may indicate that menstrual cycle phases could be considered when designing training. This pilot study highlights preliminary trends, particularly in relational positional variables, which merit further exploration in future research to better understand their implications.
Keywords
Introduction
Female football has undergone exponential growth in recent years, resulting in a significant increase in the number of participants. 1 This rise in participation and popularity has naturally led to a corresponding increase in scientific research aimed at understanding the training and match demands of female football performance.2,3 Following trends observed in male's football, research has begun to investigate the physical demands of both competitive 4 and training microcycles. 5 Although studies have explored differences between men's and women's football, 6 physiological and hormonal differences between the sexes impose distinct research approaches to better understand women's performance.7,8
An important factor that affects female football performance is the menstrual cycle.8–12 The menstrual cycle follows a natural biological rhythm characterized by significant cyclic fluctuations in endogenous sex hormones, such as estrogen and progesterone.13,14 It has been suggested that these hormonal variation during the different phases (i.e., FOL and LUT) affects the metabolic and hormonal responses during football practice.13–17 While female athletes have reported that the menstrual cycle negatively affects their performance,10,11 significant differences between menstrual cycle phases have not yet been identified.18,19 Despite the absence of clear differences, fluctuations in hormonal concentrations during the menstrual cycle may influence players’ responses to perceptual scales.20,21 From a physical performance perspective, analytical tests have revealed mixed findings. For example, a study observed a decrease in maximal endurance performance (i.e., Yo-Yo intermittent endurant test performance) during LUT phase, although no differences between FOL and LUT were found for jumping (i.e., countermovement jump, CMJ) or sprinting (i.e., 3 × 30 m sprints) in under-19 female players during the second half of the season. 2 Similarly, Tsampoukos et al. 22 found no significant differences in sprint performance (i.e., repeated 30-s sprint on a non-motorized treadmill) between menstrual phases in female sport science students. In more ecological settings, the findings are also inconsistent. Abbott et al. 18 reported no impact of the menstrual cycle on distance covered during matches in professional female players over one entire season, while Igonin et al. 13 found shorter distances covered at moderate to high intensities during the FOL phase compared to the LUT phase in data collected over three consecutive seasons from 8 female players’ competing in the second French Division. Conversely, Julian et al. 8 concluded that elite female players covered more distance at very high intensities during the LUT phase in competitive matches measured over 4 months. These inconsistencies may arise from various limitations, such as differing maturational statuses and competitive levels across studies, as well as variable sample sizes, which complicate direct comparisons. Furthermore, research in this field remains relatively scarce, and the existing findings suggest that the menstrual cycle's impact on physical performance may not be as pronounced as initially anticipated.
Most studies have focused on analytical tests or competitive scenarios, leaving a gap in understanding the effects of the menstrual cycle phases on physical performance, specifically during training tasks. Training is a crucial context, as it offers coaches the opportunity to intervene and adjust loads and tasks based on players’ individual needs. Additionally, limited research exists on how the menstrual cycle affects technical or positional performance during training sessions. Therefore, further research is essential to explore the impact of menstrual cycle phases (i.e., FOL vs. LUT) on players’ perceptual, physical, technical, and tactical performances in training settings. In this respect, small-sided and conditioned games (SSCGs) create a window of opportunity to measure players’ physical, technical and tactical performance under different contextual conditions (e.g., pitch size, number of players).1,7,23 Understanding how female players adjust their physical, technical, and positional performance in SSCGs based on menstrual cycle phases could enable coaches and sports scientists to create more effective training environments that account for these fluctuations. Therefore, this study aims to compare the perceptual states, physical, technical, and tactical performances of youth female football players in SSCGs across different menstrual cycle phases (i.e., FOL and LUT phases).
Methods
Participants
A total of twenty-four under-19 players were monitored over 3 months using daily questionnaires and basal temperature to track menstrual phases. Further, only 6 youth female players (mean ± standard deviation: age, 16.5 ± 0.76 years; height, 163.4 ± 6.10 cm; body mass, 56.4 ± 3.9 kg) were selected to participate in the study as result of having synchronized cycles. While the team was composed of 24 players, 18 were excluded based on the following inclusion criteria: 1) participants could not be using any form of contraception (including oral, implanted, injected, etc.) 2 ; 2) participants were required to have a regular menstrual cycle with a physiological length of 24–35 days 16 ; 3) participants needed to be free from any illness or disease that could impact their performance or health 13 ; 4) participants could not have any injuries that would affect their performance 13 ; and 5) commitment to attending all testing sessions. 19 Additionally, all testing had to be conducted within a consistent 24–35-day cycle to minimize the impact of confounding variables such as humidity and ambient temperature. 2 Furthermore, two goalkeepers participated in the study; however, considering their specific positioning on the pitch (i.e., a more regular and static positioning), their data were excluded from the analysis. The team participated in the Under-19 (U19) Female Championship based in Portugal during the period investigated, classified as “Tier 2: Developmental”. 24 In general, the team trained three times per week of ∼90-min and had a competitive match on the weekend. More specifically, the first session of the week was usually focused on recovery or strength-based work by adopting SSGs in smaller spaces and with a lower number of players (< 6 players per team), while the second session targeted aerobic capacity and endurance, and thus, higher playing spaces and numerical relations are adopted (e.g., 8v8). Finally, the third session emphasized positional games (e.g., 4v4 + 4 floaters) and speed-related activities, by exploring tasks under spatial-temporal constraints (e.g., 10-s to finish in superiority – 6v4 + Gk). Before obtaining written informed consent, all players and their parents or guardians were thoroughly briefed on the study's requirements, potential risks, and benefits of participation. The study protocol adhered to the recommendations of the Declaration of Helsinki. The project and protocol were approved by the University of Maia, local Ethics Committee (code 21074).
Study design
The present study aimed to compare youth female players’ performance during SSCGs in two different phases of the menstrual cycle: i) FOL, defined as the first day on which players reported being in menstruation; and ii) LUT, defined as the phase following ovulation and spanning a 14- days period, assuming a total menstrual cycle length of 28 days. 25 All tests were performed in two time periods corresponding to the follicular phase (i.e., between 6 and 10 days of menstruation) and the luteal phase (i.e., between the 21st and 24th days),2,26
Data collection took place during the early evening, aligning with the players’ regular training sessions, with consistent training times upheld throughout the study. Testing was carried out over a three-week period, during the second half of the season. All assessments were performed outdoors on artificial turf under comparable weather conditions.
Menstrual cycle phase
Prior to the commencement of the study, female players were asked to complete a questionnaire containing both open- and closed-ended questions. This survey gathered detailed information on their age at menarche, the regularity of their natural menstrual cycles, the use of oral contraception, medication intake, and any symptoms experienced during menstruation. To further assess the menstrual cycle, the calendar-based counting method was employed.2,14,27,28 Players were asked daily, “Did you have your period today?” A change in response from “no” to “yes” marked the onset of menstruation, defining the beginning of the follicular phase.14,27 The luteal phase was retrospectively calculated using the calendar count-back method, based on the question, “What was the date of your last period?”.14,27 This method was applied over a three-month period to ensure accuracy. In addition, participants were required to measure and report their basal body temperature. The menstrual cycle is known to influence women's thermoregulation, with core body temperature typically rising by 0.3 to 0.7°C during the luteal phase compared to the follicular phase.3,29 These variations are most pronounced during sleep or upon waking. 29 Thus, participants were asked to report their basal body temperature, which was daily completed daily using a Google Form questionnaire that takes less than one minute.
Small-Sided games
Prior to the first testing session, female players were divided into two balanced teams of three, ensuring parity in terms of playing positions and considering the coach's assessment of each player's physical, technical, tactical, and decision-making abilities. Each testing session began with a standardized warm-up that included mobility exercises and a possession game (3 vs. 3, without goals). During each session, players completed three bouts of SSCGs, each lasting 3 min, with 1 min of passive recovery between bouts. 30 This protocol was repeated over three training sessions for each menstrual phase (FOL and LUT), resulting in a total of nine SSCG bouts per player per phase. The SSCGs were conducted on a 25 × 15 m field (length×width), providing a relative playing space of 37.5 m² per player. 31 Multiple balls were strategically positioned around the field to minimize interruptions and reduce ball-out-of-play time. No coach feedback or verbal encouragement was permitted during the sessions. Players were instructed to hydrate with water before and between bouts. Apart from the offside rule, which was not enforced, and the use of the conceding goalkeeper to restart play for quicker game resumption, all other FIFA regulations were adhered to during the sessions.
Data collection
Perceptual scales
The CR10 rating of perceived exertion (RPE) scale was used both before and immediately after the SSCGs. Additionally, a 100-mm visual analogue scale (VAS) was employed to evaluate players’ perceptions of mental fatigue and motivation immediately before and after the SSCGs. For the CR10 scale, players selected a number that represented their perceived exertion, while for the VAS, they marked a point along the 100-mm line that best indicated their current state. Both perceptual scales (i.e., RPE and VAS) were captured by the leading researcher using individual sheets with the corresponding scales, which were answered by each player without the presence of other players immediately before and immediately after the SSCGs. Additionally, players’ well-being was measured using the Hooper questionnaire, 32 which evaluated sleep quality, stress levels, fatigue, and muscle soreness. Each of these factors was rated individually on a scale from 1 to 7, with 1 representing ‘very low or good’ and 7 indicating ‘very high or bad.’ The sum of scores from the four variables contributes to the final score (Hooper Index).
Technical-Related variables
The SSCGs were filmed using one Panasonic NV-GS230 digital video camera, positioned 2 meters above the ground and centrally aligned with the pitch. Player performance in ball control, passing, dribbling, and shooting was analyzed through notational analysis, utilizing LongoMatch software version 1.3.7 (Fluendo, Barcelona, Spain). To assess players’ decision-making and execution skills, the Game Performance Evaluation Tool (GPET) was employed for ref see. 33 Both decision-making and execution were scored with 0 for unsuccessful decisions or executions and 1 for successful ones. 33 While these variables allow for understanding the decision and execution of the players’ technical actions, complementary information may provide a better perspective and understanding of players’ performance.34,35 For ball control, two aspects were considered: i) orientation, which assessed whether the player received the ball facing the opponent's goal, and ii) appropriateness, which evaluated whether the player used the most suitable body part to receive the ball (e.g., receiving with the right foot when the ball is played along the ground in the right wide channel). In terms of passing, the following were analyzed: i) open teammate, which assessed the ability to pass the ball to an unmarked teammate, and ii) offensive position, which evaluated whether the pass was made to a teammate in a more advanced offensive position. For dribbling, the focus was on: i) deception, which examined whether the player used any body feints before receiving the ball, and ii) space conquering, which assessed the player's ability to advance up the field while dribbling. Lastly, for shooting performance, two technical criteria were considered: i) target orientation, which evaluated the player's body positioning when aiming for the goal, and ii) goalkeeper deviation, which analyzed the player's ability to shoot in a way that reduced the goalkeeper's chances of intercepting the ball. Similarly to the execution and decision-making, also these criteria were assessed as 0 and 1. Furthermore, all the technical-related variables were calculated as the percentage of successful actions relative to the total number of attempts (e.g., the motor execution of dribbles was calculated as: successful dribbles / (successful + unsuccessful dribbles)). Throughout the study, a total of 1504 actions were analyzed, including ball control (n = 348), passing motor execution (n = 350), dribbling (n = 134), and shooting (n = 325). All video footage was reviewed by an expert analyst with more than 10 years of experience in match and training analysis. To ensure reliability, intra-observer consistency was evaluated on 10% of the data, yielding correlation values between 0.85 and 0.90, which are deemed high and in line with previous research findings. 36
Physical variables
The total distance covered and distance traveled across different speed zones were categorized as follows: (i) total distance covered; (ii) distance covered while walking (0.0–3.5 km/h); (iii) distance covered while jogging (3.6–14.3 km/h); and (iv) distance covered while running (> 14.4 km/h). These speed zones were adopted based on previous research exploring the physical demands of training and match performance of female soccer players.37,38 Due to the small size of the playing field in this study, distances covered while sprinting were excluded from analysis, as the limited pitch dimensions may have restricted the players’ ability to reach higher speeds. 34
Positional data
Positional data during the SSCGS were captured using 5 Hz global positioning system (GPS) devices (SPI-PRO, GPSports, Canberra, ACT, Australia). The latitude and longitude coordinates recorded during gameplay were exported and processed using Matlab V R (MathWorks, Inc., Massachusetts, USA). To account for any missing data, a 3 Hz Butterworth low-pass filter was applied, ensuring appropriate re-sampling and smoothing of the dataset. The coordinates were then converted to meters using the Universal Transverse Mercator (UTM) coordinate system. A rotational matrix was employed to align player displacement data with the pitch dimensions, correctly adjusting the pitch length and width along the x- and y-axes. 39 Subsequently, the spatial exploration index (SEI) of each player was calculated, quantifying the area explored by a player during the game. This index was derived by first determining each player's average position on the pitch, then calculating the distance between every position recorded during the time series and this average position. 40 The positional data were also used to compute the following variables 34 : (i) the absolute distance (in meters) between each player and their nearest teammate and opponent, (ii) the variability in this distance, expressed as the coefficient of variation (CV), and (iii) the regularity of the distance, assessed using approximate entropy (ApEn). The ApEn values range from 0 to 2, where lower values represent more predictable or regular series. The parameter values for ApEn computation were set to 2 for vector length (m) and 0.2 multiplied by the standard deviation for tolerance (I). 41
Statistical analysis
Descriptive statistics were reported as mean (M) and standard deviation (SD). Outliers and normality assumptions were evaluated using the Shapiro-Wilk test. To evaluate differences between menstrual cycle phases (FOL vs. LUT), paired sample t-tests were conducted, as the same players were assessed under both conditions. Statistical significance was established at p < .05, with all calculations performed using the Jamovi Project software (Version 1.2, 2020). Pairwise comparisons of means were assessed using 95% confidence intervals (raw data) and Cohen's d effect sizes. The following thresholds were used for effect sizes: 0.0–0.19 (trivial), 0.20–0.59 (small), 0.6–1.19 (moderate), 1.2–1.9 (large), and ≥ 2.0 (very large). 42 Additionally, the differences in perceptual scale ratings between pre- and post-SSCGS for each condition (LUT vs FOL) were analyzed using analysis of covariance (ANCOVA), with post-test values as the dependent variable and pre-test values as the covariate.
Results
Tables 1 and 2 and Figure 1 entail the descriptive and inferential statistics between the conditions for the perceived efforts, motivation, and mental fatigue. There are no statistically significant effects from the pre- to post-task between conditions. Despite that, moderately higher values of motivation (ES with 95% confidence intervals: ES = 0.8 [0.04; 1.57]) in favor of the FOL condition were observed.
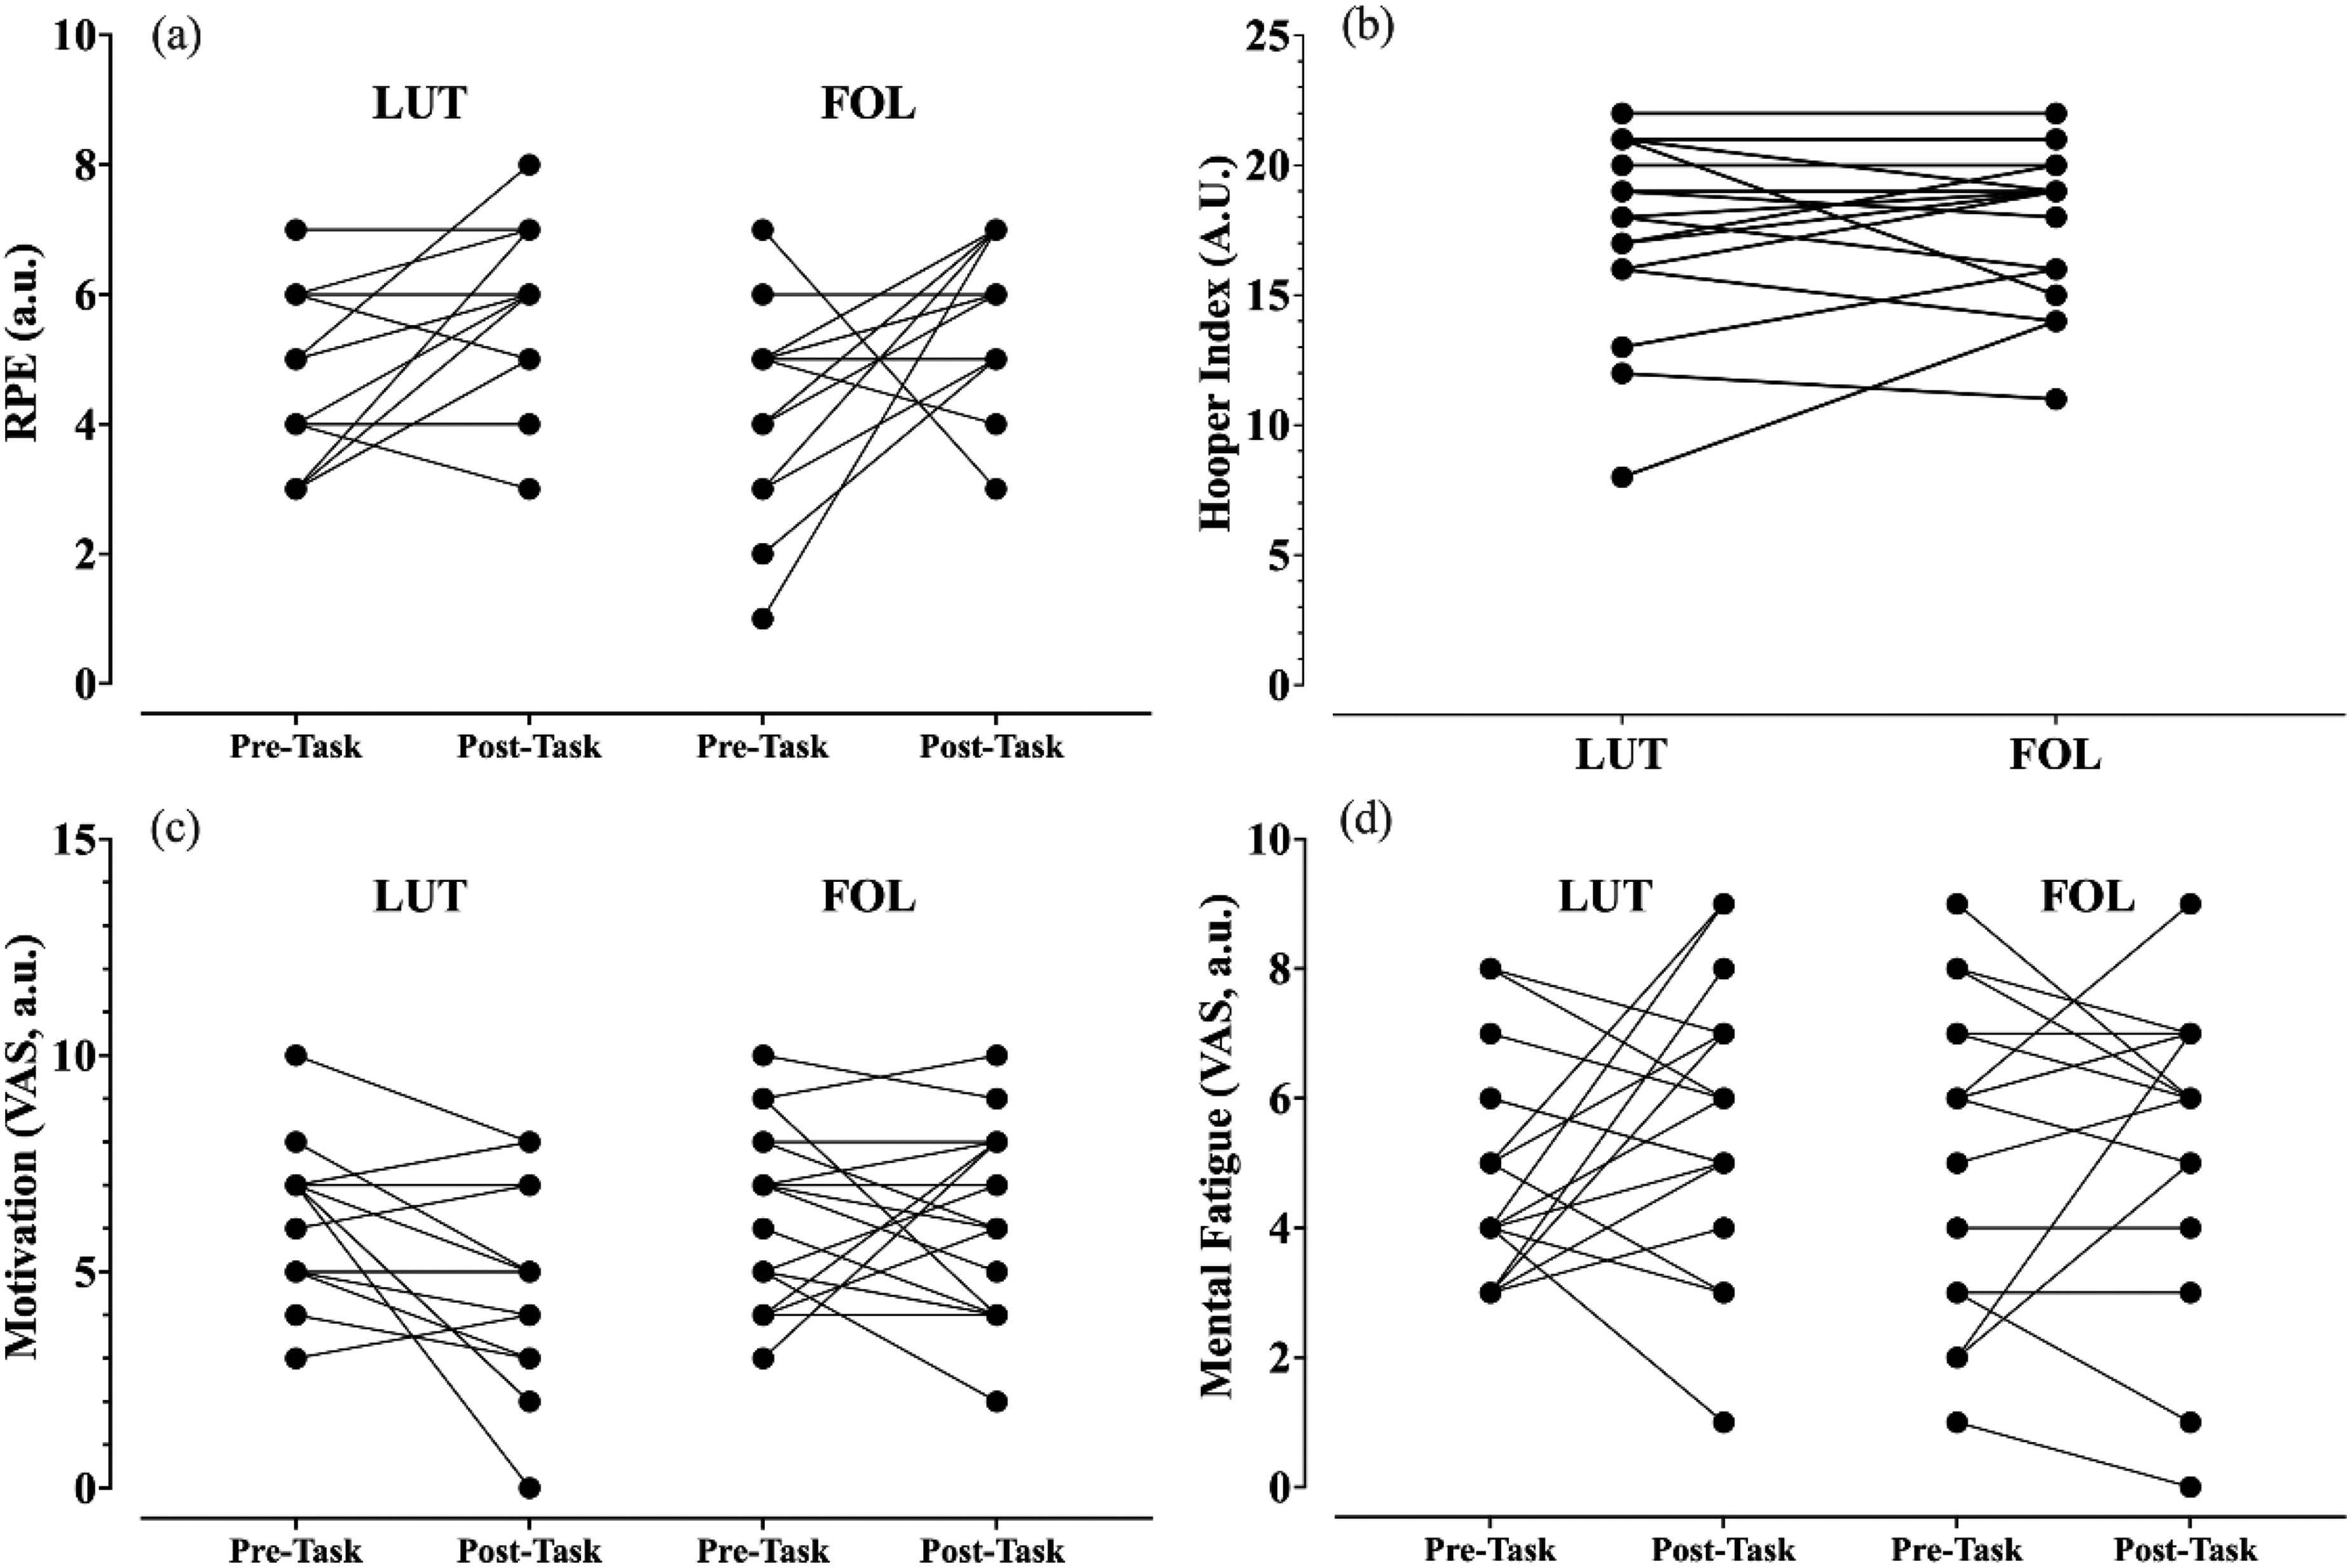
Descriptive and variation from pre to post task between conditions (LUT and FOL) for RPE (2a), Motivation (2c) and Mental Fatigue (2d). In addition, pre-session descriptive (individual, mean and SD) values for hooper index (2b).
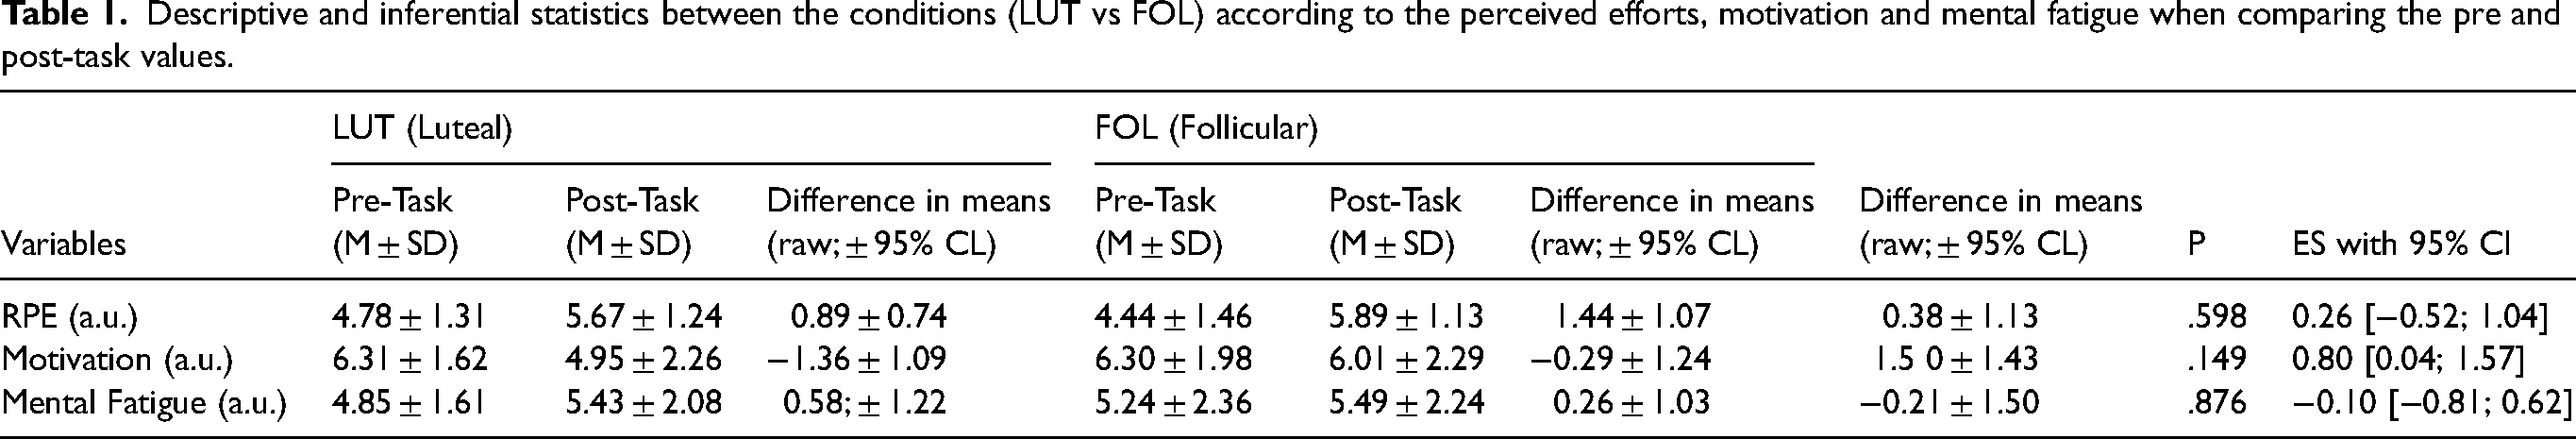
Descriptive and inferential statistics between the conditions (LUT vs FOL) according to the perceived efforts, motivation and mental fatigue when comparing the pre and post-task values.
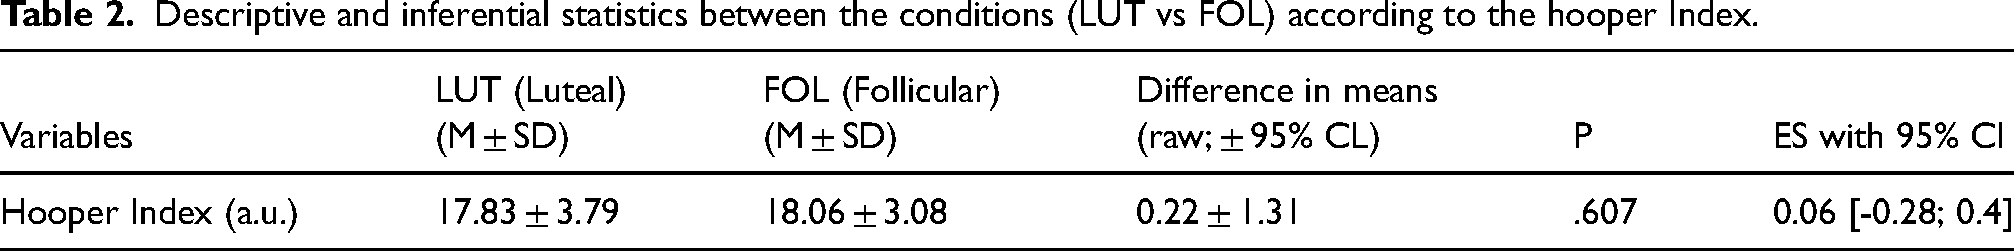
Descriptive and inferential statistics between the conditions (LUT vs FOL) according to the hooper Index.
The effects of playing the SSCG according to the LUT and FOL conditions for the technical performance, can be seen in Table 3 and Figure 2. In general, no statistically significant effects were identified between conditions. Despite that, statistically significant effects with higher values during the FOL condition, in dribbling decision (moderate effects, 0.11; ± 0.11, t = -2.16, p = .044), the shooting decision (moderate effects, 0.24; ± 0.15, t = 3.194, p = 0.003) and target orientation (small effects, 0.16; ± 0.13, t = −2.50, p = .016) were found.
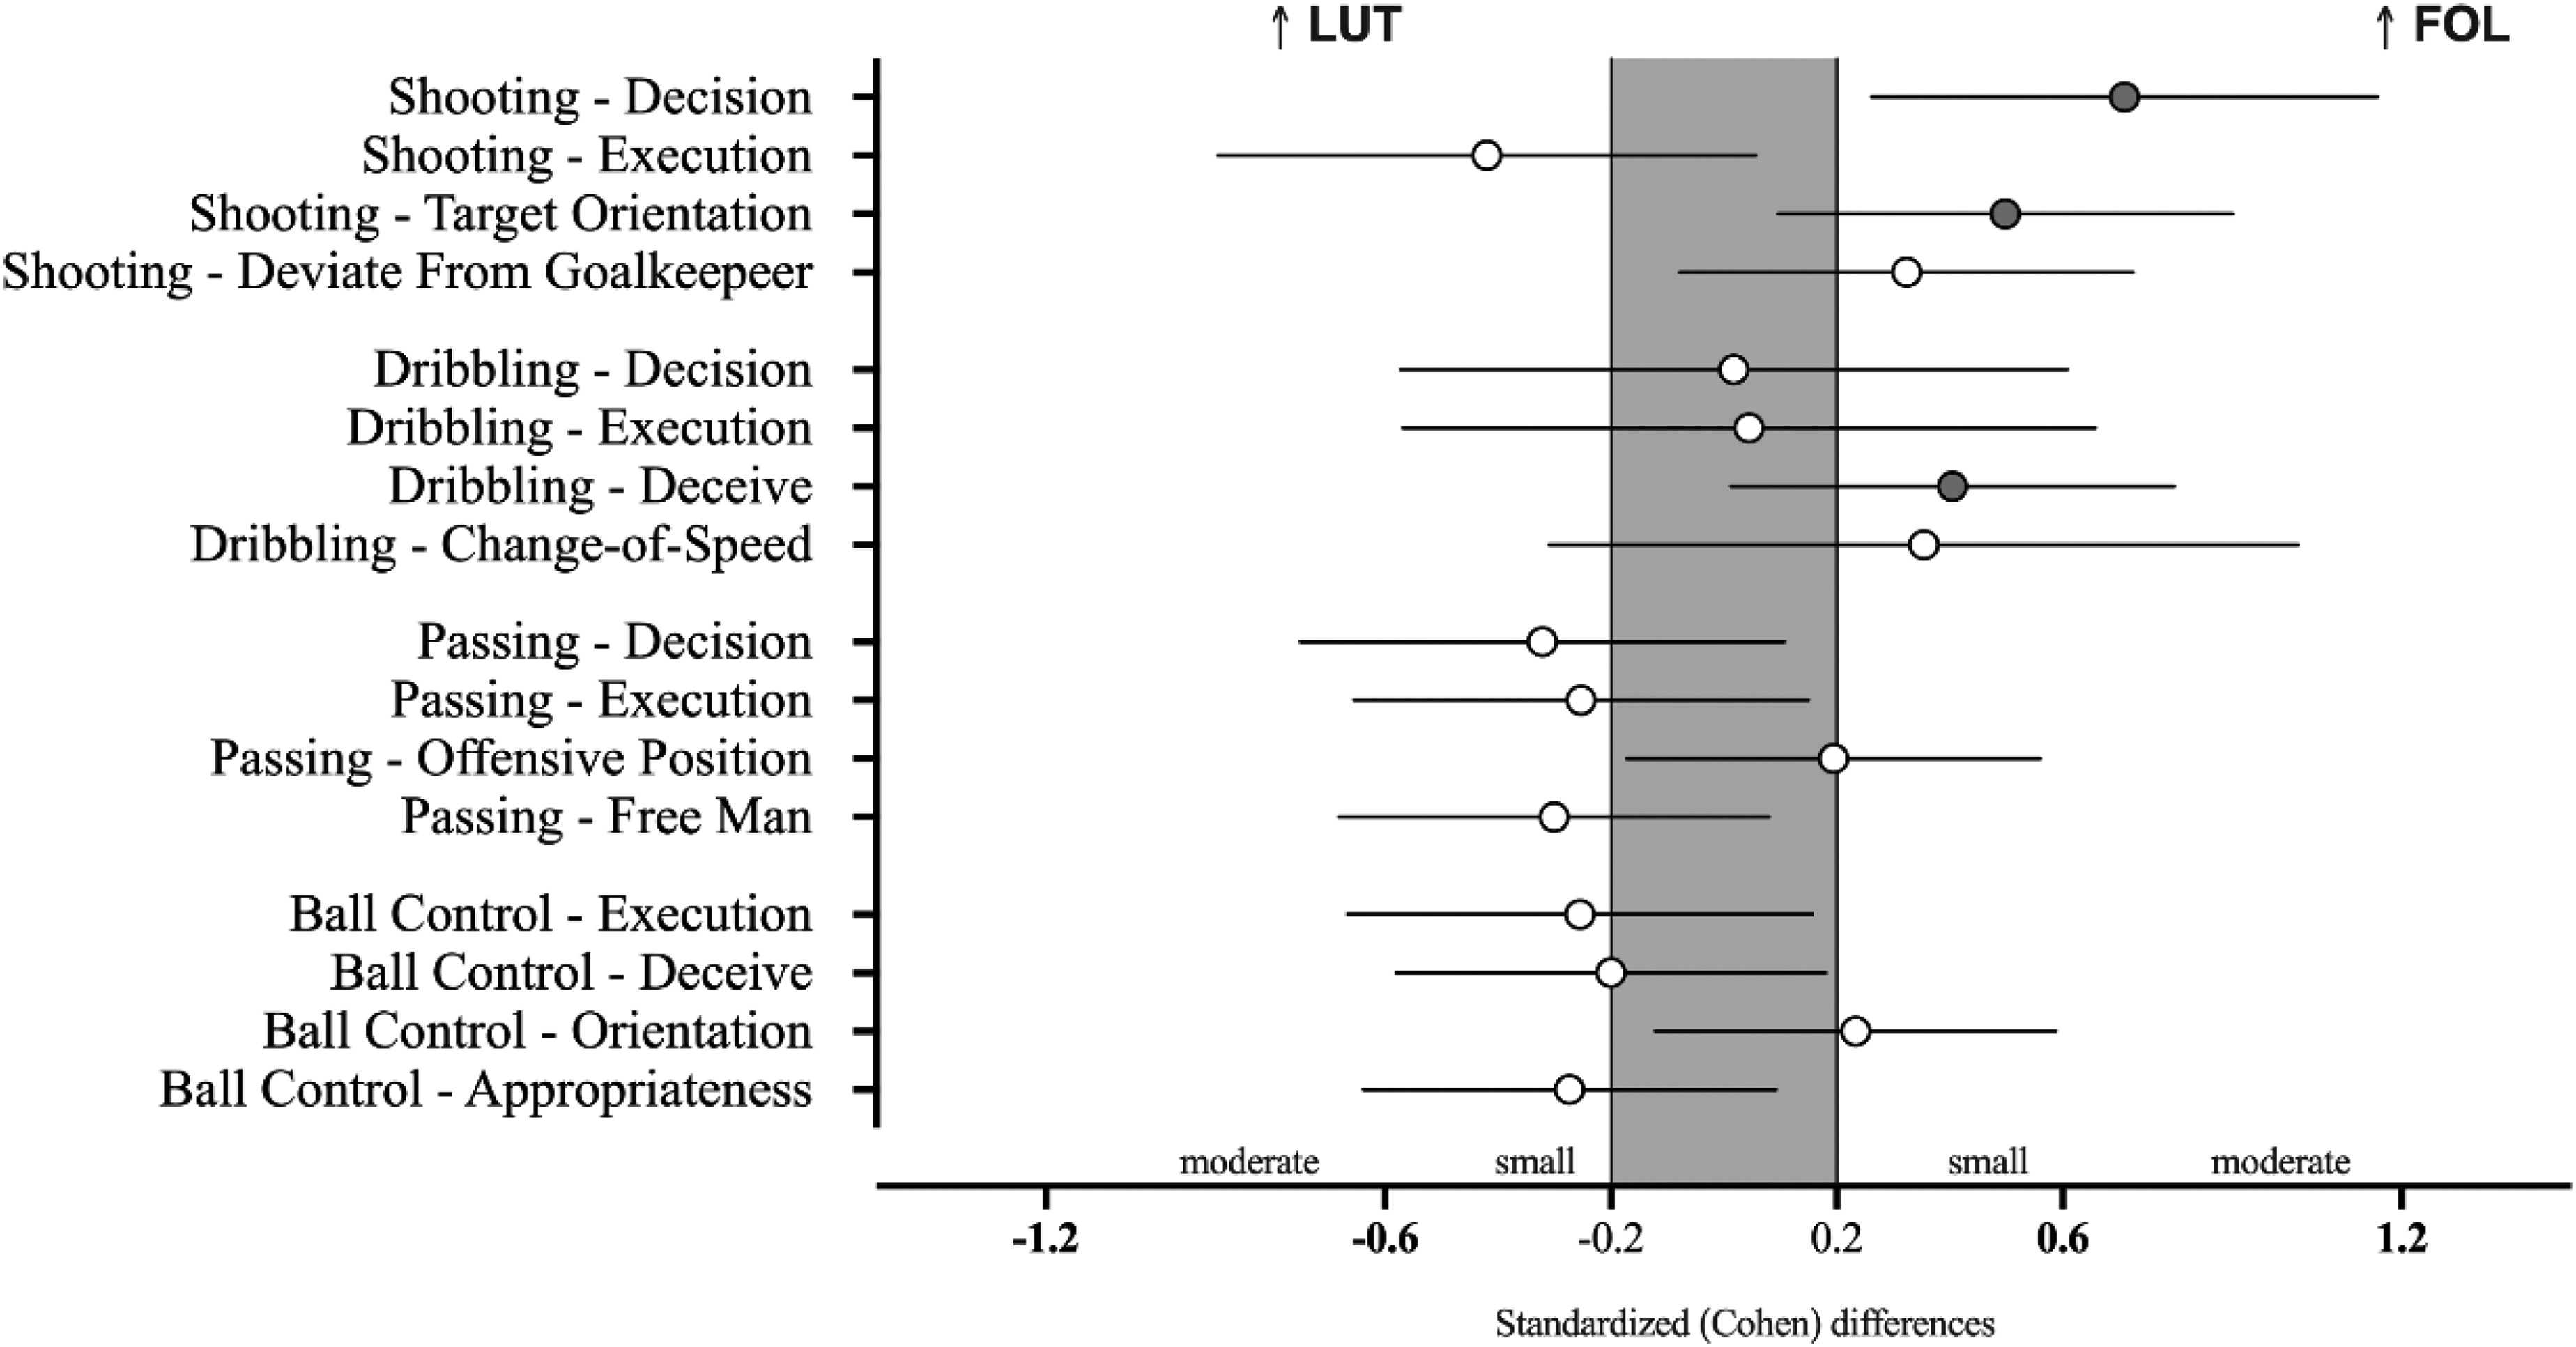
Standardized (Cohen's d) differences in GPET and technical criteria variables according to the conditions (LUT vs FOL). Error bars indicate uncertainty in the true mean changes with 95% confidence intervals.
Descriptive and inferential statistics between the conditions (LUT vs FOL) for the technical execution and decision-making.
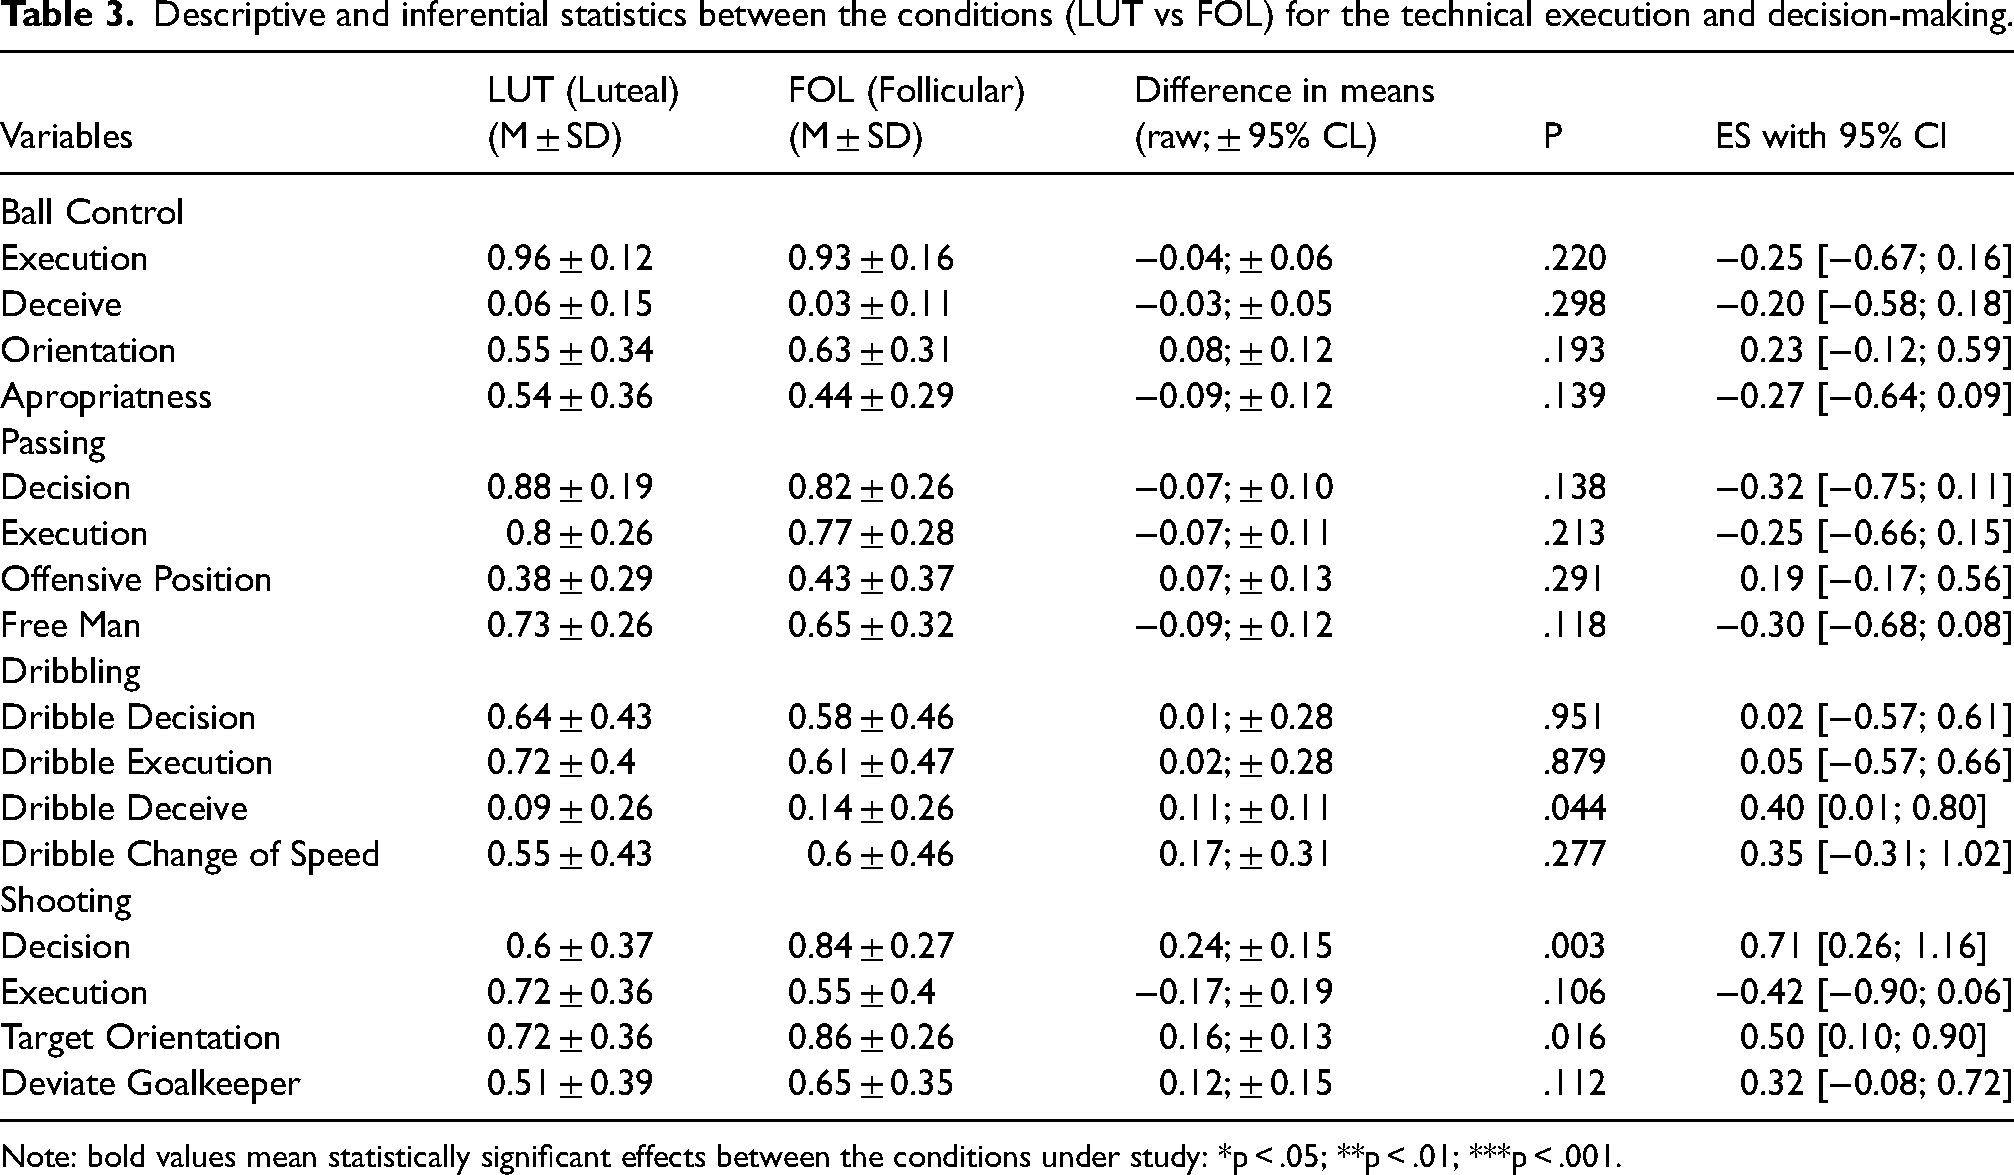
Note: bold values mean statistically significant effects between the conditions under study: *p < .05; **p < .01; ***p < .001.
The differences in the positional and physical effects between the LUT and FOL conditions can be identified on the Table 4 and Figure 3. Statistically significant differences between conditions were identified for the distance to the nearest teammate (m, t = -2.804, p = 0.07; and CV, t = 4.652, p < 0.001). Accordingly, a higher distance to the nearest teammate was found when playing under the FOL condition (0.6; ± 0.43, small effects), while a lower CV for the same variable was noted when compared to the LUT condition (−5.27; ± 2.27; moderate effects).
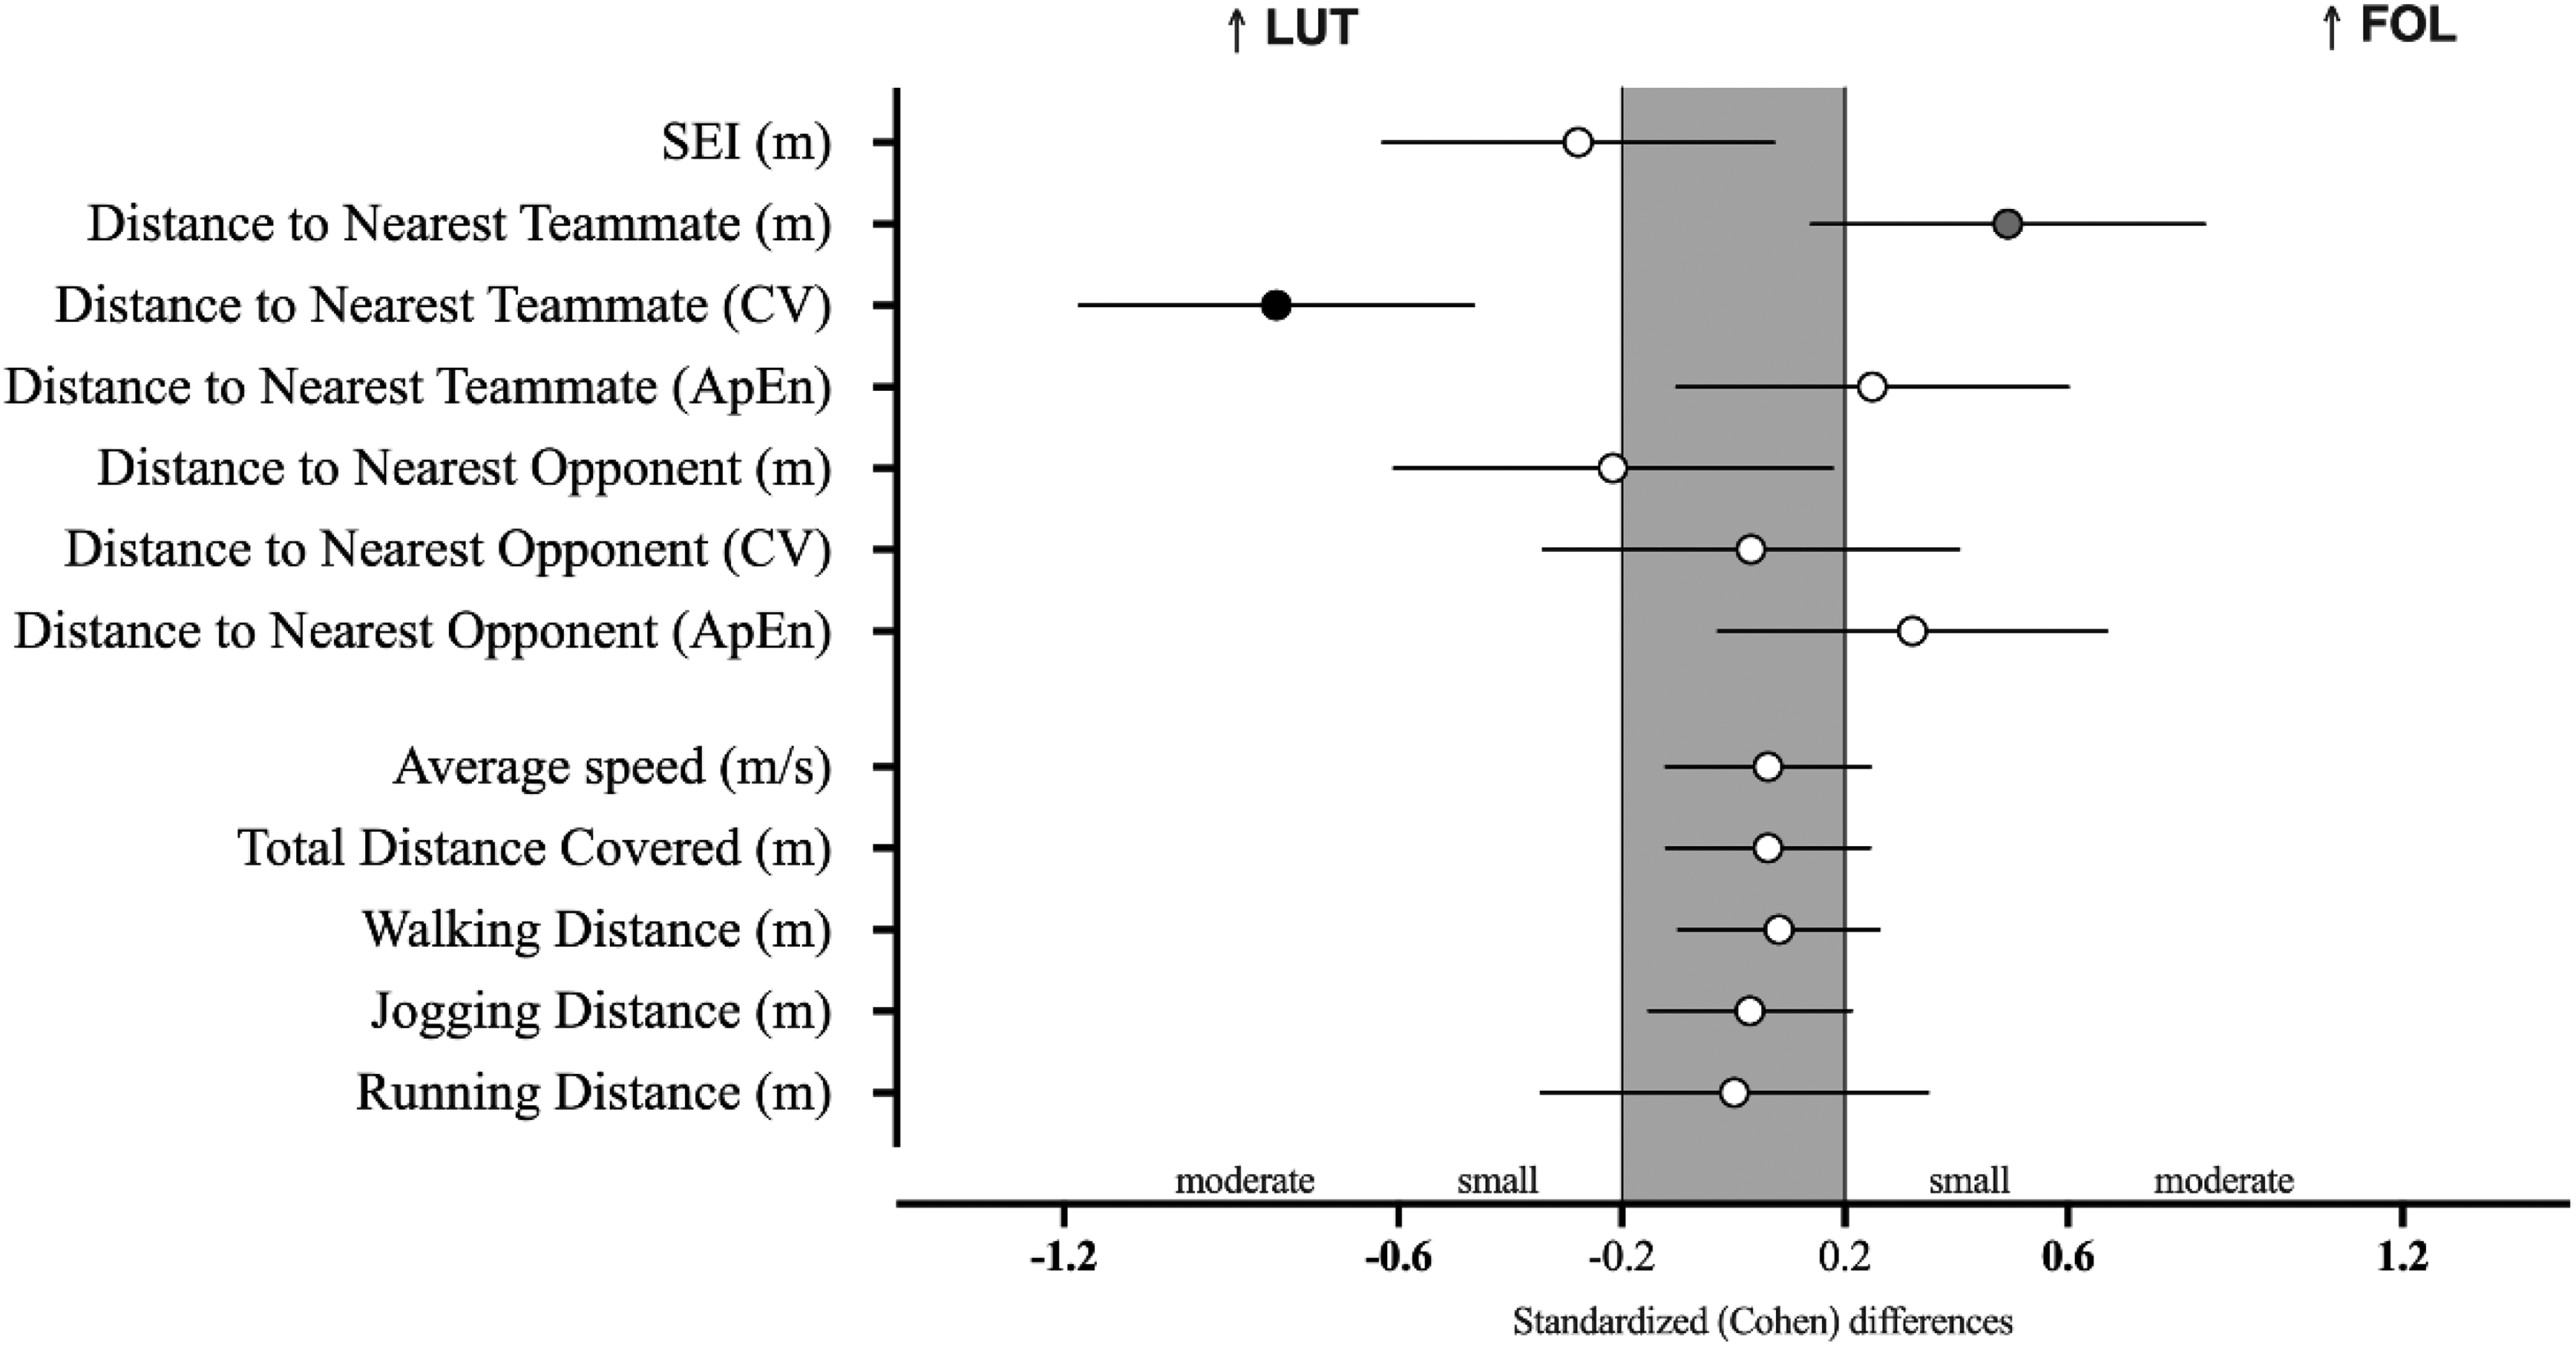
Standardized (Cohen's d) differences in positional and physical variables according to the conditions (LUT vs FOL). Error bars indicate uncertainty in the true mean changes with 95% confidence intervals.
Descriptive and inferential statistics between the conditions (LUT vs FOL) for the positional and physical performance.
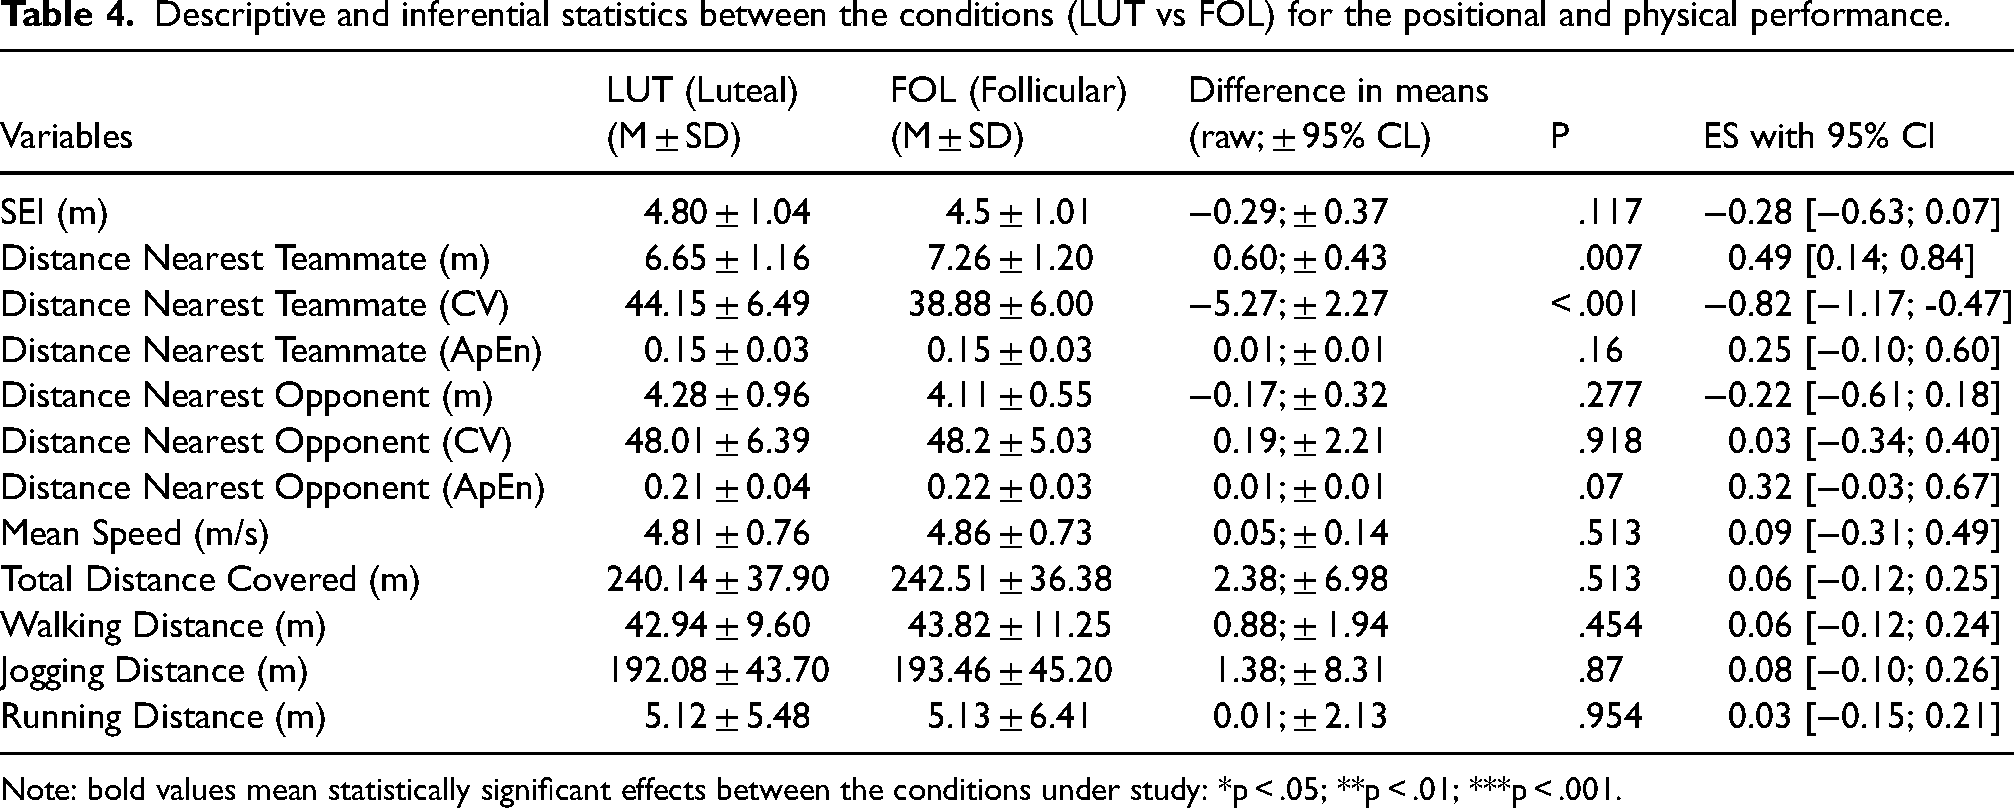
Note: bold values mean statistically significant effects between the conditions under study: *p < .05; **p < .01; ***p < .001.
Discussion
This study aimed to compare youth female football players’ performance (i.e., positioning, technical, and physical) during SSCGs according to the menstrual cycle phase (i.e., follicular (FOL) and luteal (LUT) phases). In general, significant differences were identified in positioning and technical performance. Specifically, players exhibited more compact behaviors during the LUT phase, while their ability to frame the target, make shooting decisions, and dribbling decision-making decreased. Interestingly, no effects were observed for perceptual scales or physical performance.
A significant number of women report experiencing painful symptoms during the menstrual cycle, with approximately 70% believing that their physical performance may be negatively affected during menstruation. 11 The inclusion of pre- and post-task comparisons aimed to assess whether motivation levels changed acutely in response to performing the SSCGs under different menstrual phases. Although greater mean increases in motivation were observed from pre to post-task in the FOL condition, no statistically significant differences were found between the phases, suggesting that the observed performance differences were not driven by motivational changes. Further, the use of the Hooper Index was expected to detect subtle variations in fatigue, stress, or sleep between menstrual phases, particularly an increase in fatigue and stress during the LUT phase due to hormonal fluctuations. However, no significant differences were found. These results are aligned with a recent study aimed to determine if elite female players reported differences in sleep, stress, or fatigue values using the Hooper questionnaire over four weeks, considering different menstrual cycle FOL and LUT phases. 19 The authors found no statistically significant differences in any of the Hooper measurements during the four testing weeks. 19 Additionally, a systematic review of 14 studies showed no effects of the menstrual cycle on the well-being. 20 Consistently, performing daily exercise seems to mitigate the effects of menstruation on sleep quality. 27 Moreover, another study compared the concentration of the interleukin-6 protein, which regulates muscle inflammation, during a running protocol in both the FOL and LUT phases, finding similar values. 43 Accordingly, the absence of differences in perceived fatigue may be related to these findings and aligns with results in the literature. Indeed, several studies, including Abbott et al. (2024), have reported no significant variation in perceived fatigue between the FOL and LUT phases. The similar external load demands across both phases could also explain the lack of statistically significant differences observed between them
Female athletes may experience enhanced acute exercise responses during the follicular phase than in the luteal phase due to the greater estrogen-to-progesterone ratio, which has a neuro-excitatory effect.9,10,44 This responsiveness appears to be more favorable during the late FOL phase compared to the early FOL phase, where estrogen levels are reported to be the lowest.21,45 Supporting this, a study monitoring sub-elite women's soccer players over three seasons found lower values of distance covered at different speeds and fewer sprints during the early FOL phase than in the late FOL phase. 13 In elite female soccer players, higher values of distance covered at very high intensity were observed during the FOL phase compared to the LUT phase, despite the high variation between matches. 8 In contrast, some studies have shown similar performances across different menstrual cycle phases. For example, Campa et al. 15 found no differences in jumping and sprinting abilities in elite female soccer players between the different phases. Similarly, Julian et al. 2 reported no effects of menstruation on countermovement jumps or sprinting performance (i.e., 5 m, 10 m, and 30 m sprints). Tsampoukos et al. 22 also found no effects of the menstrual cycle on 30-s sprint performance on a nonmotorized treadmill in non-elite athletes. The results from our study align with these latter findings, as no statistically significant effects were found for the distance covered at different speeds or in the average speed across the different phases. These contradictory findings between studies may be related to the level of players or the specific phases considered during measurements. The effects of menstrual cycles are more likely to impact untrained athletes 14 than high-level athletes. 17 Our sample consisted of youth female players, who might be expected to be more sensitive to hormonal changes. However, it is crucial to note that different phases of the menstrual cycle result in varying hormone concentrations (e.g., early vs. late follicular), leading to distinct effects. 17 In this study, we only explored the differences between the FOL and LUT phases.
Recently, a growing body of research has begun to explore the effects of varying boundary conditions during SSCGs on female players’ physical performance. For instance, one study compared the external load of elite female players in SSCGs with different numerical formats (i.e., 4v4, 5v5, 6v6, 7v7, 8v8, and 9v9). 23 The authors found similar distances covered across formats but noted higher values for low-speed running distance in the smaller formats. 23 Similar trends were identified in another study comparing 6v6 SSCGs in smaller (i.e., 20 × 20 m) and larger (30 × 30 m) pitch sizes. 46 The authors found higher distances covered in the larger format compared to the smaller one. 46 The pitch area used in the present study (16 × 25 m = 400 m², ∼50 m² per player) falls within the range suggested for female players, which is approximately 45 m² to 120 m² per player.1,47 However, smaller pitch sizes may limit the available space for movement and running, affecting distance-related variables. 23 Consequently, the lower pitch size adopted, and thus the reduced playing area, may have contributed to the absence of statistically significant effects in the distance-related variables.
While the physical performance of female players has been extensively researched,1,23 their tactical performance has been less explored. For example, one study compared a 3v3 SSCG with a 3v3 + 1 neutral player SSCG and found more predictable and regular behaviors when playing in numerical superiority, as indicated by lower spatial exploration index (SEI), length, and stretching index values. 7 Similarly, lower SEI values were observed when pitch obstacles were used compared to when no obstacles were present during a 5-a-side SSCG with goalkeepers. 48 In the present study, no statistically significant effects were identified between conditions, which may be a consequence of the smaller pitch size used compared to previous studies. However, a higher distance to the nearest teammate was found when playing during the FOL condition.
Considering that approximately 70% of women believe their physical performance might be affected during menstruation, 11 increasing the available space may have resulted as a strategy to increase the space and time to make decisions, while possibly decreasing the chances of facing high-intensity actions (e.g., 1v1). In contrast, under the LUT condition, female players showed higher variability in the distance between player dyads, possibly due to the shorter distances between players. This type of pattern has been described as functional variability, 49 where teams increase their variability in distance to teammates to balance a more compact formation. 50
Similarly to tactical behavior, there is a lack of studies exploring the technical profile of female players during SSCGs. A recent study compared different training tasks (i.e., ball possession tasks, technical tasks, tactical tasks, SSCGs, and position-specific training) and the corresponding technical outcomes. 51 The authors found a similar number of touches between SSCGs, ball possession drills, and position-specific drills, though higher values were noted for tactical drills. 51 More recently, it has been suggested the adoption of more intermittent SSCGs (i.e., 3 × 4-min or 2 × 6-min) over continuous (i.e., 1 × 12-min) formats, as the former were found to enhance the percentage of successful passes, tackles, duels, and ball losses. 52 Our study utilized an intermittent format (i.e., 3 sets of 3-min), with the primary aim to compare female players’ technical performance during different phases of the menstrual cycle. In general, we found a better ability to frame the target and make shooting decisions during the FOL condition compared to the LUT condition. These results are similar to those found in basketball, where better shooting and rebounding performances were observed during the FOL phase compared to the LUT phase. 53 It is also important to consider that players were less compact during the FOL condition, allowing more time to frame the target and potentially enhancing decision-making. Additionally, female players in the FOL phase exhibited better deceptive patterns during dribbling, while also better decision-making. Deception involves using the body to simulate a movement direction to mislead the opponent. The increased success in using this technique during the FOL condition may have created additional time to shoot.
Despite the exploratory nature of this study and its potential implications, there are several limitations to consider. First, the assessment of menstrual cycle phases relied on self-reported questionnaires and basal temperature, which may lack precision. Additionally, we only considered the follicular (FOL) and luteal (LUT) phases, without distinguishing between subphases (e.g., early vs. late follicular), which may have distinct hormonal profiles and influence performance differently.
17
Future studies should employ more reliable and accurate methods to measure menstrual cycle phases and explore performance variations across different phases (i.e., early FOL, late FOL, and LUT phases). Additionally, this study did not follow a counter-balanced approach, as athletes first performed during the FOL phase followed by the LUT phase.
2
This sequence could introduce order effects that might influence the results. Moreover, although the sample size is similar to those used in previous studies,26,54 it may limit the generalizability of the findings. In particular, the small number of participants and their young age should be highlighted as key limitations. Pubertal and post-menarcheal development stages can vary substantially among adolescent athletes, which may complicate the interpretation of menstrual cycle effects on performance
Conclusions
Overall, different positional and technical performances were found as a result of the menstrual cycle phases, while no effects were identified for physical performance or perceptual scales. Specifically, during SSCGs in the LUT phase, players decreased the distance to the nearest teammate, potentially adopting a more collective strategy. In contrast, the greater spacing during the FOL phase, coupled with improved dribbling deception and decision-making, may have afforded players more time and space to frame the target, leading to better shooting decisions. Interestingly, no effects were found for physical performance, which might be linked to the smaller pitch size used in this study. The lack of differences in players’ external load may also account for the absence of effects on perceptual scales. These results indicate that although physical and perceptual responses generally remain stable across menstrual phases, there are subtle differences in technical and positional behavior that could be important for planning training sessions. The trends identified in this pilot study, particularly regarding technical and positional variables, indicate that the menstrual cycle might influence the refinement of training strategies. This warrants further in-depth research to elucidate these effects.
Footnotes
Ethical considerations
The project and protocol were approved by the University of Maia, local Ethics Committee (code 21074).
Consent to participate
Before obtaining written informed consent, all players and their parents or guardians were thoroughly briefed on the study's requirements, potential risks, and benefits of participation. The study protocol adhered to the recommendations of the Declaration of Helsinki.
Data availability statement
In order to protect the subjects' confidentiality and privacy, data are only available upon request from the corresponding author. Interested researchers may contact the board from the University of Maia to request access to the data.
Declaration of conflicting interests
The authors declared no potential conflicts of interest with respect to the research, authorship, and/or publication of this article.
Funding
The authors disclosed receipt of the following financial support for the research, authorship, and/or publication of this article: This work was funded by National Funds by FCT - Foundation for Science and Technology under the following project UID/04045: Research Center in Sports Sciences, Health Sciences, and Human Development.