
Abstract
This study examined associations among training load (external and internal), heart rate variability (HRV), perceptual fatigue, sleep, and injury in endurance athletes during a 12-week training mesocycle. The aims were to (i) compare these parameters between injured and non-injured weeks and (ii) assess differences between high- and low-severity injuries. Fifteen endurance athletes (80% males; median age: 36.5 years; running experience: 5.5 years) participated. Injury severity was measured using the Oslo Sports Trauma Research Centre Questionnaire on Health Problems (OSTRC-H). Training load (training stress score [TSS], Session-Rate of Perceived Exertion [sRPE]), HRV, perceptual fatigue (readiness to train and wellbeing), and sleep were collected through daily and weekly assessments over 12 weeks. The weekly injury prevalence over the 12-week period ranged from 7%–40%, with 47% classified as high severity. Injured weeks were characterised by significantly higher sleep-related impairment (p = .004, Hedge's g = 0.704), while all other variables did not significantly differ. Athletes who sustained more severe injuries exhibited lower TSS (p < .001, Hedge's g = 0.84), lower sRPE (p = .029, Hedge's g = 0.705), poorer subjective wellbeing (p = .003, Hedge's g = 0.753), and lower HRV (p = .059, Hedge's g = 0.487) in the week preceding the injury. This exploratory study provides preliminary insights into the potential role of sleep-related impairment, training load fluctuations, and HRV in injury severity among endurance athletes. While findings suggest benefits of integrating these measures into monitoring strategies, the small sample size limits generalisability and should be interpreted with caution.
Introduction
Injury incidence among endurance athletes is notably high, with studies reporting that up to 45% of runners sustain an injury annually, 1 often due to training errors, biomechanical factors, or inadequate recovery strategies. 2 Given the high training volumes and intensity required for endurance performance, understanding factors that contribute to injury risk is crucial for both athletes and coaches. One such factor that has received considerable attention is training load, which encompasses both external (e.g., total distance, intensity, pace) and internal (e.g., perceived exertion, physiological response) measures.3–6 By effectively monitoring training load, practitioners can make evidence-based decisions to optimise performance and recovery while reducing the likelihood of injury.3,7
However, training load alone does not fully explain injury risk, as overuse injuries are multifactorial.8,9 Other contributing factors include genetics, anatomical structure, muscle strength, endurance, neuromuscular control, and biomechanics, 2 which influence an individual's ability to tolerate external loads. Current training load models often fail to capture inter-individual variability in tissue capacity, meaning that even well-structured load progression may still lead to injury in certain athletes.6,10 Therefore, a comprehensive approach that integrates physiological, biomechanical, and training-related factors is necessary to better understand injury risk in endurance athletes.
To assess how well an athlete adapts to training, it is essential to monitor both external and internal load parameters. Internal load measures include rate of perceived exertion (RPE) and physiological responses such as heart rate variability (HRV), which reflect autonomic nervous system adaptations to training stress.3,11,12 By implementing both internal and external monitoring over time, it is possible to provide greater insight to training stress and gather information on how the individual adapts to training to inform training practices and to minimise the likelihood of injury. 3 HRV has been proposed as a non-invasive tool to track fatigue, recovery status, and overtraining,13,14 and may offer valuable insight into injury risk when assessed alongside training load metrics.15–18
Despite advancements in wearable technology and data collection, most studies on training load and injury risk have focused primarily on external load. 6 Notably, a study conducted in the UK examined wearable technology data in a large prospective cohort of runners, providing valuable insight into the feasibility of using wearables to capture external load metrics, biomechanical data and injury risk. 19 However, studies incorporating internal training load and HRV as additional physiological indicators remain limited, despite their potential relevance in understanding the complex interactions between training stress, adaptation, and injury occurrence.
Additionally, sleep has emerged as a critical factor in athlete recovery and injury risk. Poor sleep quality has been linked to impaired neuromuscular function, decreased cognitive performance, and increased injury rates across various sports. 20 Sleep disturbances can result from training stress, competition schedules, and lifestyle factors, all of which may negatively impact injury resilience and recovery.21,22
Although theoretical models suggest relationships between training load, recovery, wellbeing, and injury risk,8,23 few empirical studies have simultaneously examined these factors in endurance athletes. Therefore, the aim of this longitudinal study was to explore the associations between training load (external and internal), HRV, perceptual fatigue, and sleep with injury occurrence in endurance athletes over a 12-week training mesocycle. Specifically, we aimed to compare the distribution of training load, HRV, perceptual fatigue, and sleep parameters between (i) injured and non-injured weeks and (ii) high- and low-severity injuries. Given the small sample and the exploratory nature, this study should be viewed as preliminary and hypothesis-generating.
Methods
Study design and participants
This study used an exploratory prospective cohort design involving 15 Chilean runners and trail runners who were actively participating in a local endurance training club. Participants were required to be 18 years or older and were recruited through direct contact with coaches and club administrators.
Participants were excluded if they had tested positive for COVID-19 via a Polymerase Chain Reaction (PCR+) test, experienced severe COVID-19 symptoms requiring hospitalisation or prolonged medical care or had a recent lower limb or back injury in the six months prior to study enrolment. Injury history was assessed through a self-reported medical history questionnaire. All participants provided written informed consent, and the study was approved by the institutional human research ethics committee.
Data collection and processing
This study was conducted over a 12-week training mesocycle (June–August 2021), during which participants maintained their training as planned by their respective coach. All participants followed a personalised training schedule and were coached by the same individual. Baseline data collection included sociodemographic information (including self-reported height and body mass), training experience, history of musculoskeletal injuries, and sleep quality, which was assessed using the Pittsburgh Sleep Quality Index (PSQI). 24 The PSQI is a widely used tool for assessing sleep quality over the past month. It consists of seven components, including subjective sleep quality, sleep latency, sleep duration, habitual sleep efficiency, sleep disturbances, use of sleep medication, and daytime dysfunction. The total score ranges from 0 to 21, with higher scores indicating poorer sleep quality. A global PSQI score of greater than 5 classifies individuals as poor sleepers, while a score of 5 or below indicates good sleep quality.
Injury classification and severity
Injury data were collected through a weekly online questionnaire based on the Spanish version of the Oslo Sports Trauma Research Centre Questionnaire on Health Problems (OSTRC-H).25,26 This validated tool captures both acute and overuse injuries across a range of severities. The OSTRC-H severity score ranges from 0 to 100, where 0 represents full participation without a health problem, and 100 represents complete inability to participate. 26
Participants were retrospectively classified into injured and uninjured groups on a weekly basis. A participant was considered injured in a given week if they reported an OSTRC-H score above 0, indicating the presence of an injury affecting training. Conversely, a participant was classified as uninjured if they reported an OSTRC-H score of 0. The onset (exact date) and location of injury was also recorded. To account for week-to-week variations in injury status, we conducted analyses at the weekly level, rather than assigning participants to fixed “injured” or “uninjured” groups for the entire study period. This approach allowed us to capture the dynamic nature of training-related injuries and use all available data points to compare injury and non-injury weeks.
Training load
Training load was quantified using Training Stress Score™ (TSS™), a concept derived from the training dose, which integrates workout duration and intensity and was originally introduced by Morton et al. (1990). 27 This concept was later refined by Allen & Coggan (2010) 28 into the TSS™, designed to quantify external training load across different sports. TSS™ is calculated based on session duration and intensity factor, which represents the session's intensity relative to an individual's estimated threshold. TSS™ values were extracted directly from TrainingPeaks®, a widely used online training management platform that enables the comparison of training loads across different disciplines, including running, cycling, and swimming. 29
Participants self-reported their Rate of Perceived Exertion (RPE) for each session using the Borg Scale (0–10). 30 Session-RPE (sRPE), expressed in arbitrary units (AU), was calculated by multiplying the RPE score by the session duration in minutes 31 as a measure of internal training load.
Heart rate variability (HRV)
Daily HRV was recorded upon awakening using a validated chest strap monitor (Elite HRV, version 4.3.0). 32 Participants remained in a supine position for five minutes during recordings. To ensure signal quality, data were filtered following procedures previously described. 15 The primary HRV variable used was the natural logarithm of the root mean square of successive differences between normal heartbeats (lnRMSSD). The lnRMSSD was chosen due to its reliability in reflecting parasympathetic nervous system activity and its widespread use in sports science research. 33
Perceptual fatigue
Participants assessed their daily readiness to train or compete upon awakening using an 11-point Likert scale, where 0 indicated feeling fully rested and 10 indicated extreme exhaustion. Overall wellbeing was measured daily using a five-item wellness questionnaire adapted from. 34 This questionnaire assessed perceived fatigue, sleep quality, general muscle soreness, stress levels, and mood. Each item was rated on a five-point scale (1–5), and total wellbeing scores ranged from 5 to 25, with higher scores indicating better wellbeing and lower scores indicating poorer wellbeing.
Sleep
Sleep was measured at the end of each week using the PROMIS™ Sleep Disturbance and Sleep-Related Impairment Item Banks (Short Forms 8a). 35 Sleep disturbance measures perceived difficulties in sleep quality, including problems with falling asleep, staying asleep, and perceived restfulness. Sleep-related impairment measures the daytime consequences of poor sleep, including sleepiness, fatigue, and difficulty functioning due to insufficient or poor-quality sleep. Both measures consist of eight items, each rated on a five-point Likert scale (1 = never, 5 = always). The total score ranges from 8 to 40, with higher scores indicating greater severity of sleep disturbance or impairment.
While objective sleep monitoring (e.g., actigraphy or wearables) would offer more granular sleep data, logistical constraints limited the feasibility of providing such devices to all participants. As a result, self-report tools were used to capture sleep-related impairment and disturbance, which are validated for weekly monitoring in sports science contexts.
Data analysis
Data were collected at both daily and weekly time points and were aggregated before analysis. Daily variables, including TSS (per session), RPE, sRPE, HRV, readiness, and subjective wellbeing, were averaged weekly. Weekly variables, such as sleep and injury data, were analysed as recorded. The final dataset comprised 12 weekly microcycles. For the analysis of weeks with and without injury, only weeks prior to the first onset were considered; however, for the analysis of high vs. low severity, all weeks were included.
Statistical analysis
First, a descriptive analysis of participants’ baseline characteristics was conducted. Due to the small sample size, we reported median values and interquartile range (IQR) for continuous variables (e.g., age, height, running experience, PSQI score) and frequency with percentages for categorical variables (e.g., sex, injury history). Weekly injury and high severity injury prevalence were calculated by determining the proportion of participants reporting injuries or high severity injuries each week. Injury and high severity injury incidence were calculated as the count of injury onsets (new episodes) each week.
For Aim 1, we compared the central tendency and distribution of training load (TSS, RPE, sRPE), HRV, perceptual fatigue (readiness and subjective wellbeing), and sleep parameters (disturbance and impairment) between injured and non-injured weeks. Given the small sample size, Hedges’ g was used instead of Cohen's d to account for potential bias in effect size estimation due to unstable standard deviations. 36 Effect sizes were interpreted as follows: values below 0.2 were considered negligible (N), those between 0.2 and 0.5 indicated a small (S) effect size, values between 0.5 and 0.8 represented a medium (M) effect size, and values of 0.8 or higher were classified as large (L) effect sizes. Due to the small sample size, statistical comparisons were performed using the Wilcoxon test for median differences and the Kolmogorov-Smirnov (K-S) test for distribution differences, with significance levels set at α = 1%, 5%, and 10%. These three significance thresholds were selected to account for the exploratory nature of the study and to provide a more nuanced interpretation of the findings. While α = 1% offers a stringent criterion to minimise Type I errors, α = 5% represents the conventional statistical threshold, and α = 10% allows for the identification of potential trends that may warrant further investigation in future studies with larger sample sizes.
For Aim 2, we compared the same studied variables between high- and low-severity injury weeks. Injury severity was determined using the OSTRC-H score distribution. A threshold of 55 was established to differentiate high-severity injuries (score >55) from low-severity injuries (score <55) based on severity distribution of our sample participants. Injury severity distributions were visualised using violin plots. The same statistical approach as Aim 1 was applied, including effect size estimation, Wilcoxon test for median differences, and K-S test for overall distribution comparison.
Equity, diversity, and inclusion
Our research team consisted of researchers from different career stages (junior to senior), with more men than women. All participants were from Chile, a Spanish-speaking Latin American country. Due to the nature of data collection, we selected a convenience sample of athletes already using the required technology for HRV and training load measurements. Demographic questions were gender-inclusive but did not assess ethnicity.
Results
Participant characteristics
Fifteen athletes (80% males) with a median age of 36.5 (IQR: 30–38) years and 5.5 (IQR: 5–10) years of running experience participated in the study. All participants were training for running and/or trail running events. Based on the PSQI global score, 43% of participants were classified as poor sleepers (PSQI global score > 5), while 57% were classified as good sleepers (PSQI global score ≤ 5). Participant characteristics are presented in Table 1.
Participant characteristics at baseline.
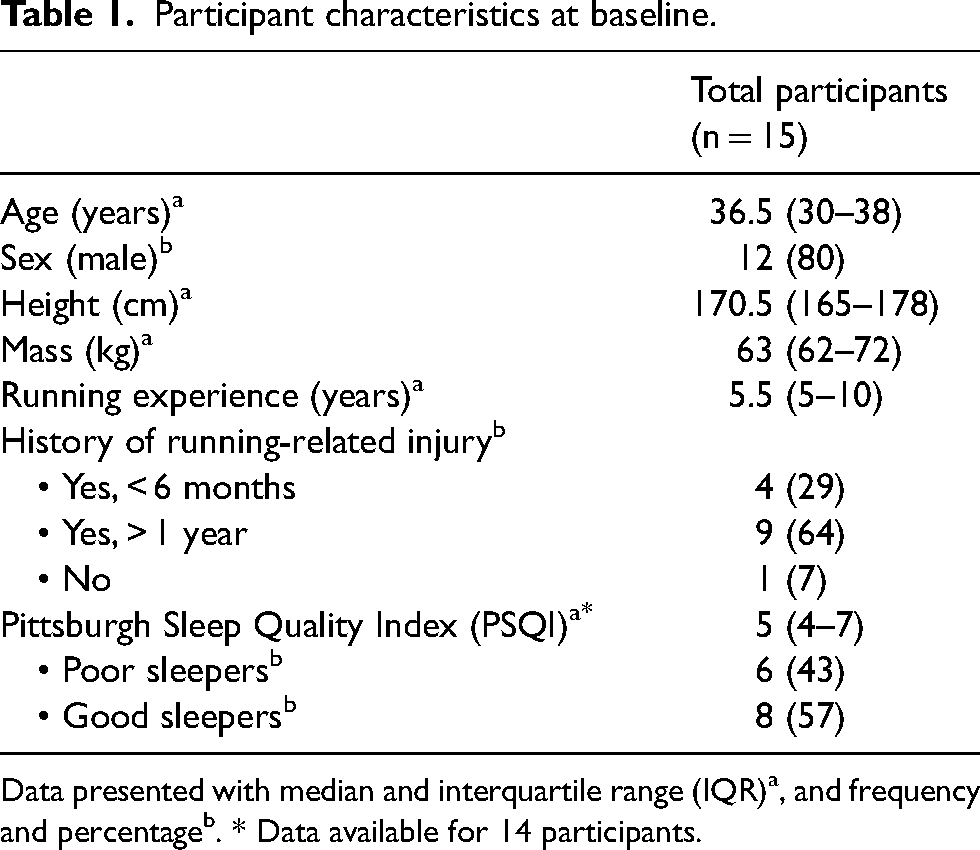
Data presented with median and interquartile range (IQR)a, and frequency and percentageb. * Data available for 14 participants.
Aim 1: compare the distribution of training load, HRV, perceptual fatigue, and sleep between injured and non-injured weeks
A total of 38 weekly injury reports were recorded over the 12-week period, while 142 weeks were injury-free. Of the 38 injured weeks, 21 involved a first-onset injury, and 17 included multiple onsets. The knee was the most commonly reported injury site (27/38, 71%) (see Supplementary Figure 1). Weekly injury prevalence ranged from 7% to 40%, with 18 weeks classified as high-severity injuries and 20 as low-severity injuries (see Supplementary Table 1).
When comparing training load, HRV, perceptual fatigue, and sleep parameters between injured and non-injured microcycles, no significant differences were observed for TSS (p = .319), RPE (p = .855), sRPE (p = .82), HRV (lnRMSSD, p = .225), subjective wellbeing (p = .082), readiness (p = .18), or sleep disturbance (p = .597). In contrast, sleep-related impairment was significantly higher in injured weeks, with a median of 19.0 (IQR: 17.5–22.5) compared to 17.0 (IQR: 15.5–19.0) in non-injured weeks (p = .004, Hedge's g = 0.704, moderate effect) (Figure 1 & Supplementary Table 2).
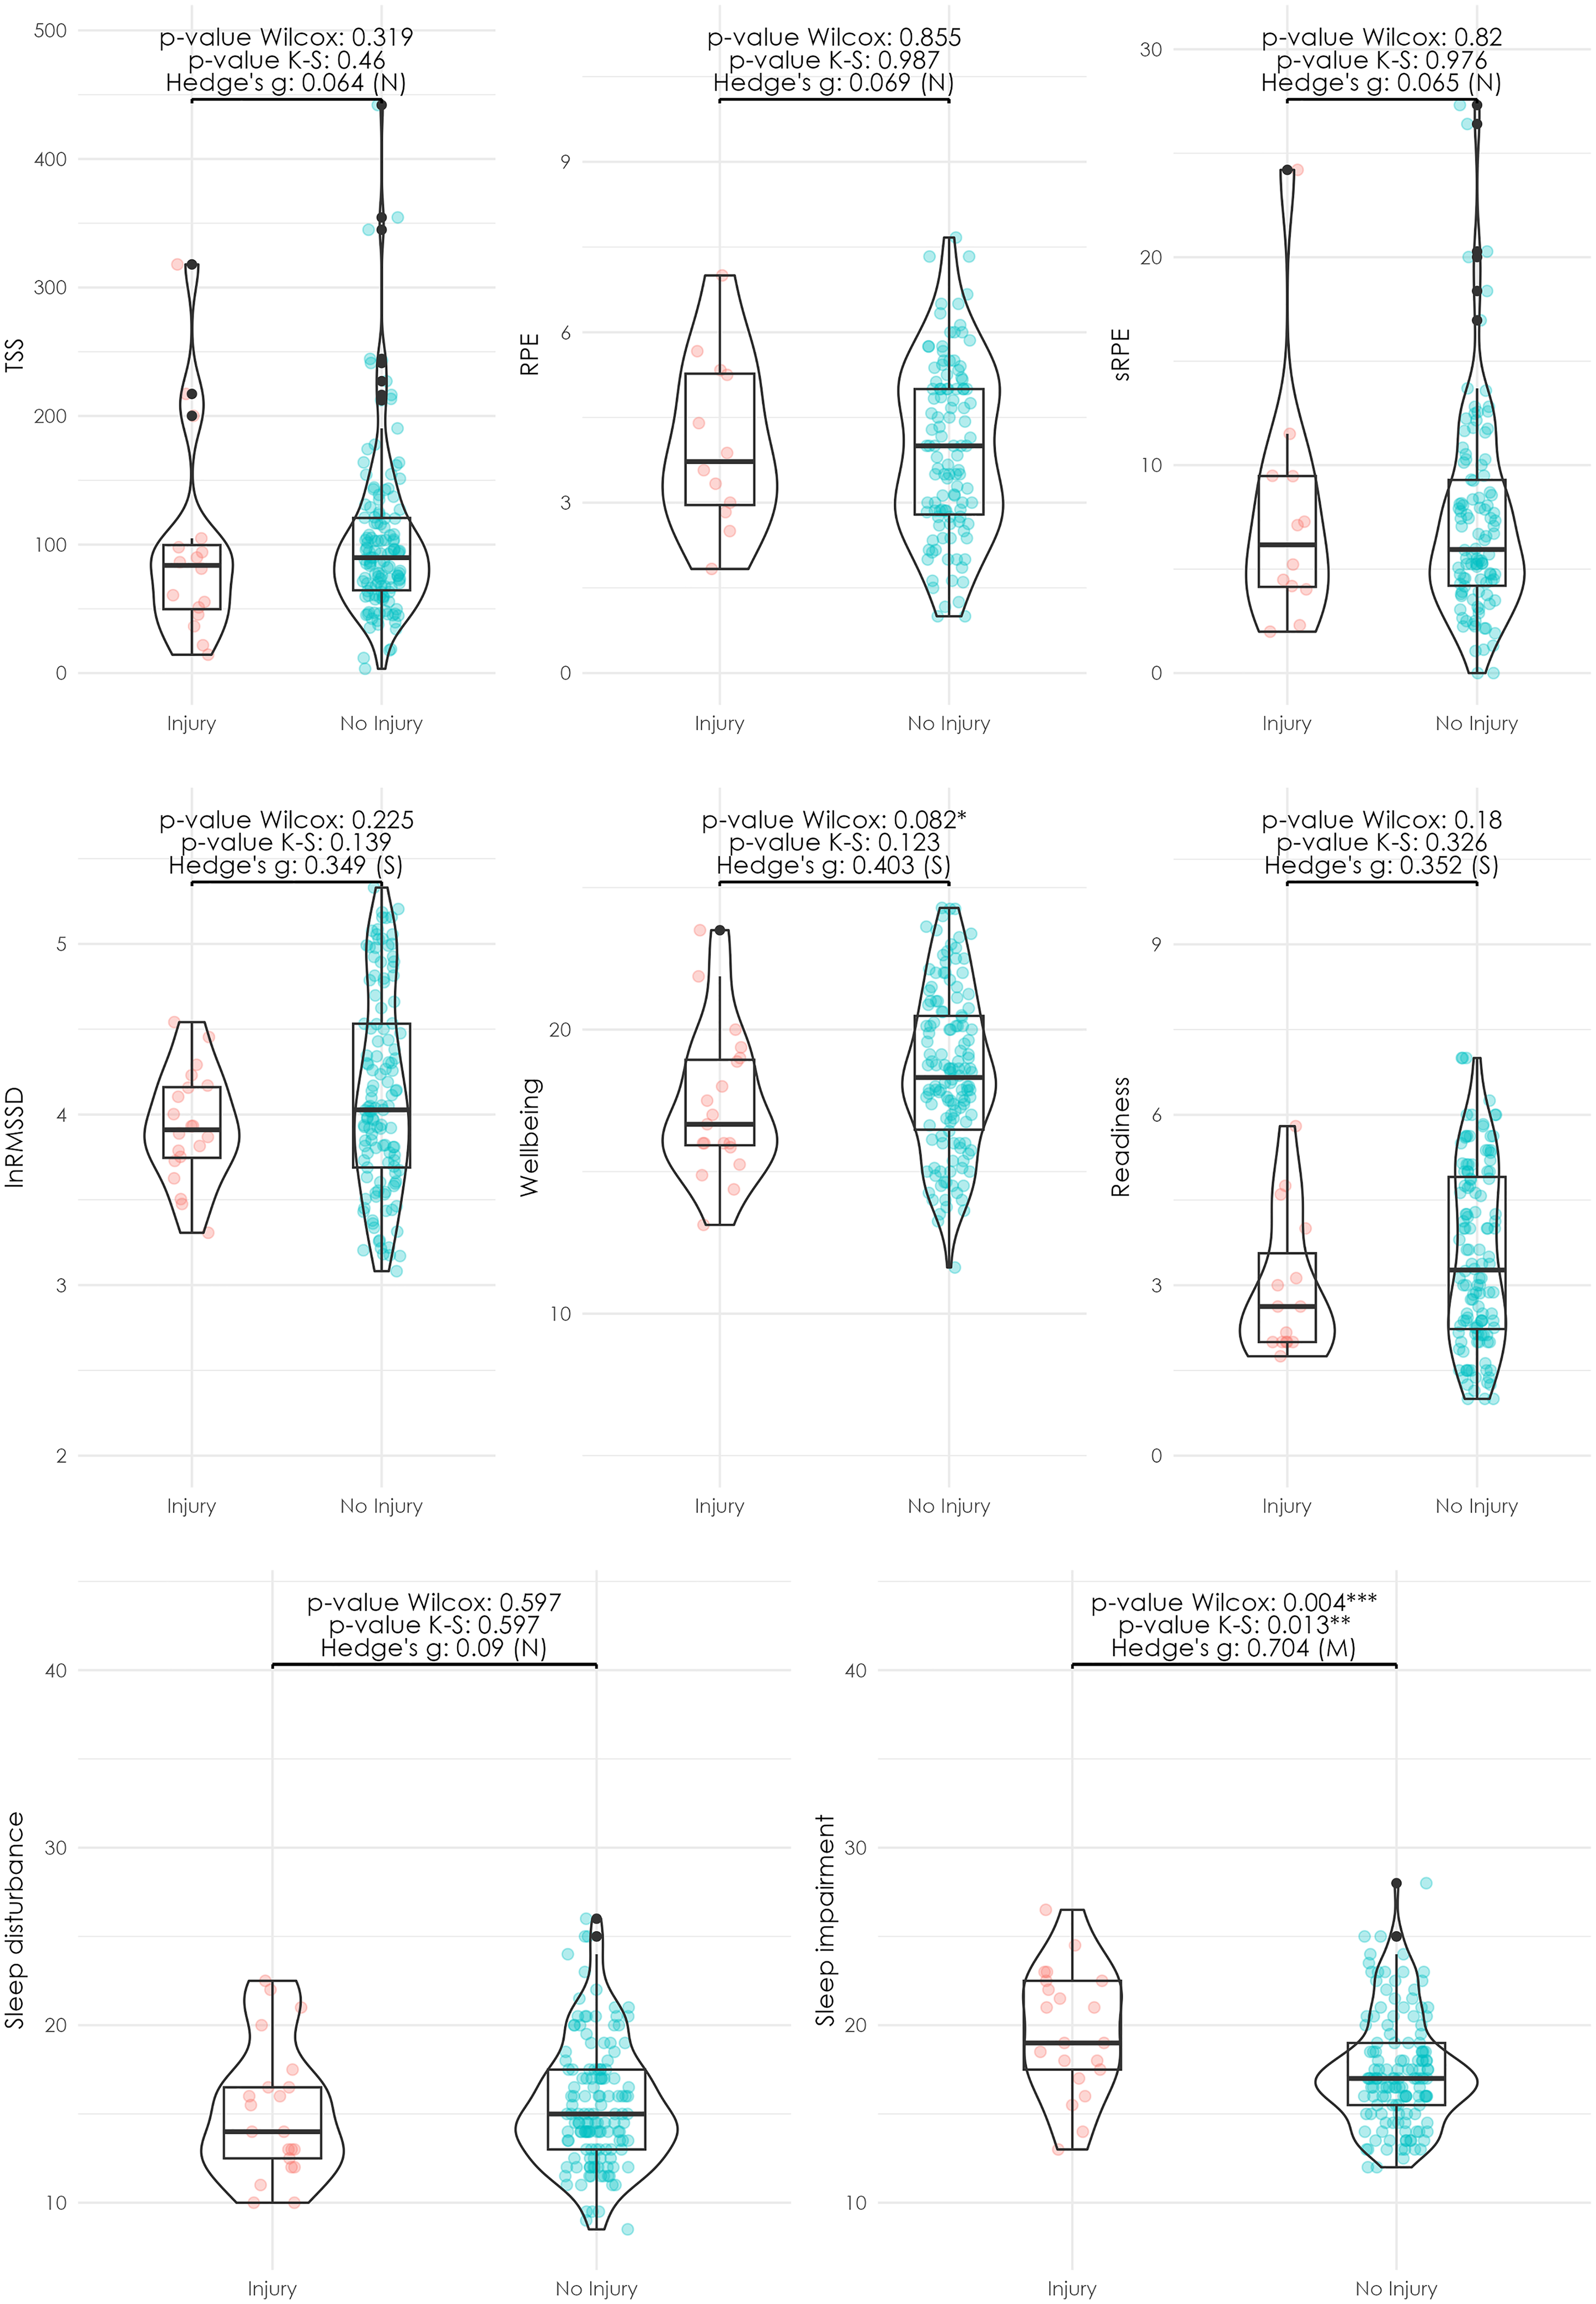
Distribution of training, sleep, and wellbeing variables by injury and non-injury samples. The seven subplots represent the distribution of key variables studied: external training load (TSS), perceived exertion (RPE), internal load (RPE x min), heart rate variability (measured as lnRMSSD), readiness, subjective wellbeing, sleep disturbance and sleep disorder. Within each subplot, data is visualised through three different plots: scatter plot, boxplot, and violin plot. The scatter plot provides a point-wise representation of the variable values, the boxplot summarises the distribution's central tendency (median, represented by the central horizontal line) and spread (interquartile range [IQR], represented by the box edges; and the whiskers extend to 1.5 times the IQR or the most extreme data points within this range. Outliers beyond this range are represented as black points), and the violin plot offers a detailed view of the variable's probability density. The caption provides information on the conducted tests, including the Wilcoxon test and K-S test p-values, with statistical significance levels denoted as follows: *** (α < 1%), ** (α < 5%), and * (α < 10%). The Hedges’ g effect size is categorised as negligible (N) when values are below 0.2, small (S) when values are between 0.2 and 0.5, medium (M) between 0.5 and 0.8, and large (L) when exceeding 0.8.
Aim 2: compare the distribution of training load, HRV, perceptual fatigue, and sleep between high and low-severity injuries
The injury severity classification based on OSTRC-H scores identified two groups: low-severity injuries with a median severity score of 37 (IQR: 24–41) and high-severity injuries with a median score of 78 (IQR: 68–100) (Figure 2).
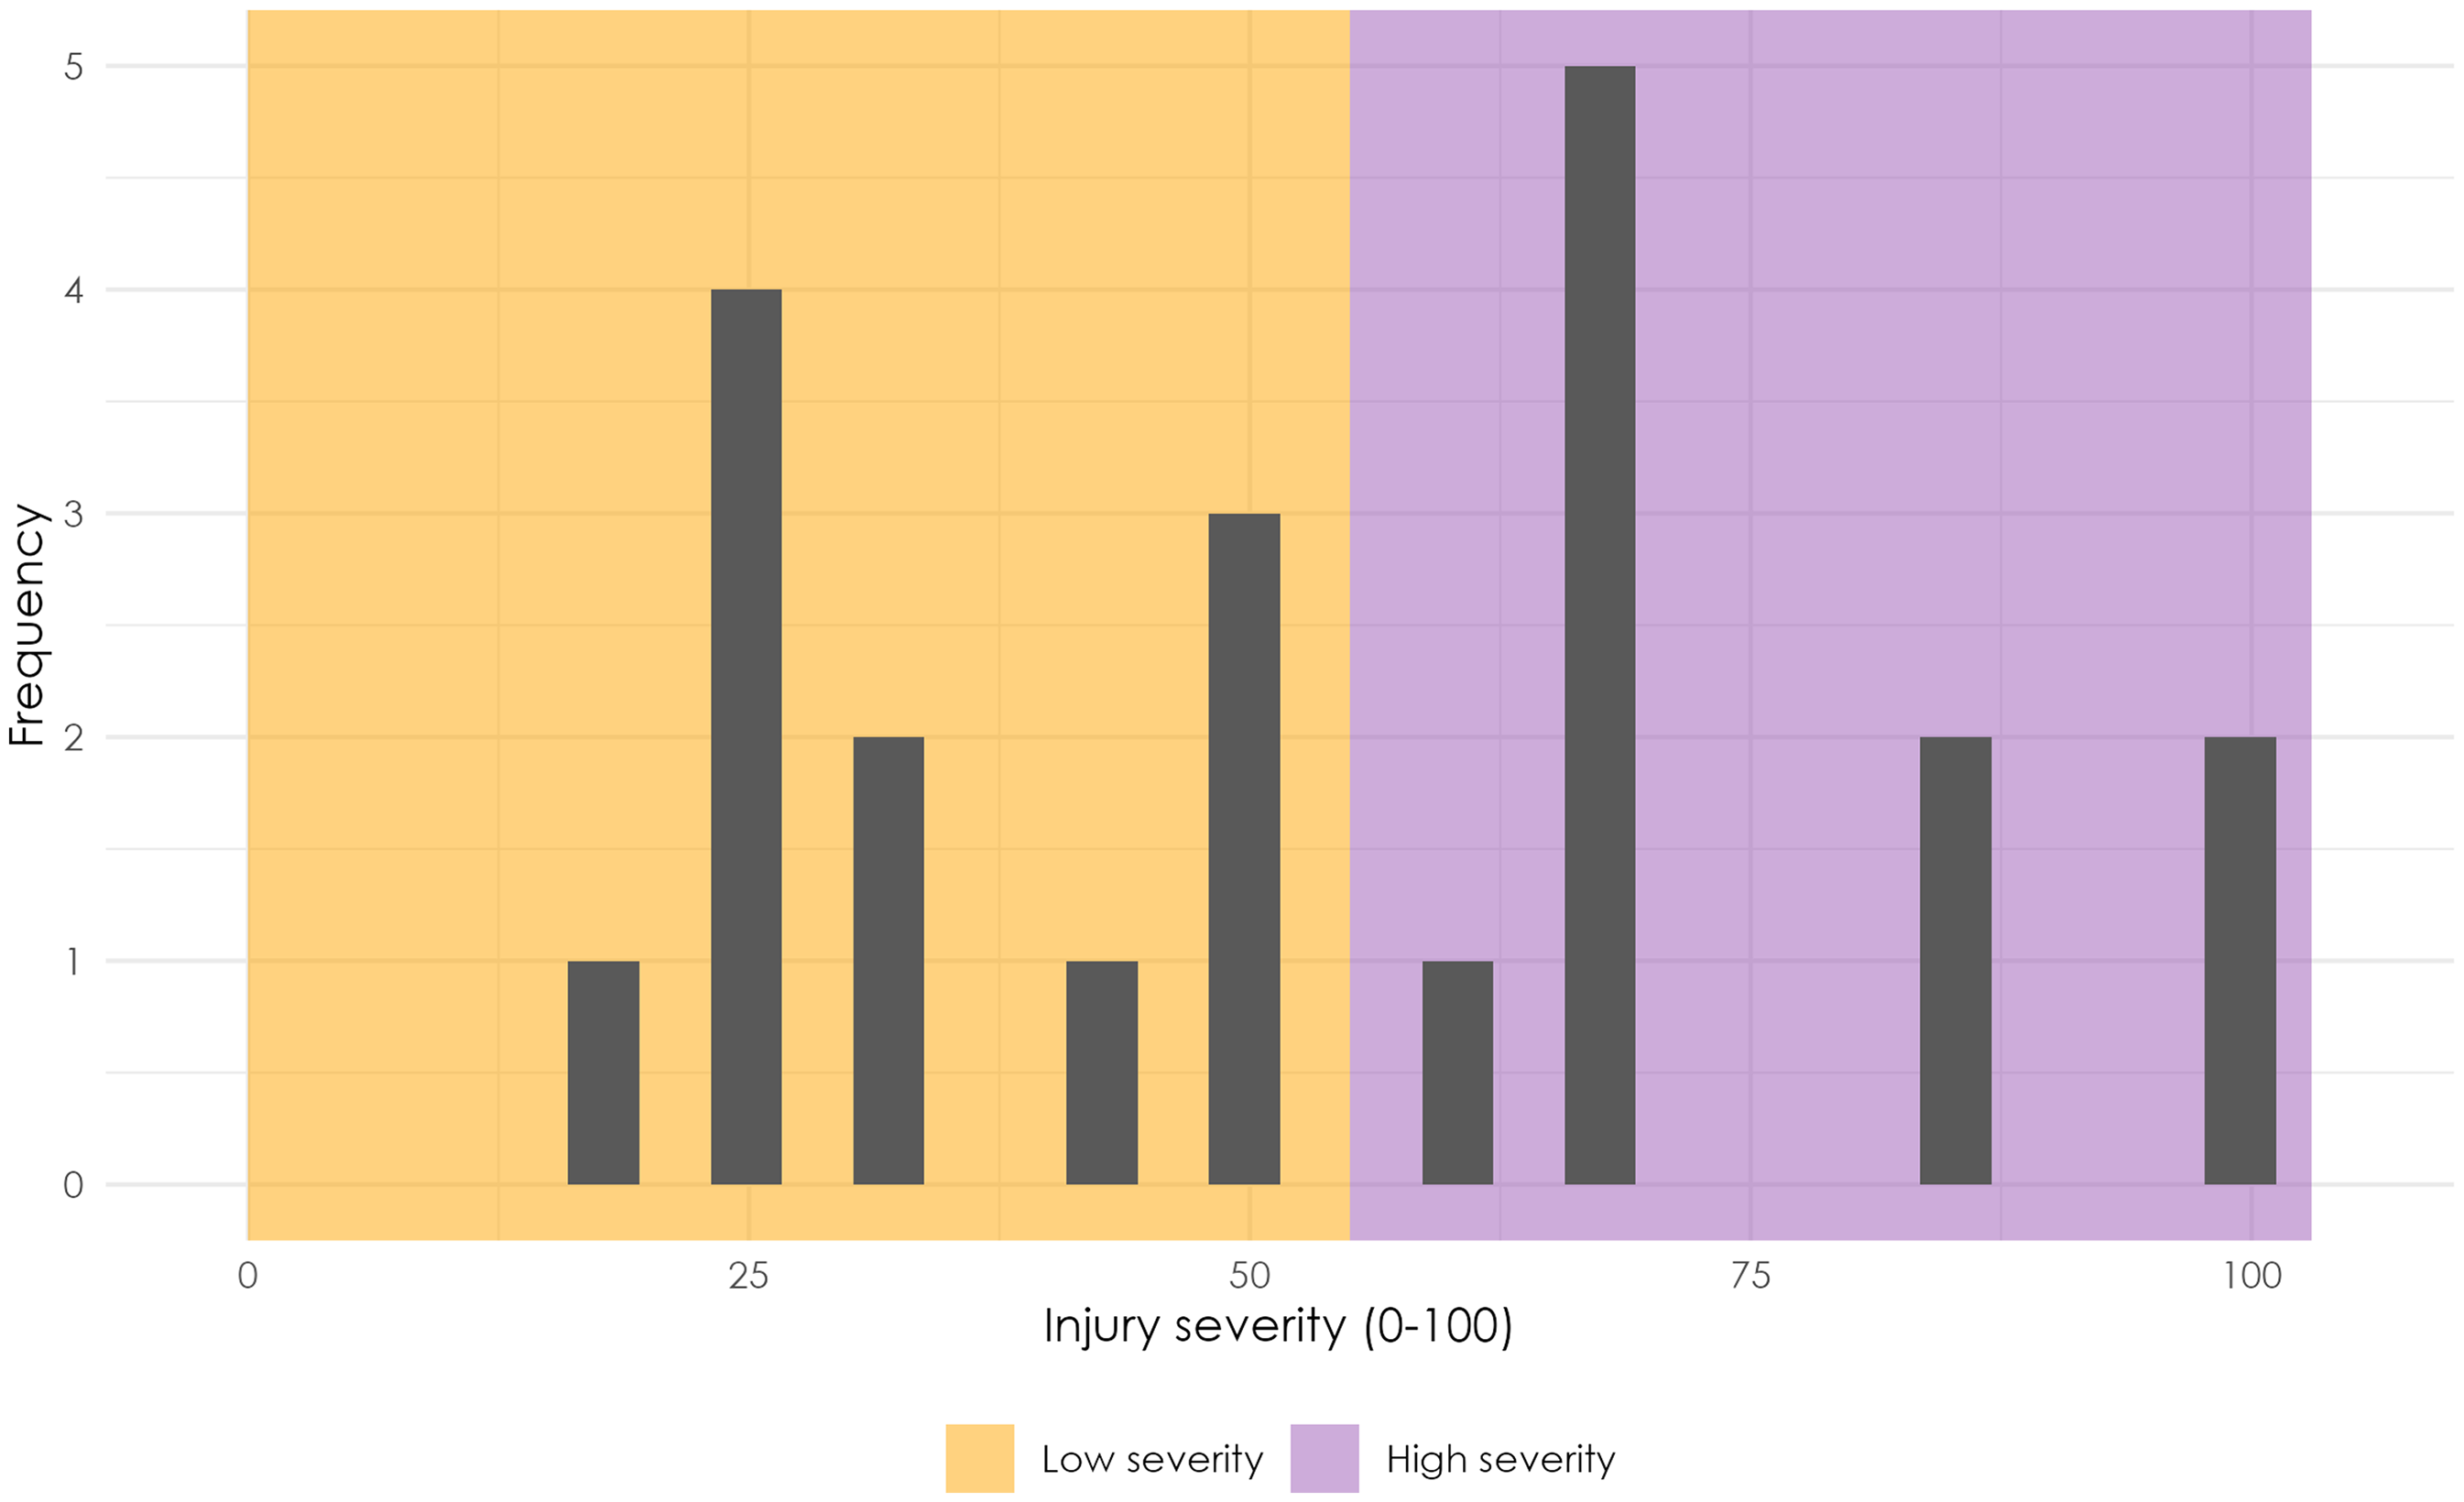
Distribution of injury severity. The histogram displays the distribution of injury severity cases, with each bar representing a range of severity scores. The yellow section categorises cases as low severity (below 55), while the orange section denotes high severity. The distinction between low and high severity is determined based on visual inspection of the histogram.
When comparing training load variables, TSS was significantly lower in high-severity injuries (median: 45.5, IQR: 35.8–64.1) than in low-severity injuries (median: 117.8, IQR: 92.9–177.2) (p < .001, Hedge's g = 0.84, large effect). Internal training load, measured via sRPE, was also lower in high-severity injury weeks (median: 3.2, IQR: 1.8–4.4) compared to low-severity injury weeks (median: 6.1, IQR: 5.5–9.5) (p = .029, Hedge's g = 0.705, moderate effect). Subjective wellbeing scores were significantly lower in high-severity injury weeks (median: 16.0, IQR: 15.3–17.1) compared to low-severity weeks (median: 19.1, IQR: 17.7–19.9) (p = .003, Hedge's g = 0.753, moderate effect). HRV (lnRMSSD) was also lower in high-severity injury weeks (median: 3.8, IQR: 3.6–3.9) compared to low-severity injury weeks (median: 4.1, IQR: 3.9–4.1) (p = .059, Hedge's g = 0.487, small effect). Additionally, sleep-related impairment was significantly higher in high-severity injury weeks, with a median of 21.0 (IQR: 18.6–21.9) compared to 18.0 (IQR: 17.4–19.9) in low-severity injury weeks (p = .003, Hedge's g = 0.714, moderate effect).
The distribution of TSS, sRPE, HRV (lnRMSSD), wellbeing, and sleep impairment also significantly differed between high- and low-severity injuries, as indicated by the K-S test (all p < .05), suggesting that differences were not solely explained by central tendency measures.
Other variables, including readiness (p = 0.182), RPE (p = .872), and sleep disturbance (p = .186), did not show statistically significant differences between high- and low-severity injuries (Figure 3 & Supplementary Table 3).
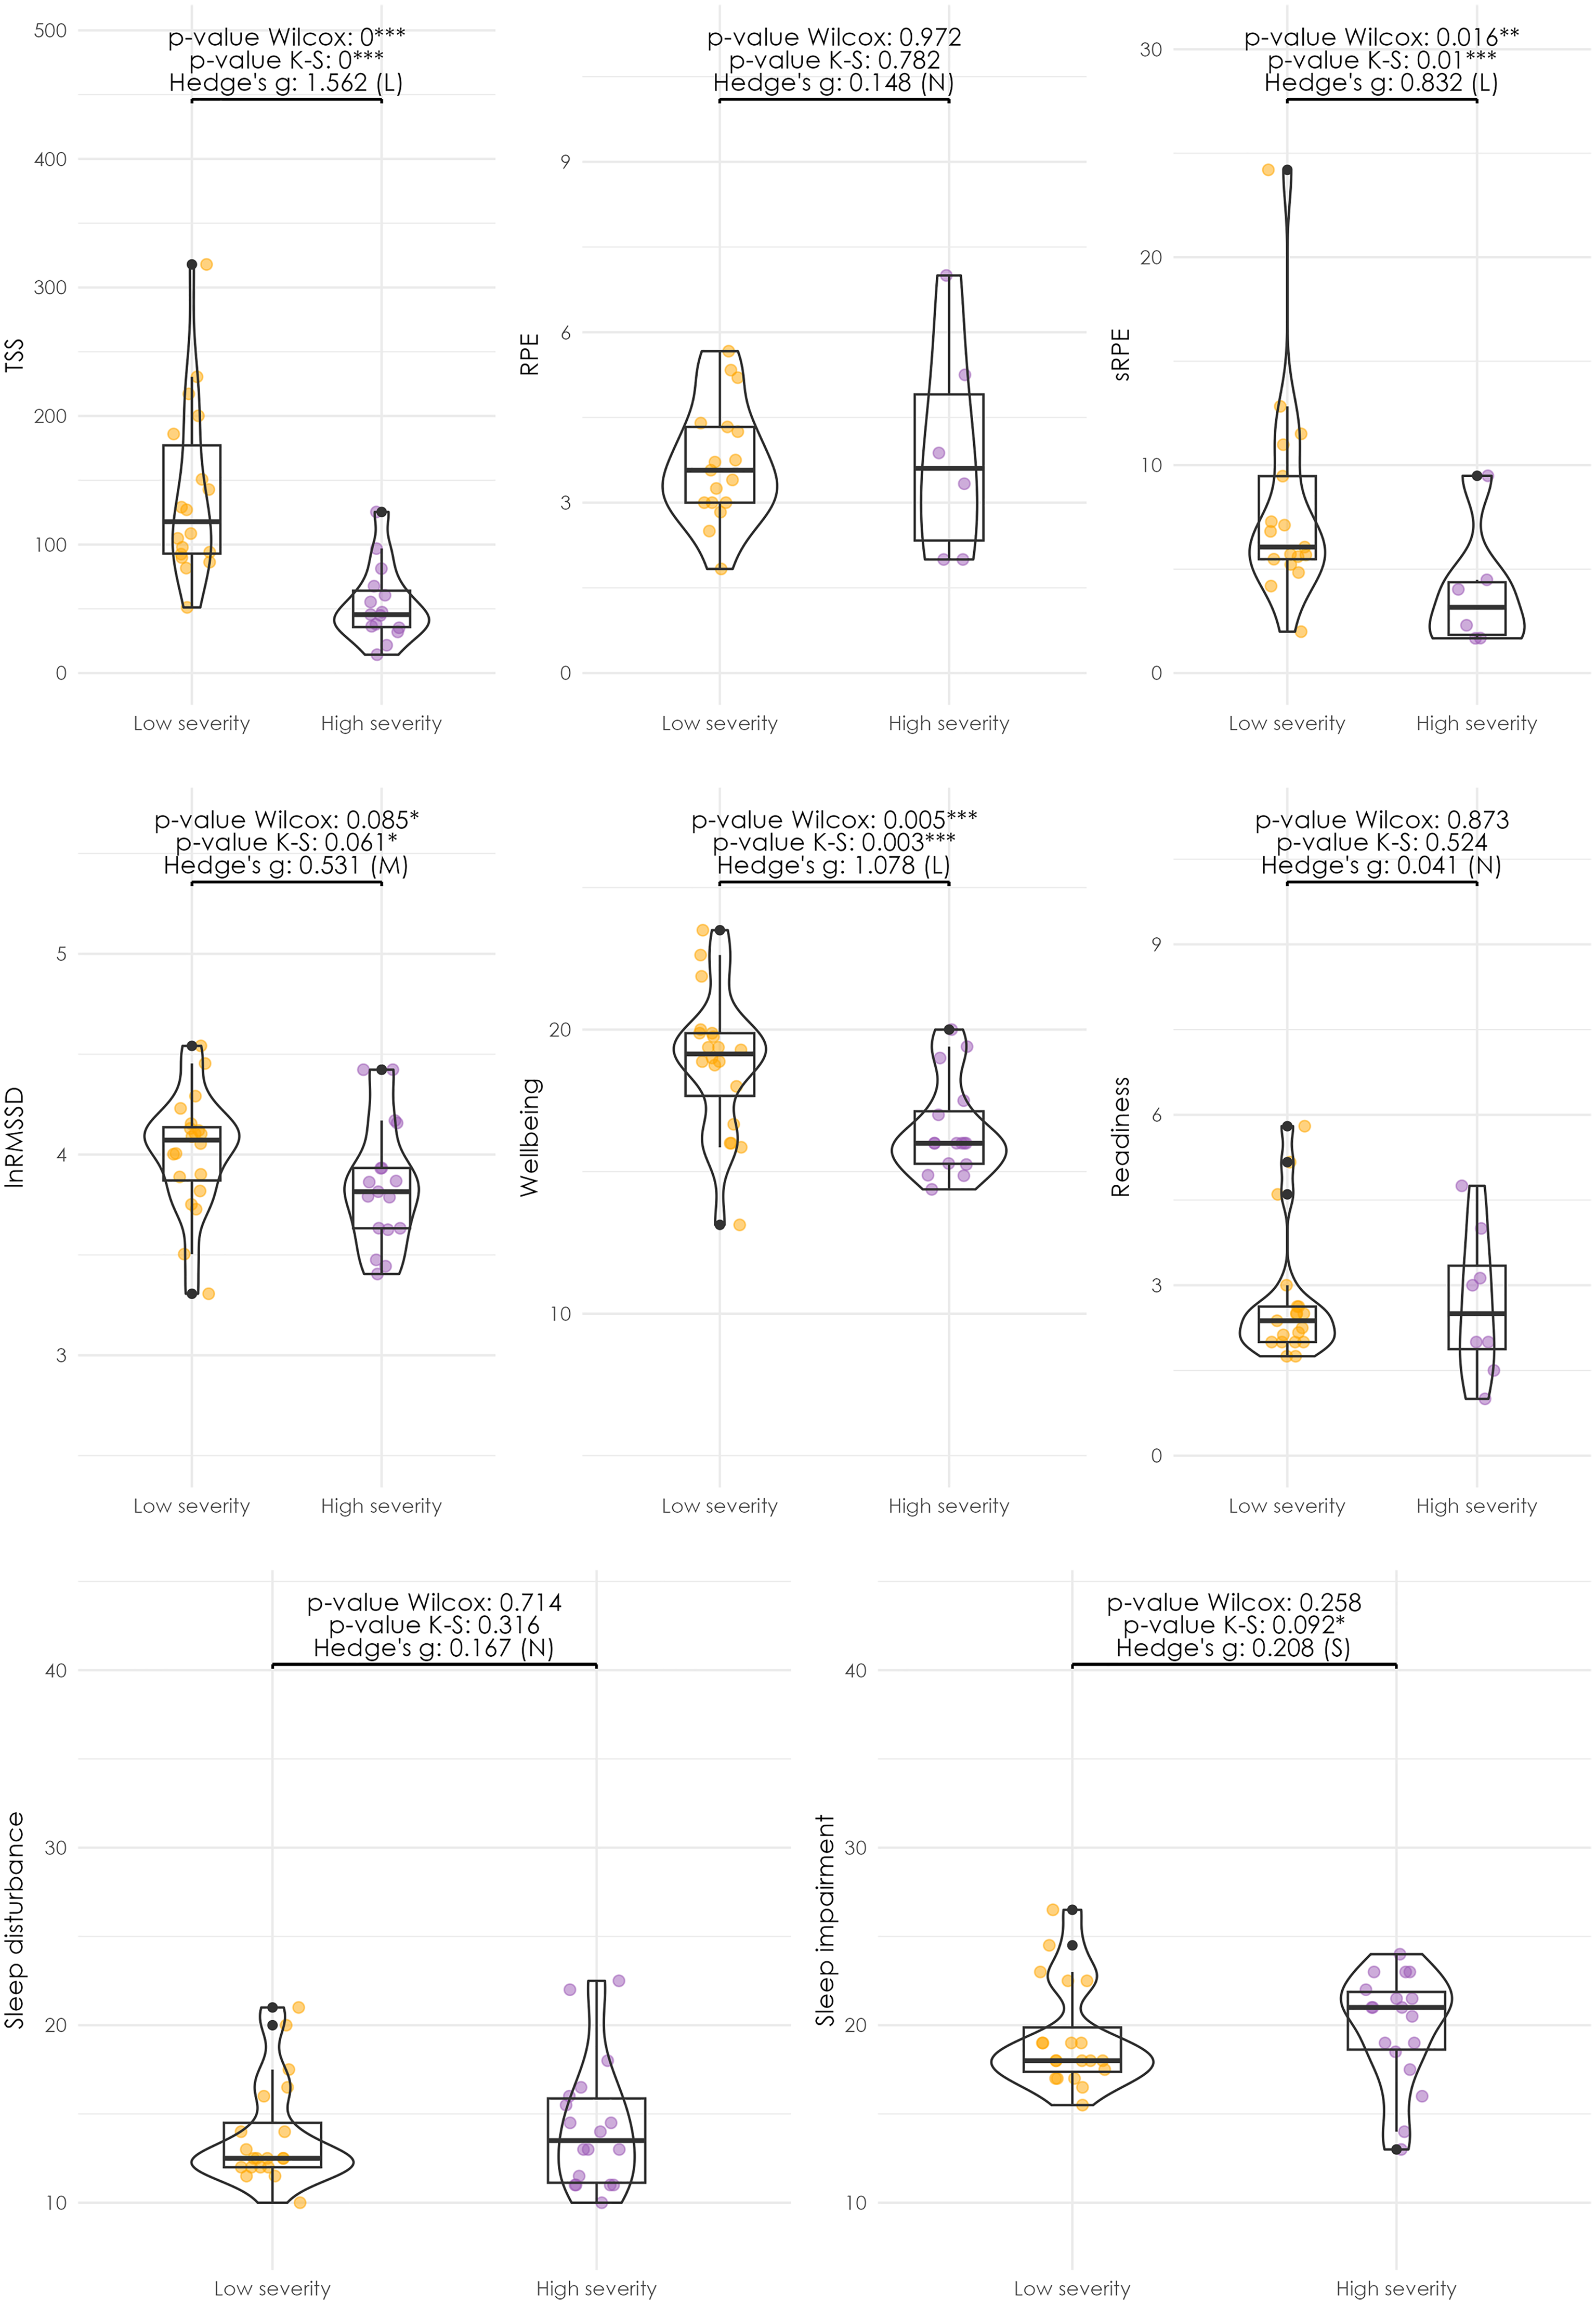
Distribution of training, sleep, and wellbeing variables by injury severity. The seven subplots represent the distribution of key variables studied: external training load (TSS), perceived exertion (RPE), internal load (RPE x min), heart rate variability (measured as lnRMSSD), readiness, subjective wellbeing, sleep disturbance and sleep disorder. Within each subplot, data is visualised through three different plots: scatter plot, boxplot, and violin plot. The scatter plot provides a point-wise representation of the variable values, the boxplot summarises the distribution's central tendency (median, represented by the central horizontal line) and spread (interquartile range [IQR], represented by the box edges; and the whiskers extend to 1.5 times the IQR or the most extreme data points within this range. Outliers beyond this range are represented as black points), and the violin plot offers a detailed view of the variable's probability density. The caption provides information on the conducted tests, including the Wilcoxon test and K-S test p-values, with statistical significance levels denoted as follows: *** (α < 1%), ** (α < 5%), and * (α < 10%). The Hedges’ g effect size is categorised as negligible (N) when values are below 0.2, small (S) when values are between 0.2 and 0.5, medium (M) between 0.5 and 0.8, and large (L) when exceeding 0.8.
Discussion
This study investigated the associations among training load, HRV, perceptual fatigue, sleep, and injury occurrence and severity in endurance athletes over a 12-week training mesocycle. The findings revealed that sleep-related impairment was the only variable that significantly differed between injured and non-injured microcycles. Athletes who sustained more severe injuries exhibited lower training loads (TSS and sRPE), poorer subjective wellbeing, lower HRV (lnRMSSD), and greater sleep-related impairment in the week preceding their injury. Furthermore, the distribution patterns of these variables also significantly differed between high- and low-severity injuries, suggesting that variations beyond central tendency measures may be relevant when assessing injury risk and severity. These findings provide early insight into potential injury-related patterns but should be interpreted within the context of a small, exploratory sample.
Comparison with prior research
The injury prevalence range observed in our study aligns with findings in endurance athletes, though rates vary depending on study design, inclusion criteria, and injury definitions. For instance, a study reported a 5.6% to 14.8% prevalence of running-related injuries in marathon runners over 16 weeks, with 49.8% classified as substantial injuries. 37 Differences in injury incidence across studies likely reflect variation in training characteristics, athlete experience levels, and monitoring methodologies.
Our findings also reinforce prior evidence on the importance of sleep in injury occurrence. Sleep-related impairment scores were higher in injury weeks, suggesting that athletes who experience greater sleep-related difficulties may have compromised recovery, increased fatigue, and impaired cognitive or neuromuscular function, potentially heightening their susceptibility to injury. This pattern contrasts with the findings of Neal et al. (2024) who reported no significant associations between sleep quality (measured using the brief version of the PSQI) and injury risk in a larger cohort of recreational runners. 19 However, a key distinction between the two studies is the methodology used to assess sleep. Their study relied on the PSQI, which evaluates general sleep quality over the past month, whereas our study implemented the more recent Patient-Reported Outcomes Measurement Information System (PROMIS) that assessed sleep disturbances and impairment on a weekly basis. The use of shorter recall periods may have allowed for greater sensitivity in detecting acute fluctuations in sleep that could be linked to injury risk. Nonetheless, the inconsistencies across studies highlight the complexity of sleep-injury relationships and suggest that factors such as sleep duration, consistency, and athlete-specific recovery capacity may moderate this association. However, an important limitation is the reliance on self-reported sleep data, which may be subject to recall bias and may lack the sensitivity and objectivity of wearable-based assessments. Although the PROMIS sleep scales are validated for use in athletic populations, they do not provide objective measures such as sleep duration or wake after sleep onset, which may also be relevant to injury risk.
Our results are in line with broader literature suggesting that both sleep quality and quantity play critical roles in athlete recovery and injury prevention. 38 However, the specific influence of different sleep dimensions on injury risk may vary depending on the sport, training intensity, and the interaction with other risk factors. 20 Future studies should aim to standardise sleep assessment methodologies, incorporate objective metrics and examine how specific sleep disturbances (e.g., sleep onset latency, wake after sleep onset, sleep fragmentation) relate to injury risk across different athletic populations.
We also observed that athletes who reported poorer wellbeing in the week leading up to an injury tended to experience more severe injuries. This aligns with previous research,39,40 which demonstrated a significant relationship between decreased wellbeing and an increased risk of injury in athletes. For instance, previous research indicates how poor wellbeing might reduce an athlete's tolerance to training load, thereby increasing injury risk. 41 These studies suggest that psychological and physical wellbeing are critical factors influencing an athlete's vulnerability to injuries. Additionally, Sanfilippo et al. (2023) further explored the role of wellbeing in injury prediction, reinforcing the importance of integrating both physical and psychological monitoring to mitigate injury risk and severity in endurance sports. 42
Regarding HRV, our study is one of the first to prospectively assess HRV patterns and injury occurrence in endurance athletes using a standardised method of data collection. While HRV (lnRMSSD) did not significantly differ between injured and non-injured weeks, it was lower in high-severity injury weeks compared to low-severity injury weeks. Additionally, the distribution patterns of HRV differed significantly between high- and low-severity injuries, suggesting potential autonomic dysregulation preceding more severe injuries. A reduction in HRV reflects a shift towards increased sympathetic dominance or reduced parasympathetic activity, which may indicate accumulated physiological stress, impaired recovery, and reduced adaptability to training loads. This autonomic imbalance could compromise the body's ability to regulate inflammatory responses, neuromuscular function, and tissue repair, potentially increasing the risk of more severe injuries. These findings align with prior studies proposing HRV as a marker of physiological strain leading up to injury events. 43 However, further research with larger, more diverse cohorts is necessary to clarify the predictive utility of HRV in injury monitoring and occurrence assessment.
Interpretation of training load findings
Contrary to some previous findings, our study found no clear association between total external load (TSS) and injury occurrence. However, we observed that more severe injuries were often preceded by a significant reduction in TSS during the week before injury, suggesting that athletes may instinctively adjust their training in response to early, unrecognised injury symptoms. It is possible that athletes began to reduce their training in response to emerging discomfort or fatigue, either consciously or under guidance, just prior to the onset of more severe injuries. Alternatively, a reduction in load may have led to under-preparation, reducing tissue tolerance and inadvertently increasing injury risk. These possibilities highlight the importance of considering not only absolute training loads but also their timing, trajectory, and the broader context in which they occur. This aligns with the acute:chronic workload ratio (ACWR) model, which suggests that sudden changes in training volume, rather than absolute workload, may be more critical in injury development. 44 This nuanced relationship highlights the importance of examining workload fluctuations rather than relying solely on cumulative training loads as a risk factor for injury.
Further refining our understanding of this relationship, we found that internal load (sRPE) was significantly lower in high-severity injuries compared to low-severity injuries, whereas no differences were observed when comparing injury vs. non-injury weeks. These findings suggest that training intensity relative to an athlete's capacity may play a role in injury severity, rather than simply the total workload. However, it is important to acknowledge that these comparisons are distinct, and our study design does not allow us to determine whether training load influences the likelihood of sustaining a more severe injury.
While our data do not allow for causal inferences, these findings highlight the importance of considering how training loads are distributed over time rather than focusing solely on absolute workload measures. Future research should not only evaluate total workload but also investigate fluctuations in intensity and volume across training cycles to refine injury prevention strategies. Additionally, individual tolerance to training load and other modifying factors (e.g., recovery capacity, biomechanics, previous injury history) should be incorporated into injury risk models to improve personalised monitoring approaches. 6
Additionally, the severity of injuries should be carefully considered when using surveillance methods for overuse injuries, as different injury severities may be associated with distinct physiological and training load patterns. By differentiating between high- and low-severity injuries, surveillance systems can provide more nuanced insights into the progression and impact of training-related injuries, allowing for better-targeted interventions rather than applying uniform risk thresholds across all injuries. Integrating severity considerations into overuse injury monitoring could improve early identification and inform load management strategies aimed at mitigating injury burden.
Clinical implications
The findings of this study have several important practical implications for athletes, coaches, and sports science practitioners. First, athletes who experience increased sleep-related impairment scores may benefit from targeted recovery strategies, such as sleep hygiene interventions and load management adjustments. Given that sleep-related impairment was significantly higher in injured weeks and high-severity injuries, addressing sleep quality and recovery capacity could be a key component in injury risk management.
Second, the observation that more severe injuries were preceded by lower training loads (TSS and internal load) raises important considerations for injury monitoring strategies. Rather than solely focusing on absolute training volume, practitioners should be mindful of fluctuations in workload and potential underloading effects that may contribute to injury risk. Tracking internal load measures (e.g., sRPE) in combination with external load metrics may provide a more comprehensive understanding of an athlete's training response, particularly in endurance sports where external workload alone may not fully capture individual physiological and perceptual adaptation.
Third, HRV (lnRMSSD) was lower in high-severity injury weeks, and its distribution patterns differed between high- and low-severity injuries, highlighting that autonomic dysregulation may be linked to increased injury severity. This finding suggests the potential benefit of individualised HRV tracking, where deviations from an athlete's baseline rather than absolute values are considered in injury risk assessment. However, further research is required to determine the most effective ways to integrate HRV metrics into real-world athlete monitoring systems.
Finally, injury severity should be incorporated into surveillance methods for overuse injuries, as high- and low-severity injuries may follow distinct physiological and training load trajectories. By considering injury severity in monitoring systems, practitioners may enhance their ability to detect and mitigate risk factors leading to more severe injuries.
Incorporating these insights into training programmes could enhance injury prevention and monitoring efforts by fostering a more nuanced, athlete-centred approach to load management, recovery strategies, and injury surveillance.
Strengths of the study
A key strength of this study is its prospective design, which allowed for week-to-week monitoring of injury occurrence and severity in relation to training load, HRV, and sleep patterns over a 12-week period. Unlike retrospective studies, which rely on post-injury recall bias, our approach captured real-time fluctuations in physiological and perceptual variables. The use of OSTRC-H scores for injury severity classification also enabled a more nuanced examination of injury progression, distinguishing low- and high-severity cases rather than simply categorising athletes as injured or non-injured.
Additionally, while previous studies, such as Neal et al. (2024), have explored wearable technology data in larger cohorts, our study provides a more detailed individual-level analysis by incorporating self-reported training experiences and perceptual measures. 19 A key distinction is that our study included measures of internal training load (sRPE) and HRV, which have been identified as crucial factors in understanding the complex relationship between training load and injury.4,6,7 These physiological and perceptual metrics offer a more comprehensive approach to monitoring athlete adaptation and fatigue, complementing external training load measures. Additionally, our study assessed acute fluctuations in training load, recognising that week-to-week changes in volume and intensity may play a more influential role in injury risk than total workload alone. This integrated approach enhances our understanding of the load-injury relationship by capturing both physiological responses and perceptual indicators of fatigue and readiness.
Limitations and future directions
While this exploratory study offers valuable preliminary insights, several limitations must be acknowledged. First, the small sample size (n = 15) restricts the generalisability of findings, and the effect sizes should be interpreted with caution. Although Hedges’ g was used to mitigate potential inflation of effect sizes, the absolute differences between groups were small. Future studies should determine whether these differences exceed the minimum clinically important difference (MCID) or standard error of measurement (SEM) to assess their practical significance. While we observed associations between several variables and injury severity, we were unable to assess whether these variables statistically predicted injury outcomes due to limited statistical power. Predictive modelling approaches (e.g., logistic regression) were not feasible given the small sample size, as such analyses would likely lead to overfitting, unstable predictions, and poor generalisation. Future studies with larger samples are needed to examine these relationships more robustly. Another limitation is the self-reported nature of injury classification and internal training load data, which may introduce recall bias or subjective variability. While the OSTRC-H questionnaire is a validated tool, future research could benefit from objective biomechanical or physiological assessments to complement self-reported measures. Finally, our sample was limited to Chilean endurance athletes, restricting geographical and sport-specific generalisability. Expanding research to include diverse endurance sports, training levels, and geographical populations would enhance the applicability of findings. Despite these limitations, our study contributes valuable insights into the complex interplay between training load, HRV, perceptual fatigue, and injury in endurance athletes. Larger, multi-site studies with more diverse samples are needed to replicate these findings and determine their generalisability.
Conclusion
This study highlights the importance of sleep-related impairment, physiological monitoring, and training load fluctuations in understanding injury occurrence and severity in endurance athletes. The findings suggest that sleep-related impairment was significantly higher in injured weeks, while lower training loads (TSS and sRPE), poorer subjective wellbeing, lower HRV (lnRMSSD), and greater sleep-related impairment were observed in the weeks preceding high-severity injuries. Given the small sample size, these findings should be interpreted with caution, and future research should aim to replicate them in larger, more diverse cohorts.
Moving forward, integrating objective physiological markers (e.g., HRV), perceptual measures, and training load metrics will be essential to developing comprehensive athlete monitoring systems. By combining external and internal training load measures, sleep metrics, and physiological responses, practitioners can implement individualised monitoring strategies to enhance recovery, optimise training adaptations, and ultimately reduce injury risk in endurance athletes.
Supplemental Material
sj-docx-1-spo-10.1177_17479541251335613 - Supplemental material for Associations between training load, heart rate variability, perceptual fatigue, sleep, and injury in endurance athletes during a 12-week training mesocycle
Supplemental material, sj-docx-1-spo-10.1177_17479541251335613 for Associations between training load, heart rate variability, perceptual fatigue, sleep, and injury in endurance athletes during a 12-week training mesocycle by Raimundo Sanchez, Claudio Nieto, Jaime Leppe, Tim Gabbett and Manuela Besomi in International Journal of Sports Science & Coaching
Supplemental Material
sj-jpg-2-spo-10.1177_17479541251335613 - Supplemental material for Associations between training load, heart rate variability, perceptual fatigue, sleep, and injury in endurance athletes during a 12-week training mesocycle
Supplemental material, sj-jpg-2-spo-10.1177_17479541251335613 for Associations between training load, heart rate variability, perceptual fatigue, sleep, and injury in endurance athletes during a 12-week training mesocycle by Raimundo Sanchez, Claudio Nieto, Jaime Leppe, Tim Gabbett and Manuela Besomi in International Journal of Sports Science & Coaching
Footnotes
Acknowledgment
The authors thank all those who participated in this study, as well as local institutions and organisations that helped with recruitment.
Author Contribution
RS, CN, and MB provided substantial contributions to the conception and design of the work, JL, and TG to the interpretation of the data, CN to the data collection, and RS to the analysis. RS and MB contributed to drafting the work, and all authors participated in revising it critically for important intellectual content. All authors have provided final approval of the version to be published and agree to be accountable for all aspects of the work.
Consent to participate
All participants provided written informed consent.
Declaration of conflicting interests
The authors declared no potential conflicts of interest with respect to the research, authorship, and/or publication of this article.
Funding
The authors received no financial support for the research, authorship, and/or publication of this article.
Ethical considerations
The study was approved by the institutional human research ethics committee.
Supplemental material
Supplemental material for this article is available online.
References
Supplementary Material
Please find the following supplemental material available below.
For Open Access articles published under a Creative Commons License, all supplemental material carries the same license as the article it is associated with.
For non-Open Access articles published, all supplemental material carries a non-exclusive license, and permission requests for re-use of supplemental material or any part of supplemental material shall be sent directly to the copyright owner as specified in the copyright notice associated with the article.