
Abstract
During basketball training and competition, players perform accelerations and decelerations, changes of direction, and jumps with little recovery. These movements place a range of loads on the players’ bodies and vary across positions and over time. Limited research has quantified biomechanical loads longitudinally using game data and the ratio of accelerations to decelerations. This study investigated positional differences in accelerations, decelerations, and an acceleration-to-deceleration (AD) ratio in training and competition throughout a single season. Data from collegiate male basketball players (NCAA D-I) were collected with player tracking devices, Catapult Optimeye S5, for 30 games and 89 practices during the 2019–2020 season. Starting guards (n = 2), forwards (n = 3), and centers (n = 2) played more than 20 games and averaged more than 10 min/game. Significantly lower values occurred in practice vs. games for all metrics (p < .05). The biomechanical loads produced significantly different player-position profiles, and practice vs. game differences provided insights into AD ratio variations. Longitudinal changes revealed a significant decrease in the AD ratio and its day-to-day variation. These data provide a basis for assessing player performance, and future studies can extend the current analyses to examine performance changes between game segments and evaluate player performance changes at weekly levels across a season.
Introduction
Basketball requires players to perform multiple accelerations and decelerations, rapid changes of direction, and numerous jumps with little recovery in between.1,2 This unique playstyle is due to the high intensity and intermittent character of a basketball game. 1 Accelerations, changes of direction, and jumping movements place a substantial amount of biomechanical load on the player's lower body. 3 Typically, accelerations require more energy to perform, while decelerations place higher biomechanical loads on the athlete's body, 4 both of which compound into the overall external load. The external load can accumulate over time, causing a decline in an athlete's overall performance, or performance fatigue.1,5 Measurable changes in performance fatigue (e.g., changes in velocity) can be either acute fatigue, over a short period (e.g., game), or chronic fatigue, over an extended period (e.g., season). 6 Both types of fatigue can ultimately hinder a player's ability to perform maximally throughout the season.
Accelerations and decelerations can be objectively measured in basketball games and practices using microtechnology. In the last decade, microtechnology (e.g., inertial measurement units [IMUs]) has emerged as a means of tracking and managing the external load on athletes.1,7–14 IMUs are used in numerous sports to quantify player load and monitor the stresses of competition and training. 4 IMUs consist of four main components: a triaxial accelerometer, gyroscope, magnetometer, and an optional positional module.6,15–18 These components allow the device to track the relative intensity defined by thresholds set within the device-specific software. Typical thresholds for accelerations and decelerations range from high (>2.0–4 m·s−2),4,7,8,10,14,15,17,19 moderate/medium (>1–2.78 m·s−2),7,8,10,16 and low (>0.55–2.5 m·s−2),7,8,10,17 and they may vary based on sport. For these reasons, the default sport-specific thresholds found within the device software for basketball should be used, as they will provide a more standardized framework for literature and practitioner application. The devices are typically worn on the player's trunk. The integration of microtechnology and relative non-invasive IMUs have allowed coaches and scientists to measure and monitor player performance more objectively and accurately. 14 Inertial measurement devices are valid measuring tools and are reliable for measuring high-intensity movements, such as accelerations.2,9,15,18,20,21 Additionally, the National College Athletic Association (NCAA) ruled in 2015 that wearable devices may be worn during games,22,23 allowing for monitoring players’ physical demands during competition on a collegiate level. The ability to record in-game data has led to the exploration of new external load measures associated with accelerometry profiles and position specific loads.
Basketball players usually fall into three main playing positions: guards, forwards/wings, and centers.8,10,11,20 Guards are normally responsible for controlling the ball from one end of the court to the other, performing quick changes of directions to evade defenders, and shooting the ball from mid-to-long ranges in a relatively quick manner. In general, guards tend to be smaller in stature and more explosive than the other positions. The forward/wing players fill a hybrid role, as they tend to be taller than guards, and are more explosive than centers. Forwards tend to be positioned closer to the basket than guards, which allows them to take mid-range shots and retrieve rebounds. Centers typically play close to the basket and are anatomically larger than most forwards. Depending on the team's strategy the playing positions can have specific tasks and distinct movement patterns.
The demands of the different playing position also require different frequencies and intensities of accelerations and decelerations. Centers performed fewer accelerations and decelerations than guards and forwards and at lower intensities.2,17,24 Guards performed a significantly greater number of accelerations than forwards. 20 These positional differences in the frequency and intensity of accelerations and decelerations can affect the metabolic response and biomechanical load exposure that each player experiences, respectively. The use of accelerometry in basketball has led to the development of positional training profiles,14,19 has shown differences between drills,12,25 and revealed positional differences between genders. 26 The use of accelerometry and its derived metrics gives practitioners better insight when managing the athlete's loads and stresses. However, many of the accelerometry studies were conducted only in the practice setting, while the links to actual game performance have been understudied. Recent changes in regulations in some competitive basketball leagues have allowed for in-game recordings, and correspondingly, the investigation of the performance for the in-game and practice settings.
Accelerations and decelerations vary within a game, a season, and across playing positions, highlighting the sensitivity to changes in performance.2,3,12,18,20,26,27 Accelerometry profiles of U-18 female basketball players showed that the number of accelerations and decelerations declined from the 1st quarter to the 3rd quarter and from the 2nd to the 4th.17,27 These profiles highlight a potential indicator of fatigue, although acceleration profiles are likely different between male and female basketball. Newans et al. developed a deceleration-to-acceleration (DA) ratio in soccer to study the changes in performance independent of the number of accelerations. 15 The acceleration-to-deceleration (AD) ratio — or similarly DA ratio — represents a normalized comparison that is centered around 1. The results from Newans et al. showed a moderate increase in the ratio from the first to the second half. The change in the AD ratio showed a non-proportional increase in decelerations to accelerations between the two halves, which implied a nonlinear relation between the two. 15 Vazquez-Guerrero et al. used an AD ratio with respect to time, AD ratio per min, for 12 players. 20 Their findings highlighted that perimeter players (i.e., point and shooting guards) in basketball performed more decelerations to accelerations per minute. 20 These previous studies showed that the number of decelerations was more prevalent than accelerations, but each used the ratio in different applications. One compared halves at a team level, 15 while the others made comparisons at the positional level and between quarters. 20 The use of an AD ratio may therefore be an informative tool to measure and capture changes in performance and quantify differences among athletes. Using a normalized ratio of AD gives practitioners a comparative metric that can then be used to track changes in performance, develop competition-like training protocols, and aid in positional adaptations of elite athletes. However, there is limited knowledge surrounding positional variations of an AD ratio in basketball throughout a season.
Playing positions in basketball differ in demands, but there is limited understanding of position-specific accelerometry profiles during games and practice sessions, and longitudinal changes in performance. Therefore, the current study aims are two-fold: 1) to investigate position-specific acceleration profiles in games and practice sessions and 2) to explore the acceleration-deceleration ratio as a potential measure of changes in performance throughout a single season in trained, competitive male basketball players. Literature has shown that accelerations carry a metabolic cost, and decelerations carry a biomechanical load consequence, 4 and therefore, this study will include a ratio of accelerations and decelerations with the aim to provide a more wholesome view for performance variations. It is hypothesized that guards and forwards will have more accelerations and decelerations than centers, that biomechanical actions will predominantly be performed at low and moderate intensities, and that the AD ratio of centers will be different from other basketball positions. Furthermore, it was hypothesized that forwards would have the most day-to-day variability, given the hybrid nature of the position.
Methods
Research design
A retrospective approach was used to observe the accelerations and decelerations during the 2019–2020 NCAA Division I (D-I) Men's Basketball season. Data on 12 basketball players were collected during practice and competition in conjunction with the athletic training staff. Players’ data were recorded using the Optimeye S5 device (Catapult Innovations, Melbourne, Australia). The 2019–20 season contained 31 games and 89 practices. One game was excluded from the study due to failure to record data. Days without load measurements were excluded from analyses, including unspecified rest days, injury periods, and/or data transfer errors. All team practices were included for game comparisons and practice profiles.
Subjects
Twelve NCAA D-I male basketball players from a Power 5 conference team, with a level 3 elite status, 11 were assessed for this study. Player development is comprehensive over the calendar year, with pre-season, in-season, and post-season training including non-traditional summer training. Of the 12 players observed, 7 players had a starting role during the season and were included for detailed analysis in this study. They played >20 games (i.e., 65% of the season) and averaged >10 min per game. 27 The athletes’ average (± SD) height was 2.00 ± 0.12 m, and their mass was 101.1 ± 13.8 kg. Players provided consent prior to participation in data collection via the university's Department of Athletics. Data from all players were compiled into a repository, and the Institutional Review Board at the university approved secondary data analyses.
Procedures
Each player was assigned a device for the entire season, which they wore during practices and games. The device was worn on the player's trunk, between the scapulae at approximately C7-T1 level, in either a team-issued shirt or harness. Game data were passively organized and included all stoppages of play, such as but not limited to; free throws, out of bounds plays, and timeouts. Data of inactivity before and after the games and practices were removed from analyses. Data from rest days, injury days, and data transfer errors were also excluded from analyses.
The Openfield software (Openfield version 1.22.2; Catapult Innovations, Melbourne, Australia) was used to organize, download, and analyze the accelerometer data. Game data were separated into three periods: warm-up, first half, and second half. Practice data included pre-season and in-season training sessions ranging from late September to early March. These sessions were separated into 228 unique periods, containing drills related to warm-up, offensive plays, conditioning, and player development. For the current study, practice data were viewed as an entire session due to the variability in duration and drill content. Resulting in 781 unique observations between games and practice sessions. Players were grouped according to their position (i.e., guard, forward, and center), which was determined using the team roster and input from the team staff. The data were then exported for subsequent analyses via Python in Jupyter Notebook (version 3.7.4).
There were three accelerometry metrics of interest during this investigation: accelerations (count), decelerations (count), and the AD ratio. Acceleration and deceleration counts were separated into four bins: high (>3.5 m·s−2), moderate (>2.5 m·s−2), low (>1.5 m·s−2), and total (i.e., sum of high, moderate, and low ranges). These ranges were the default settings for the Openfield software and following thresholds used in previous studies.1,8,12,14,15,24 The AD ratio was calculated by dividing the total accelerations over the total decelerations (AD ratio = total accelerations / total decelerations). A within-week coefficient of variation (CV) was calculated using a seven-day rolling window of the AD ratio for each player, where the standard deviation (SD) was divided by the mean for the respective seven days. This CV is expressed as a percentage and represents the biomechanical variability of basketball players. The mean and SD represented adaptive measurements that only used observed data. Missing data from rest days, injury, and device dropout were included in but not counted toward the average, resulting in 7-day periods with averages ranging from 1 to 7 observations.
In addition to the three accelerometry metrics, the study also included the contextual metrics of playing position, playing minutes, activity type, and game day as those metrics may have influenced the players’ behaviors. Playing minutes referred to the recorded amount of time that the player was on the court during the game, these minutes were recorded for each athlete every game. Activity type was used to classify the data as either being a game or practice. The game day indicates the practice session on the day before (GD-) or after (GD+) the game.
Statistical analyses
The data were evaluated using linear mixed-effect models, with significant effects being further evaluated using pairwise comparisons. The acceleration and deceleration models evaluated the effects of intensity, position, activity type, and date on each of the respective counts. An interaction term between position and intensity, activity type, and date were included as fixed effects for both the acceleration and deceleration models. The individual players were modeled with random intercepts for both. The AD ratio model assessed the influence of position, activity type, and date on the metric with each predictor being modeled as a fixed effect. Individual players were similarly modeled as random effects. To assess the relation of playing minutes to the AD ratio in games, a repeated measures correlation was also conducted on the game sessions. 28 Correlation associate levels were split into 5 levels: negligible (0.00 to ± 0.30), low (± 0.30 to 0.50), moderate (± 0.50 to 0.70), high (± 0.70 to 0.90), and very high (± 0.90 to 1.00). 29 The day-to-day variation of the AD ratio throughout the season was assessed using a linear mixed-effect model, with the seven-day CV as the dependent variable, while position and day were fixed effects. The individual players were modeled with random intercepts. T-scores on model coefficients were calculated using Satterthwaite's method, and statistical significance was established at p ≤ .05 for all analyses. Data are displayed as mean ± SD unless otherwise specified. R-Studio (version 3.6.1; Boston, Massachusetts) was used for statistical modeling and data analyses. Data on the biomechanical demands across the micro-cycle has not been statistically evaluated and will be presented in the Supplementary Material for illustrative purposes.
Results
Accelerations and decelerations
Acceleration and deceleration profiles are provided for position and activity type (Table 1). The main effect of the intensity level of accelerations was significant (p < .001). There were fewer high accelerations than moderate and low accelerations (p < .001 and p < .001, respectively). The highest proportion of accelerations were performed at a low intensity. Fewer accelerations were performed at practice per intensity level than in games (p < .001). On average, practices contained 11 fewer accelerations. Accelerations were significantly influenced by date (p < .001), where each intensity level of acceleration counts decreased across the season (Figure 1(a)). Acceleration counts were not significantly different among positions, and the interaction term with the intensity level was similarly insignificant (p = .73 and p = .62, respectively).
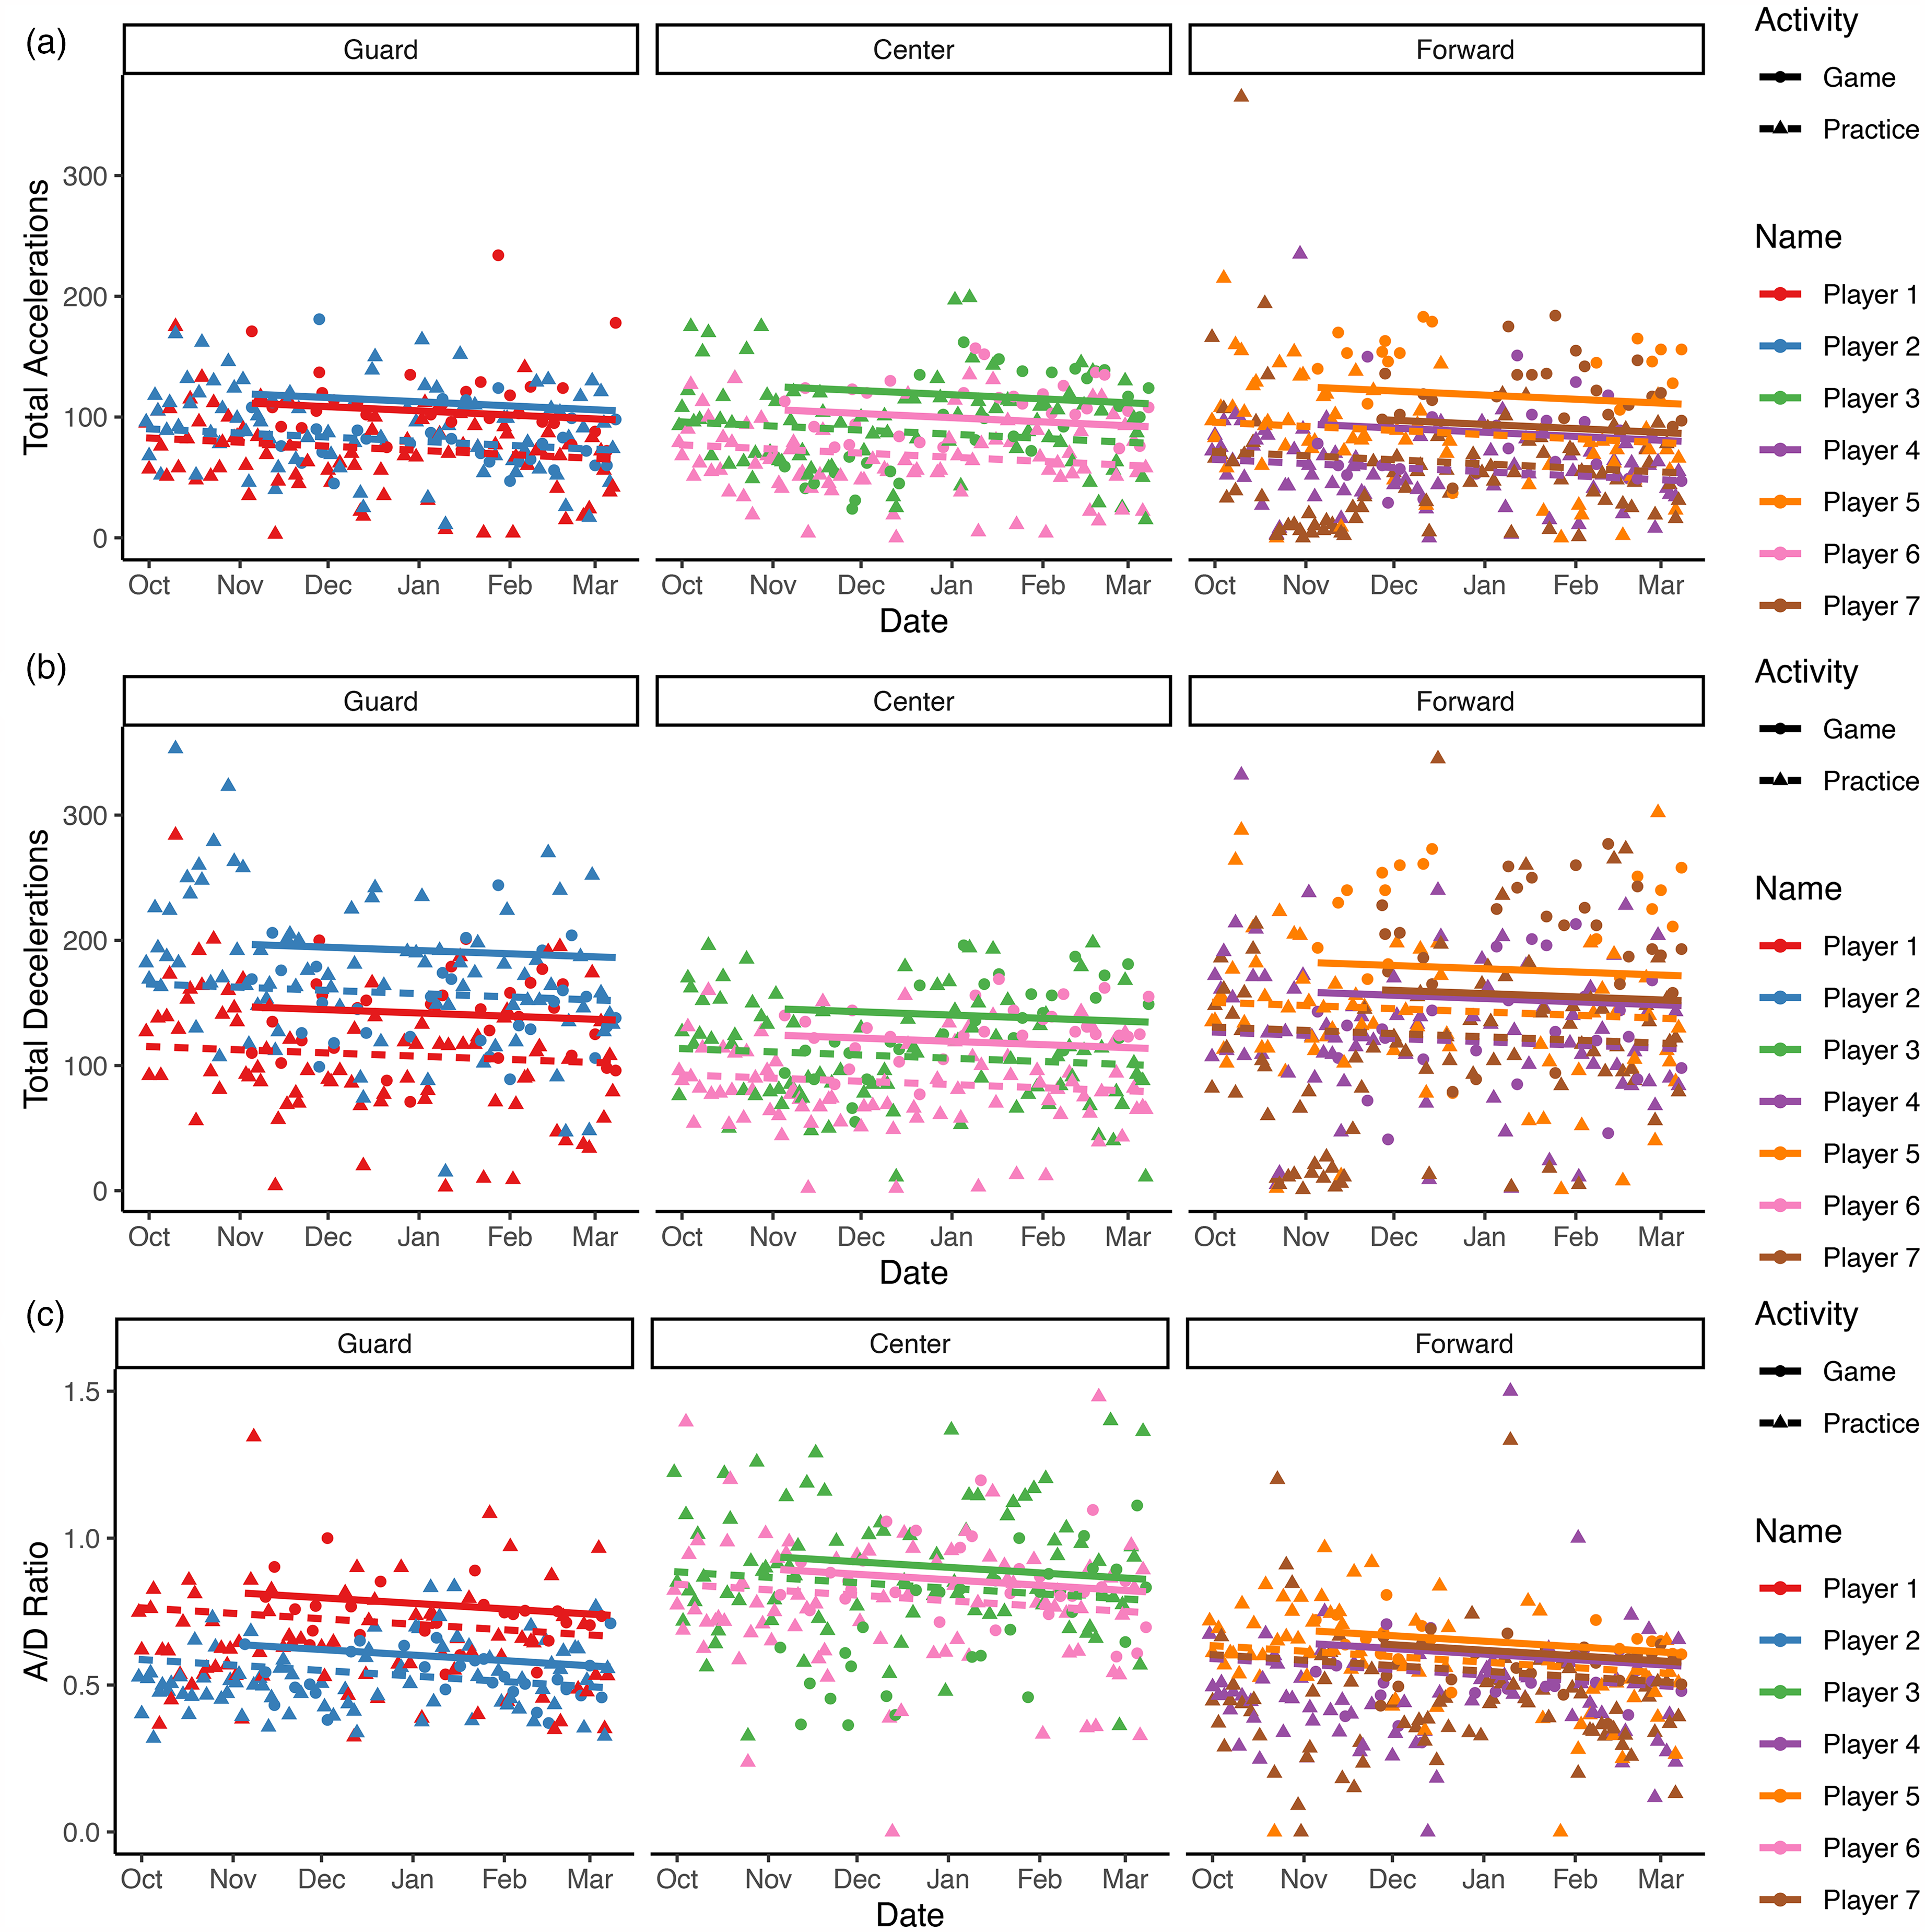
Acceleration (a) and deceleration (b) counts and AD Ratio (c) values by position and activity type. Players are represented for each of the three positions. Activity types are indicated as games (dot) and practice sessions (triangles). Regression lines show the activity type effects (fixed effects) and individual player effects (random intercepts).
Average (± SD) accelerations and decelerations (n) by playing position across the 2019–20 season.
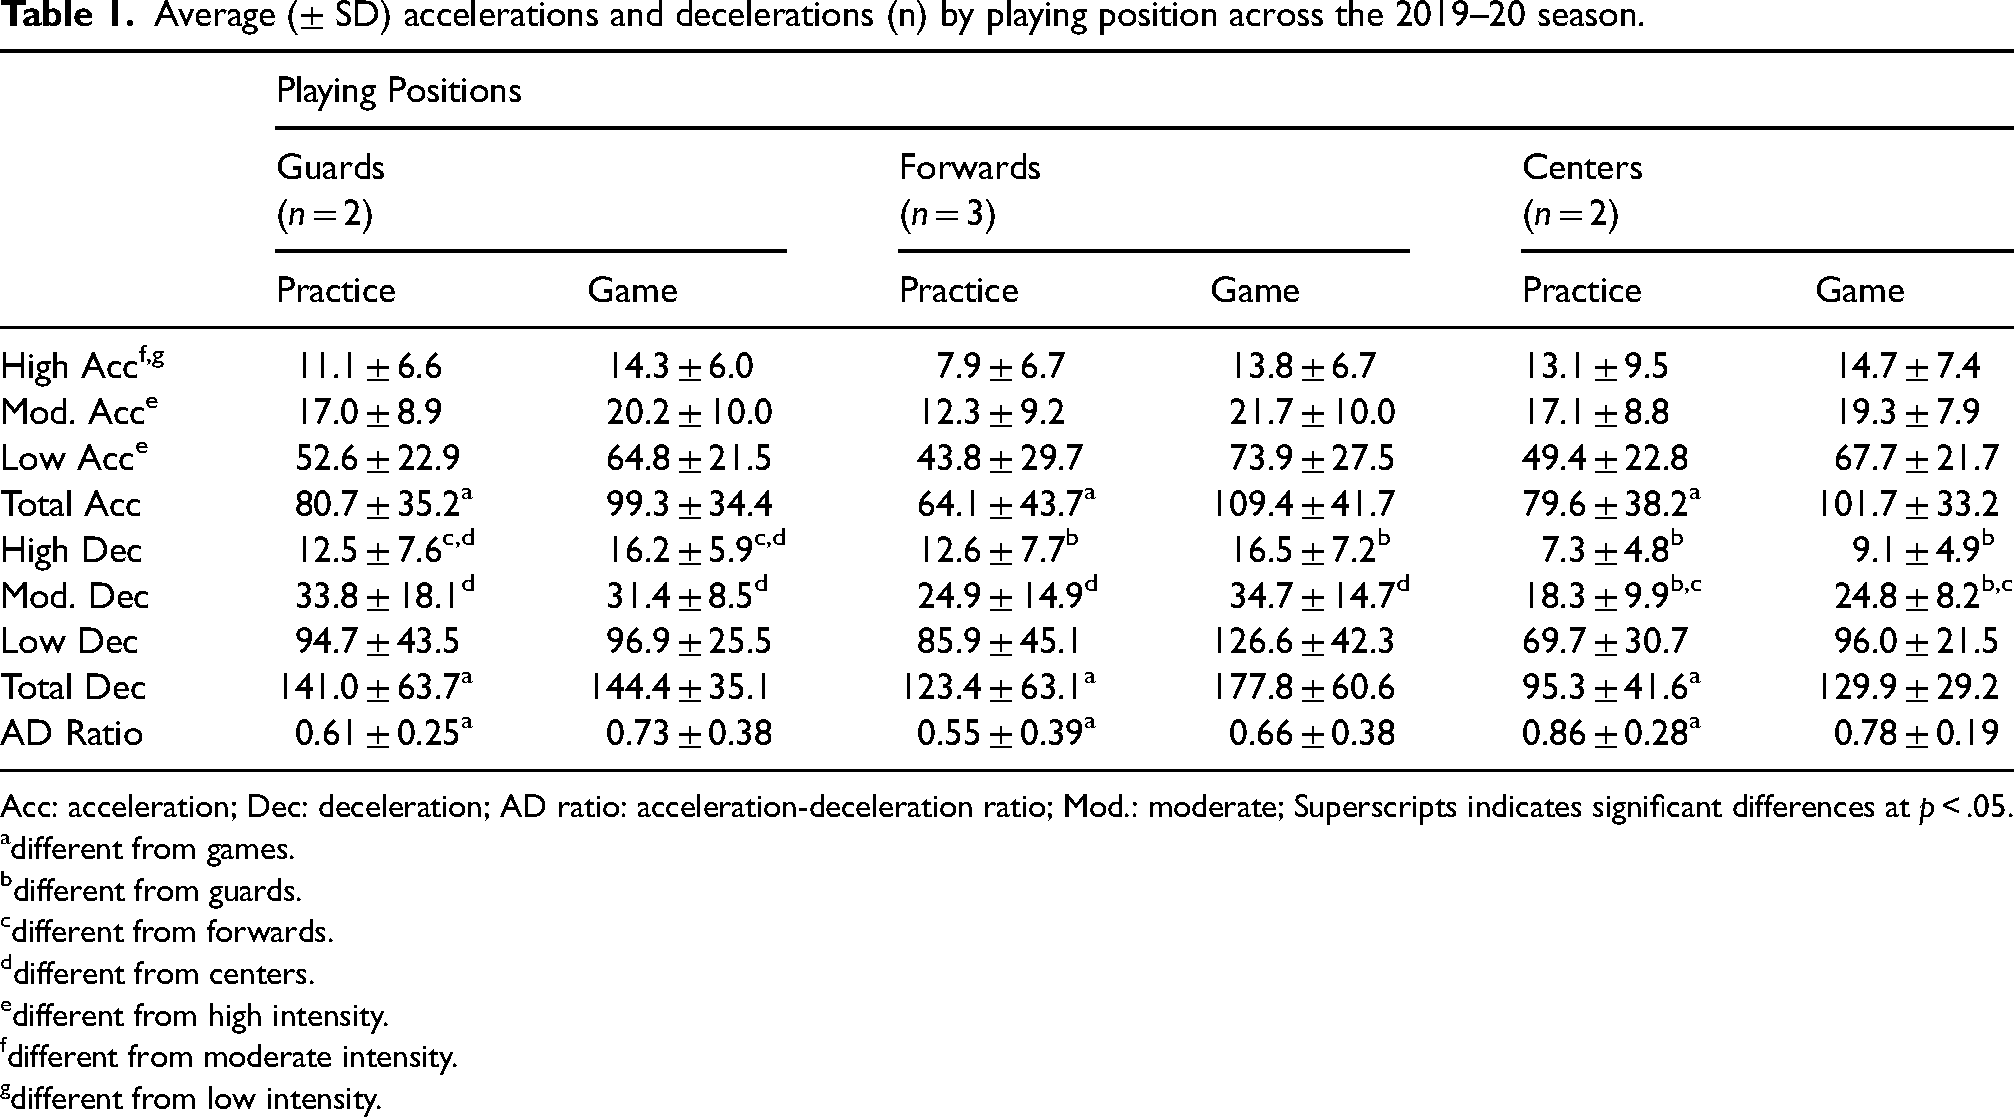
Acc: acceleration; Dec: deceleration; AD ratio: acceleration-deceleration ratio; Mod.: moderate; Superscripts indicates significant differences at p < .05.
different from games.
different from guards.
different from forwards.
different from centers.
different from high intensity.
different from moderate intensity.
different from low intensity.
The deceleration counts within intensity levels were also significantly different (p < .001). High decelerations were significantly lower than moderate and low decelerations (p < .001 and p < .001, respectively). Like the acceleration analyses, the low-intensity range accounted for a greater portion of the total decelerations. There was also a significant interaction effect for position and intensity. Guards had more moderate decelerations than centers and forwards (p < .05 and p < .05, respectively), and centers had fewer low decelerations than the other two positions (p < .01).
Fewer decelerations per intensity level occurred in practices when compared to games (p < .001). Like accelerations, the date had a significant influence on decelerations (p < .001), where the deceleration count per intensity decreased throughout the season (Figure 1(b)).
The accelerations and decelerations varied across the micro-cycle (Figure 3 in the Supplementary Material), with the highest counts achieved on game day. There are positional differences across the days on the various variables. Center players achieve high accelerations across the micro-cycle, close to game demands, but their deceleration demands seem lower across the week compared to other positions.
AD ratio
There was a main effect of activity type on AD ratios, which revealed that AD ratios at practices were 0.07 lower than the games (p < .05). The decrease indicated that games demanded more accelerations than decelerations compared to practices. There were significant differences in the AD ratio across the season, where the ratio decreased by 0.053 per 100 days (Figure 1(c); p < .05). These results highlighted a nonlinear relation involving changes in the number of accelerations and decelerations throughout the season, as well as differences between activity types. Although centers tended to have higher ratios than guards and forwards, there were no distinct positional differences found for the AD ratio, as the positional differences failed to meet the criteria for significance (p = .056). Figure 3 in the Supplementary Material shows the AD ratio across the micro-cycle and variation in positional demands. The AD ratios for guards and forwards are lower in practice sessions than game days. On the contrary, the center players demonstrate slightly higher AD ratios in practice than in games. However, there is variation in those ratios across the week.
Impact of playing minutes
There was no correlation between the AD ratio and playing minutes (r = −0.04, p = .12). This suggested that the ratio was relatively independent of a player's time on the court during a game.
Biomechanical load variability
The CV was used to assess the biomechanical load variability. The average seven-day CV for each position was: guards 63.8% (± 15.3), forwards 57.2% (± 19.9), and centers 83.4% (± 10.6), which fluctuated over the course of the season. There were no significant differences in biomechanical load variability among positions. There was a significant effect of the date on the load variability (p < .05), as the CV% decreased across the season across all positions by 0.043% (± 0.017) per day (Figure 2).
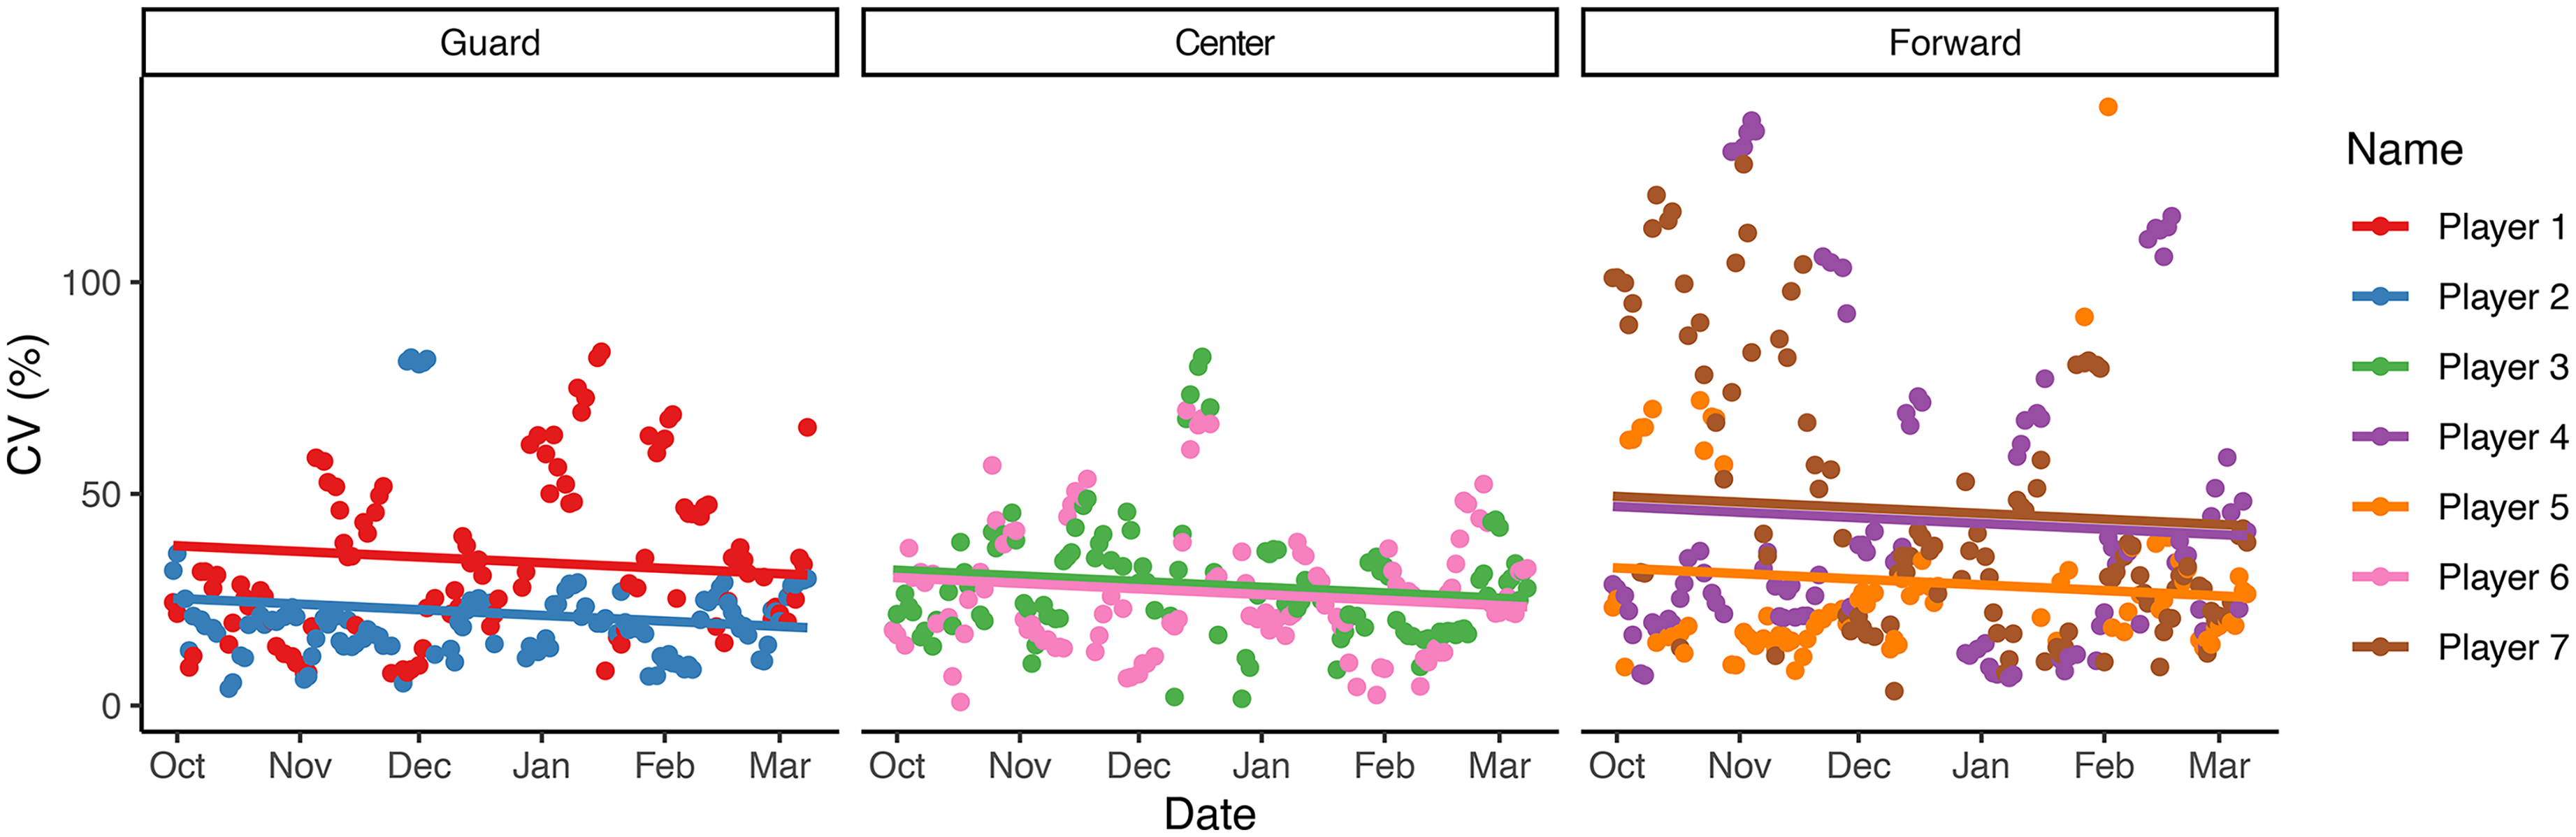
Rolling seven-day coefficient of variation (CV%) by position. Players are represented for each of the three positions. Regression lines show the individual player effects (random intercepts).
Discussion
The current study explored accelerations, decelerations, and the use of an AD ratio in basketball games and practices throughout a single season. Analyses revealed differences in accelerations and decelerations, AD ratio, the impact of playing minutes, differences between activity types, positional demands, and seasonal changes in the biomechanical load of trained, competitive male basketball players competing in an NCAA D-I conference. Ostensibly, this was the first study to report game and practice data from an entire season and to explore the ratio of accelerations to decelerations for elite male basketball players.
Accelerations and decelerations
The acceleration and deceleration analyses revealed that basketball players performed a majority of their activities at low intensity (1.5–2.5 m·s−2). During a basketball game, low intensity accelerations are prevalent when positioning around the basket and while guarding opposing players. 2 Additionally, there are numerous timeouts, throw-ins, and free throws — all of which slowed or stopped game play. These breaks in game play can cause the players to perform more low intensity accelerations until play begins again. All those in-game situations may introduce a relatively higher count of accelerations and decelerations at a lower intensity level. This uneven distribution of low and high ranges for both accelerations and decelerations characterize basketball's intermittent nature, as a player may be guarding an opponent until a steal is made, then in an instant, they are sprinting down the court on a fast-break in an attempt to score.
The high intensity range accounted for 14% and 9% of the total accelerations and decelerations, respectively. These proportions were less than the percentages of lower intensities. These findings aligned with results from Vazquez-Guerrero et al. highlighting the intermittent demands of low and high intensities during basketball. 25 Higher intensity levels are often associated with higher loads, 23 which may be susceptible to changes in a player's performance, hence the importance of monitoring the biomechanical load while accounting for the different intensities of accelerations and decelerations.
AD ratio
The AD ratio for all positions was below 1.0, indicating a greater proportion of decelerations compared to accelerations. In line with Vazquez-Guerrero et al., this emphasized the dominance of decelerating movements over accelerations in basketball across all positions. 20 Furthermore, no significant positional differences in the ratio were observed. However, the positional effect approached significance (p = .056), driven by the centers, who were trending to have higher AD ratios than the guards or forwards (0.77 vs. 0.61 and 0.66, respectively). Perimeter players (i.e., guards and forwards) tend to have a lower AD ratio than centers with a higher proportion of decelerations. 20 The incorporation of time, varying threshold ranges, and different counts (high vs. total) used in AD ratio calculations could influence the sensitivity in assessing positional differences and result in significant differences across positions previously. The number of decelerations was proportionally higher for centers than for perimeter players and may indicate different movement profiles across positions.
Throughout the season the AD ratio for each position was shown to contain variability. This variability can be viewed as functional variability, which was the result of variation in the training program. The longitudinal functional variability characterizes the intermittent nature of team sports, and it is beneficial for players as it allows them to adapt to the physical demands of basketball. A basketball season is high demanding with multiple games played in a week. A game can be preceded by a high load practice session with potentially positive effects on game load, 30 but is often followed by a recovery practice of a lower intensity. This variability in practice preparation and recovery will result in different acceleration demands across the week. However, this variability was stable across positions and the season. Although basketball is high-demanding in nature, the %CV indicated that there was variability in a seven-day period, which avoided monotony and allowed for biomechanical stimuli for physical adaptations.
Practice vs. game demands
The basketball players performed fewer accelerations and decelerations in practices than in games, regardless of intensity level. Accordingly, AD ratios in practices were lower than games, reflecting a proportionally greater unloading in accelerations than decelerations. Games, therefore, tended to demand higher external biomechanical and metabolic loads than practices. Although there were no significant positional differences, it is interesting to note that guards and forwards exhibited a higher ratio for games than practice, but the opposite pattern was observed for centers. Centers had a higher practice ratio than the game ratio, suggesting that during practice, centers may have been performing more accelerations relative to decelerations because of drills and conditioning.
Impact of playing minutes
The current study found that the AD ratio was unrelated to the number of playing minutes, indicating that the ratio was largely unaffected by the amount of playing time that a player received. Naturally, the frequencies of accelerations and decelerations accumulated by spending more time on the field or court. The AD ratio may be a time-independent metric for player performance evaluations as playing minutes did not affect the ratio. This time-independency allowed for player-to-player comparisons, and overall player development trends. This versatility highlighted that the AD ratio could be used in addition to the frequencies of accelerations and decelerations to capture the biomechanical demands of basketball.
Positional analysis
The basketball position significantly affected the number and intensity of decelerations, as centers performed fewer low intensity decelerations than forwards and guards. Centers are often the closest in proximity to the basket on either side of the floor, resulting in restricted movement patterns when close to the basket and large travel distances when transitioning from offense to defense. On defense, centers can be required to support their teammates, requiring a sudden change of direction and a hard stop to prevent incurring a foul. While on offense, they may perform sudden changes of direction to create space for a shot or another scoring opportunity. Guards and forwards may perform similar actions, but those positions are generally played in open court spaces, where less intense decelerations are needed.
Guards performed more moderate decelerations than the other two positions. Vásquez et al. found similar results for guards performing more high decelerations than centers and forwards, 25 and that high deceleration range (>2.0 m·s−2) closely overlapped with the current study's moderate range (2.5–3.5 m·s−2). Those findings suggested that the phenomenon may be a positional profile for guards independent of playstyle and teams involved in the studies. Generally, guards are responsible for dribbling the ball up the court and may perform sudden stops to create space from a defender. Those actions of creating space can be performed regardless of activity and are universal across basketball, which would explain the difference between the other two positions and the commonality between the studies. These results emphasized the positional roles influence on decelerations.
Seasonal change and variability
Accelerations and decelerations decreased significantly with time, with the magnitude of decrease in the decelerations being slightly greater. The AD ratio also decreased across the season, which aligned with a slightly greater decrease in deceleration counts. This could be a potential indicator of fatigue across the season. Similar results were found at the game level, where the ratio was previously shown to vary between the quarters of the game and the two halves.15,17 Seasonal AD ratio decreases of 0.053 per 100 days may not be meaningful for daily practice, as it will likely within the daily and weekly variation of accelerations, but the seasonal change in aggregate may be a valuable and discriminatory monitoring metric to assess a team's ability to maintain mechanical patterns.
Limitations and future research
While the current study provided valuable insights into performances of elite-level NCAA basketball team members, it was limited in its size and the generalizability of results. The observations were restricted to the most active players within the roster to impose homogeneity in the practice and game demands experienced by the subjects, which resulted in a small sample size. However, the small sample size did allow for an individualized approach to positional analyses. The positional analyses treated the individualized trends as random effects to allow for a more representative view of the role, a team or position is only as good as the weakest player. The results are hard to extrapolate to the inactive players on the roster due to the individualized game and practice data. Nonetheless, we observed that the AD ratio trends were independent of playing minutes within games, suggesting that future investigations that include players without substantial game time may be less biased than initially assumed. Future research warrants the inclusion of more players either by including the non-starting players or more starting players from previous years. Given the nature of a basketball team having a small number of players on the roster (i.e., 12 players in the NCAA) a large sample size would require including multiple teams. Additionally, exploration of AD ratios using different intensity levels may improve sensitivity. Lastly, further longitudinal research and individual athlete analyses may provide more granular information on micro-cycle periodization.
Conclusion
This study investigated accelerations, decelerations, and the AD ratio of an NCAA D-I basketball team including games and practices through an entire season. Analyses revealed a prevalence of accelerations and decelerations at a low intensity and distinct positional profiles for decelerations, showed changes in accelerations and decelerations between games and practices, and provided insights into the day-to-day variation present within the AD ratio. The AD ratio is a novel load monitoring metric that had previously shown sensitivity within games and between genders.15,17,26 The current study augmented that knowledge by demonstrating that the AD ratio was higher for games than practices in elite-level collegiate players and that it slightly decreased over a season. Although positional differences were detected on low and moderate decelerations, this was, however, not reflected in the AD ratio. Basketball is characterized for accelerations and decelerations at varying intensities, and the AD ratio in basketball demonstrated a dominance of decelerations over accelerations, but this is proportionately different in games and practices.
Supplemental Material
sj-docx-1-spo-10.1177_17479541251333947 - Supplemental material for Seasonal variation of accelerations and decelerations by position in male basketball
Supplemental material, sj-docx-1-spo-10.1177_17479541251333947 for Seasonal variation of accelerations and decelerations by position in male basketball by Baylee Stoneman, Sigrid BH Olthof, Geoffrey T Burns, Alex Wong and Ronald F Zernicke in International Journal of Sports Science & Coaching
Footnotes
Acknowledgements
The authors thank the university's men's basketball players and staff for their participation in this study.
Declaration of conflicting interests
The authors declared no potential conflicts of interest with respect to the research, authorship, and/or publication of this article.
Funding
The authors received no financial support for the research, authorship, and/or publication of this article.
Supplemental material
Supplemental material for this article is available online.
References
Supplementary Material
Please find the following supplemental material available below.
For Open Access articles published under a Creative Commons License, all supplemental material carries the same license as the article it is associated with.
For non-Open Access articles published, all supplemental material carries a non-exclusive license, and permission requests for re-use of supplemental material or any part of supplemental material shall be sent directly to the copyright owner as specified in the copyright notice associated with the article.