
Abstract
Surfboards are a critical component of surfing performance, yet the relationship between a surfer's anthropometric profile and their surfboard dimensions, as well as the factors influencing surfers’ decision-making around surfboard design and selection within competition, remains unexplored. Forty-two competitive surfers participated in this study. Of the forty-two surfers, the anthropometric profile of twenty-eight females (n = 12) and males (n = 16) was determined (i.e., height, body mass, arm span, body composition), while thirty-one females (n = 15) and males (n = 16) completed a survey to determine their decision-making towards surfboard design and selection within competition. The results demonstrated fewer significant correlations between the anthropometric profiles and surfboard dimensions of female surfers than male surfers and the anthropometric profiles of female surfers explained less variance in their surfboard dimensions compared to male surfers. Fat mass measures contributed more to the variance in female surfers’ surfboard dimensions, whereas lean mass measures contributed more to the variance for male surfers. Survey results also determined that female surfers rated the factors informing their decision-making around surfboard design and selection as less influential compared to male surfers. These findings highlight notable sex-related differences in the relationship between surfers’ anthropometric profile and their competition surfboards, as well as their decision-making processes. Increased exposure and experimentation with surfboard design could benefit female surfers and advance their performance in the sport alongside their male counterparts.
Introduction
The surfboard manufacturing industry has evolved in parallel with the growth of participation in both recreational and competitive surfing.1,2 Research has contributed to this evolution by exploring optimal construction techniques, fin designs, and hydrodynamics, providing valuable insights into improving surfboard performance.3–7 However, these studies often overlook the involvement of the surfboard rider (i.e., surfer), despite the symbiotic relationship between the surfboard and its rider being critical for key performance elements such as efficient paddling, smooth transition into standing, and successful wave-riding. 8
Achieving optimal synergy between surfer and surfboard requires shapers to tailor dimensions – such as volume, length, width, and thickness – based on individual factors such as body composition, wave preferences, skill level, and competitive goals.4,9,10 Warren (2012) 2 describes surfboard design as a meticulous, knowledge-intensive process, developed through close relationships between shaper and surfer. Despite the importance of this, there is limited literature exploring the interaction between a surfboard and its owner.11,12
Shan (2023) 13 highlights that a tightly coupled connection between an athlete's anthropometric profile and their equipment is crucial for success. In cycling, Holliday and Swart (2021) 14 demonstrated that bike seat height must be tailored to an individual's leg length to enhance performance and prevent injury. Similarly, selecting the appropriate racket size for youths in tennis is dependent on their anthropometry and strength considering that improper sizing affected accuracy and speed. 15 As surfboard design is largely empirical, this level of anthropometric and equipment coupling may not yet be as developed as other sports. Given the pivotal role of surfboards in maximising surfing performance, advancing knowledge of this relationship could significantly enhance a surfer's potential. 9
Despite industry recognition that body mass, height, and skill level are largely critical for determining surfboard dimensions,9,10 particularly volume and length, limited scientific research has explored the interaction between surfers and their surfboards. Heavier surfers require more volume for buoyancy, and elite surfers prefer lower-volume surfboards for increased manoeuvrability. Lower-volume surfboards enable surfers to execute more advanced manoeuvres and achieve higher scores, however, they require greater physical effort to generate speed during paddling and wave-riding.16,17 No comprehensive analysis has yet quantified the relationship between a surfer's anthropometric profile and their surfboard dimensions, underscoring the need for further investigation.
Importantly, surfing has been described as a traditionally male dominated sport 18 that has likely fostered male-specific exploration and experience with surfboard design and performance optimisation.19,20 Considering this, it is reasonable to assume that female surfers have had limited exposure to surfboard design in comparison, likely possessing less experience with the optimisation of surfboards for their bodies within the natural environment.19,21 While male surfers will continue to benefit from ongoing exploration of surfboard design, this disparity in exposure presents an opportunity for a greater positive impact for female surfers by encouraging them to become more engaged and knowledgeable in the surfboard design process.
Optimal surfboard design and selection is also dependent on the weather and wave conditions within each competition (i.e., selection). This involves further critical decision-making by the surfer and little is known about what informs this process. The fundamental objective of surfboard design is to relate shape to purpose, 8 and lacking an understanding of the optimal surfboard for the conditions may adversely impact performance. 22 Whether the comparative lack of exposure for female surfers in surfing and surfboard design causes a lesser understanding within this selection process remains to be investigated yet prompts the need for a more comprehensive understanding of the decision-making processes surrounding surfboard design and selection in all surfers. The current study aimed to contribute scientific insights that could enhance surfboard design and shaping by quantifying the relationship between a surfer's anthropometric profile and surfboard dimensions, as well as conducting a survey to evaluate which factors are most influential on a surfer's surfboard selection. Integrating empirical and scientific methods could stimulate discussions on optimising surfboard performance and provide greater opportunities and knowledge for the entire surfing community. The aims of this study were to: (i) investigate the anthropometric profiles of competitive female and male surfers, (ii) examine the relationship between a surfer's anthropometric profile and their competition surfboard dimensions, (iii) identify the factors influencing decision-making in surfboard design and selection for competition, and (iv) determine if sex disparities exist in the relationships among anthropometric profile, surfboard dimension, and decision-making around surfboard design to optimize performance in both female and male surfers.
Methods and materials
Research design
A mixed methods approach was adopted for this study which involved correlation and regression analyses between surfers’ anthropometric profile variables and their surfboard dimensions alongside a survey analysis of the decision-making processes in surfers’ equipment choices. The surfers’ body composition was assessed by Dual-Energy X-ray Absorptiometry (DXA) and measurements to determine their anthropometry were taken, collectively describing their anthropometric profile. Subsequently, participants provided the dimensions (length, width, thickness (inches), and volume (L)) of the surfboard they most commonly use(d) in competitions that comprised a ‘thruster’ (three) fin configuration (Figure 1). The survey was designed to identify the factors that most influence competitive surfers’ decision-making around their surfboard ‘design’ and ‘selection’ within competitive settings. The survey was completed individually either in person at the Surfing Australia High Performance Centre or online via secure survey software, REDCap (v14.1.2, Vanderbilt University, TN).
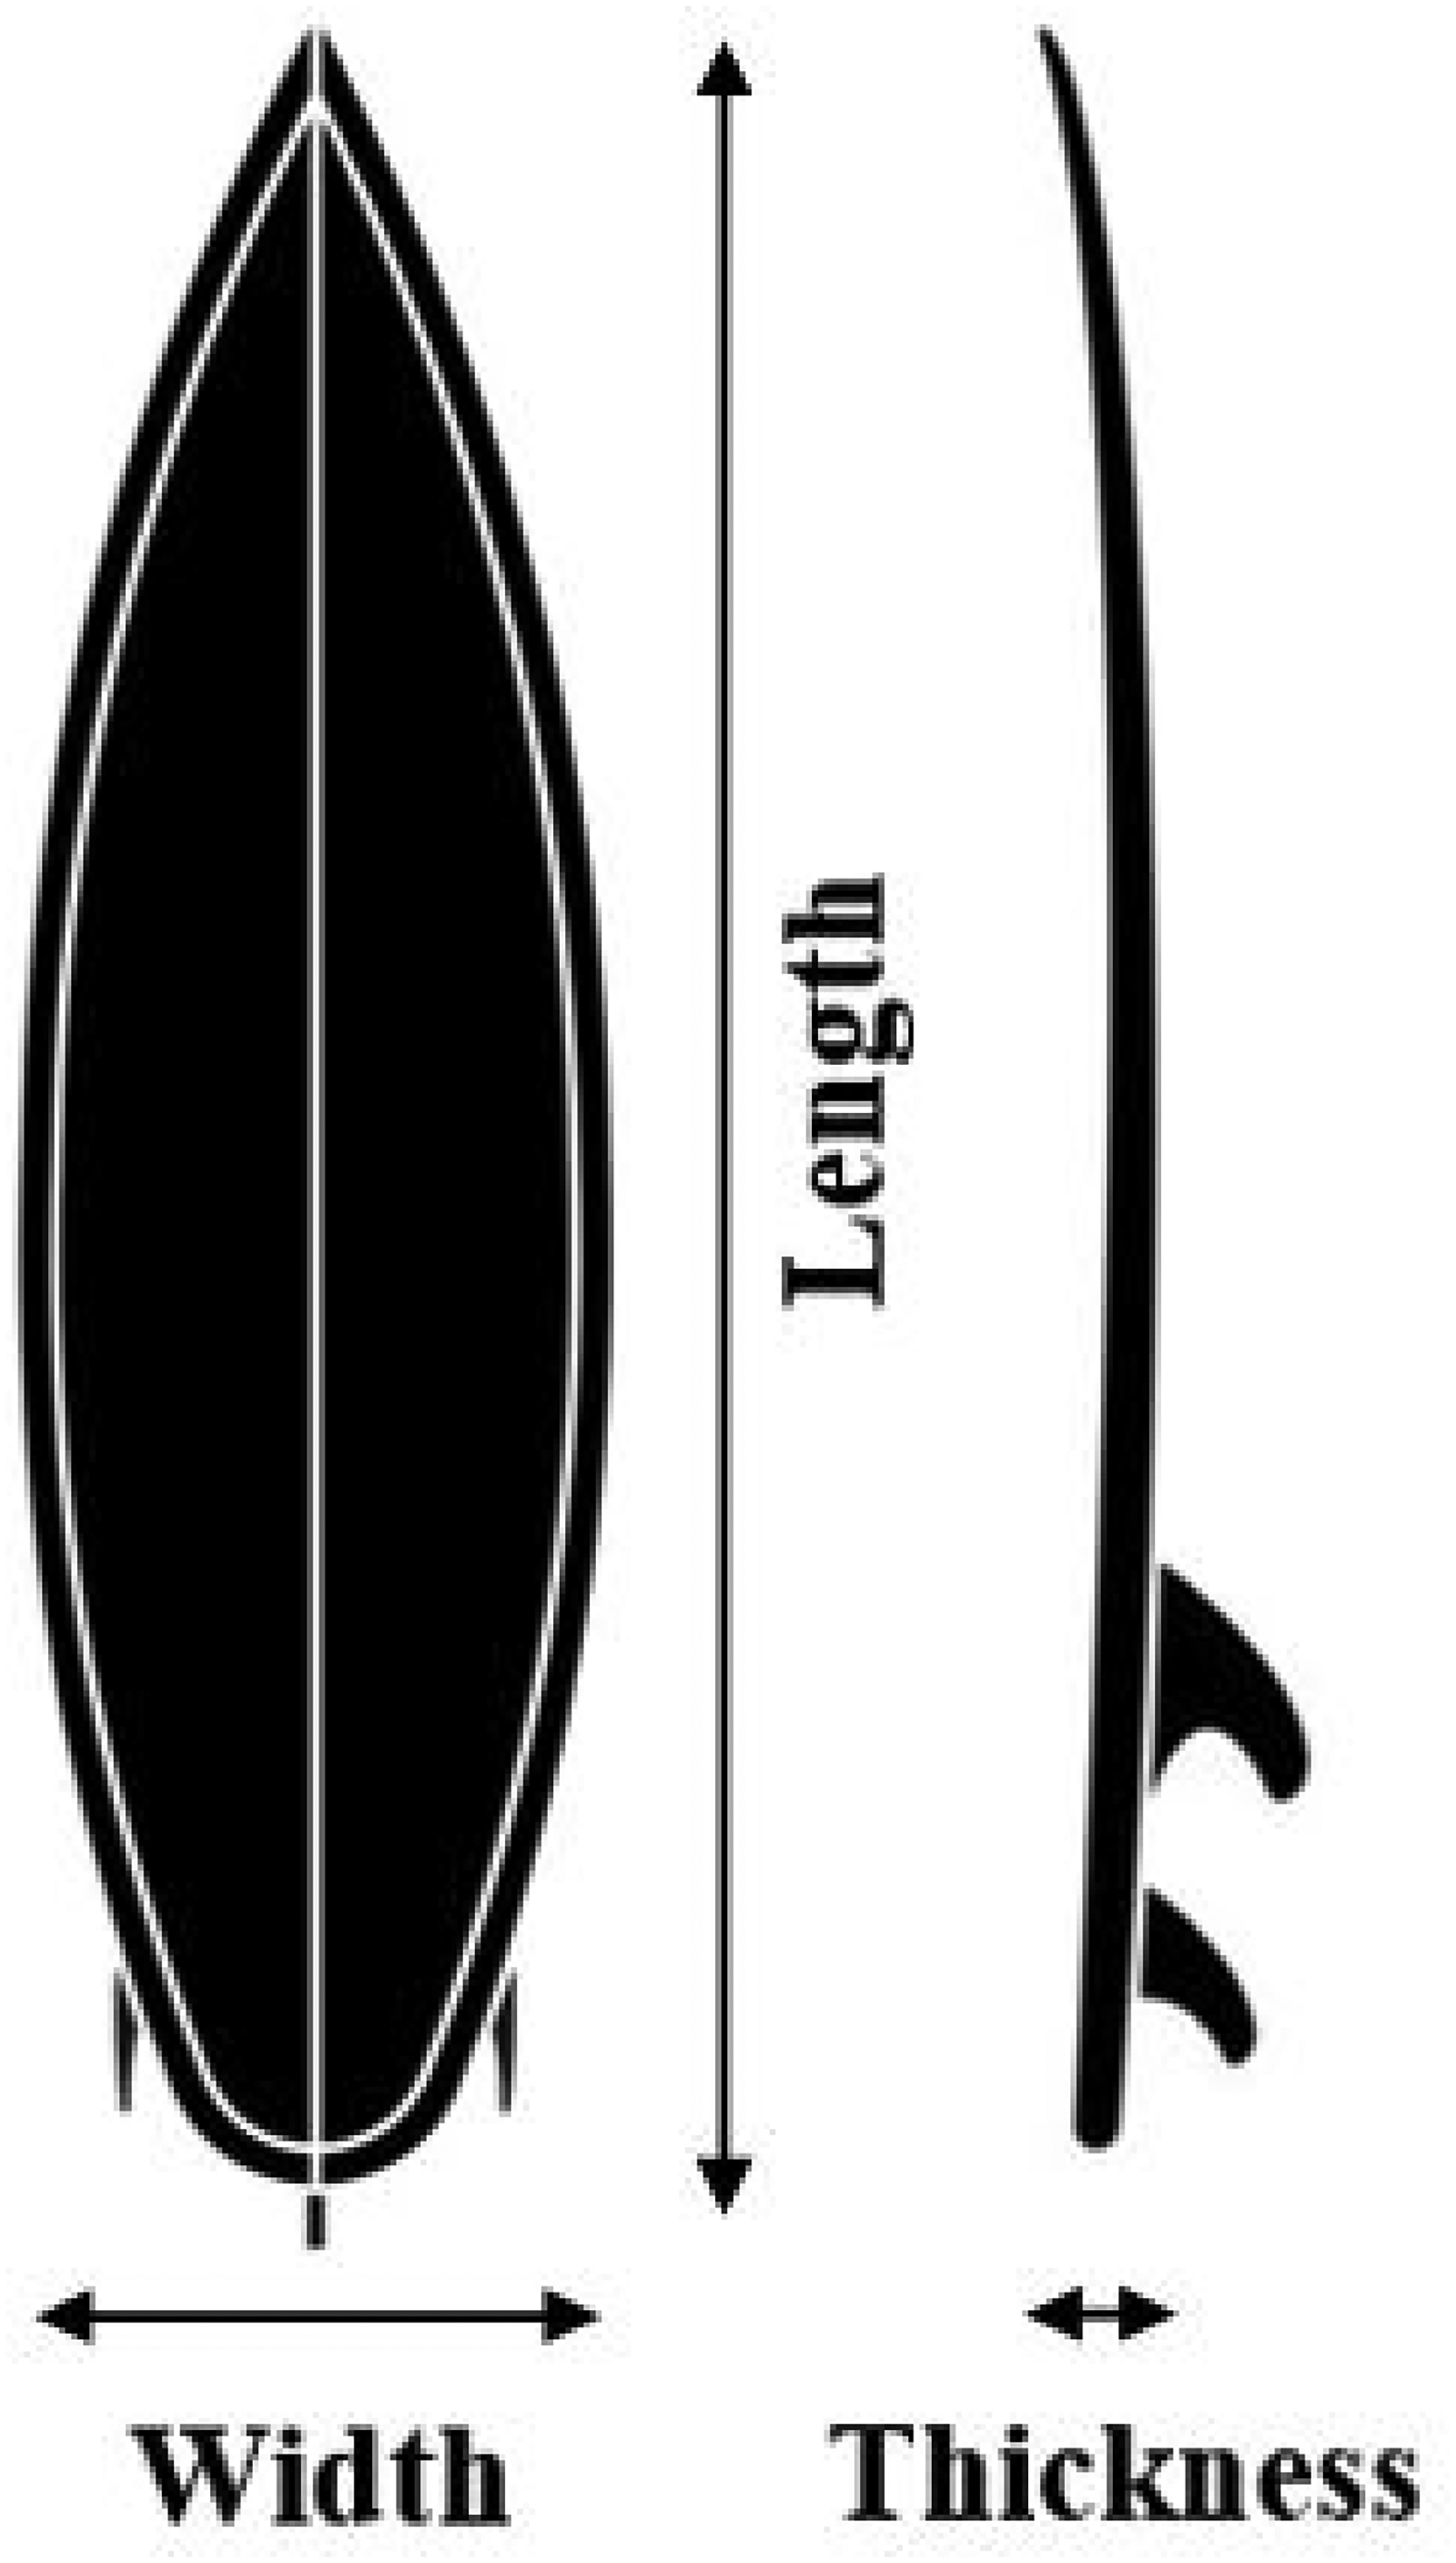
Basic surfboard dimensions. The ‘thickness’ value is recorded as the thickest part of the surfboard. Surfboard volume is the fourth dimension and represents the overall volume of the surfboard (length×width×thickness), but further depends on the thickness distribution and type of construction material.
Participants
Forty-two competitive surfers volunteered to participate in this study (Figure 2). Of the forty-two surfers, the anthropometric profile of twenty-eight female (n = 12) and male (n = 16) surfers was determined, and thirty-one female (n = 15) and male (n = 16) surfers completed the survey designed to assess decision-making towards surfboard ‘design’ and ‘selection’. All surfers were classified as ‘highly trained/national level’, ‘elite/international level’ or ‘world class’ according to McKay et al. (2021) 23 and had competed in the World Surf League (WSL) Pro Junior, Qualifying Series, Challenger Series, or Championship Tour circuits within 12 months of the present study. Participants were recruited via purposive sampling through word-of-mouth within the Surfing Australia High Performance Centre and coaching and performance support staff networks. The Griffith University Human Research Ethics Committee approved this study (Ref. 2022/175) and written informed consent was obtained from each participant prior to data collection.
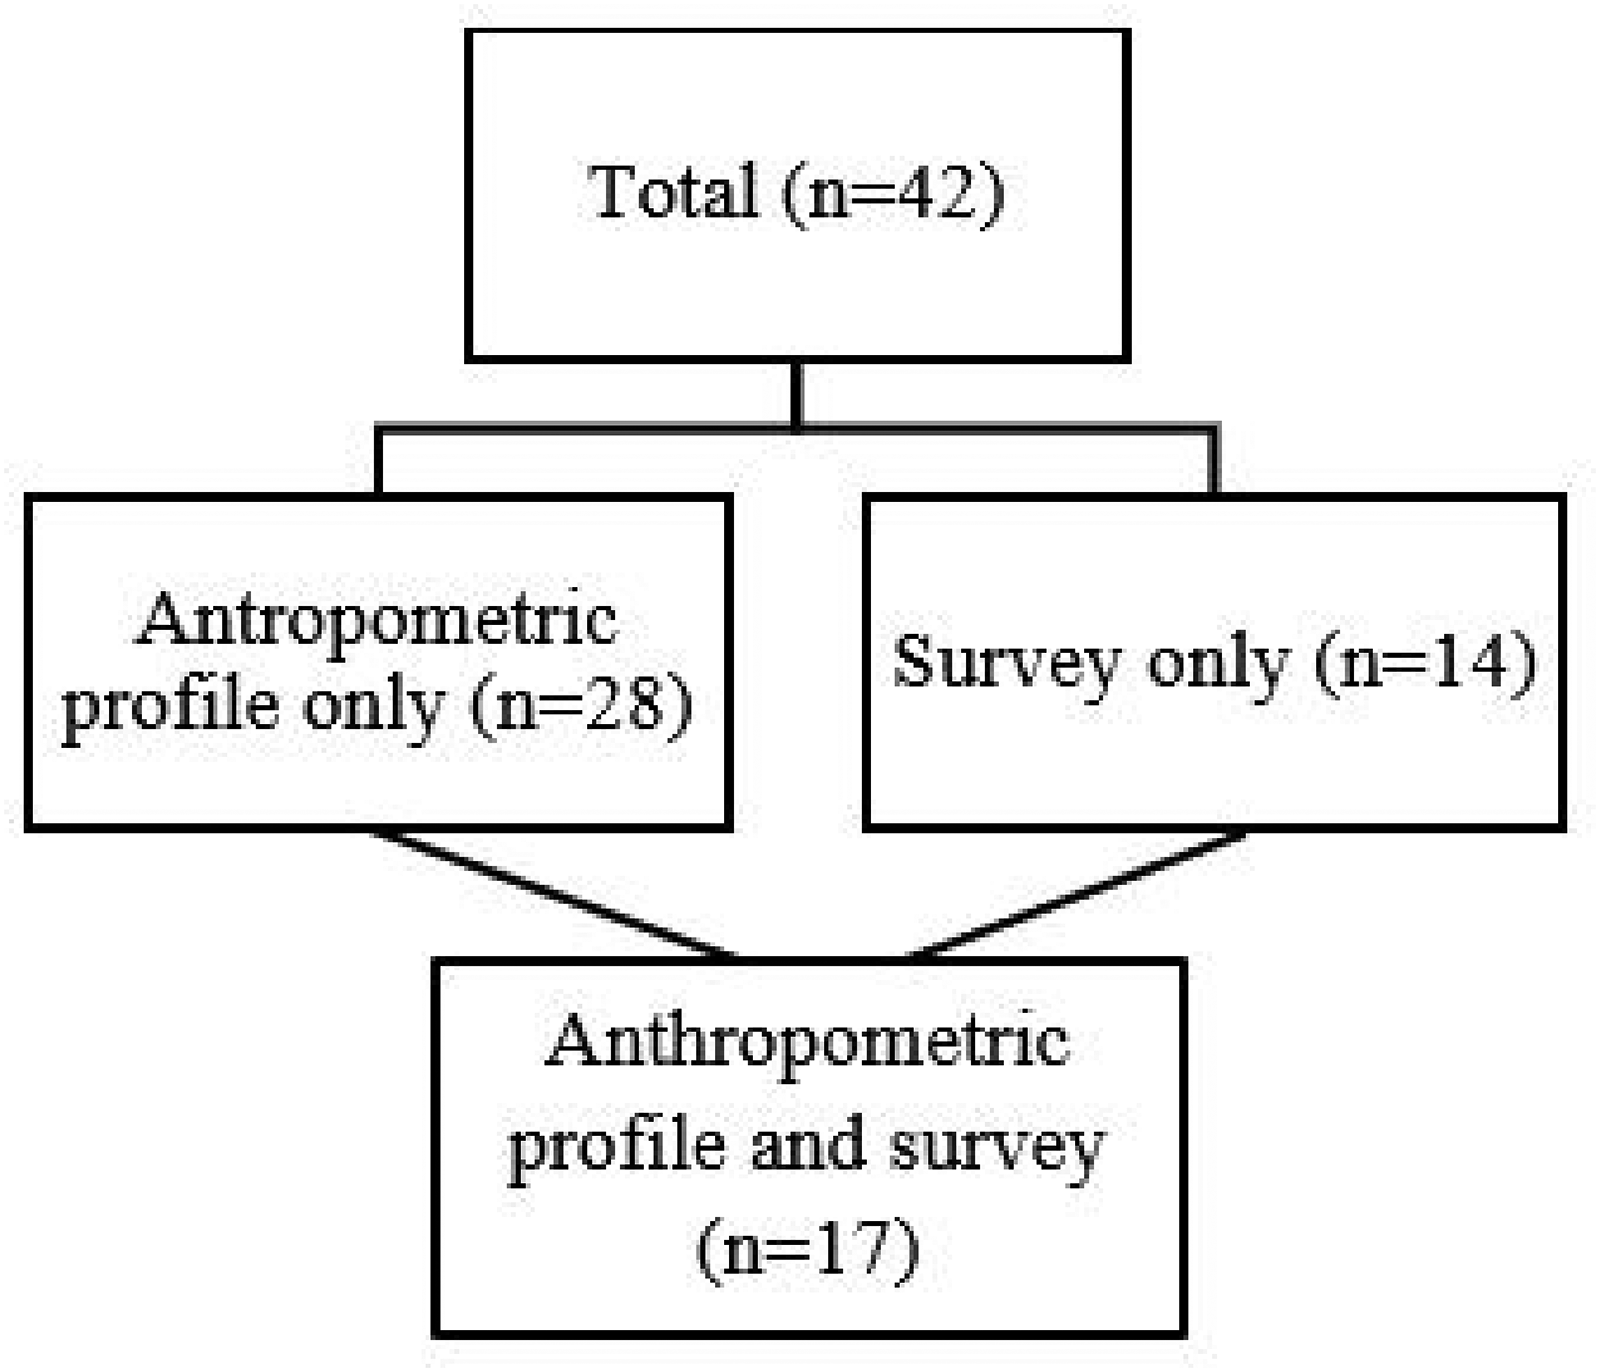
The number of surfers that completed each section of the present study's protocols.
Anthropometric profile: Anthropometry and body composition
Height was measured to the nearest 0.01-m using a wall-mounted stadiometer, body mass was measured to the nearest 0.01-kg using electronic weighing scales, and arm span was measured to the nearest 0.01-m using a standardised wall-mounted arm span chart. The ratio of the surfer's arm span with respect to their height was subsequently calculated. 24 All measurement protocols were in accordance with the International Society for the Advancement of Kinanthropometry's (ISAK) guidelines and protocols. 25
A Norland Elite Swissray bone densitometer (Swissray, Swissray International Inc., Taiwan) was used to determine the body composition of the surfers. To ensure acquisition uniformity, a single, certified technician executed the testing following the manufacturer's guidelines. 26 Preceding the scan, each surfer was required to fast for at least 8-h, consume 250-mL of water 1-h before the scan, and void their bladder upon arrival for hydration status to be obtained. Surfers removed jewellery and wore minimal clothing with no metal. They were positioned supine on the scanner and a standardised position was maintained, whereby their elbows were fully extended and the carpometacarpal joint was situated away from the body at a distance equal to three lengths of the participant's first digit. Tibiotalar joints were positioned shoulder-width apart and inverted. Subsequently, the surfers total and segmented (i.e., torso, upper limb, and lower limb) body composition variables were reported. Total and segmented body composition variables consisted of fat mass (FM), lean mass (LM), and bone mineral density (BMD). Fat mass percentage (FM %) and LM percentage (LM %) alongside ratios such as LM:FM, upper-body to lower-body (UB:LB) FM and UB:LB LM were also reported.
Surfboard survey
The survey consisted of questions disclosing competitive history followed by close-ended questions with rating responses whereby a 0–10 numeric rating scale (NRS) was utilised. The competitive history questions captured the number of years the surfer had surfed competitively on the WSL, the number of years working with their current shaper, and the number of times they have changed shapers in their competitive career. The NRS questions quantified the extent to which the surfers considered various factors (specified within the survey) as influential in their decision-making processes regarding surfboard design (i.e., ‘design’ subsection) and selection within the competitive context (i.e., ‘selection’ subsection). 0 referred to ‘not influential at all’ and 10 referred to ‘extremely influential’. A mean value was determined for each factor, enabling a comparison of their influence on the surfer's decision-making process. Additionally, the surfers were asked to ‘rate your own knowledge of surfboard design and shaping when ordering a board for yourself’ where ‘0’ referred to ‘I rely completely on my shaper’ and ‘10’ referred to ‘I rely completely on my own knowledge’. The survey was developed and piloted with three nationally identified surfing coaches with an average of 7.3-yr of international competitive experience. The authors also established inter-day retest reliability of the NRS questions on a small cohort of junior competitive surfers (n = 5).
Statistical analysis
R Studio statistical software (v R-4.2.1, Posit, Massachusetts) was utilised for all statistical analyses. Descriptive statistics of mean and standard deviation (SD) were employed for all anthropometric profile variables, surfboard dimensions, and survey responses, separated by sex. All surfboard dimensions were converted into the metric system and a Shapiro-Wilk normality test ascertained normal distribution of all variables. Where normal distribution was observed, significant sex-related differences of all anthropometric profile variables, surfboard dimensions, and survey responses were determined by means of t-tests for independent samples with statistical significance defined as p ≤ .05. In instances of non-normal distribution, a Mann-Whitney U test was employed (p ≤ .05). 27
Correlations were performed between all anthropometric profile variables and surfboard dimensions for female and male surfers separately where Pearson's correlation coefficients (r) and p values were reported. Spearman's correlation coefficients (r) were reported in instances of non-normal distribution. Correlation coefficients were interpreted as negligible (r 0–0.1), weak (r 0.1–0.4), moderate (r 0.4–0.7), strong (r 0.7–0.9), or very strong (r 0.9–1). 27 Given the exploratory nature of this study and small sample sizes, no post-hoc corrections were applied. While these corrections control for Type I errors, they can be overly conservative, missing meaningful relationships and limiting the interpretation of trends in this novel context.
Subsequently, all anthropometric variables were scaled and a multiple linear regression analysis was employed to identify the anthropometric variables most influential on each surfboard dimension. Due to significant differences between female and male surfers’ surfboard dimensions, the sexes were examined independently within the linear regression analyses. The models were fitted using the “lm()” function where a forward selection method was utilised. Initial variables were selected based on correlation results, followed by an iterative process of model refinement through removal of variables with high collinearity, determined by a variance inflation factor of >5, and added if they improved model fit and explanatory power (i.e., adjusted R2). Assumptions of linearity and normality were confirmed and the determined adjusted R2 coefficients were recorded for each surfboard dimension and sex. The “beta.lm” package was used to assess the variable contributions within each model by determining standardised model estimates (i.e., beta coefficients).
Results
Anthropometric profiles of female and male surfers
Tables 1 and 2 depict the descriptive statistics of the anthropometric profiles of female and male surfers, while Table 3 demonstrates the descriptive statistics of their surfboard dimensions. Female surfers were significantly shorter and lighter with a shorter arm span, and exhibited significantly lower LM and BMD values, and higher FM values compared to male surfers (Tables 1 and 2).
Total body anthropometric profile variables (mean ± SD) reported by sex, including upper body (UB) and lower body (LB) ratios.
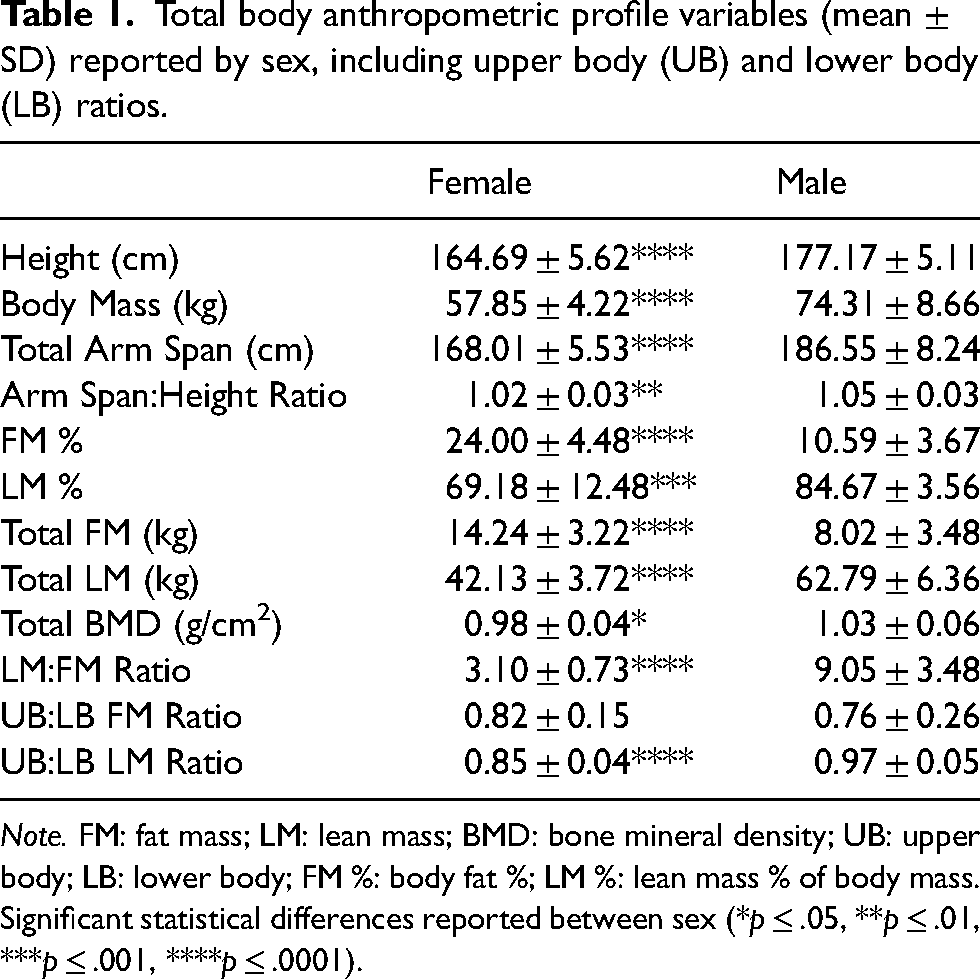
Note. FM: fat mass; LM: lean mass; BMD: bone mineral density; UB: upper body; LB: lower body; FM %: body fat %; LM %: lean mass % of body mass. Significant statistical differences reported between sex (*p ≤ .05, **p ≤ .01, ***p ≤ .001, ****p ≤ .0001).
Segmented body anthropometric profile variables (mean ± SD) reported by sex.
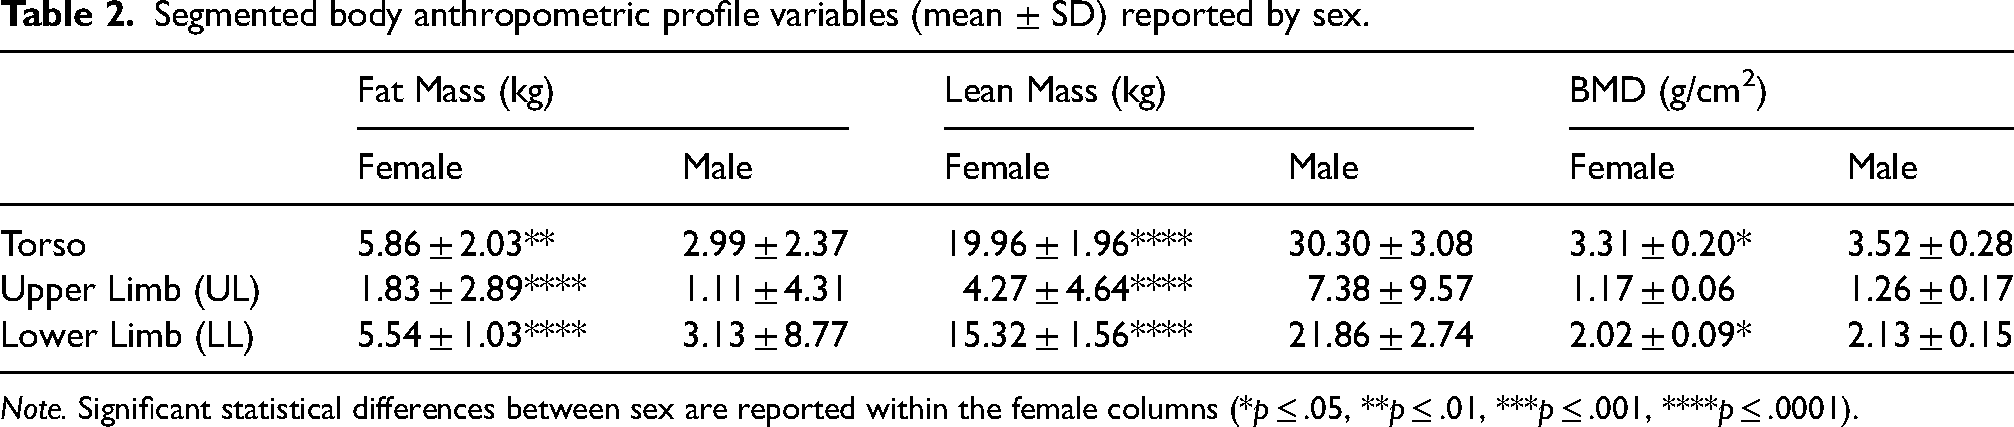
Note. Significant statistical differences between sex are reported within the female columns (*p ≤ .05, **p ≤ .01, ***p ≤ .001, ****p ≤ .0001).
Surfboard dimensions (mean ± SD) reported by sex.
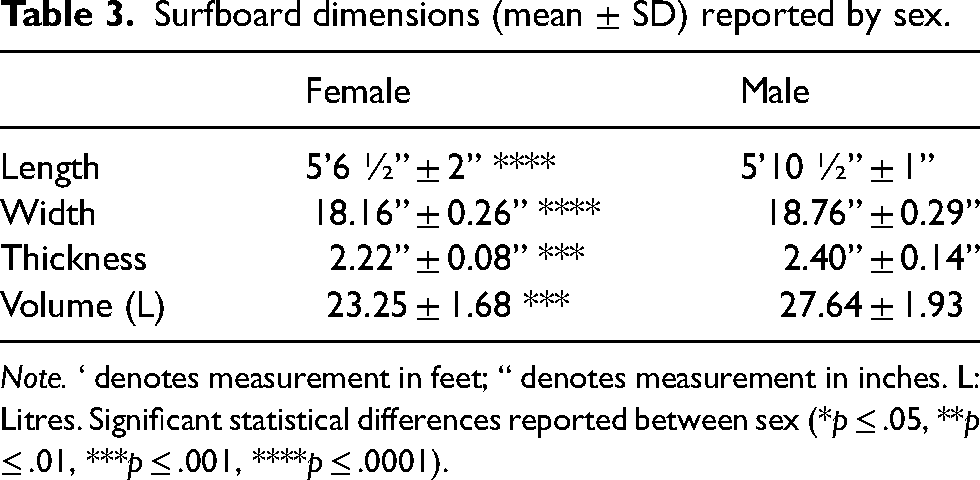
Note. ‘ denotes measurement in feet; “ denotes measurement in inches. L: Litres. Significant statistical differences reported between sex (*p ≤ .05, **p ≤ .01, ***p ≤ .001, ****p ≤ .0001).
Correlation analysis between anthropometric profile variables and surfboard dimensions
There were fewer significant correlations between anthropometric profile variables (n = 21) and surfboard dimensions in female compared to male surfers. Four of the 21 anthropometric profile variables correlated to surfboard volume, three with surfboard length, three with surfboard width, and two with surfboard thickness in female surfers (Table 4). Thirteen of the 21 anthropometric profile variables correlated with surfboard volume, eight with surfboard length, nine with surfboard width, and six with surfboard thickness in male surfers (Table 4). All significant correlations demonstrated a magnitude classified as moderate, strong or very strong. Additionally, male surfers had a greater frequency of correlation coefficients that were considered strong or very strong for all surfboard dimensions compared to females.
Significant correlations between anthropometric profile variables and surfboard dimensions, separated by sex and reported by greatest to least correlation coefficient (r).
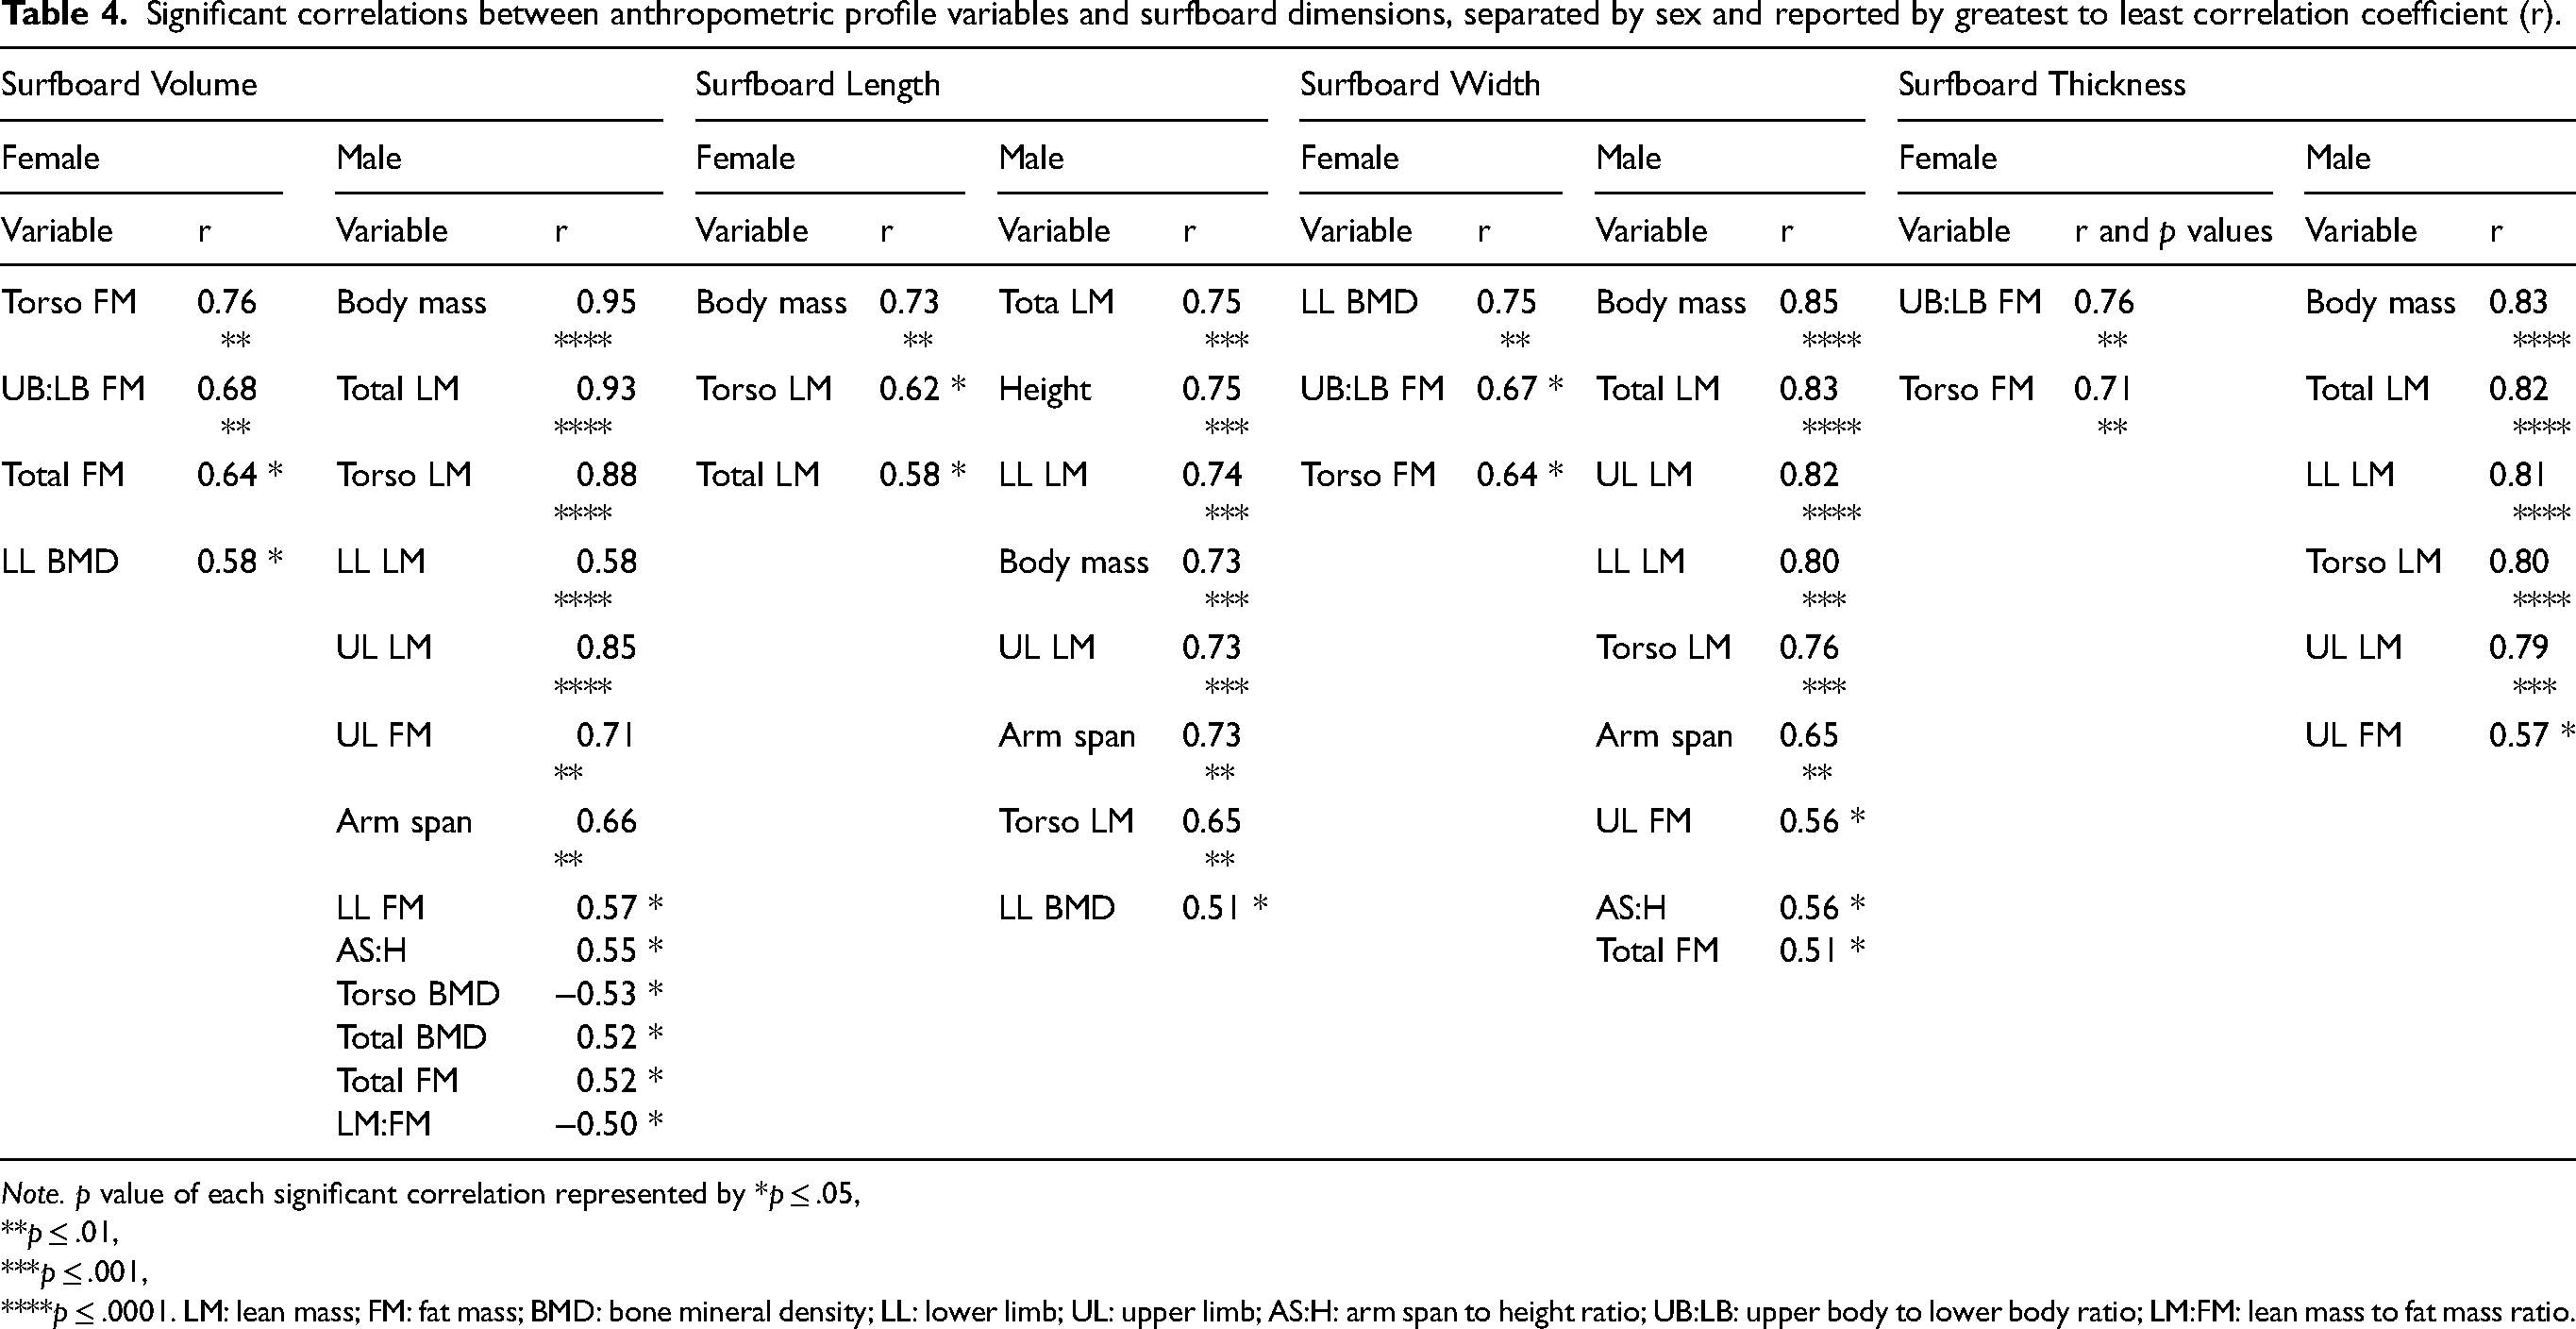
Note. p value of each significant correlation represented by *p ≤ .05, **p ≤ .01, ***p ≤ .001, ****p ≤ .0001. LM: lean mass; FM: fat mass; BMD: bone mineral density; LL: lower limb; UL: upper limb; AS:H: arm span to height ratio; UB:LB: upper body to lower body ratio; LM:FM: lean mass to fat mass ratio.
Regression analysis between anthropometric profile variables and surfboard dimensions
The proportion of variance explained by anthropometric profile linear regression models was greater for male surfers than female surfers for all surfboard dimensions aside from surfboard thickness. For female and male surfers respectively, the models explained 80% (p = .003) and 95% (p ≤ .001) of the variance in surfboard volume, 71% (p = .011) and 89% (p ≤ .001) in surfboard length, 69% (p = .006) and 79% (p ≤ .001) in surfboard width, and 89% (p ≤ .001) and 84% (p ≤ .001) in surfboard thickness. Figure 3 depicts the anthropometric variables included in each model and their contributions to the explained variance. FM measures had the greatest contribution across all models for female surfers. Contrarily, LM measures had the greatest contribution across all models for male surfers, while FM measures had no contribution. Additionally, anthropometric measures ‘height’, ‘body mass’, ‘arm span’ and ‘AS:H’ had no contribution to the models for female surfers, meaning neither of the expected anthropometric measures used within surfboard design, height or body mass, were present. For male surfers however, body mass was the strongest contributor to surfboard volume (Figure 3) and height was the second strongest contributor to surfboard length (Figure 3). Figure 4 further illustrates the relationship between surfboard volume and body mass alongside surfboard length and height within both sexes.
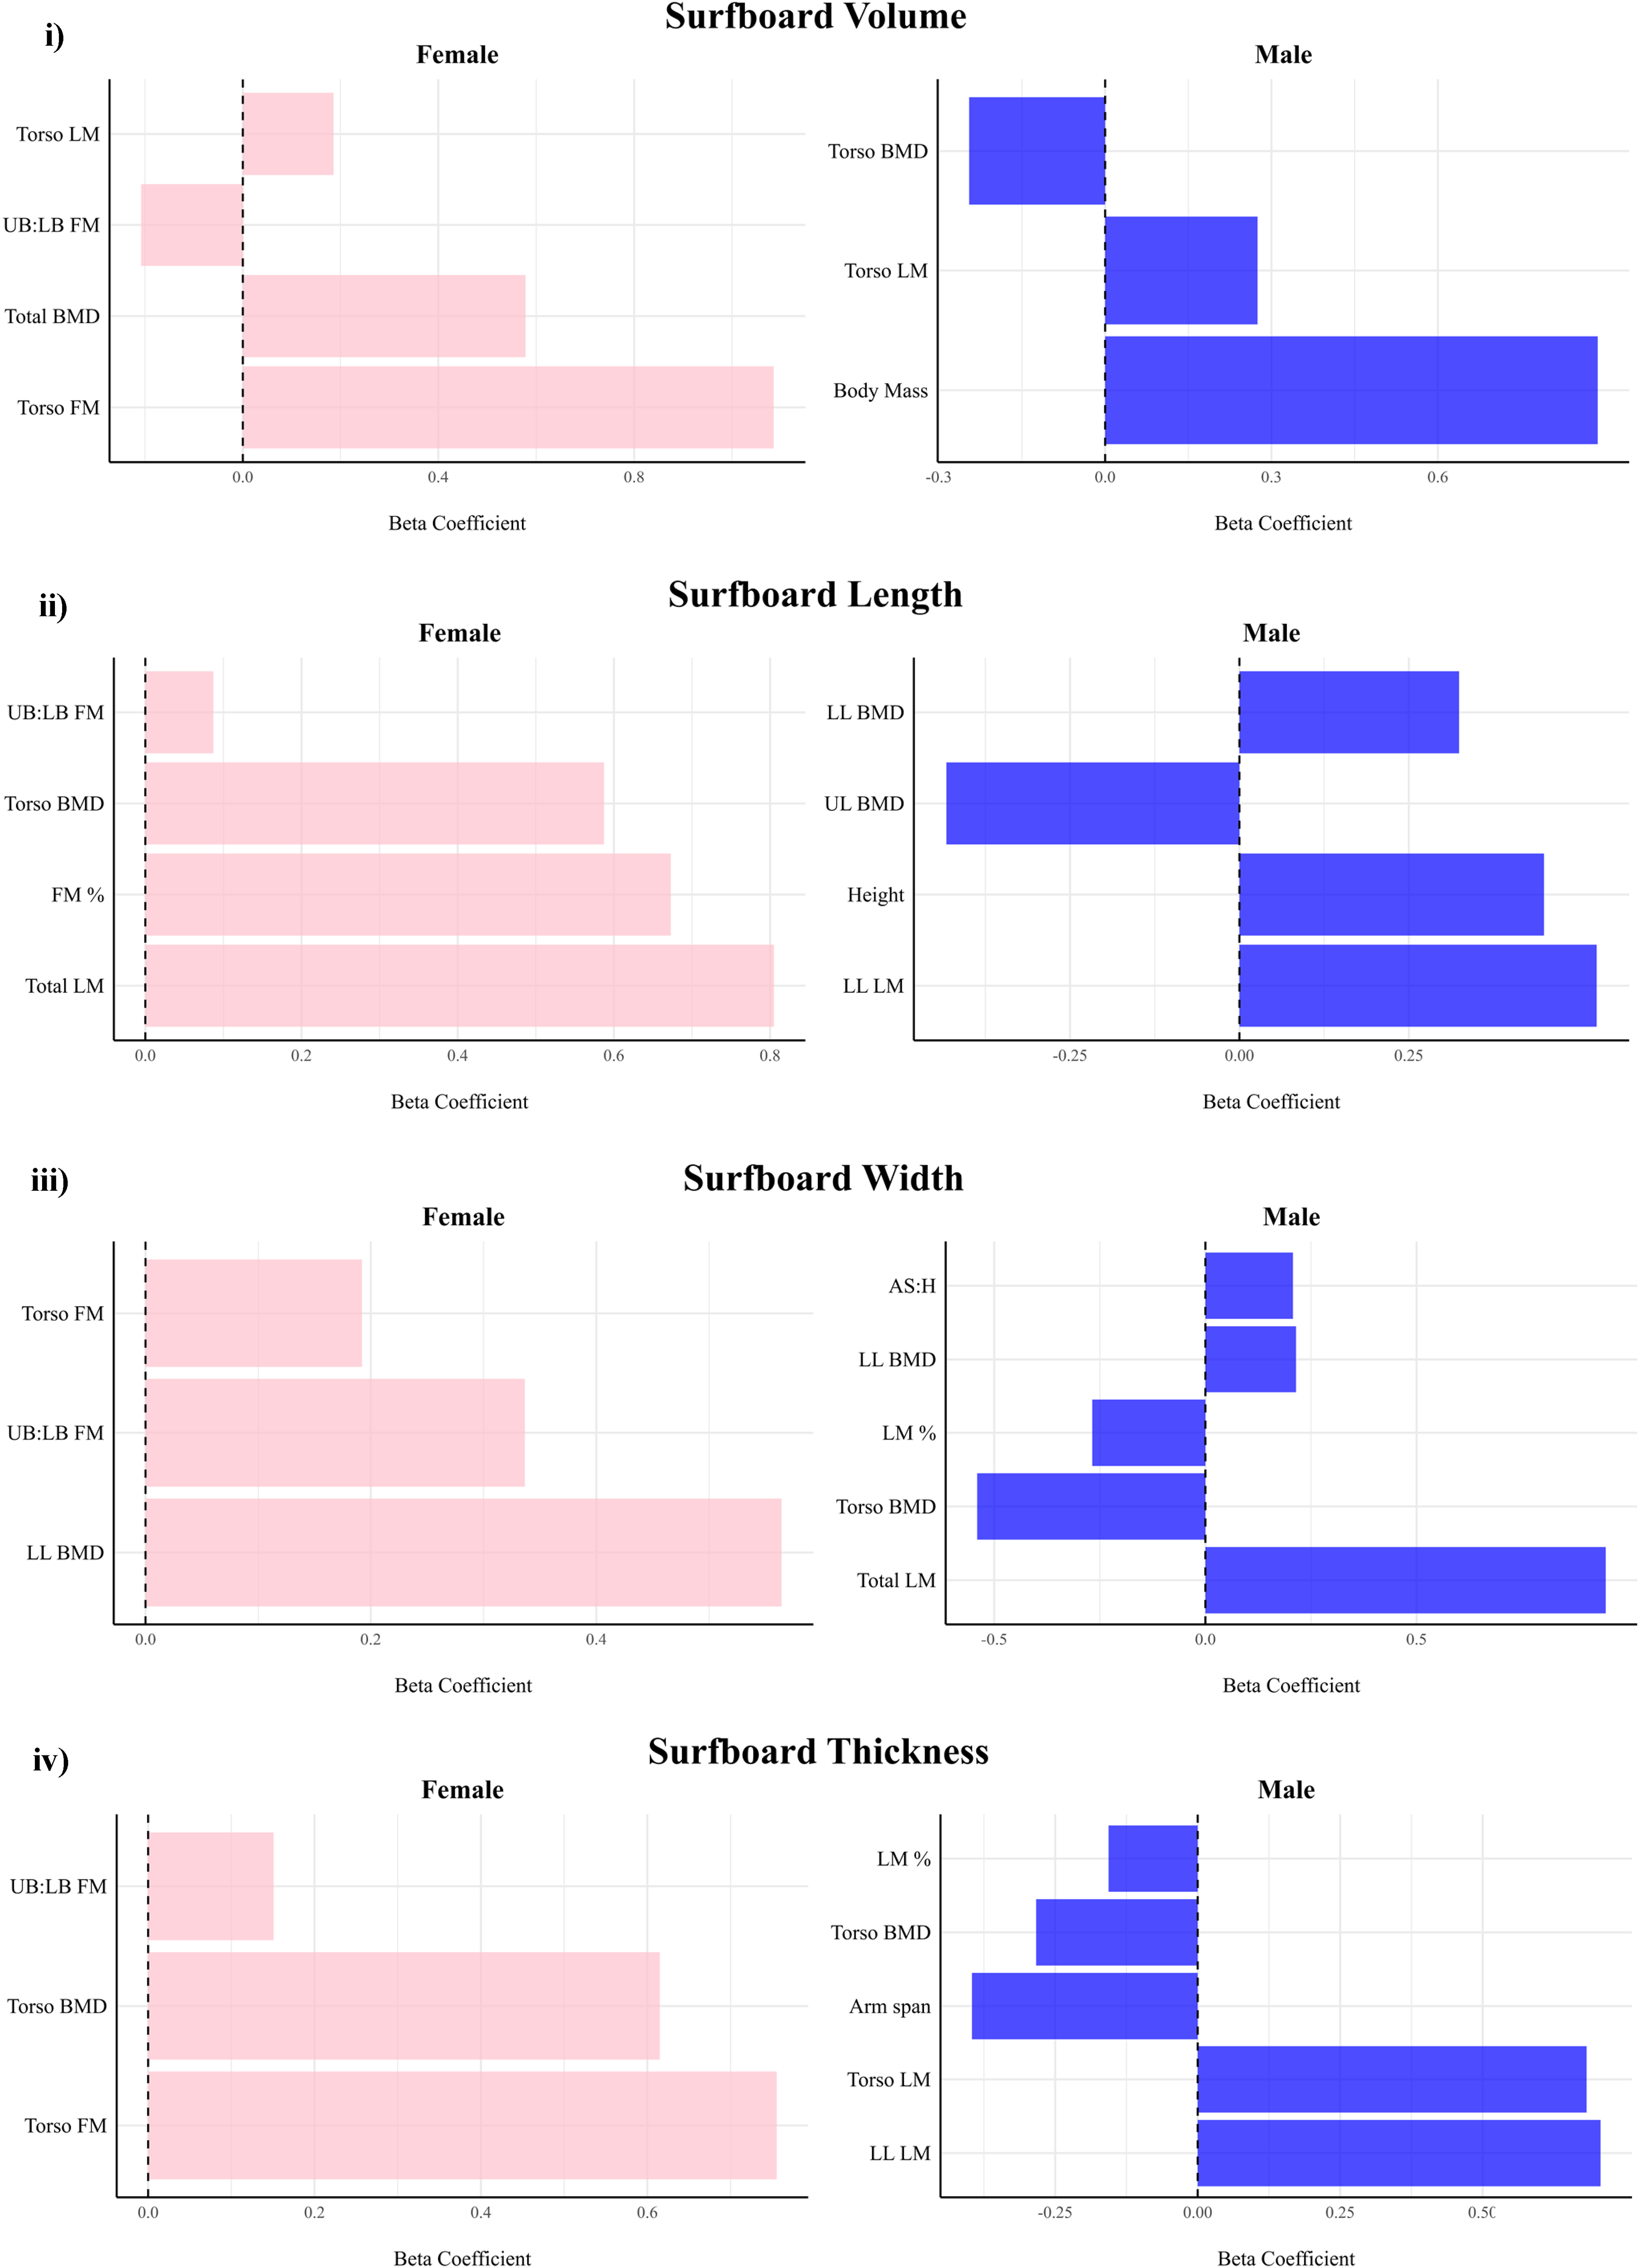
Anthropometric variables and their relative contributions to the models explaining the variance of surfboard volume (i), length (ii), width (iii) and thickness (iv) for both females (pink) and males (blue). LM = lean mass; FM = fat mass; BMD = bone mineral density; UB = upper body; LB = lower body; LL = lower limb; UL = upper limb; FM % = body fat percentage; LM % = lean mass percentage of body mass; AS:H = arm span to height ratio.
Surfboard survey reponses
The competitive history questions revealed no significant differences between female and male surfers. Regardless, female surfers reported less years of competitive experience (5.9 ± 4.0), less years working with their current shaper (4.5 ± 3.4), and a greater frequency of times changing shapers in their career (2.3 ± 2.8) compared to males (7.3 ± 4.3, 5.7 ± 4.1, 1.8 ± 2.5 respectively). When factors were ordered from greatest to least influence for female and male surfers separately, female surfers consistently rated factors as having less influence on their surfboard design and selection compared to males (Figure 5). In addition, male surfers reported a significantly greater influence from ‘coach / shaper advice’ (p = .018) and ‘trust in your shaper’ (p = .007) within the ‘design’ subsection, and ‘wave size’ (p = .015) and ‘connection / feel for surfboard’ (p = .030) in the ‘selection’ subsection (Figure 5). When prompted to rate their reliance on personal versus shaper knowledge when ordering a surfboard, male surfers identified more reliance on personal knowledge (6.3 ± 1.9), while female surfers relied more on their shaper's knowledge (4.7 ± 1.8). This response was also discerned as significantly different between the sexes (p = .026).
Discussion
The purpose of the present study was to characterise the anthropometric profiles of competitive female and male surfers, explore the relationship between surfers’ anthropometric profiles and their surfboard dimensions, and identify the factors influencing surfers’ decision-making in surfboard design choice and selection for competition. Inferential statistics discerned that female surfers are shorter, lighter, have shorter arms, and have less LM and more FM than male surfers. Correlational and regression analyses revealed fewer significant relationships between anthropometric profile variables and surfboard dimensions in female surfers, alongside lower r and adjusted R2 coefficients when compared to male surfers. Additional sex differences emerged in the regression models, with FM measures being the strongest contributors to explaining the variance in surfboard dimensions for female surfers, while LM measures were the strongest contributors for male surfers. Furthermore, the survey results demonstrated that male surfers place greater importance on the key factors influencing their surfboard design and selection than female surfers. These findings highlight notable sex-related differences in the relationship between surfers’ anthropometric profile and their competition surfboards, as well as their decision-making processes.
Anthropometric profiles of surfing athletes
Female surfers were shorter, lighter and exhibited a shorter arm span, lower LM values and higher FM values than their male counterparts (Tables 1 and 2). Comparing surfers’ anthropometric profiles across the literature is challenging, as prior studies often reported body fat using sum of skinfolds and lean mass through somatotypes. However, Barlow et al. (2014) 28 and Lowden and Pateman (1980) 29 reported 11.3% and 10.5% body fat in male surfers, respectively, closely reflecting the 10.6% observed in the present study. In contrast, research investigating fat mass percentage in female surfers reveals large variability. Lima et al. (2011) 30 reported 10%, Lowden and Pateman (1980) 29 and Barlow et al. (2016) 31 found 19.5% and 18%, respectively, and the current study reported 24%. Importantly, prior studies employed skin folds to obtain these results, which is a method found to yield mixed accuracy and often underestimate body fat.32,33,34 DXA scanning is considered more accurate,32,33 and the only known study to employ DXA scanning in competitive surfers was by Furness et al. (2018) 24 who reported 17% body fat in males, which is significantly greater than the present findings. Furness et al. (2018) also found no body composition differences between competitive and recreational surfers, while prior research had identified competitive males to have more LM and less FM,35,36 which is a profile linked to faster paddling and superior competition rankings.37–39 Similarly, Barlow et al. (2016) 31 found that greater FM in competitive female surfers was associated with poorer competition rankings. These performance implications, alongside the variability in results, prompts the need for more research on competitive surfers’ anthropometric profiles, ideally utilising DXA scanning, as it could assist in further tailoring performance health, nutrition and equipment strategies to optimise surfing performance.
Relationship between anthropometric profiles and surfboard dimensions
Across both sexes, correlational analyses revealed that total and segmented LM, FM and BMD had strong associations with the surfboard dimensions of the primary board used by both female and male surfers (Table 4, Figure 3). Therefore, it seems plausible to assume that surfboard shapers, through years of empirical experience, have developed a deep understanding of the specific needs of different body types in relation to surfboard design. Importantly however, a stronger statistical relationship between anthropometric profile variables and surfboard dimensions was observed in male surfers as compared to female surfers within both correlation (Table 4) and regression analyses. Specifically, a greater number of significant correlations were observed between male surfers’ anthropometric variables and their surfboard dimensions, and these correlations demonstrated r coefficients of stronger magnitude (Table 4). Moreover, the regression models explained more variance in the volume, length and width of their surfboards compared to female surfers.
The regression models further demonstrated that FM measures had the greatest contribution to explaining the variance in surfboard dimensions for female surfers, while LM measures had the greatest contribution for male surfers. This alignment with FM rather than LM may pose a challenge for females as surfers must use strength and power to perform high-risk manoeuvres and produce visual spray aesthetics with their surfboard that are favoured by scoring judges.40–42 Lean mass (i.e., muscle mass) plays a pivotal role in generating the necessary strength and power to execute these movements effectively. 43 Lower-body strength and force production, which is closely tied to the amount of lean muscle mass in sporting populations, is critical to male surfing performance, particularly turning manoeuvres.41,44,45 While research on female surfers in this context is lacking, it is reasonable to infer that lower-body strength is similarly important for generating strength and power for wave-riding manoeuvres. Therefore, without a clear or strong connection between LM and surfboard dimensions, it remains uncertain whether the current surfboards ridden by female surfers are optimised to translate their strength and power into wave-riding performance.
Upper-body to lower-body FM ratios (UB:LB FM) contributed to explaining the variance in every surfboard dimension for female surfers. This, alongside the larger emergence of FM measures for female surfers, proposes that FM and its distribution are the most critical factors in determining the surfboard design of female surfers rather than anthropometric measures such as height (Figure 4 ii) and body mass (Figure 4 i). This contradicts the belief within the surfing community that height and body mass strongly inform the length and volume of each individual's surfboard. Importantly however, it remains uncertain if the surfboards adopted in this study are the most optimal, meaning these anthropometric measures (i.e., height and body mass) should not be disregarded. Height and body mass did have a strong significant relationship to male surfers’ surfboards, so the question remains as to whether female surfers require a different approach to their surfboard design, or whether more experimentation would reveal a connection to these anthropometric measures also.
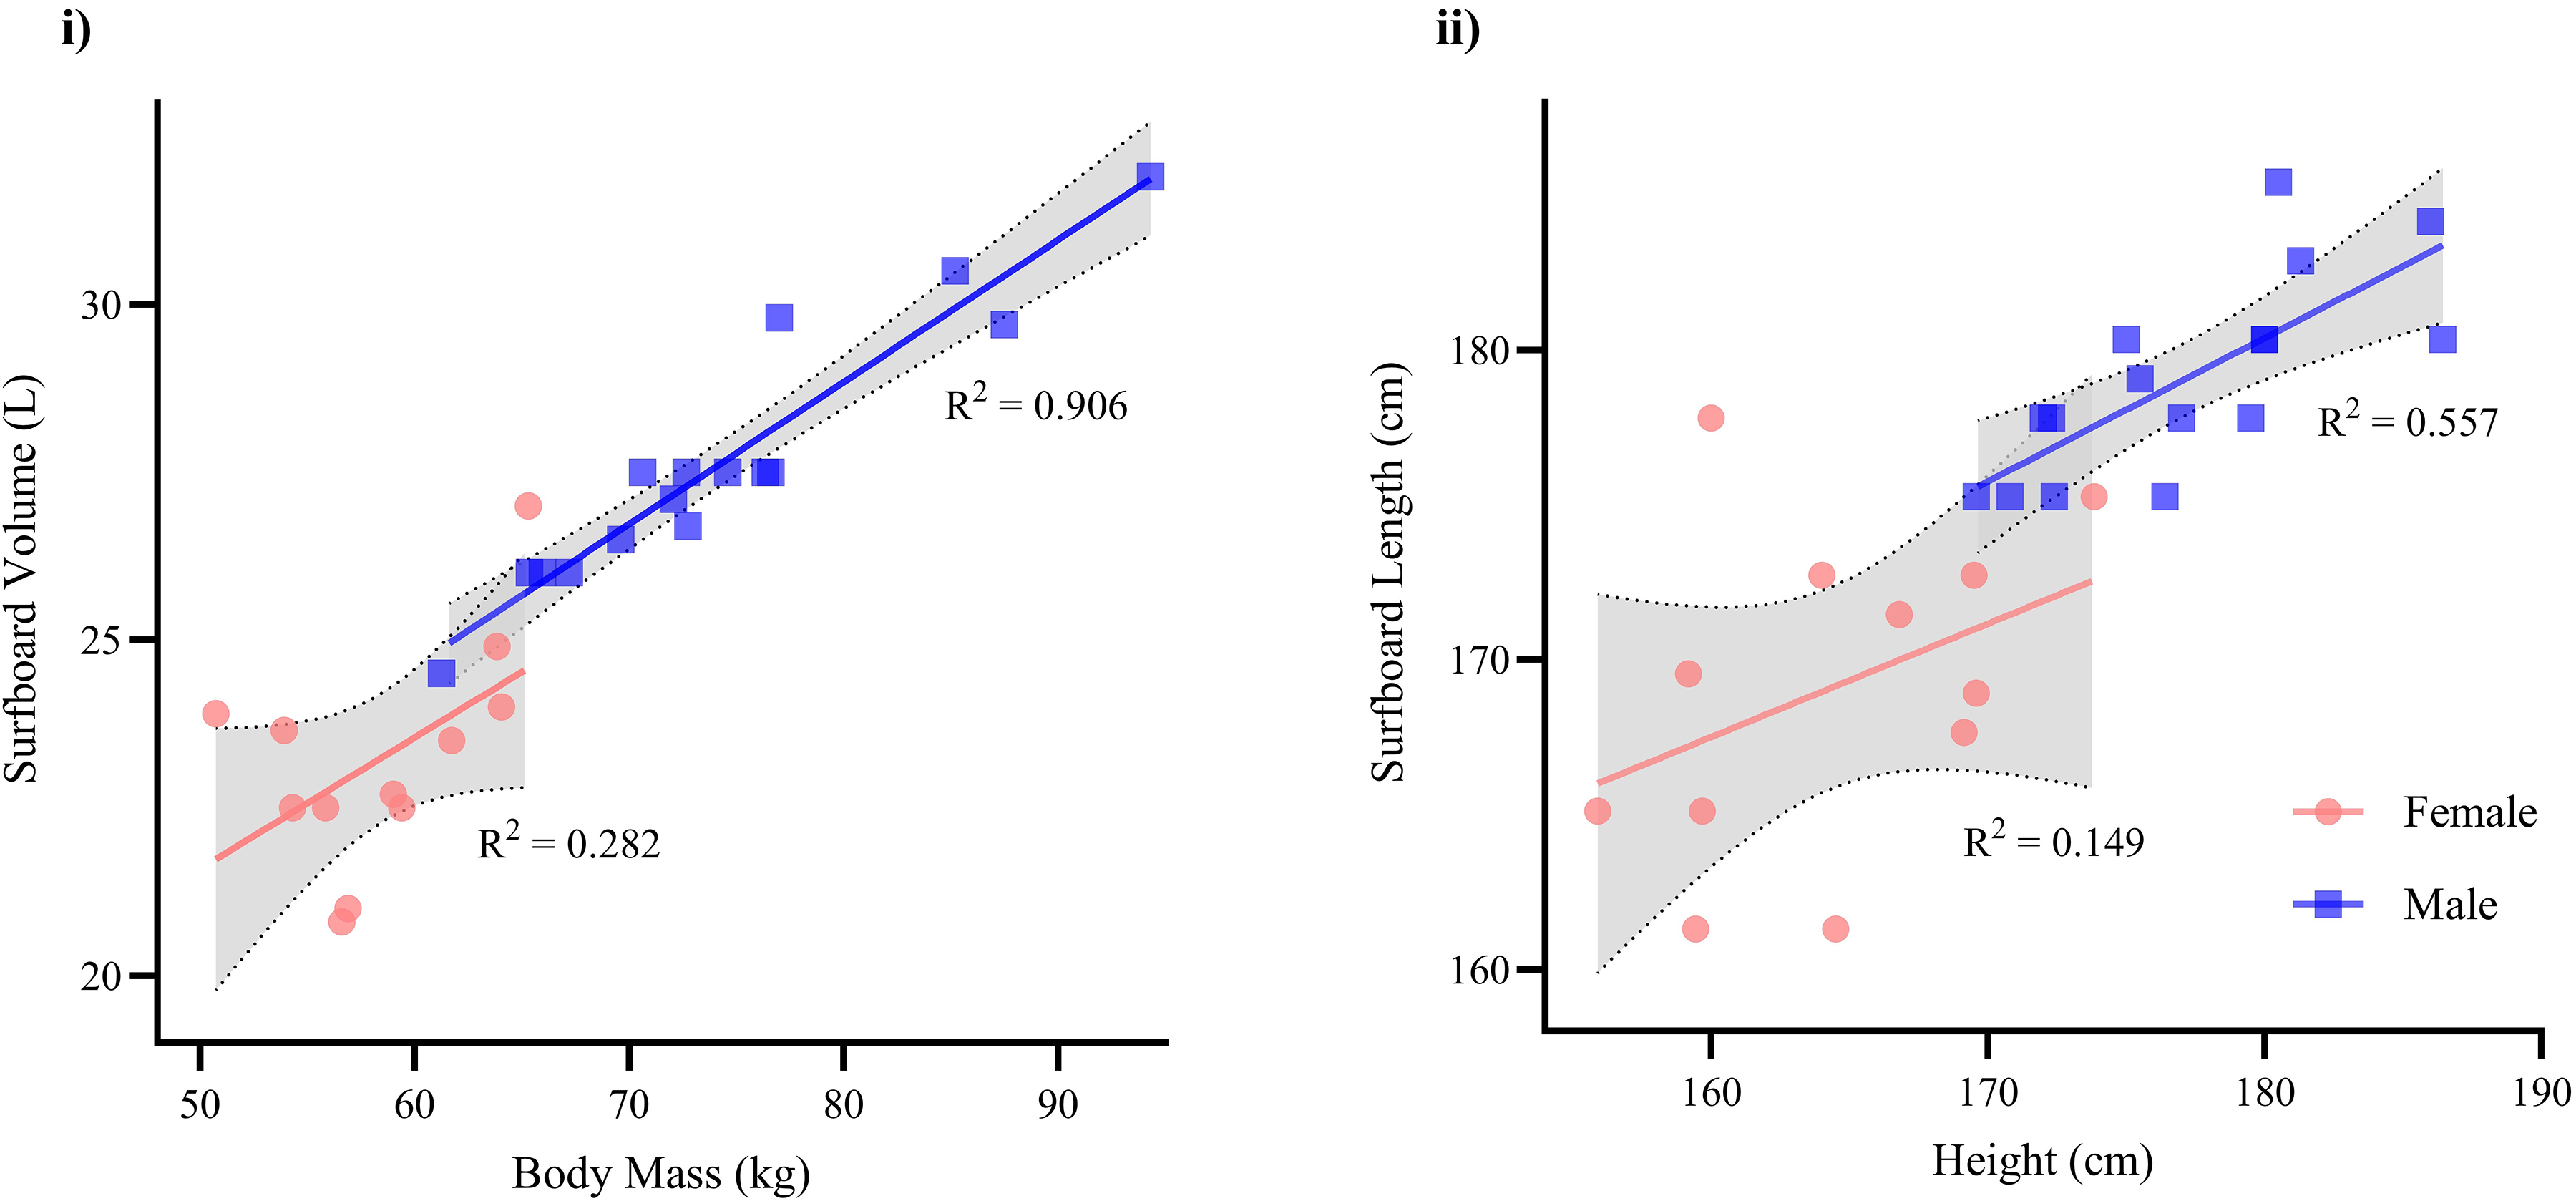
Sex differences in the correlational strength of the anthropometric measures body mass and height used in designing surfboard volume (i) and length (ii).
The reason for the identified sex discrepancies in surfboard design is unknown, however could be due to the design and shaping industry historically working longer with male surfers, and thus having more time to experiment with the surfboards that best suit their body types.18,21 As of 2019, females still only comprised 25% of the adult surfing population in Australia which highlights the likely difference in resources and demands placed towards female surfing. 46 It seems reasonable to assume that the surfboard design industry has had less experience shaping surfboards for female surfers, therefore potentially contributing to a lesser understanding of what best complements them. Additionally, female surfers have proportionally more FM and less LM in relation to their total body mass compared to male surfers, which may favour the emergence of more FM measures within the relationships between their anthropometric profile and surfboard dimensions. Conducting more targeted research on female surfers and optimising surfboard design for their specific needs could significantly enhance both the understanding of their unique performance dynamics and the overall progression of women's surfing.
Decision-making processes surrounding surfboard design and selection
The survey responses revealed marginally different results between the order of factors that female and male surfers rated as having the greatest to least influence on both their surfboard ‘design’ and ‘selection’ (Figure 5). Notably however, female surfers consistently rated the factors in the corresponding ordinal position, from greatest to least, as having a lesser influence on their decision-making compared to male surfers (Figure 5). This suggests females could be less confident in their understanding of what influences surfboard design and selection, emphasising the need for more collaboration between female surfers, shapers and coaches to enhance their understanding of equipment design. Significant differences were also observed whereby female surfers rated ‘trust in your shaper’ and ‘coach / shaper advice’ as having significantly less influence on their surfboard design than male surfers. However, female surfers also depended more on their shaper's expertise for their surfboard designs compared to male surfers who expressed greater reliance on their own personal knowledge. This indicates that females likely have less confidence in their own understanding of surfboard shaping and design alongside less confidence in their relationships with their shapers and coaches.
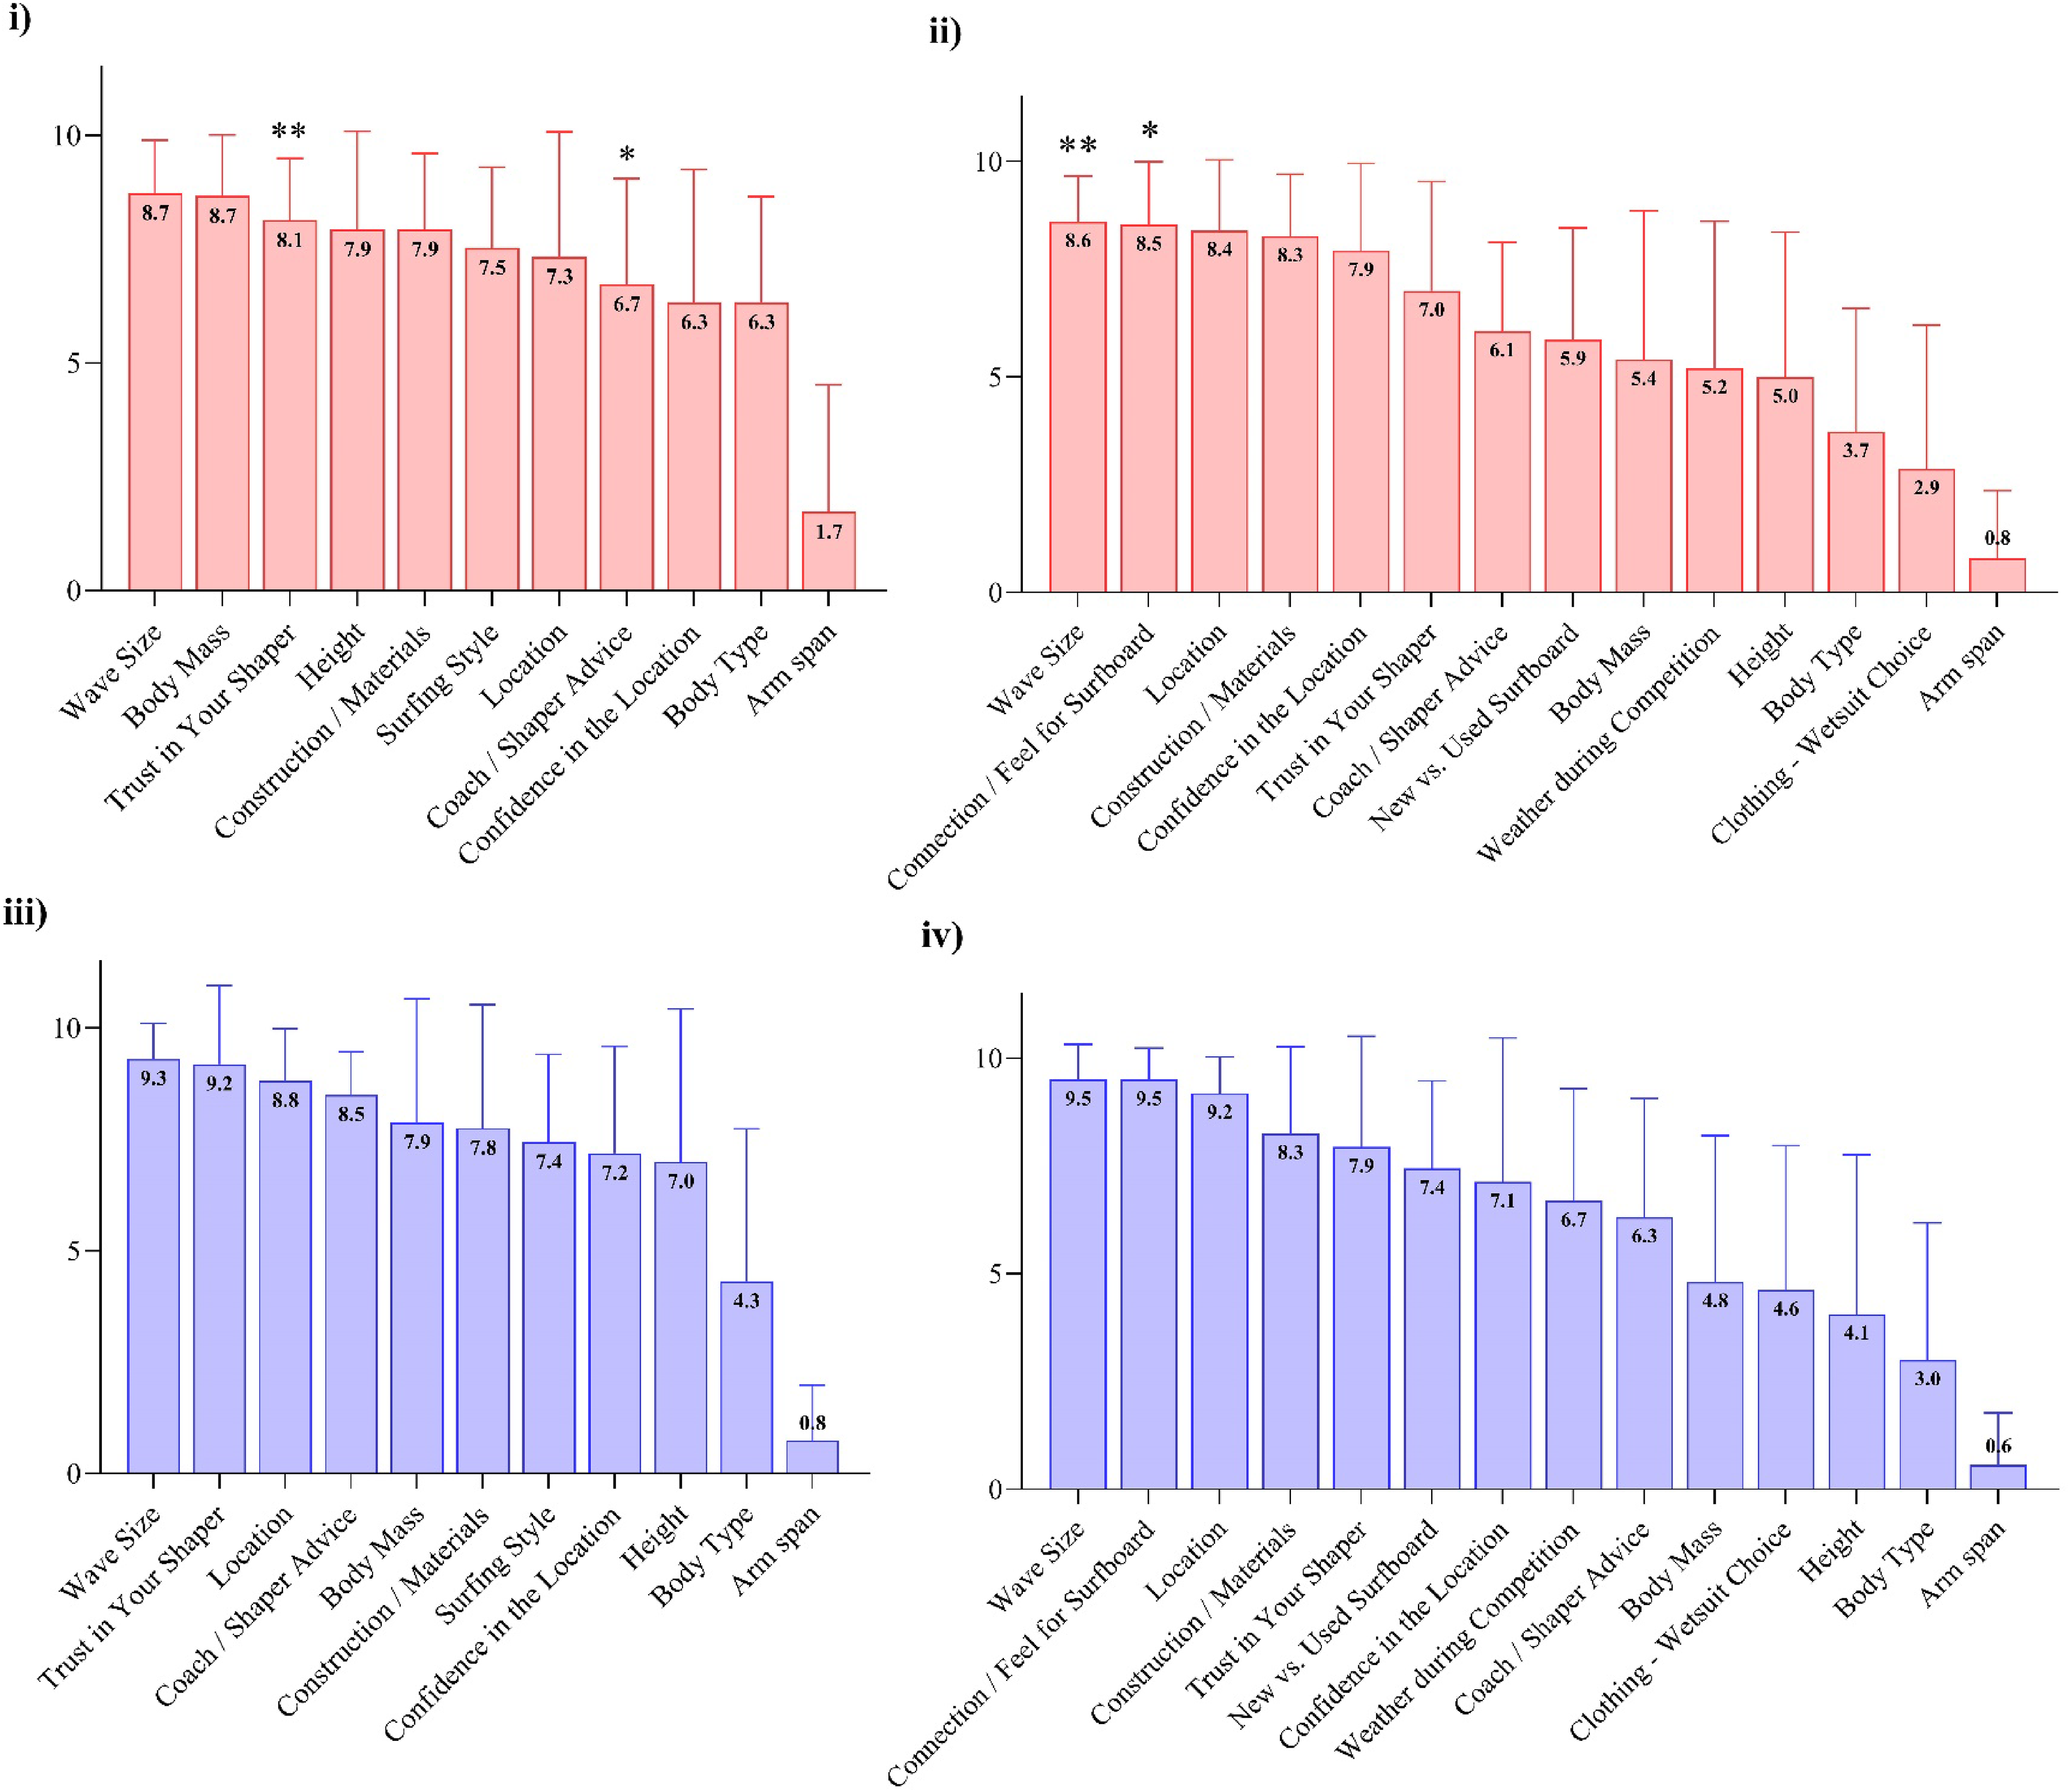
NRS survey responses ranked in order of most influential on surfboard ‘design’ (i and iii) and surfboard ‘selection’ during competition (ii and iv) within female (i and ii) and male (iii and iv) surfers. These ratings are based on the mean of all responses in each sex whereby ‘0’ represents no influence and ‘10’ represents maximum influence. Significant statistical differences reported between sex (*p ≤ .05, **p ≤ .01, ***p ≤ .001, ****p ≤ .0001).
These findings could be stemming from their comparatively fewer competitive experiences and less time working with their surfboard shapers (Table 1). Hays et al. (2009) 47 determined that world-class female athletes are more susceptible to confidence-debilitating factors, making them more likely to experience adverse fluctuations in confidence compared to their male counterparts. Confidence is particularly vital in surfing as it must extend beyond self and intrinsic ability to encompass knowledge of equipment. Surfers must trust both themselves and their equipment to perform optimally and safely within diverse and intimidating wave profiles. Increasing exposure and experience can enhance an athlete's perceptual, physical and confidence capabilities by providing more opportunities for positive intrinsic feedback and fostering the ability to adapt to various situations more efficiently and effectively48–51 Therefore, providing female surfers with increased exposure and experimentation and applying a co-design methodology to surfboard shaping could be crucial for enhancing their autonomy and confidence, proactively contributing to the progressive development of women's surfing.
The conducted survey also revealed that the anthropometric measures, ‘height’ and ‘body mass’, had a greater influence on surfboard ‘design’ than ‘selection’ (Figure 5), which aligns with expectations as it is known that these are the measurements that help inform the basic dimensions of each surfer's surfboard.9,10 Interestingly, female surfers assigned a greater influence on both ‘height’ and ‘body mass’ on their design compared to male surfers, suggesting a strong awareness regarding the critical role of these anthropometric variables in designing their surfboards. However, statistical analyses showed no significant relationship between these anthropometric variables and the surfboards adopted by female surfers (Figures 3 and 4). Further investigation is required to discern why this lack of statistical connection currently exists and whether it is the most beneficial approach for female surfboard design.
The survey results also highlight that many environmental and intrinsic factors beyond anthropometry are strongly considered in surfboard design and competition selection. This underscores the need for further research to explore how these variables interact and impact performance, and emphasises the evolving and dynamic nature of surfboard shaping. Males, who likely have more experience in this domain, rated factors like wave size, location and team relationships as more influential on shaping decisions than anthropometrics. This indicates a shift in approach and suggests that other surfboard elements (i.e., rocker, rails, tail, fins) that aren’t directly influenced by anthropometrics are critical in optimising performance goals. In contrast, females rated their anthropometry as having a stronger influence, indicating that further experimentation and confidence in their equipment knowledge may lead to different insights in the future. It is essential for females to drive this exploration while being supported by their coaches, shapers and sporting organisations. Given the importance of the evolving landscape of surfboard design, a collaborative approach is necessary to customise surfboards that reflect the distinct surfing styles of females and males.
Limitations and future investigations
Future studies with larger sample sizes would be beneficial to increase the generalisability of these findings and validate the specific statistical power of the identified variables considering the absence of post-hoc corrections. Additionally, the surfboards used in this study were custom-shaped for each athlete, but their effectiveness in optimizing performance remains uncertain. Determining the optimal surfboard is complex, as it varies with environmental conditions, however, each surfboard is likely suited to a certain wave profile, and testing the board in such conditions would clarify its suitability for the surfer. Future research should experiment with different surfboard designs and materials in appropriate environments to identify the optimal designs for each surfer. This approach would yield more robust conclusions about the relationship between the surfboard and the surfer's body and further validate or refute the findings of this study. Indeed, there is no quantification of performance within this study and additionally assessing the connection of anthropometric profiles and surfboard designs with competition levels, competition rankings and wave scores would enhance the foundational knowledge of this domain. This will become particularly critical for female surfers in further understanding their decision-making, subsequent equipment choices, and the influence this has on their performance, ultimately increasing education and fostering their continued success alongside their male counterparts.
Conclusion
The present study aimed to objectively understand the interplay between the surfer and their surfboard, and how this differs between male and female surfers. The results highlight significant sex-related differences in the anthropometric profiles of competitive surfers and their adopted surfboard dimensions. Male surfers exhibited a stronger statistical relationship between their anthropometric profiles and surfboard dimensions, and also reported a stronger trust in their surfboard shapers and coaches compared to female surfers with regards to their equipment design. These findings emphasise that female surfers require greater support to better understand equipment optimisation and how to best align their surfboard with their unique profiles and surfing styles. Shapers should be mindful of providing clear communication and explanations to female surfers directly and could benefit from a detailed reflection of their working methods to identify practices that may reduce the observed disparities. Practical recommendations include encouraging increased experimentation with surfboard designs and fostering open communication between surfers, shapers and coaches to enhance education within female surfers. Coaches can support this process by integrating equipment feedback into training programs and encouraging surfers to take an active role in customising their surfboards. Strengthening these collaborative efforts has the potential to enhance the knowledge, autonomy and confidence of female surfers, ultimately addressing performance disparities and enhancing the sport of surfing.
Footnotes
Acknowledgements
This project was aided by an affiliation of the lead researcher with the Griffith Sports Science unit of Griffith University, the Sport Performance Innovation and Knowledge Excellence (SPIKE) unit of the Queensland Academy of Sport, the Surfing Australia High Performance Program, and the Australian Institute of Sport.
Declaration of conflicting interests
The authors declared no potential conflicts of interest with respect to the research, authorship, and/or publication of this article.
Funding
The authors disclosed receipt of the following financial support for the research, authorship, and/or publication of this article: This work was supported by the Queensland Academy of Sport (QAS), the Australian Institute of Sport, and Surfing Australia under QAS Grant #152.
Ethics statement
This research was considered to pose minimal risk to the involved participants. The Griffith University Human Research Ethics Committee approved this study (Ref. 2022/175) and written informed consent was obtained from each participant prior to data collection.