
Abstract
This study investigated biological maturity timing (BMT) in 116 Irish U13 and 958 Swedish U15 male national soccer players using various growth reference datasets. BMT was expressed as a Z-score comparing each player's percentage of predicted adult height (%PAH) to age-specific means and standard deviations reported in the: Berkeley Growth Longitudinal (US), UK 1990 growth reference (UK), and Swedish 2000s growth reference (SWE) studies. Multinomial logistic regression was used to compare BMT classification (Early, On-time, Late) between datasets. One-sampled means t-tests were used to examine BMT-related maturity biases per cohort and reference dataset. For both Swedish U15 (p < 0.001) and Irish U13 (p = 0.003) players, BMT classification was significantly influenced by the selection of the growth reference dataset. Only 61% of players had the same BMT category across all reference datasets. Significant maturity biases existed in favour of early maturing Swedish players (mean = 96.5%PAH) in all datasets, although moderate using SWE (d = 0.7), large using UK (d = 1.02), and very large using US (d = 1.36) (all p < 0.001). Small significant maturity biases existed in favour of early maturing Irish players (mean = 87.1%PAH) using UK (p < 0.001, d = 0.48) and US (p < 0.001, d = 0.33), but not SWE. We conclude that maturity Z-scores must be interpreted with significant caution, given the large variations in BMT classification between reference datasets.
Introduction
In the competitive landscape of high-performance sport, there is significant pressure on talent systems to select and develop athletes to the elite senior standard. 1 Yet, the factors that influence talent development are complex, interactive and dynamic, with a range of biopsychosocial variables impacting athlete progression. 2 A prominent and extensively studied variable is biological maturation, being shown to influence the selection and development of youth athletes.3–6 Biological maturation is the process of progression toward the mature adult state and is defined in terms of status, timing and tempo.3,7 Biological maturation status describes the stage of maturation an individual has attained at the time of observation (i.e., pre-pubertal, circum-pubertal, post-pubertal); timing refers to the chronological age at which specific maturation events occur (e.g., peak height velocity, menarche); tempo refers to the rate at which maturation progresses.3,7 From birth to adulthood, the tissues, organs and organ systems of the human body mature, albeit at different times and rates for each individual.6,8–11 From late childhood, same age peers have been shown to differ by up to six years in skeletal age and somatic maturity; both of which are established indices of biological maturation status in adolescents.12–14 For this reason, chronological age is not a reliable indicator of biological maturity timing or status 8 and alternative methods of assessment are required. 15
Maturation of the skeletal system involves a long-term transition of cartilaginous structures to a fully developed skeleton of bones. 16 Thus, the use of skeletal x-rays and an understanding of the developmental process from early ossification to fully mature skeletal tissue makes skeletal x-rays the gold standard method for assessing biological maturation status. 16 However, due to high costs and limited access to skeletal x-ray assessments, non-invasive predictive equations are often used to determine biological maturity status. 15 Although there are several non-invasive (e.g., Magnetic Resonance Imaging) and inexpensive methods (e.g., ultrasound) to examine biological maturity status and timing, 17 one of the most common non-invasive methods for classifying youth athletes by biological maturity timing is the use of Z-scores calculated from the athlete's percentage of predicted adult height; an established marker of biological maturity status.4,6,11,15,18–22 Z-scores allow for a comparison between the athlete's observed maturity status (derived from their percentage of predicted adult height) and expected maturity status using age-specific means and standard deviations outlined in growth reference datasets. In doing so, the practitioner/researcher can compare between these two scores to determine if the athlete is at the expected level in terms of biological maturity timing (i.e., on time), or behind (i.e., late maturing), or ahead (i.e., early maturing) relative to their chronological age. The use of Z-scores to determine an athlete's biological maturity timing from their percentage of predicted adult height (status) is highly popular among researchers and practitioners6,18 and has dominated the research landscape in talent identification and development.4,6,11,18,19,22
The most common growth reference dataset used for comparisons to derive athlete Z-scores for biological maturity is the dataset from the Berkeley Growth longitudinal study.4,6,11,18–23 Participants in this dataset were 61 American infants of North European descent, born in two hospitals between 1928–1929, tracked from birth until adulthood. This dataset has been used to derive Z-scores in a range of non-North American samples of varying ethnicities, born up to 70 years after the Berkeley sample.4,6,11,18–22 This raises questions about the appropriateness of classifying youth athletes in this way, particularly given the large differences in growth and stature between different nationalities and ethnicities,24,25 the secular changes in body stature and mass in humans over recent decades, 26 and the earlier onset of puberty in contemporary cohorts. 27
More recently, practitioners in the United Kingdom (UK) have used UK growth reference datasets on UK nationals to derive athlete Z-scores,28,29 which is arguably more appropriate given the large differences in growth and stature between nationalities and ethnicities24,25 and the recency of the dataset (1990) relative to the Berkeley sample. The UK growth reference dataset was derived from data collected on >24,000 healthy children born in the UK. 28 Wikland and colleagues 26 have also devised growth reference datasets for Swedish nationals based upon longitudinal studies of 3650 healthy Swedish children. However, and as previously discussed, the vast majority of literature using Z-scores to examine biological maturity timing in youth athletes used the Berkeley Growth Longitudinal Study dataset, regardless of the nationality/ethnicity of the sample being studied.4,6,11,18–23 Indeed, practically, this has been the case in some English Premier League academies and youth international soccer teams.6,20,22 Yet, no study to date has examined the differences in the biological maturity timing classification of athletes using different (and a variety of) growth reference datasets from different countries. Thus, it is possible that the same athlete's maturity timing could be classified differently depending on the reference dataset used. From a practical perspective, this has significant implications, with many sporting organisations using athlete Z-scores to make decisions about resource allocation related to talent identification and development. This includes selection for youth (inter)national future teams (and associated increased resource investment)30,31 and assessment of biological maturity-related biases in selection.6,22
To construct objective, reliable, and valid indicators of biological maturity timing it is important that the indicators used accurately reflect the maturation of the biological system studied. 8 Thus, this study sought to examine the extent to which variation can exist in the classification of national-level youth soccer players according to biological maturity timing (Z-scores) using a variety of nation-specific and alternative growth reference datasets. Our aim was not to advocate for the use of a particular or specific growth reference dataset to estimate biological maturity timing, but rather, this study is a proof of principle to highlight the extent to which there can be differences in classification. Given the large differences in growth and stature between different nationalities and ethnicities,24,25 secular changes in body stature and mass in humans over recent decades, 26 and the earlier onset of puberty in contemporary cohorts, 27 it was hypothesised that there would be significant differences in the classification of youth soccer players according to biological maturity timing dependent on which growth reference dataset was used to derive the Z-score. To investigate this, our study examined the differences in biological maturity timing (Z-scores) in youth soccer players using different growth reference datasets. As a secondary aim, we examined the extent to which the magnitude of a maturity bias in favour of early maturing players varied when using the different growth reference datasets.
Materials and methods
Participants, ethics and consent
A total of 1074 participants had their biological maturation status assessed. The participants assessed were either Irish male national U13 (n = 116) soccer players or Swedish male national U15 (n = 958) soccer players. Selection for the Football Association of Ireland's national talent development programmes begins at the U13 age cohort. Under current structures in the Swedish Football Association, selection for national talent development programmes begins two years later; at the U15 age group. For this study, we examined the first selected cohorts for national representation at each respective Football Association (Ireland U13, Swedish U15). For the sample of Irish players, each player provided written informed assent before participating in data collection procedures and each parent/guardian provided consent. By participating in Swedish Football Association regional and national camps in preparation for national team selection, players and their parents/guardians are informed that anthropometric data and other information will be collected as part of the registration process. Their participation in these assessments is considered consent to routine data collection. Ethical approval for the data collection procedures for the Irish players was granted by the Dublin City University Institutional Research Ethics Committee (DCUREC/2021/261), and retrospective use of de-identified data for research purposes for the Swedish players by the Swedish Ethical Review Authority (2023-05881-01).
Anthropometric data and biological maturity
The biological maturity status of each player was estimated using the percentage of predicted adult height by Khamis and Roche.15,32 For children of the same chronological age, it is assumed that those closer to their predicted adult height are more advanced in their biological maturation than those further from their predicted adult height.
6
The Khamis-Roche method enables the prediction of a player's adult height using a regression formula based upon age and sex-specific regression coefficients detailed by Khamis and Roche in their analysis of residents enrolled in the Fels longitudinal study.
15
The Khamis-Roche protocol requires the current age, height and weight of the child, and biological mid parent height (mean height of biological parents). Players had their body height measured to the closest 0.1 cm using a stadiometer and their body mass measured (wearing light training t-shirt and shorts) to the closest 0.1 kg using digital scales. Parents’ heights were self-reported via an online self-report form distributed by the respective national association and then adjusted for overestimation as outlined by Epstein et al.
33
Predicting adult stature using the Khamis-Roche formula is as follows:

Mean self-reported adjusted paternal and maternal heights (179.0 ± 5.3 cm and 165.4 ± 6.4 cm, respectively, for Irish parents, and 180.0 ± 6.5 cm and 166.2 ± 6.2 cm, respectively, for Swedish parents) were in line with sex-specific means for Irish and Swedish adults.24,34 The median error bounds between actual and predicted adult height using the Khamis-Roche method is 2.2 cm in males aged between 4 to 17.5 years. 15 For the age groups examined in this study, 12 to 15 years, the lowest 50% error was 2.3 cm for 15-year-olds, and the highest 50% error was 2.8 cm for 14-year-olds. 15
The height of each player was expressed as a percentage of their predicted adult height. This percentage was then used as an estimate of biological maturity status at the time of observation. Biological maturity status was then converted into a Z-score (i.e., the standard deviation difference between observed maturity status and expected maturity status) that reflected biological maturity timing for each individual player using the child's percentage of predicted adult height compared to age-specific means and standard deviations outlined in the following growth reference datasets: a) the Berkeley Growth Longitudinal Study (US growth reference data), 23 b) the UK 1990 growth reference data study (UK growth reference data), 28 and c) the 2000s Swedish population growth reference study (Swedish growth reference data). 26 As such, each player had three calculated and separate Z-scores using the three respective growth reference datasets. It is worth noting that in Ireland, the Health Service Executive use the UK growth reference data as the reference for Irish-born children. 35 A Z-score of −0.5 to + 0.5 was classified as on-time maturity timing; a Z-score of > + 0.5 was classified as early maturity timing; and a Z-score of < -0.5 was classified as late maturity timing as currently employed in the English Premier League Player Management Application and in recent studies of biological maturity in youth soccer.6,11,20–22
Data analysis
Variations in biological maturity timing across reference datasets
Data were analysed using SPSS Version 29 and Jamovi version 2.4. Descriptive statistics were used to examine the variance in biological maturation (Z-scores) across the Swedish and Irish cohorts using each respective growth reference dataset. To examine the differences in mean Z-scores of players between the three respective growth reference datasets, one-way repeated measures analysis of variance (ANOVA) tests were used (Z-score as dependent factor, reference dataset as independent factor) with post-hoc pairwise comparisons applied. To examine whether the distribution of athletes across the three maturity categories differed depending on the reference dataset used, a multinomial logistic regression analysis was conducted. The maturity category (Early, On-time, Late) was treated as the dependent variable, while the reference dataset (US, UK, SWE) was treated as the independent variable. The associated probabilities and odds ratio with 95% confidence intervals were also calculated. An alpha level of 5% was used for statistical significance.
Magnitude of the biological-maturity-related bias across reference datasets
A series of one-sampled means t-tests were used to examine the degree to which biological maturation biases existed across each cohort (Swedish U15 national players, Irish U13 national players) using Z-Scores derived from each growth reference dataset (US growth reference data, UK growth reference data, and Swedish growth reference data) by comparing the observed mean values for biological maturation (Z-Score) against the values expected for the general population (maturity Z-Score = 0.0) using a 95% level of confidence. 22 Effect sizes (Cohen's d) were also used to examine the magnitude of any significant differences (trivial: < 0.2; small: 0.2–0.49; moderate: 0.5–0.79; large: 0.8–1.19; very large: ≥ 1.2). 36
Results
Variations in biological maturity timing across reference datasets
The mean Z-scores were significantly different between the three growth reference datasets in the Swedish players (F (2, 1914) = 3981, p < 0.001), and in the Irish players (F (2, 230) = 19.0, p < 0.001) (Tables 1 and 2, Figure 1). Pairwise comparisons revealed that the Z-scores differed between all three reference datasets in the Swedish cohort and in all except the UK vs. US comparison in the Irish cohorts (see Supplemental file 1).
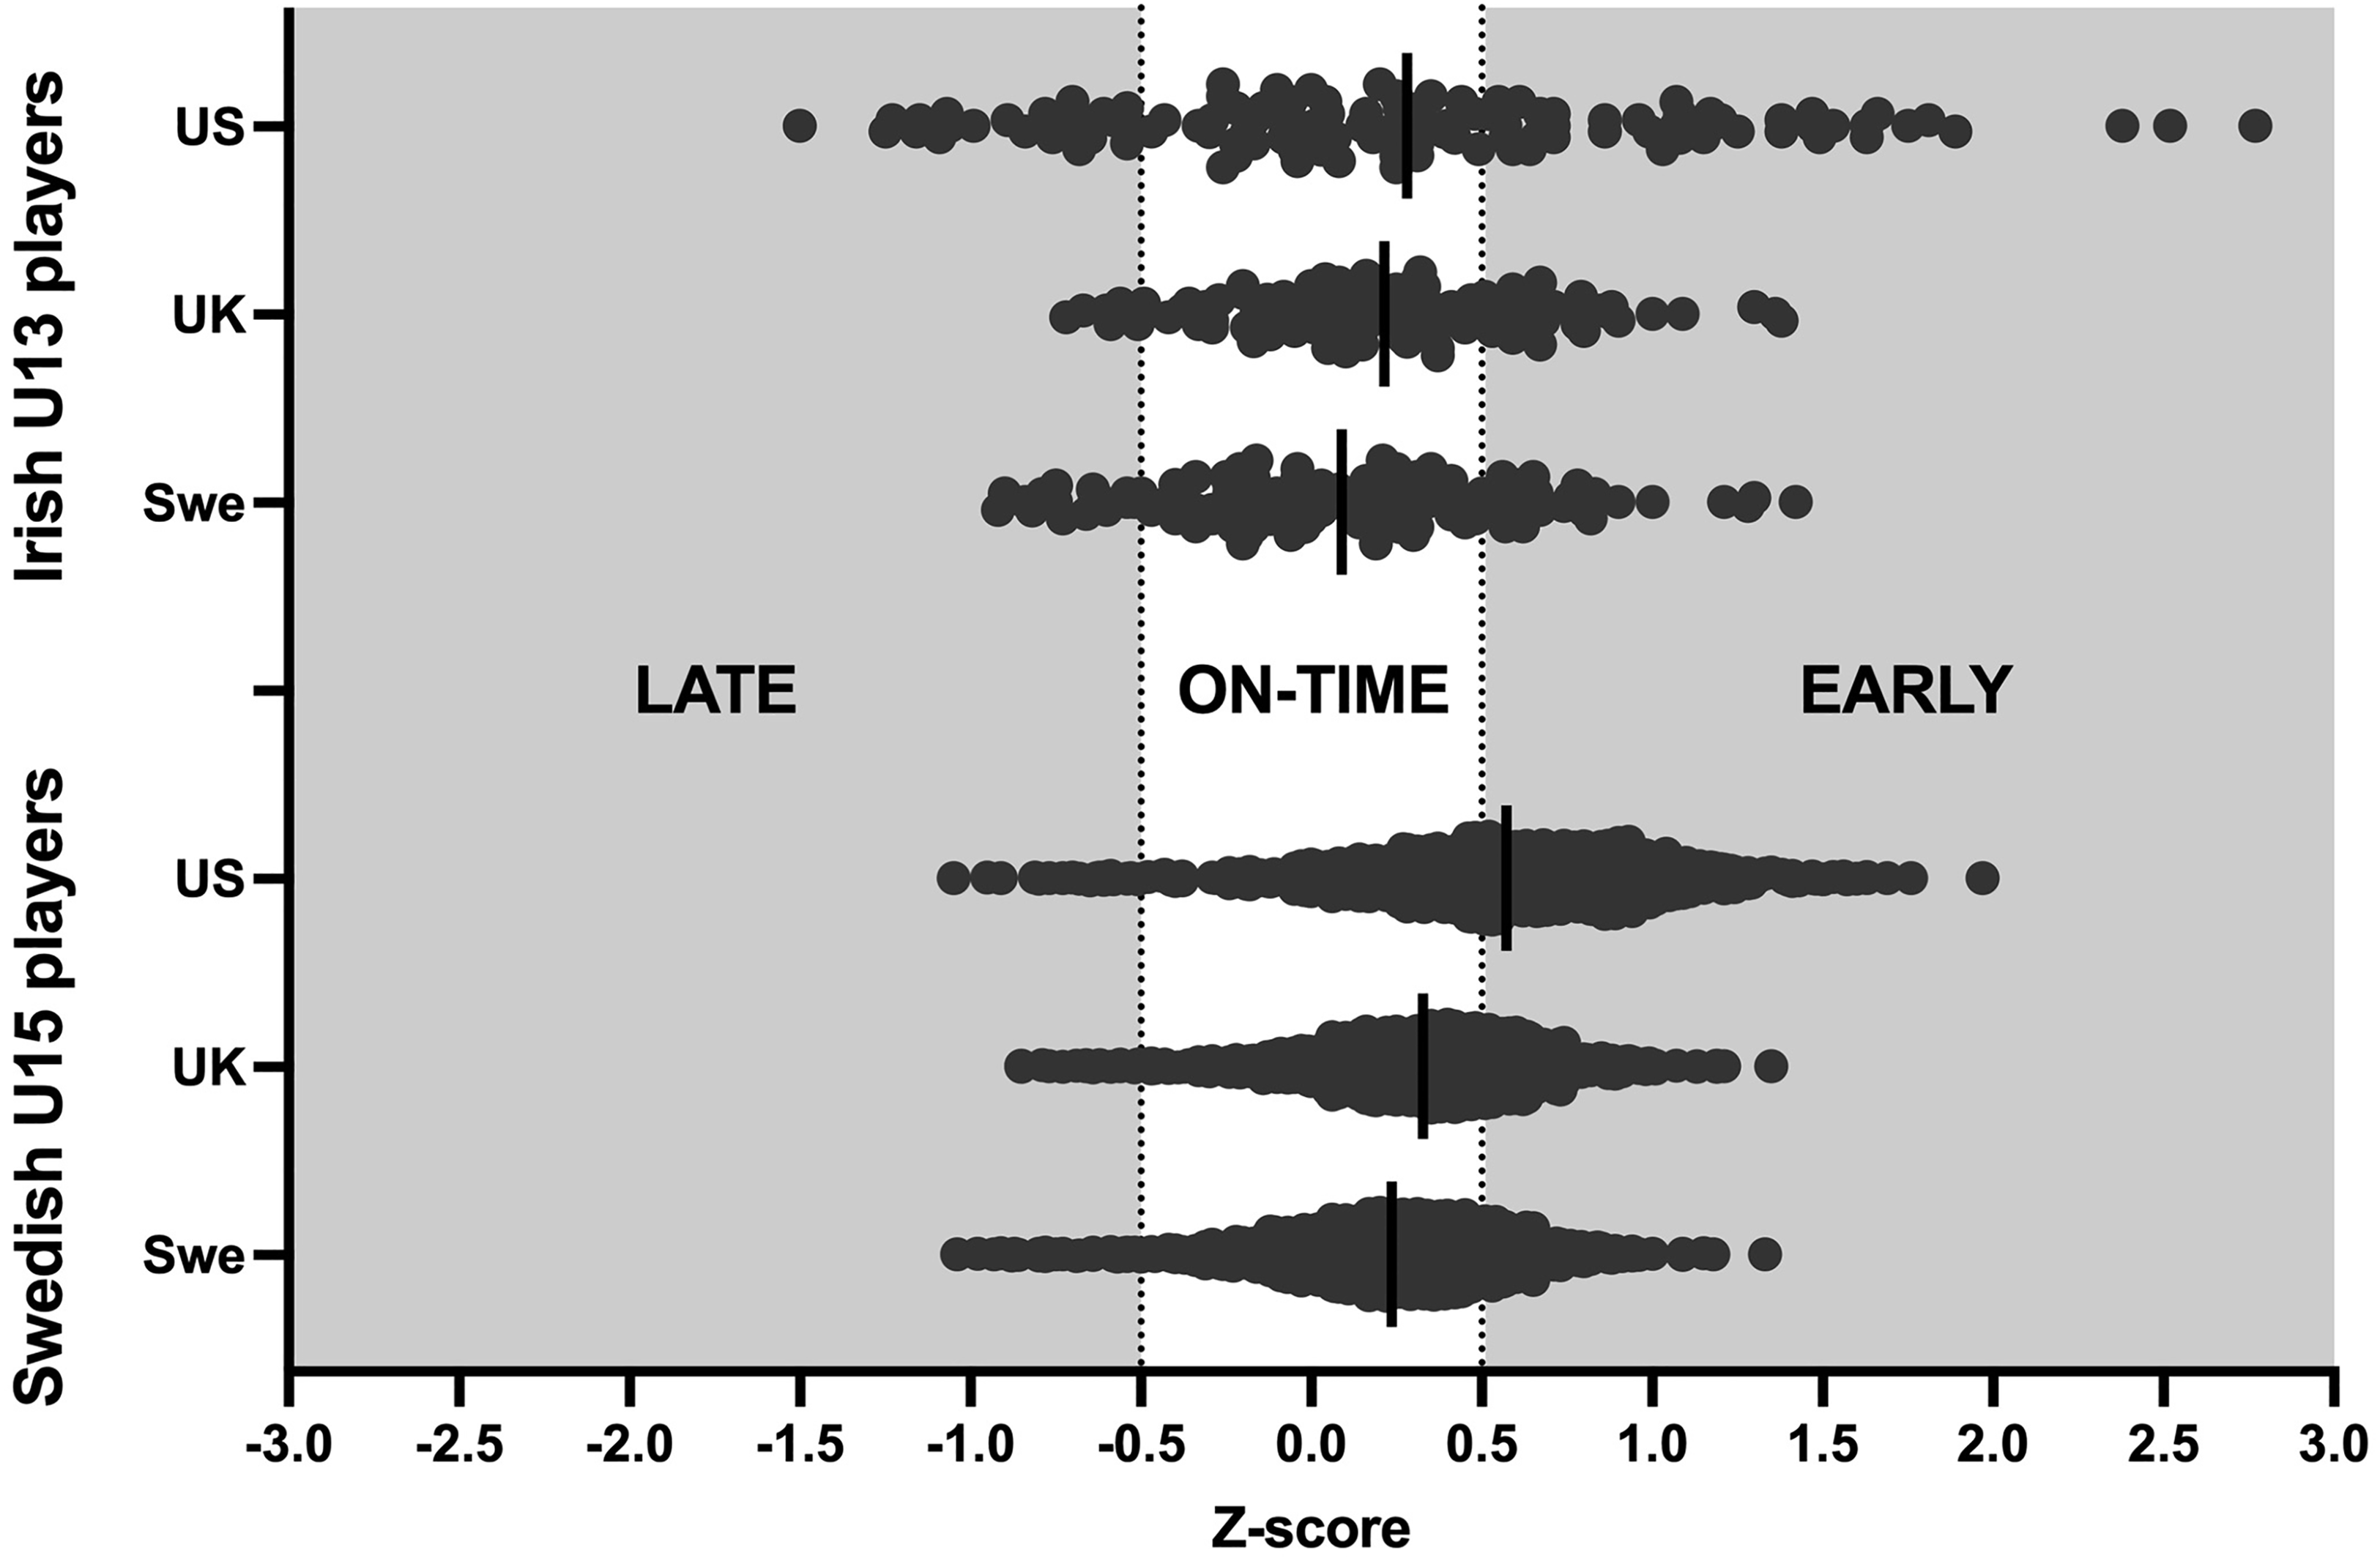
Biological maturity (Z-score) timing according to the three respective growth reference datasets. Note that a Z-Score > 0.5 is classified as early biological maturation timing.
Descriptive data (mean ± SD) relating to biological maturity timing and anthropometric characteristics for each cohort. Note the expected values for biological maturity (no biological maturation selection bias) Z-Scores are 0.0.
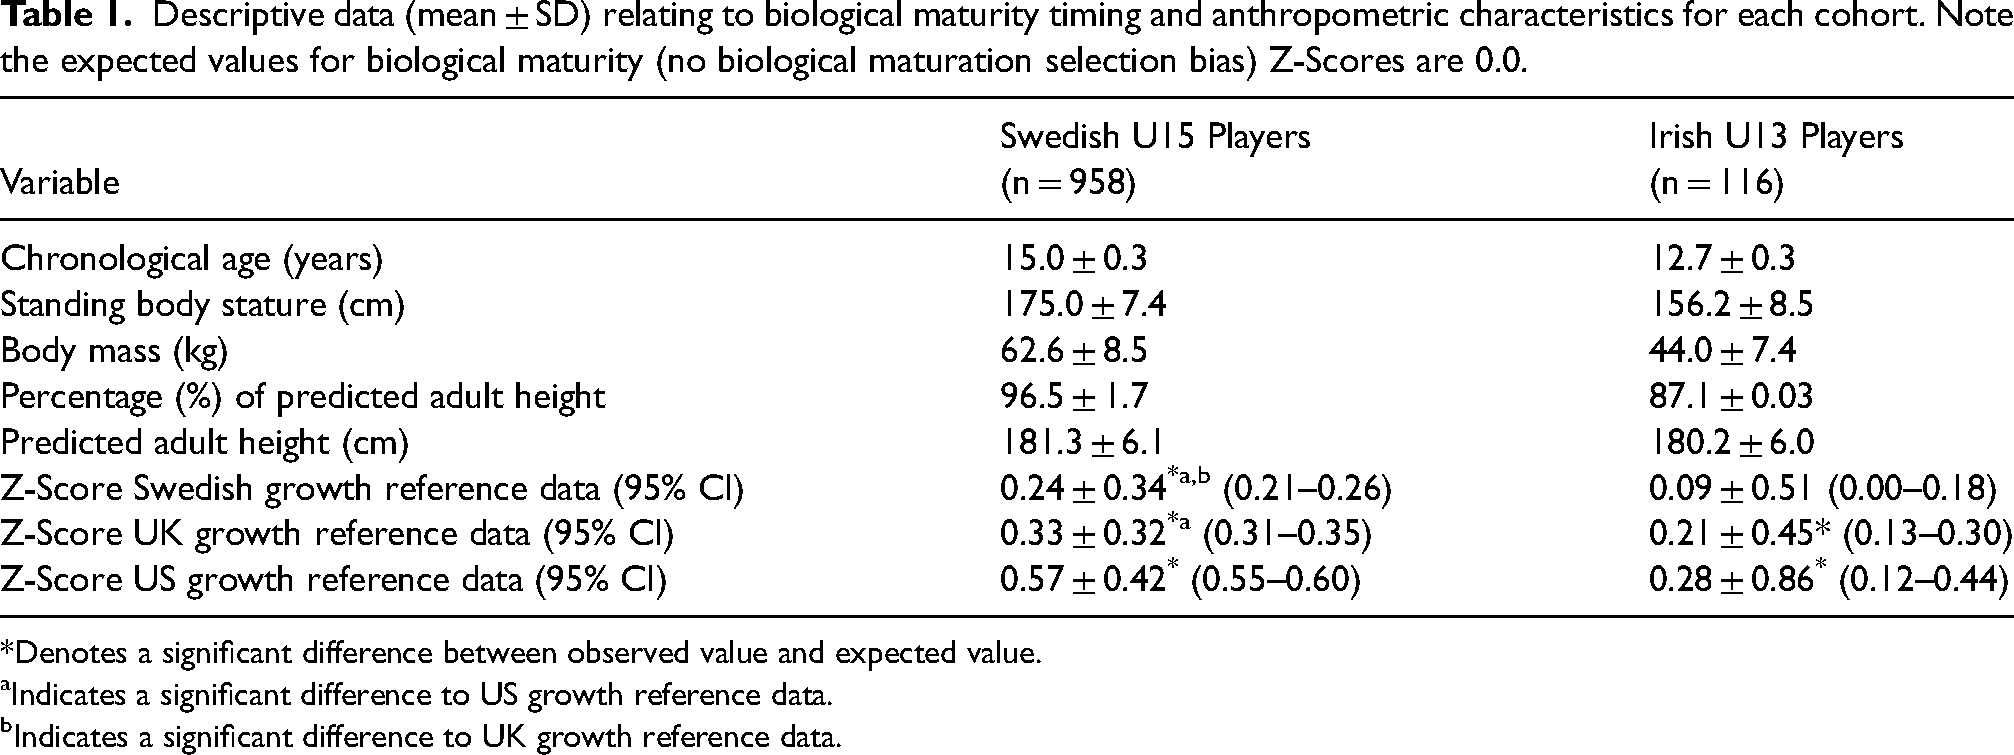
Denotes a significant difference between observed value and expected value.
Indicates a significant difference to US growth reference data.
Indicates a significant difference to UK growth reference data.
Biological maturity timing classification based on Z-Scores for percentage of predicted adult height between Swedish players and Irish players. Presented are the total number of players according to biological maturity timing and the percentage of the population in parenthesis.
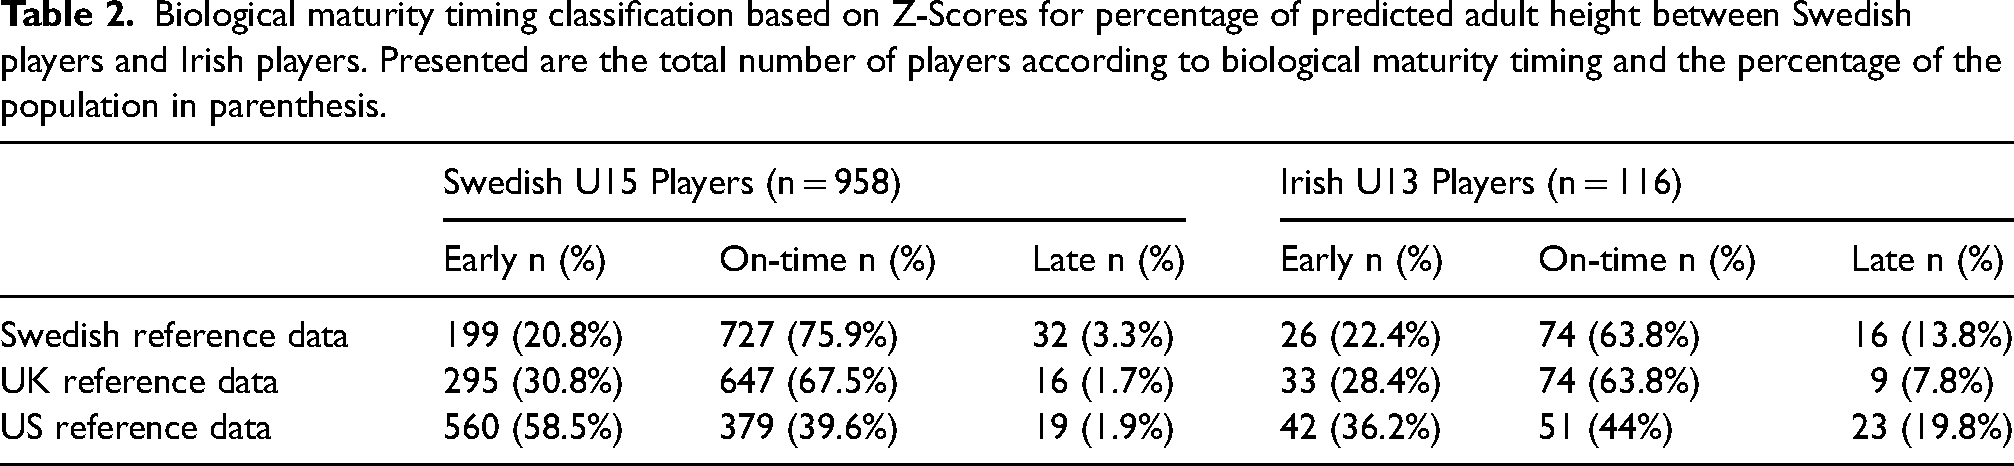
The results of the multinomial logistic regression analysis showed a significant influence of the reference population (US, UK, SWE) on the distribution of players across maturity categories (Early, On-time, Late) in the Swedish U15 cohort (χ² (4) = 347, p < 0.001, Figure 2). In particular, there was a higher proportion of athletes categorised as “Early” when classified using the US reference dataset compared to the UK and SWE datasets. For example, players classified using the US reference data were 5.7 times more likely to be classified as early compared to on-time, relative to players classified using the SWE reference data (odds ratio 5.7 (95% CI 4.7 to 7.0)). All odds ratios are available in Supplemental file 1.
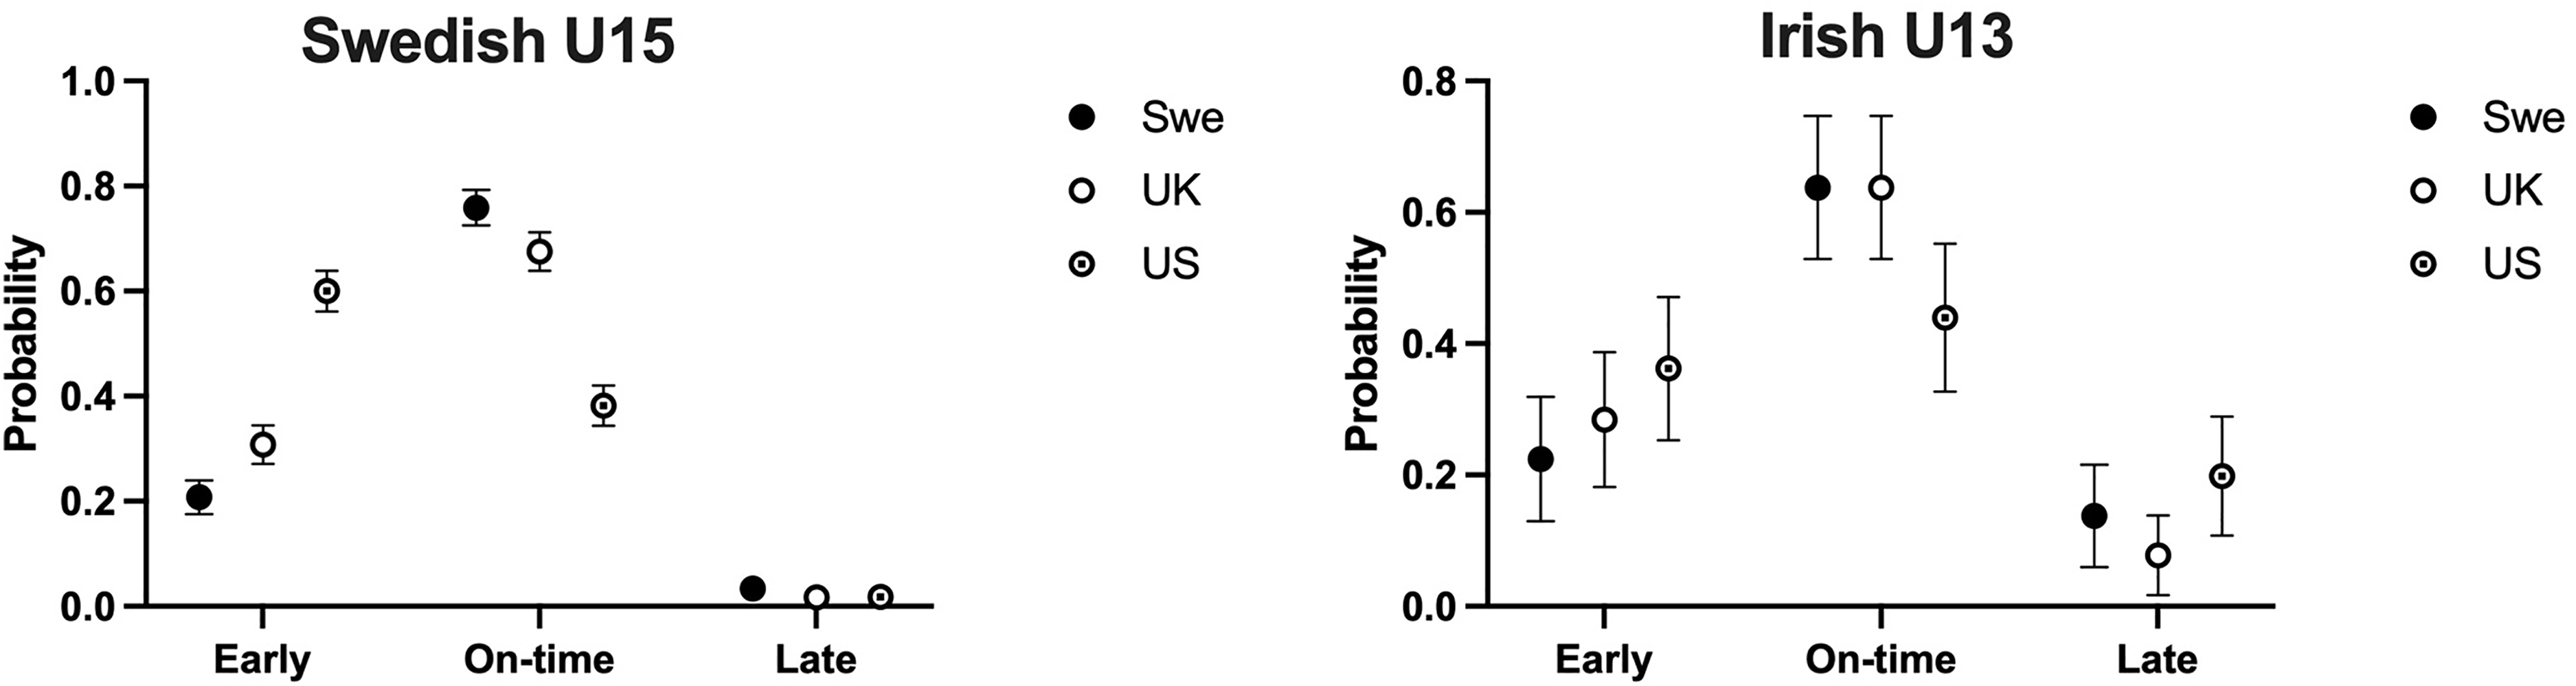
Estimated probabilities (95% confidence intervals) for the categories early, on-time or late maturity as dependent variables in different reference datasets (US, UK, SWE) in the Swedish U15 and Irish U13 cohorts. A multinomial logistic regression analysis was performed, with the reference dataset as the independent variable.
The choice of reference population also influenced the distribution of players across maturity categories in the Irish U13 cohort (χ² (4) = 15.7, p = 0.003, Figure 2). In particular, more players were categorised as “On-time” using both the SWE and UK reference datasets compared with the US dataset. For example, players classified using the UK reference data were 1.8 times more likely to be classified as on-time compared to early, relative to players classified using the US reference data (odds ratio 1.8 (95% CI 1.0 to 3.3)). All odds ratios are available in Supplemental file 1.
Of the total pool of players, 656 (61.1%) were classified as the same biological maturity timing using all three growth reference datasets, meaning that 418 players (38.9%) were classified differently by biological maturity timing depending upon which growth reference dataset was used. The mean and SD values for the percentage of predicted adult height between ages 4–17 years between the growth reference datasets are presented in Figure 3.
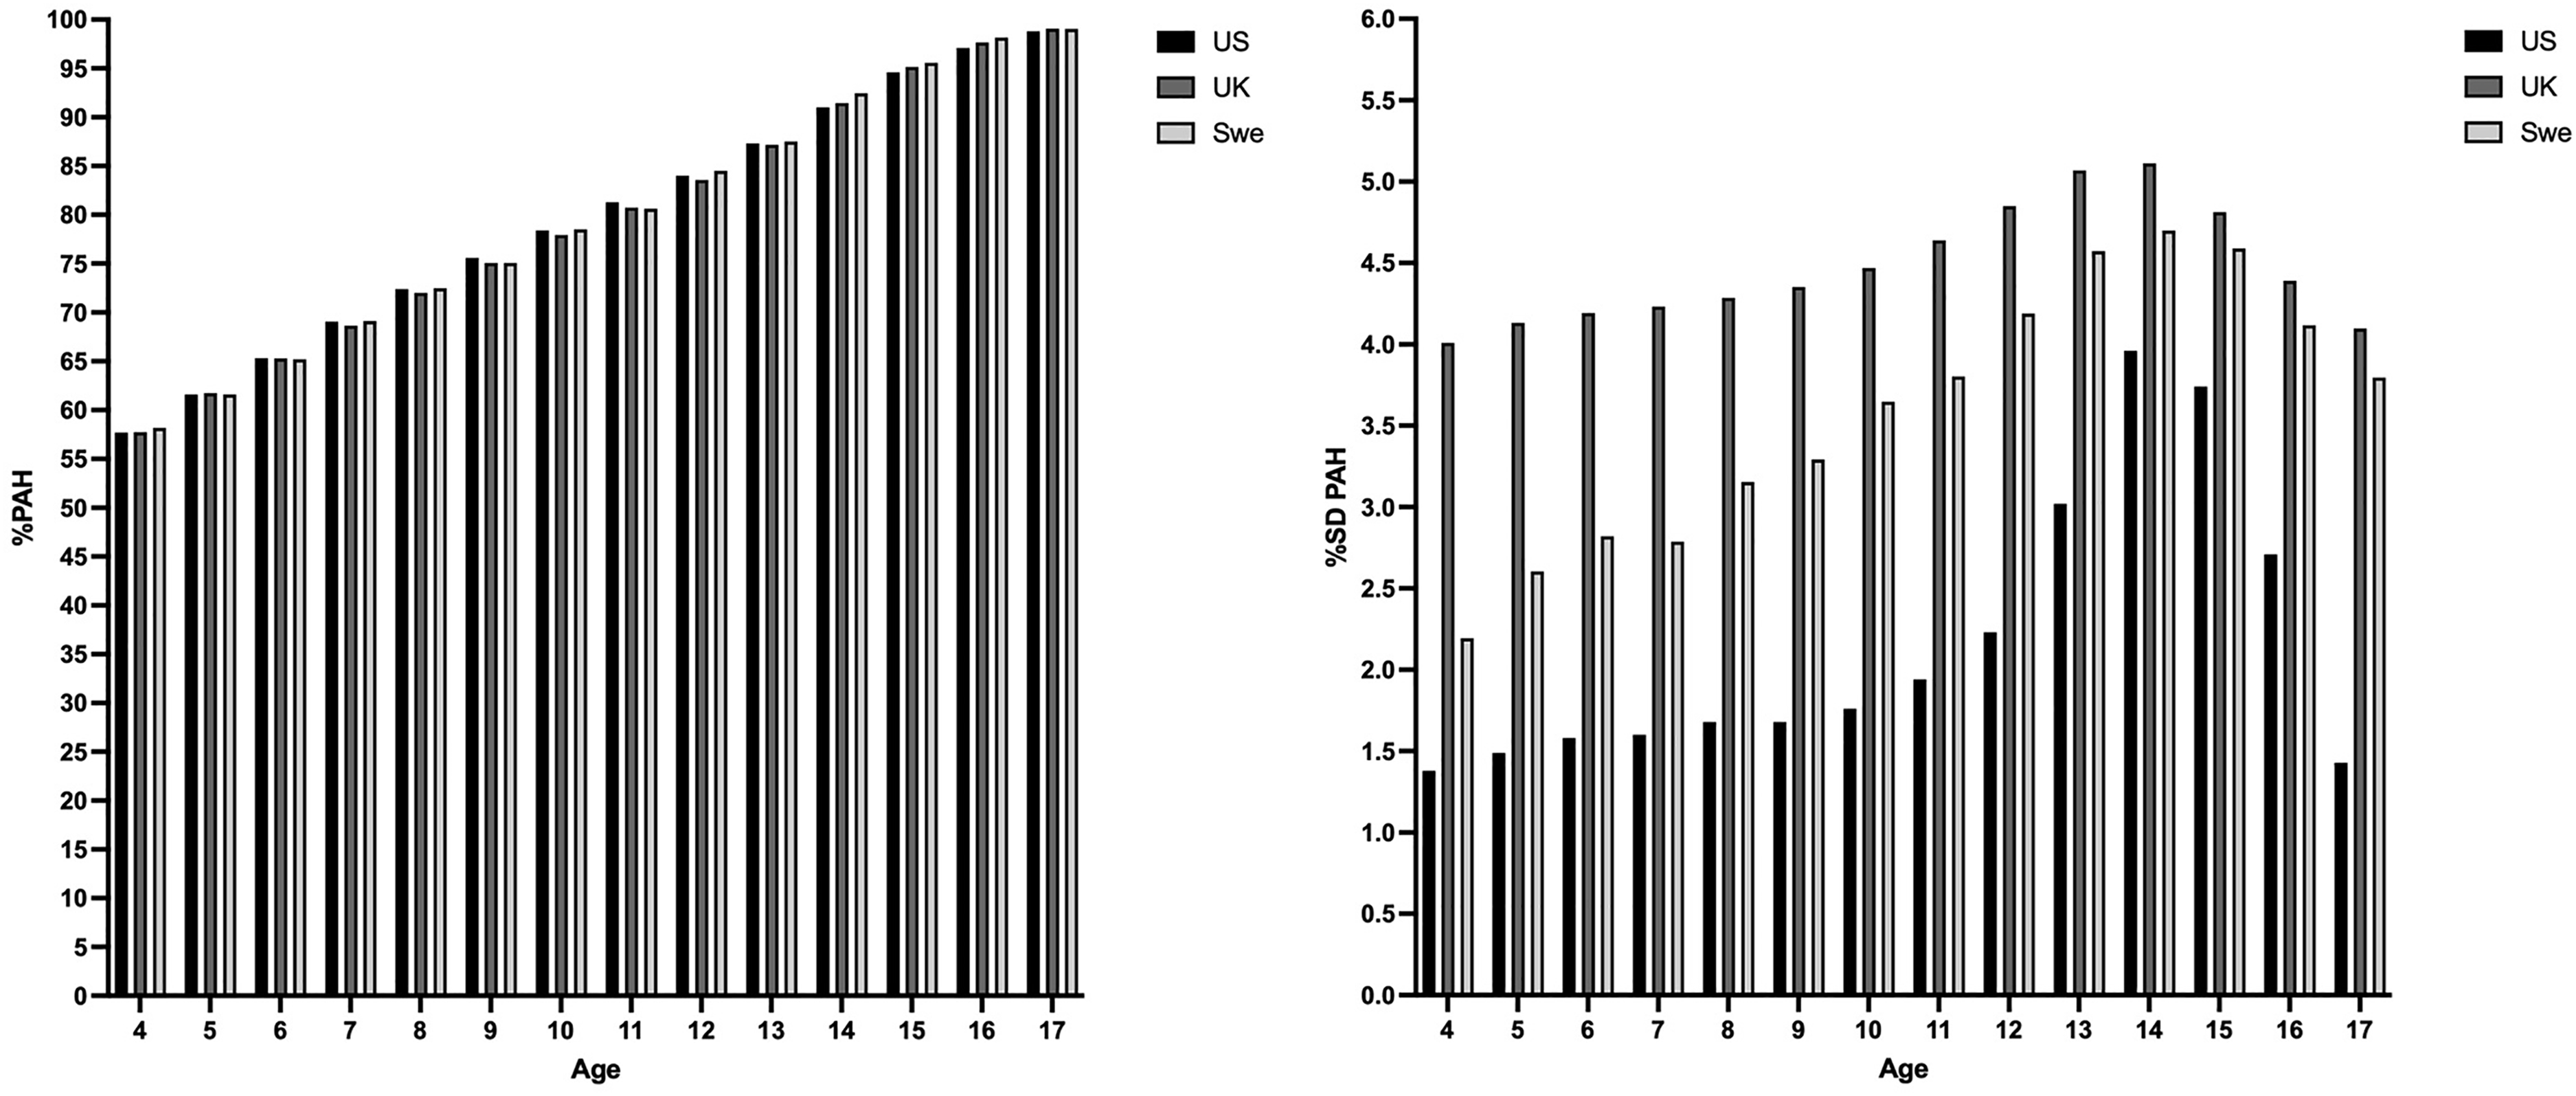
Mean and SD values for the percentage of predicted adult height from age 4–17 years between the UK, US and Swedish growth reference datasets. The UK growth reference dataset was derived from data collected on >24,000 healthy children born in the UK. The Swedish growth reference datasets was derived upon longitudinal studies of 3650 healthy Swedish-born children. The US growth reference dataset was derived from 61 American infants born in the US.
Magnitude of the biological-maturity-related bias across reference datasets
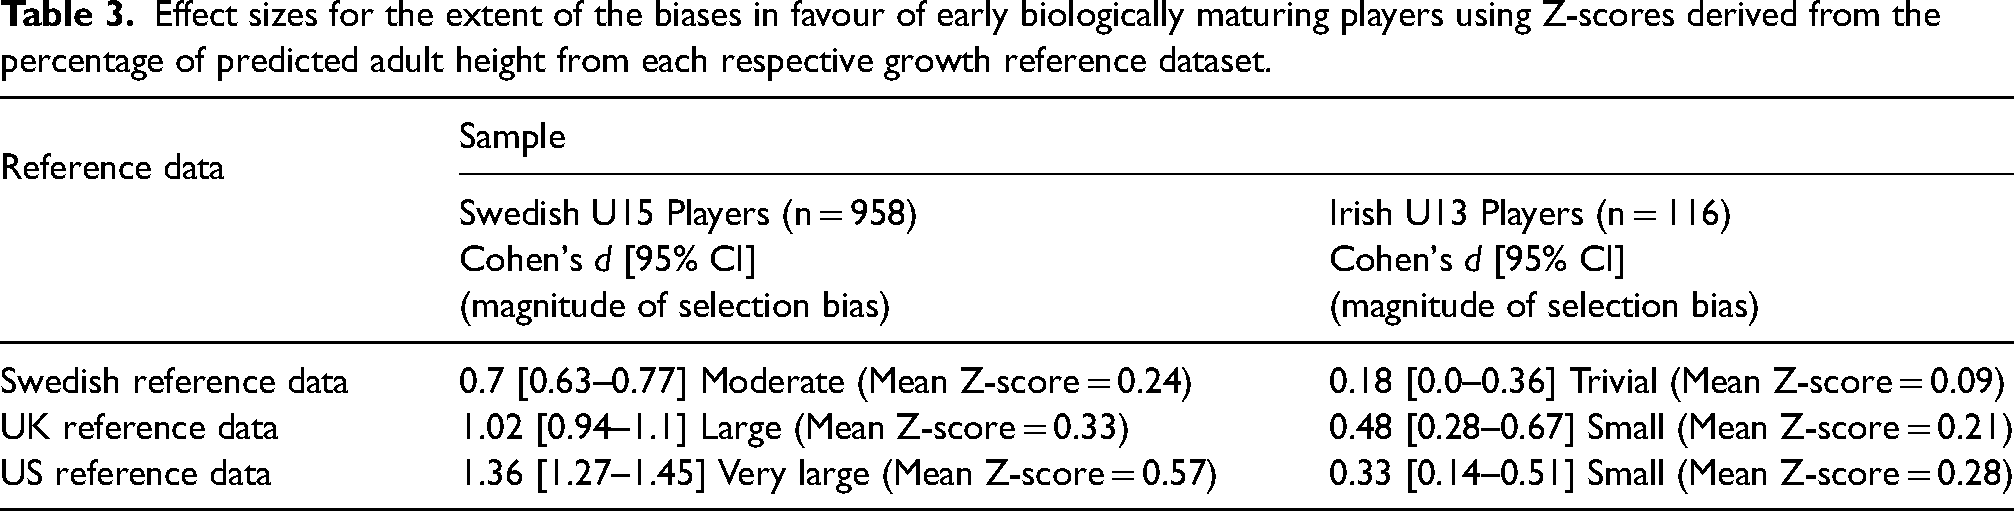
In the sample of Swedish players, the mean biological maturation Z-score was significantly greater than the expected value (Z-Score = 0.0) using all three growth reference datasets (p < 0.001) (Table 1). However, the magnitude of the statistically significant maturation biases ranged from moderate using the Swedish growth reference data (Cohen's d = 0.7), to large using the UK growth reference data (Cohen's d = 1.02), to very large using the Berkeley (US) growth reference data (Cohen's d = 1.36) (Figure 1, Table 3). In the sample of Irish players, small but significant maturation biases were observed in favour of early maturing players using the UK growth reference data (p < 0.001, Cohen's d = 0.48) and the US reference data (p < 0.001, Cohen's d = 0.33), but no significant biological maturation bias was observed using the Swedish growth reference data (p = 0.061, Cohen's d = 0.18).
Effect sizes for the extent of the biases in favour of early biologically maturing players using Z-scores derived from the percentage of predicted adult height from each respective growth reference dataset.
Discussion
The purpose of this study was to examine the variation in classifying a sample of national-level youth soccer players according to biological maturity timing (Z-scores) using a variety of nation-specific and alternative growth reference datasets, including the dataset from the Berkeley growth longitudinal study as traditionally used across the literature.6,11,18,20–22,37 In the current sample of >1000 national youth soccer players, there were significant differences in the maturity timing classification of players between all three growth reference datasets. In this regard, nearly 40% of the total sample were categorised differently according to their biological maturity depending upon which reference dataset was used. Thus, the reference data used has a significant influence on how biological maturity timing is classified in adolescent soccer players.
Of the soccer-specific literature that has used Z-scores to examine biological maturation timing in youth players derived from their percentage of predicted adult height, the vast majority has used the Berkeley growth reference dataset.6,11,18,20–22,37 For example, using this dataset to examine the variation in maturation in 202 U9–U16 English male academy players, Hill and colleagues identified a selection bias in favour of early maturing players that emerged from the under 12 age-group, increasing linearly with chronological age, with no late maturing players remaining within the system in the Under 15 and 16 cohorts. 6 Using the same dataset as the reference, Cumming et al. noted that a selection bias existed in favour of early maturing youth players in four separate English professional academies, with a linear increase in mean athlete Z-scores observed from the U12–U15 age groups. 37 Indeed, in recent work with national and international youth soccer players in Ireland, Sweeney and colleagues have found similar trends using the same dataset, with selection biases in favour of early maturing players emerging at the Under 13 cohort and increasing in magnitude with age, with late maturing players absent from the national talent development system by the Under 15 age group. 22
Multinomial logistic regression showed that there were significant differences in the classification of youth players depending on which reference dataset was used to derive the Z-scores. This will inevitably affect subsequent estimates of maturity-related biases. For instance, in the sample of 958 Under 15 Swedish players, there were significant and very large (d = 1.36) biases in favour of early maturing players using the Berkeley growth reference data, but only moderate (d = 0.7) biases when using nation-specific (Swedish) and more recent data as the reference. In this regard, the mean Z-score was reduced by more than 50% in Swedish players when using the Swedish reference data compared to the Berkeley reference data (0.57 vs. 0.24).
Significant and very large biases in favour of early maturing players have previously been observed in similar youth soccer contexts using the Berkeley growth reference data.6,22 Consistent with this, the mean Z-scores in both the Irish U13 and the Swedish U15 players were largest when using the Berkeley growth reference data (Table 1 and Figure 1). The higher Z-scores when using the Berkeley growth reference data compared to the other datasets can likely be explained by the differences in the percent standard deviation (%SD) for the percentage of predicted adult height, which is significantly lower in the Berkeley reference data than in the UK or Swedish reference data (Figure 3). For instance, at age 12, the %SD for predicted adult height is ∼2% using the Berkeley data and ∼5% using the UK data. This is particularly interesting, given that the percentage of predicted adult height values (means) between all three datasets are notably similar (Figure 3). With a normally distributed growth data set, the only possible explanation is that the sample used in the Berkeley growth reference data was more homogeneous than that used in the UK and Swedish reference data, resulting in the significantly larger Z-scores (mean difference divided by the standard deviation of the reference population) when applied to the population in this study, as well as those in previous studies with participants from other populations. This also raises several questions regarding the extent to which this sample is representative of the general population in the US.
Similarly, it is important to note that cohorts of athletes, such as our sample of Swedish Under 15 national soccer players, often show greater homogeneity compared to broader reference populations. Using the same age criteria as the Swedish reference data 26 — focusing on individuals born within 3 months of the decimal age of 15.0 years — we found that our sample was both taller and heavier (175.5 cm and 63 kg versus 172.4 cm and 59.8 kg). However, the standard deviations for both height and weight were lower in our sample of national youth soccer players (7.3 cm and 8.2 kg) than that of the general population sample (8.2 cm and 10.7 kg). 26 This suggests that athlete samples deviate from general population values, and they do so in a more consistent manner, which has implications for how we interpret and apply reference data in this setting. For this reason, researchers and practitioners must ensure that the limitations of the reference data used are acknowledged when reporting Z-scores for biological maturity timing. In a practical context, to mitigate against the issue of significant differences in %SD between reference data sets, a greater emphasis on %PAH (i.e., biological age) within the reference data compared with chronological age could be utilised. This approach would provide clarity on a player's biological maturation timing without relying too heavily on the %SD of the dataset. Another advantage of this approach may be that the concept of biological age relative to chronological age (biological maturity timing) may be easier for coaches and practitioners to understand in comparison to Z-scores (i.e., the standard deviation difference between observed maturity status and expected maturity status). In this regard, we would suggest the use of biological to chronological age offset as an alternate indicator of biological maturity timing, instead of implementing Z-scores.
There is also a need to critically consider the participant sample in the Berkeley reference data and its applicability when applied to alternate contexts. This participant sample consisted of American infants born disease-free between 1928–1929 in two separate hospitals in Berkeley, California, to Caucasian parents of northern European descent. However, it is now well established that growth and stature differ notably between humans of different nationalities and ethnicities, 24 with humans now beginning puberty earlier 27 and are larger in body stature and mass by adulthood than those born in previous decades.26,34 For example, between 1973–1975 compared to 1955–1958, Swedish male adults were on average 1.9 cm taller and 5.7 kg heavier, 26 and these average adult height values have since increased again in recent analyses. 34 Furthermore, using datasets derived on Caucasian children of northern European decent to estimate biological maturity timing in non-Caucasian/children of non-northern European decent must be considered as a significant limitation. Notwithstanding, there is also a need to consider the very limited sample size used in the Berkeley dataset (an original sample size of 61, 31 of which were male, which was then reduced further to a sample of 24 boys from age 12) compared to those used in clinical settings, such as the UK 1990 growth data (n = >24,000 participants from combined studies) or the Swedish 2000 growth reference data (n = 3650).
Implications
Overall, we suggest several core implications for practice and research. Firstly, it is important to state that none of our findings discredit previous research pointing to significant selection biases towards those that are early biologically maturing using the Berkeley reference dataset. For example, Hill et al. 6 and Sweeney et al. 22 found significant biases in favour of early maturing youth soccer players in the respective talent development systems studied; a bias that emerged at ∼12 years of age and increased in magnitude with chronological age and the level of competition. Using the gold standard method to examine biological maturity status, skeletal X-rays, Johnson et al. 9 found the same trends in an English Premier League academy. Moreover, in the present study, regardless of the reference dataset used, late maturing players are still significantly underrepresented in the Irish and Swedish national systems in the age groups under study. For example, regardless of the reference dataset used, late maturing players still only constitute 1.7–3.3% of U15 Swedish players selected at the national level. In the sample of Swedish players, early maturing players are between 6.3 to 30.7 times more likely to be selected than late maturing players (Figure 1 and Table 2). In this regard, late biological maturation appears to be one of the strongest pull factors inhibiting selection into soccer talent development systems for male youth. 5 Yet, advanced biological maturation should be seen as a single, though powerful, factor, conferring relative early advantage and thus selection advantage for individual athletes.
The use of discrete categories such as ‘on-time, ‘late’ or ‘early’ to classify the degree of biological maturity should also be treated with significant caution. This is especially the case for athletes who are close to cut off points, which oversimplify the complexity of biological maturation, which is a continuous, rather than staged process. 8 The cut-off points used to define the categories are arbitrary and there is a risk of placing too much emphasis on which side of a cut-off point an athlete falls rather than looking holistically at their developmental trajectory and the range of other biopsychosocial factors that confer relative advantage or disadvantage.2,5 If this labelling is based on the use of Z-scores referenced against the Berkeley dataset, at a minimum there is reason to doubt the validity of these labels. Whilst discrete biological maturity classifications have pragmatic value in operational sporting environments where clear systematic boundaries (even if flexible) sometimes need to be created, for example, when devising eligibility criteria for selection into a national Future Team,30,31 they have limited ability to capture the nuances of biological maturation. This also means that coaches and practitioners need to understand the notion of biological maturation on a continuum, rather than by category.
Although we have highlighted the limitations of the use of Z-scores based on reference data, meaningful conclusions can still be drawn when focusing on data trends at the population level. For example, comparing Z-scores across age groups can reveal when biological maturity-related biases become significant within a talent system. Even within a single sample, comparing tails (i.e., the most mature and the least mature individuals) can offer insight independent of external reference data. Using internal reference values for robust comparisons further strengthens the interpretation of Z-scores. If Z-scores are consistently higher in older age groups (e.g., U15 versus U13), this suggests the presence of, or larger, selection biases in older age groups. In cases where only a single Z-score is available, the extent of biological maturity-related biases remains more uncertain. Researchers and practitioners can address this by focusing on trends and differences within the population under study, rather than relying only on absolute values. As indicated above, these findings do not mean that Z-scores do not have practical utility, but instead, the findings highlight the limitations of using Z-scores and demonstrate the large variations in athlete classification depending on the reference dataset used.
It should also be noted that we examined variation in athlete classification by biological maturity using Z-scores in two different age cohorts (U13 and U15) from two countries (Sweden and Ireland). As outlined in Figure 3, the percentage of predicted adult height and %SD differ notably between age groups, and the extent of variation in athlete classification across and between Z-scores is likely to vary across different age groups. The majority of our sample was derived from one age group (under 15). Second, we used the non-invasive Khamis-Roche method to estimate biological maturity status; a predictive equation that is derived from samples of American youth of north-European ancestry and applied to non-American youth born in Ireland and Sweden, respectively. Moreover, parental heights for the prediction of adult height were self-reported, rather than measured, and subsequently adjusted for overestimation based on the equations outlined by Epstein et al. 33 which is a formula based upon participant samples from the United states and not validated in Irish or Swedish populations. There is a need for future studies to verify our findings using a broader range of age groups, contexts, nationalities, and ethnicities from early adolescence until late adulthood.
Conclusion
This proof of principle study investigated the variations in biological maturation (Z-scores and associated maturity categorization) in a sample of national youth soccer players using a variety of growth reference datasets. The results showed significant differences in athlete biological maturity classification between nation-specific and alternative growth reference datasets. While the findings highlight the practical and research limitations of using Z-scores derived from athlete percentage of predicted adult height to classify youth athletes by biological maturity timing, Z-scores can still be valuable if used judiciously at the population-level. We urge researchers and practitioners to interpret athlete Z-score data with caution, particularly if such data is used to inform resource allocation or athlete selection decisions. Finally, we suggest that if using Z-scores to classify youth athletes by biological maturity, nation-specific and the most up to date reference data is used, preferably alongside internal reference values of the population under study.
Supplemental Material
sj-pdf-1-spo-10.1177_17479541241277661 - Supplemental material for Selection of reference data significantly influences biological maturity timing classification in national youth soccer players
Supplemental material, sj-pdf-1-spo-10.1177_17479541241277661 for Selection of reference data significantly influences biological maturity timing classification in national youth soccer players by Liam Sweeney, Áine MacNamara, Jamie Taylor and Tommy R Lundberg in International Journal of Sports Science & Coaching
Footnotes
Acknowledgements
The authors would like to thank the Swedish Football Association and the Football Association of Ireland for their assistance in this research.
Data availability
The raw data supporting the conclusions of this article will be made available upon reasonable request to the corresponding author.
Declaration of conflicting interests
The author(s) declared the following potential conflicts of interest with respect to the research, authorship, and/or publication of this article: TRL has received financial compensation from the Swedish Football Association for consultancy services related to the National Future's programme and coach education. LS, AM and JT declare that the research was conducted in the absence of any commercial or financial relationships that could be construed as a potential conflict of interest.
Funding
The authors received no financial support for the research, authorship, and/or publication of this article.
Supplemental material
Supplemental material for this article is available online.
References
Supplementary Material
Please find the following supplemental material available below.
For Open Access articles published under a Creative Commons License, all supplemental material carries the same license as the article it is associated with.
For non-Open Access articles published, all supplemental material carries a non-exclusive license, and permission requests for re-use of supplemental material or any part of supplemental material shall be sent directly to the copyright owner as specified in the copyright notice associated with the article.