
Abstract
Talent identification of young soccer players is a significant consideration for elite youth soccer organisations, with decisions on players often being made based on the subjective expert opinion of scouts and coaches. Previous research has suggested that scouts and coaches purportedly consider a multitude of factors before arriving at their decisions. However, to date, limited research exists regarding how coaches evaluate player potential within such organisations and how the consideration of further data may influence such evaluations of a player's future potential. Therefore, the aim of this study was to present ratings of perceived potential in an elite youth soccer academy and explore the relationships between a player's perceived potential, athleticism, and perceived level of current match performance. Using 181 player observations, findings demonstrated that ratings of players’ perceived potential decreased within older age groups and were the lowest in the senior academy age group (U18). Furthermore, a mixed effects ordinal regression model suggested that coaches’ perceptions of a player's future potential demonstrated strong relationships with current match performance and athleticism. Increases in a player's mean match rating significantly increased the odds of them being perceived to have higher potential and increases in athleticism also demonstrated a positive relationship with increased perceptions of potential. The findings have implications for youth soccer organisations, providing insight into the distribution of ratings of potential within an elite youth soccer academy, and demonstrating that further data (match performance and athleticism) is related to, and may influence, coaches’ perceptions of player potential.
Keywords
Introduction
Identifying and developing talented young soccer players is a key aim for elite youth soccer academies. Talent identification (TID) involves the discovery of young players perceived to have the potential for future success1,2 and can occur as early as 8 years of age in soccer, resulting in entry to a soccer academy. Talent development (TD) aims to provide a suitable learning environment to accelerate player potential towards the elite level through exposure to highly professionalized coaching, training, and support systems.1,2 During the TID and TD process, players are often (de)selected at various stages of an academy pathway based upon their future potential, their development, and their performance within an academy programme. These TID, TD and (de)selection processes,1,2 are traditionally coach-driven, contingent upon the comprehensive and intuitive knowledge of a coach being channelled into a decision on what a talented player is and/or what a talented player needs. Multiple approaches exist within the current literature regarding TID and (de)selection processes, with data coming from a variety of multidisciplinary sources and assessment methods (e.g., signs, samples, subjective expert opinion; see. 3 However, minimal research exists exploring the information that coaches’ may (sub)consciously utilise and combine in their decision-making processes. 4
Previous research has called into question the validity of TID and (de)selection judgements based on the subjective expert opinion (SEO) of high-level coaches, highlighting an absence of structure in (de)selection processes and a lack of specific criteria upon which decisions are based. 5 Research has highlighted that coaches often utilise their gut instinct, making choices based on their own experience, personal taste, and their perceived ability to improve a player, rather than exclusively considering player potential and performance.6–8 Due to the difficulty in objectively quantifying an explicit measure of performance in a dynamic, open-skilled sport such as soccer, the perceived performance levels of players are often used to indicate differences in skill levels. 9 Whilst such an approach seems theoretically and practically suitable, such an approach often leads to the incorrect assumption that current performance is indicative of future potential.10,11 This highlights the need for further research exploring coaches’ ratings of potential and any possible relationships between perceptions of player potential and other performance metrics (e.g., match performance, athleticism).
Further, although coaches consider multiple attributes when forming their opinions,12–14 coaches SEO's are likely to be heavily influenced based on their observations of a player's performance in match situations.9,15,16 However, studies in youth soccer TID have demonstrated biases (e.g., relative age, maturity biases), leading to further confusion regarding performance and potential ratings.17,18 Extrapolating current performance as a measure of future skill level disregards the non-linear and individual nature of TD,19–21 leading to a higher risk of mis-identifying high potential, talented young athletes. Whilst non-linear individual development and the complexity of human judgement cannot be solved using one single approach, 22 there is a need for further research to understand how a coach's perception of current match performance, may influence their expectation and evaluation of future player potential.
Considering the limitations of purely subjective judgements, research has commonly used objective sources of data in examining TID, (de)selection, and TD processes.23–26 Due to the complex and multifaceted nature of soccer, objective data has generally fallen into specific domains (e.g., physical, technical, tactical, psychological, anthropometric, sociological 2 ); thought to relate to some element of soccer performance. Whilst a multidisciplinary approach considering all domains may be considered best practice, research within the physical domain is more commonplace.25,26 However, research has demonstrated that coaches are unable to accurately assess players’ physical abilities subjectively in both elite youth soccer 27 and rugby league, 28 perhaps suggesting a difficulty for coaches in subjectively evaluating the athelticisim of homogeneous groups. 27 Despite this, several research articles have highlighted an abundance of physical qualities in coaches' self-reported attributes deemed important for TID, TD, and (de)selection processes.12–16,29 Therefore, whilst it is unlikely that each distinct attribute (e.g., strength, speed, aerobic capacity) is accounted for in isolation by technical coaches, further research is required to determine if an athlete's physical qualities (i.e., athleticism) play a prominent role in coaches’ SEO and evaluations of future potential.
As previously highlighted, research has suggested that the use of clinical judgement (i.e., making decisions based solely on SEO in one's head30,31); may be at risk of several errors and (sub)conscious biases.9,31,32 Although the SEO of coaches is currently the primary method for TID and (de)selection within a soccer academy, limited research has explored how player's athleticism and match performance may affect perceptions of potential in elite youth soccer players. Such research would provide insight into the factors that contribute to the instinctual reasoning and tacit knowledge of coaches, that allows them to make their judgements.6,7,32 Therefore, this study firstly presented coaches’ ratings of perceived potential in elite youth male soccer players across the U12 to U18 age groups within a professional UK academy. Secondly, the study explored the relationship between academy soccer player's athleticism (i.e., combination of physical qualities) and coaches’ subjective ratings of players’ current match performance with coaches’ perceptions of future player potential.
Methods
Participants
Six academy coaches working full-time within an elite youth soccer academy participated in this study across 2020/21, 2021/22 and 2022/23 playing seasons. Each participant was a lead coach for an individual squad across the U12-U18 age groups. On average, the participants had been coaching for 16.5 ± 6.7 years and had worked within the current academy for a minimum of one year at the commencement of the 2020/21 season. Additionally, all coaches were qualified to a minimum of a UEFA B Licence and as such were considered a qualified, representative, and experienced sample of elite youth soccer coaches.
Ethics
As part of registration to the academy, players and their parents/guardians consented to data being collected and gatekeeper consent was provided by the academy for the study. Institutional ethical approval was granted by Leeds Beckett University (Ethics Application No: 119713) approving the study.
Design
During the three seasons data was collected on one hundred and one elite youth male soccer players registered to the academy. This resulted in player observations (n = 181) for outfield playing positions in the U12 (n = 13), U13 (n = 34), U14 (n = 51), U15 (n = 31), U16 (n = 26) and U18 (n = 26) age groups. Data was collected from competitive matches (match performance), fitness testing (athleticism), and multidisciplinary team (MDT) meetings (player potential), to allow relationships between match performance, athleticism, and potential for future success to be explored.
Measures
Fitness tests
Objective data was collected within the academy based upon four measures of athleticism, which were also recommended as part of a national strategy under the Elite Player Performance Plan (EPPP). 33 All tests were familiar to players and were conducted by practitioners from the academy's physical development department who provided verbal instructions and demonstrations to players. Tests were conducted in September, January and April of each season on an indoor third generation synthetic surface (3G) a minimum of 48 h following competitive fixtures. The battery of fitness tests chosen, are commonly used in elite youth soccer populations34–37 and their reliability has previously been demonstrated.38–41 Tests were conducted in the subsequent order, following a standardized warm-up protocol of light jogging, dynamic stretching and progressive familiarization attempts: countermovement vertical jump (CMJ), 42 twenty-metre linear sprint test (20 m), 35 modified version of the 505 change of direction test (505). 43 Additionally, a one-kilometre running time-trial (1KM)35,42 was undertaken (U15 age group and older only) which was not a part of the EPPP benchmark fitness testing battery but formed a regular part of players’ annual physical development programme. The 1KM permitted a low-cost, time efficient method to measure aerobic fitness, over a distance that has been utilised in previous soccer literature.37,44
For the CMJ athletes stood on dual force plates (ForceDecks Lite, Vald Performance, Brisbane, Australia) sampling at 1000 Hz, with their hands on their waist. Following a stance phase to determine bodyweight, 45 players were instructed to jump as high and as fast as possible following a self-selected countermovement depth. In the 20 m sprint test, players began in a standing start placed 1 metre behind the first timing gates (TCi System, Brower Timing System, Utah, USA). Players were instructed to maximally sprint through the timing gates without slowing before the final timing gate. Similarly, for the 505 test, players began from a standing start 1 metre behind the timing gates (TCi System, Brower Timing System, Utah, USA) and were instructed to maximally sprint to a line 5 metres away, change direction ensuring at least one foot made contact with the turning line, before sprinting back through the timing gates. For the 1KM, players were individually timed using a handheld stopwatch (Casio HS-80TW, Casio, Tokyo, Japan) completing a single lap of a custom 1 kilometre running track based at the academy's training ground. For the CMJ and 20 m tests, players completed 3 maximal trials, for the 505 players completed 4 maximal trials (turning twice on each leg), and for the 1KM players completed 1 maximal trial. Recovery periods were a minimum of 2 min following each trial for the CMJ, 20 m and 505 tests. The best value from each test for CMJ height (cm), 20 m time (s), 505 time (s) and 1KM time (s) were selected for subsequent analysis.
Total score of athleticism
The Total Score of Athleticism (TSA) was calculated through averaging a set of standardized scores (z-scores) from a series of tests (i.e., CMJ, 20 m, 505, 1KM) to provide a single score of general athleticism that is comparable within a squad or team. Z-scores were calculated by subtracting the sample mean from the player's best score and dividing by a sample standard deviation (SD) for each individual test. Sample means (benchmarks) and SDs were provided by the Premier League as part of the national fitness testing strategy for each individual age group, 33 with the exception of the 1KM where the mean and SD were the result of historical club data records. In situations where negative z-score values were indicative of superior performance (e.g., a 20 m time below the sample mean), z-scores were multiplied by −1 to transform negative values into positive values allowing for aligned polarity across individual tests contributing to the TSA. 46 The highest TSA of the corresponding season (across the four testing timepoints) was included for subsequent analysis as it theoretically represented a players best physical performance for that season.
Match ratings
Match ratings were collected for each player for each match they participated in. Coach ratings were assigned to each player based on their perceived level of match performance relative to other players of a similar age and skill level within the academy. Ratings were provided independently following each match by a single lead coach, within each respective age group, based on that coach's SEO, with no input from other staff members (i.e., the lead coach from the U12-U18 age groups provided the match ratings for players within their team). Ratings were conducted on a 7-point scale, with the following descriptors: 1 – below academy standard, 2 – approaching academy standard, 3 – meeting academy standard, 4 – exceeding academy standard, and 0.5 unit increments between each descriptor for players falling between standards. A seasonal mean match rating was utilised for analysis, as this represented general performance over multiple matches, discounting possible one-off or atypical performances from individual players. Additionally, a mean match rating was a variable utilised within the academy when comparing players, allowing some form of distinction between players with similar ratings, rather than players being dichotomised into groups based on a singular score from the match rating descriptors. Players had competed in a minimum of five matches per season, and for at least 40 min in their respective matches for the match rating to be included in analysis. The average number of match ratings per player per season was 20 ± 10, whilst the range for the number of match ratings was 5–46. Such coach-based ratings have been utilised in previous research,18,47,48 with coach subjective ratings demonstrating acceptable intra-rater reliability correlations (.50 ≤ rtt ≤ .85 29 ; but poor inter-rater reliability (ICC = 0.14, 95% CI = −0.04–0.39;. 49 Internal estimates demonstrated slight to moderate inter-rater reliability assessed via the Krippendorff's alpha coefficient (α = 0.34, CI = 0.12–0.53;. 50
Perceived potential
As part of MDT meetings conducted within the academy, coaches were asked to consider their perceptions of a player's future potential (i.e., the perception the player would have a successful career at the elite senior level). Similarly to match ratings, lead coaches for each age group were individually responsible for rating perceived future potential, following conversations with other coaches and support staff. Ratings demonstrated good absolute agreement, using a two-way mixed effect intraclass correlation coefficient (ICC = 0.84, p < 0.001) with the lead coach as a single rater, 51 indicating coaches were fairly consistent in their own repeated ratings of individual players’ potential. Ratings were based on a RAG + B (Red, Amber, Green, Blue) colour grading system, similar to ratings commonly used in team sport monitoring and decision-support systems, 52 and previous research relating to player ratings. 48 Blue ratings represented players with the highest potential, with Red ratings representing players perceived to have the least chance of achieving future elite status (i.e., lowest potential). Six MDT meetings were conducted per season with perceptions of a player's future potential provided in each meeting. The most frequent rating (mode) from the RAG + B system was used to represent coach's perceived potential for each individual player in each season.
Statistical analysis
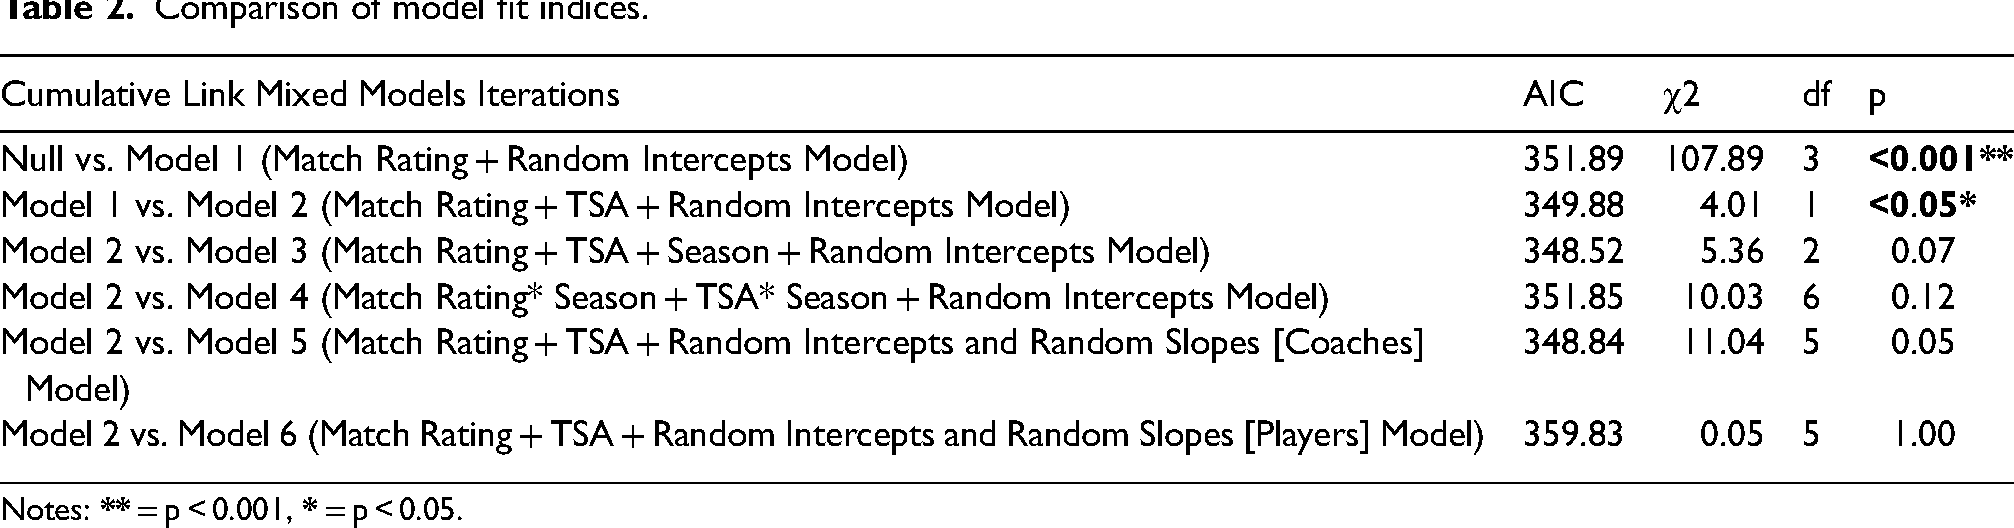
Data was analysed via R Studio. 53 Descriptive statistics were calculated representing the match rating and TSA associated with each level of perceived potential. A series of cumulative link mixed models using maximum likelihood estimates were fitted using the R package ordinal. 54 Cumulative link mixed models (CLMM) are a type of ordinal regression which permitted analysing the ordinal response variable (perceived potential), whilst accounting for the hierarchical structure of the data, with observations nested within coaches.
Ordinal regression permitted the dependent variable (perceived potential) to be treated as an ordered categorical variable (with a non-equidistant relationship), without being falsely modelled as a continuous or unordered response. This method modelled the relationships between the variables and predicted the probability of an observation (player) being classified at a specific level of perceived potential, based upon their mean match rating and TSA values. Perceived potential labels (RAG + B) were transformed to adapt to ordinal regression and reassigned values of: Red = 1, Amber = 2, Green = 3, Blue = 4. A forward stepwise approach to the models was undertaken, starting with a basic null (intercept only) model, before adding parameters in a stepwise fashion, comparing model fit following each iteration. 55 Likelihood ratio tests and the Akaike Information Criterion (AIC) were used as measures to assess goodness-of-fit, with the AIC accounting for the number of parameters estimated and correcting for model complexity. 55 If additional parameters did not improve model fit, they were removed from the subsequent iteration. The first model included only the response variable (perceived potential), without the addition of any predictors variables (Null Model). This model represented a reference point to evaluate the performance and significance of more complex models. A second model was then fitted with the first predictor variable (Match Rating) and random intercepts, allowing for individual variation based on the repeated measurements of individual players by individual coaches (Model 1). In the third model, the second predictor variable (TSA) was included as a fixed effect (Model 2). The fourth model added season as a fixed effect and included any interaction effects with both match rating and TSA, in order to determine if any associations with the predictors and the outcome perceived potential differed across seasons (Model 3). Finally, Models 5 and 6 were fitted with match rating and TSA with random effects for coaches (Model 5) and players (Model 6), allowing their slopes to vary to determine if the effects of match rating and TSA differed between individual coaches and players when assessing perceived potential.
Results
Table 1 presents the mean and SD for match ratings and TSA, for each level of perceived potential rating (Red, Amber, Green, Blue), within each age group. Whilst sample sizes were small for some groups this reflects the applied nature of the study and was considered within the statistical analysis applied.
Descriptive statistics showing means (M) and standard deviations (SD) of match ratings and TSA across levels of perceived potential within age groups.
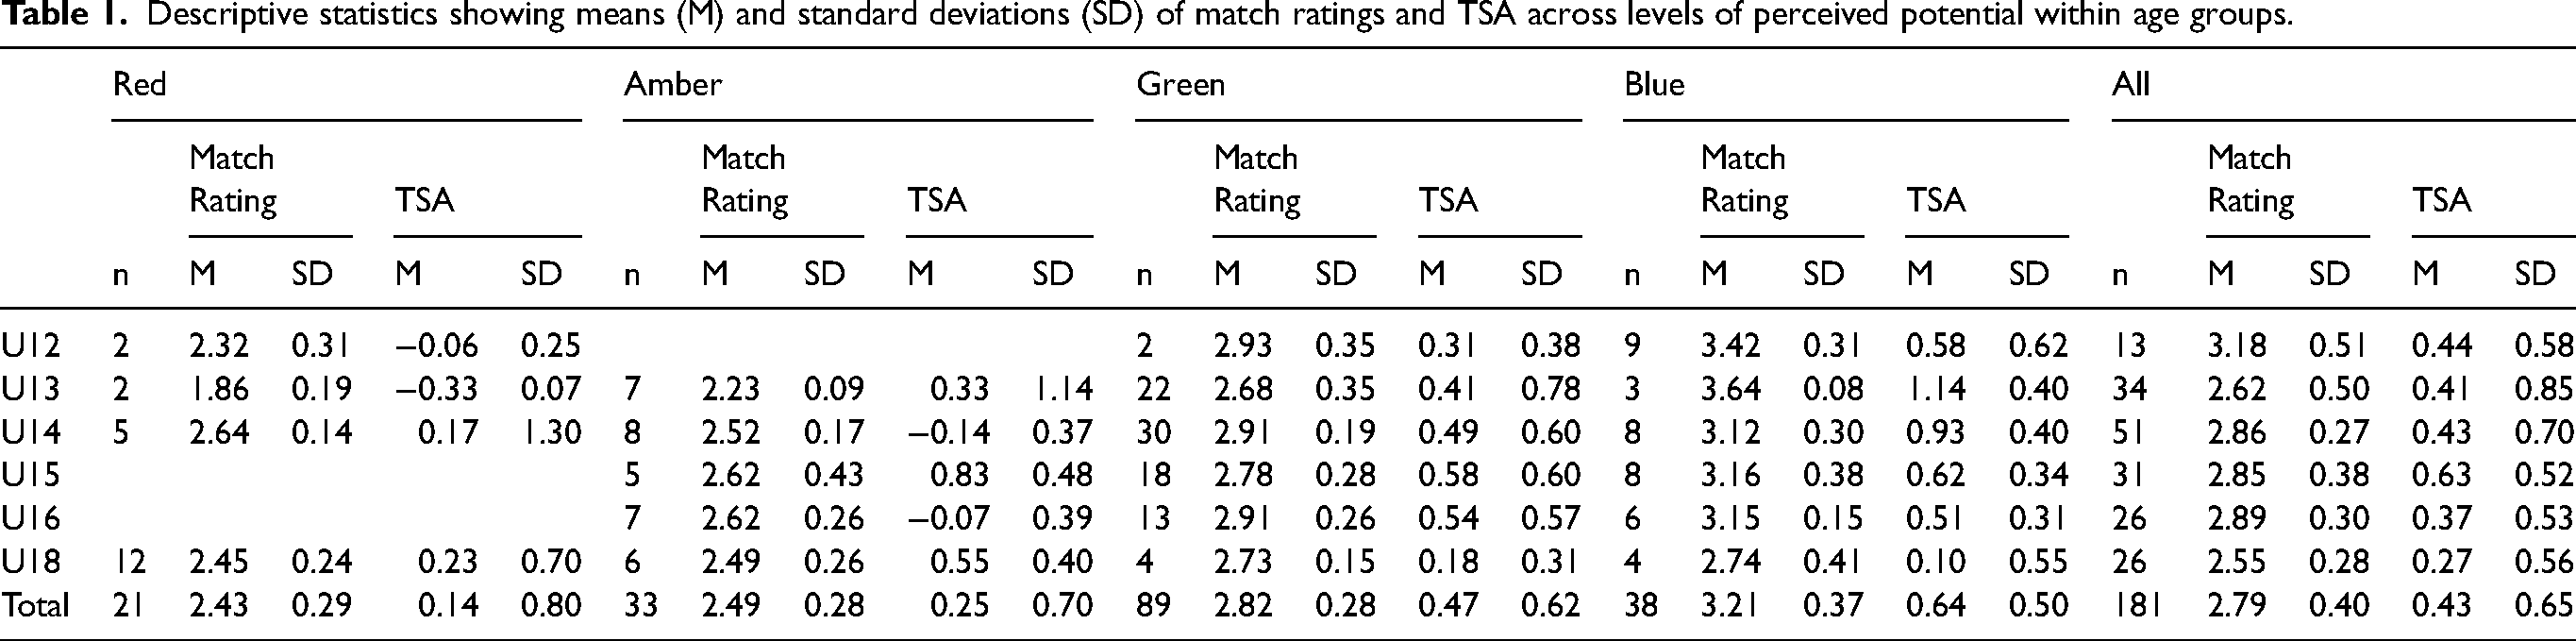
When observing match ratings, the U18 age group had the lowest overall mean match rating based on all levels of potential (2.55 ± 0.28) with the highest mean match rating occurring in the U12 age group (3.18 ± 0.51). The U18 age group also had the lowest overall mean TSA (0.27 ± 0.56), with the U15 age group demonstrating the highest overall mean TSA (0.63 ± 0.52).
In relation to perceived potential ratings, a green rating had the highest total frequency (n = 89; 49.2%), followed by blue (n = 38; 21.0%), amber (n = 33; 18.2%) and red (n = 21; 11.6%). Figure 1 shows the distribution of perceived potential ratings across the age groups. The U12 age group had the highest tally of blue perceived potential responses (n = 9), with the U18 age group recording the highest tallies for the lowest perceived potential (Red, n = 12). Of note, no players playing in the U15 or U16 age groups across the three seasons were ever regarded as having the lowest perceived potential (Red).
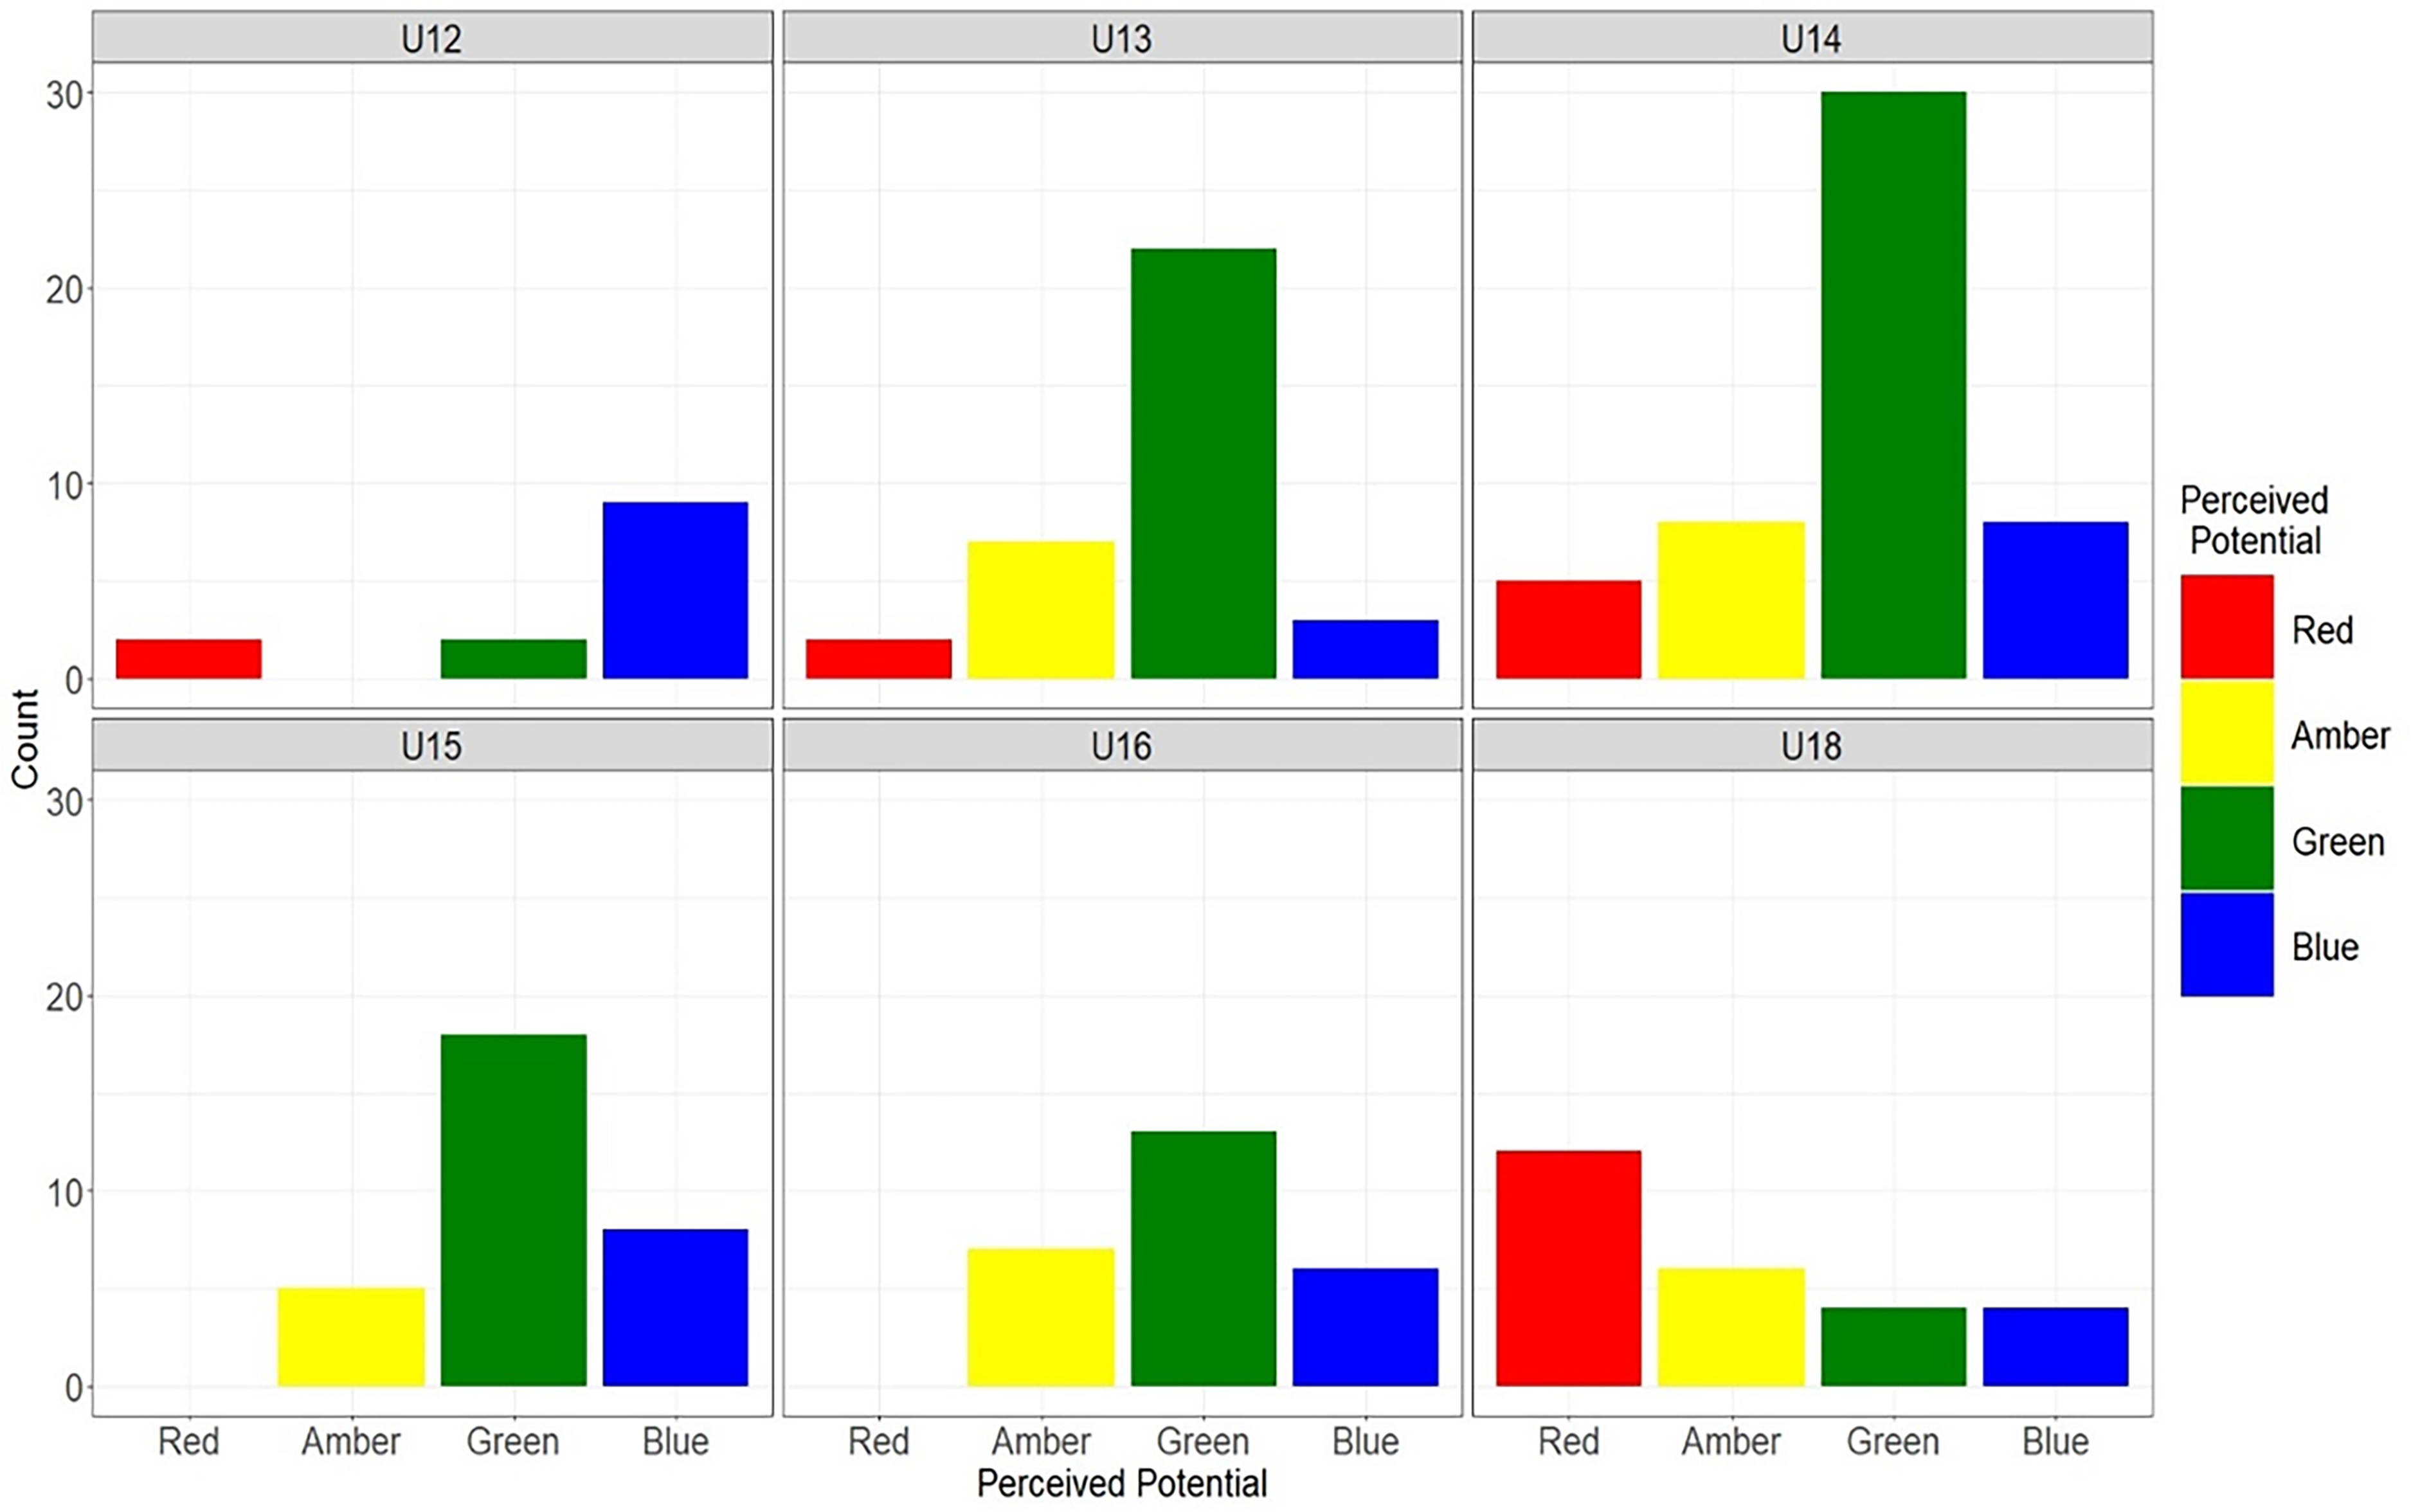
Frequency counts of the dependent variable Perceived Potential across age groups. Red = Lowest Perceived Potential, Blue = Highest Perceived Potential.
Ordinal regression was used to explore the relationships between player potential, match performance and TSA. Model selection based on the AIC resulted in Model 2 being treated as the final model. Table 2 highlights comparisons between the CLMM's following each iteration against the best fitting model. Model 2 had a high degree of model fit (AIC = 349.88) and provided a significantly better fit than the null model (AIC = 453.78; χ2 = 111.90, df = 4, p < 0.001), and Model 1 (AIC = 351.89; χ2 = 4.01, df = 1, p < 0.05). Model 3 did not improve significantly upon Model 2 (χ2 = 5.36, df = 2, p > 0.05) but resulted in a lower AIC (AIC = 348.52). However, Model 2 was chosen as the most parsimonious model, providing a good balance between model complexity and fit. The addition of interaction effects for season (Model 4), random effects for match rating and TSA within coaches (Model 5), and random effects for match rating and TSA within players, failed to improve upon Model 3. This suggests that the effects of season and allowing the slopes for match rating and TSA to vary per individual coach and player, had no significant effect on improving the modelled relationship between the variables and perceived potential. Additionally, a correlation coefficient of 0.22 between the predictor variables (Match Rating and TSA) suggested that use of the CLMM accurately captured the relationships between variables with no effects of multicollinearity amongst the predictor variables.
Comparison of model fit indices.
Notes:
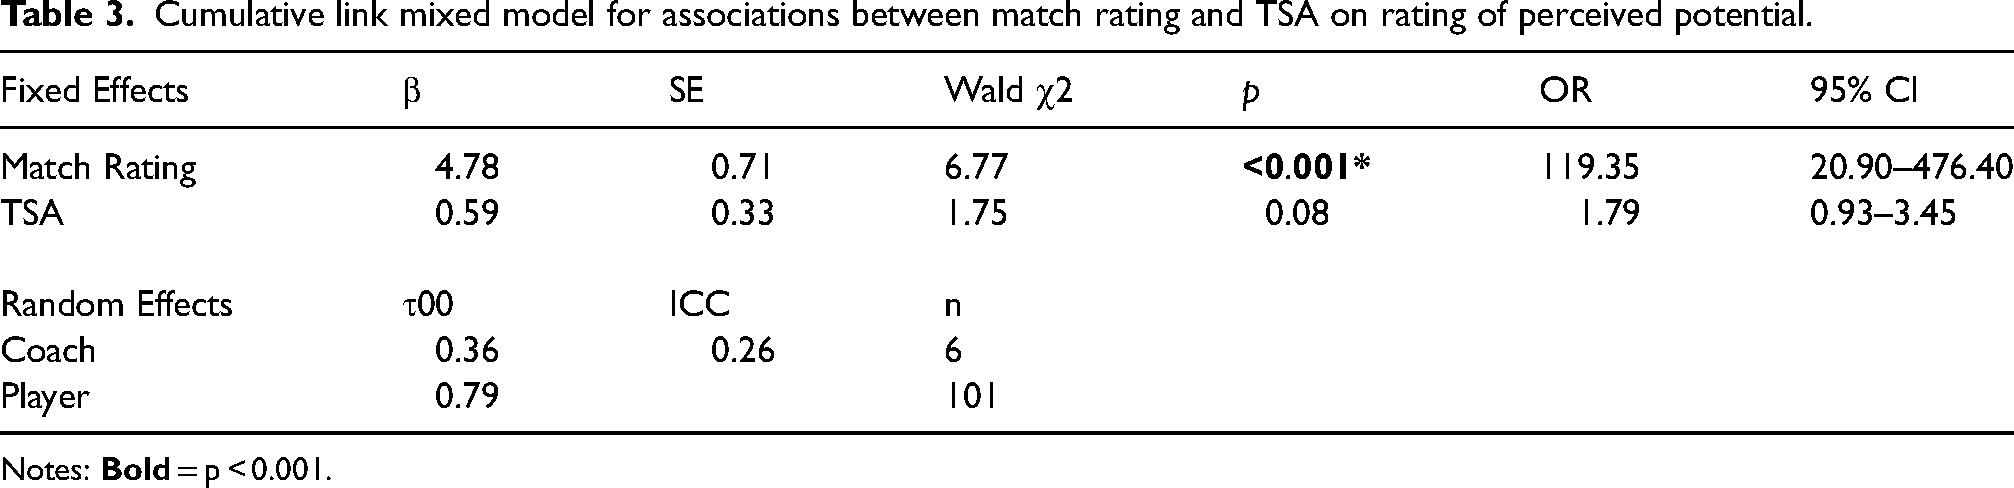
The final model chosen (Model 2) was fitted as a CLMM with the Laplace approximation, modelling the relationship between the predictors match rating and TSA and the ordinal response variable perceived potential. The model incorporated random intercepts for the grouping variables coach and player, which represented repeated measures within individual coaches players. Model fit statistics are presented in Table 3 including the coefficients for fixed effects (β), their standard error estimates (SE), their significance (p) assessed via the Wald statistic (Wald χ2), and finally the calculated odds ratios (OR) and their 95% confidence intervals (CI). Random intercept variance (τ00), intraclass correlation coefficient (ICC) and number of individual players (n) are also presented for the random effect of player.
Cumulative link mixed model for associations between match rating and TSA on rating of perceived potential.
Notes:
Considering the fixed effects, Model 2 demonstrated a significant positive association between match rating and being perceived in a higher category of potential (β= 4.78, SE = 0.71, p < 0.001, 95% CI = 3.40–6.17). The odds ratio for match rating was 119.35 (95% CI = 20.90–476.40). This suggests that for every one-unit increase in mean match rating, the odds of individual players being perceived in a higher potential category are over 100 times greater, indicating a strong positive association between higher match ratings and the likelihood of being perceived as a higher potential player.
Predicted probabilities demonstrating the relationship between match rating and perceived potential are presented in Figure 2 which highlights a non-linear relationship between match rating and level of perceived potential. The highest probabilities of being perceived in each category occur simultaneously with increasing mean match rating scores.
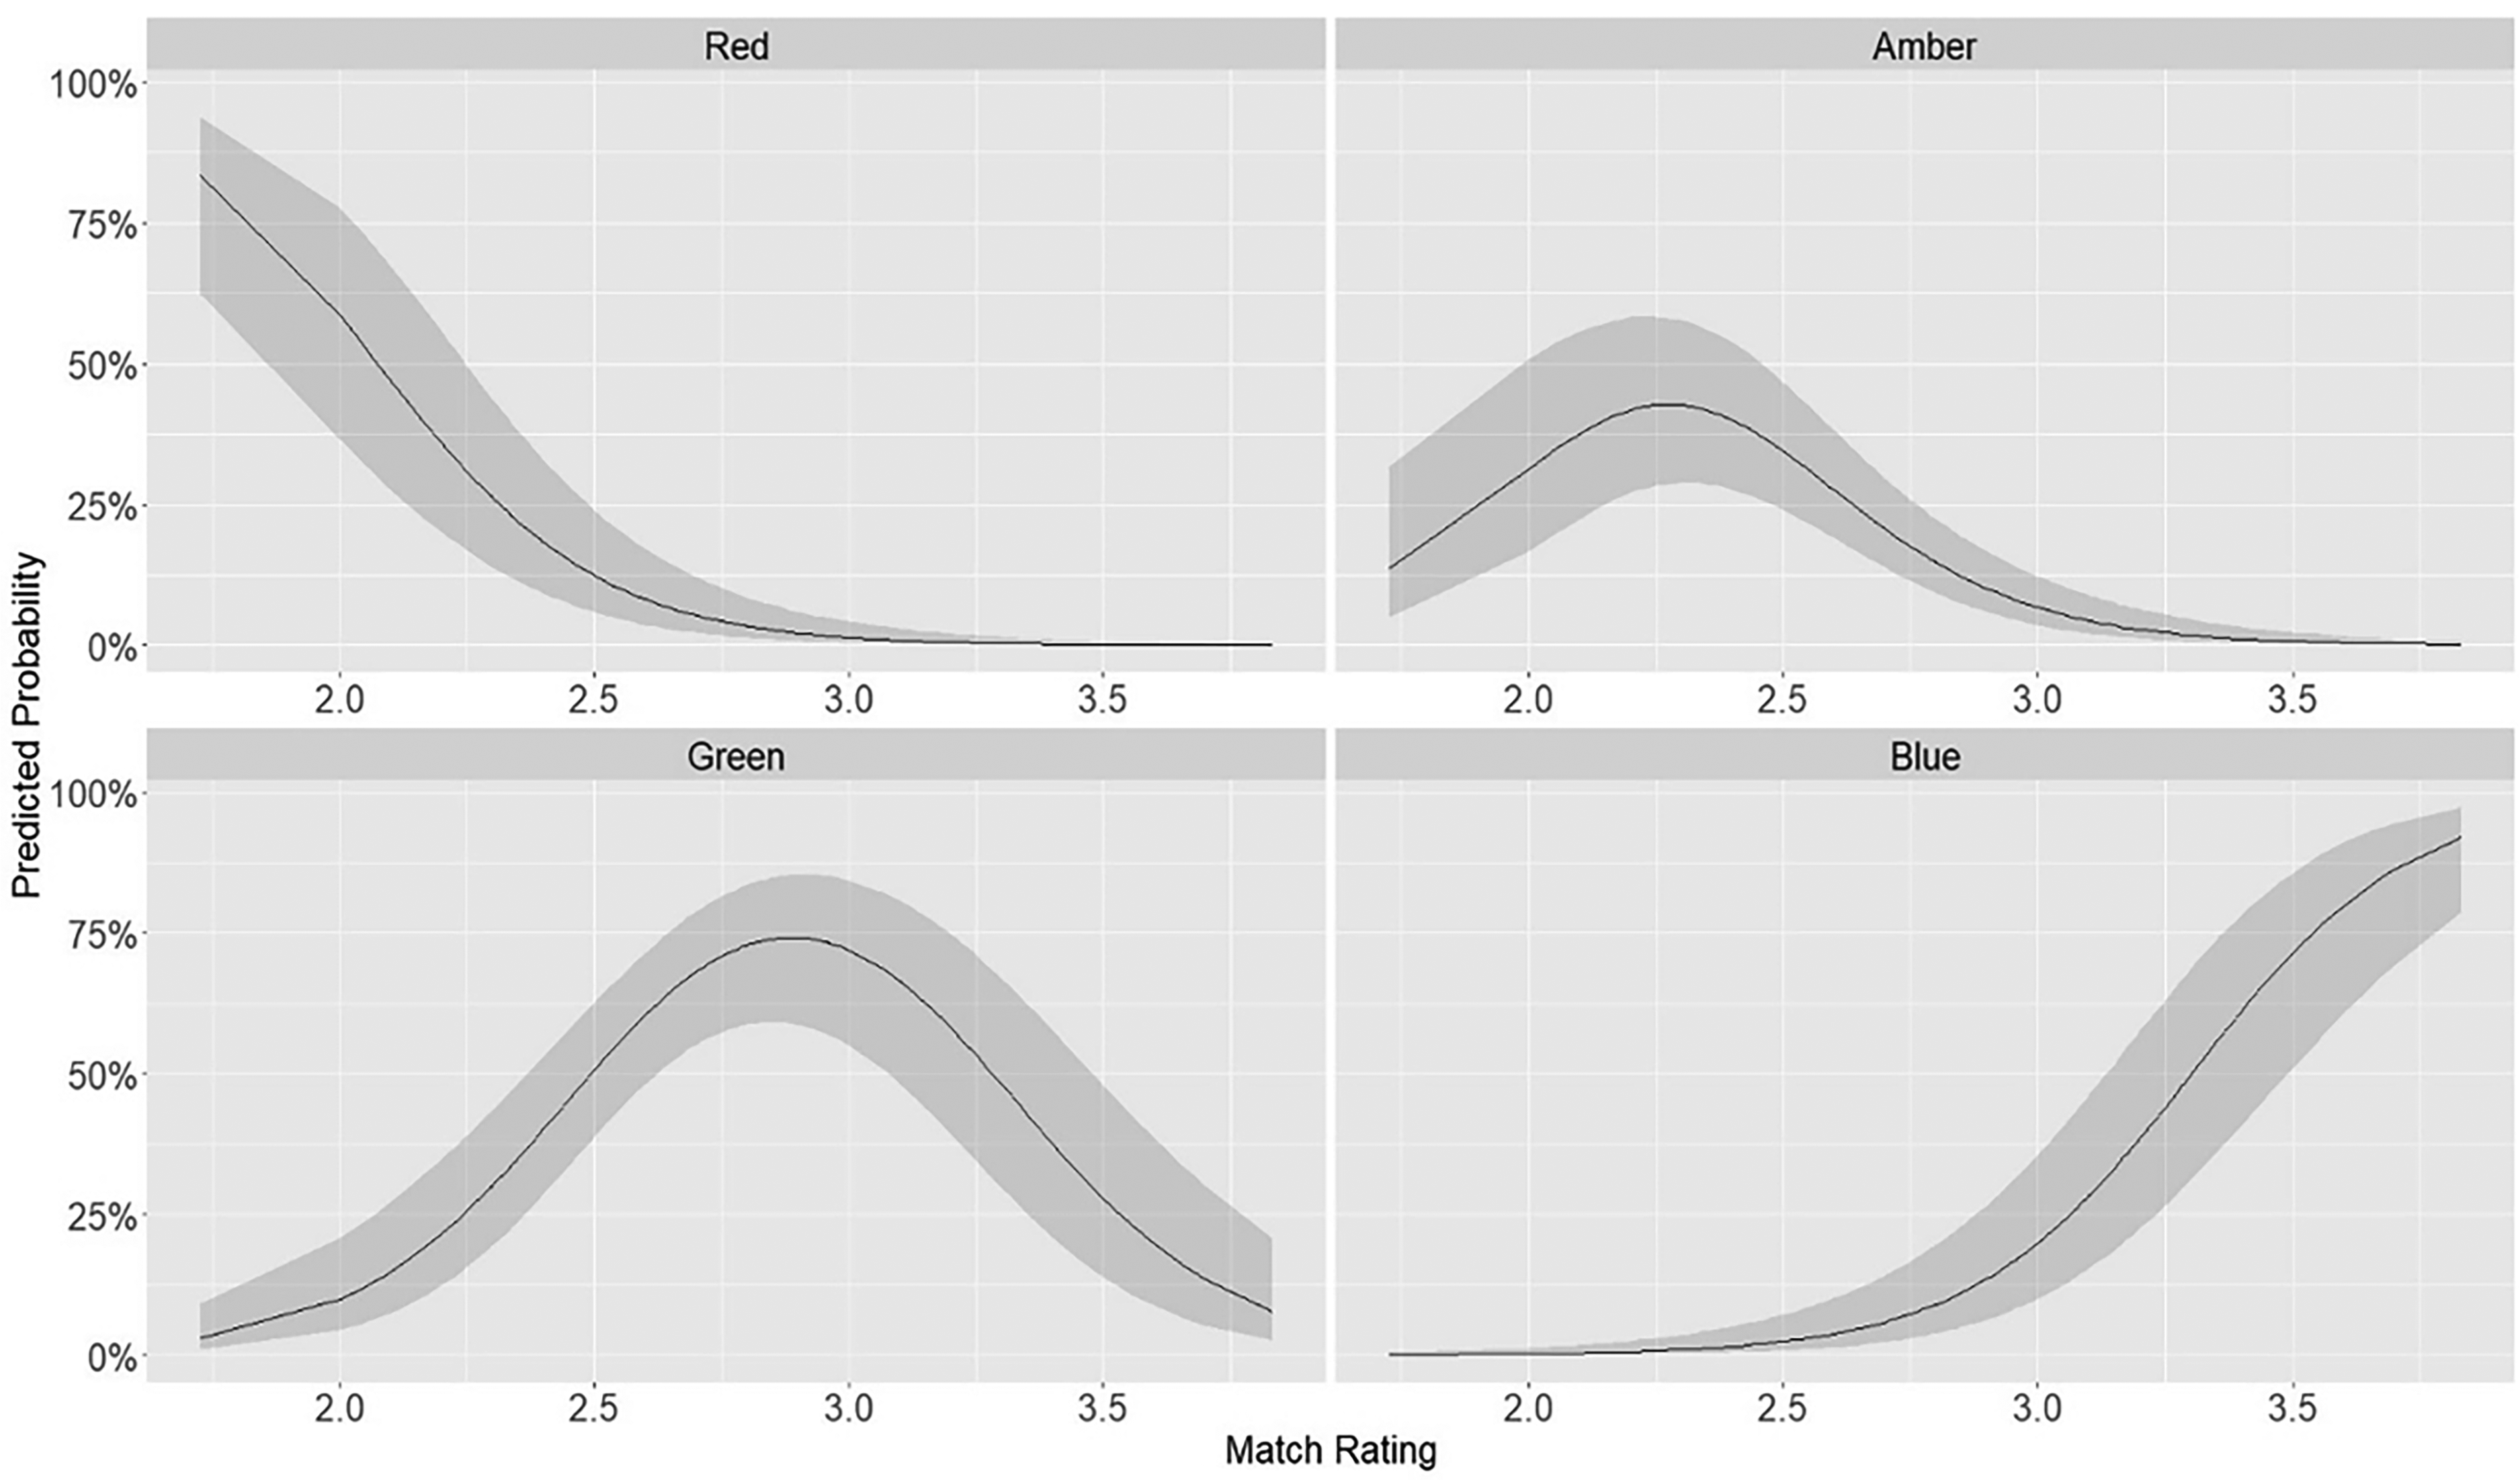
Predicted probabilities of being perceived at each level of potential in relation to mean match rating.
TSA also indicated a positive but non-significant association with perceived potential (β= 0.64, SE = 0.34, p > 0.05, 95%CI = -0.07–1.24). Odds ratios suggest that for a one unit increase in TSA, the odds of a player being perceived in a higher category of potential are almost twice as likely (OR = 1.79, 95% CI = 0.93–3.45). Figure 3 displays the predicted probabilities highlighting the relationship between TSA and the probability of being perceived at a specific level of potential.
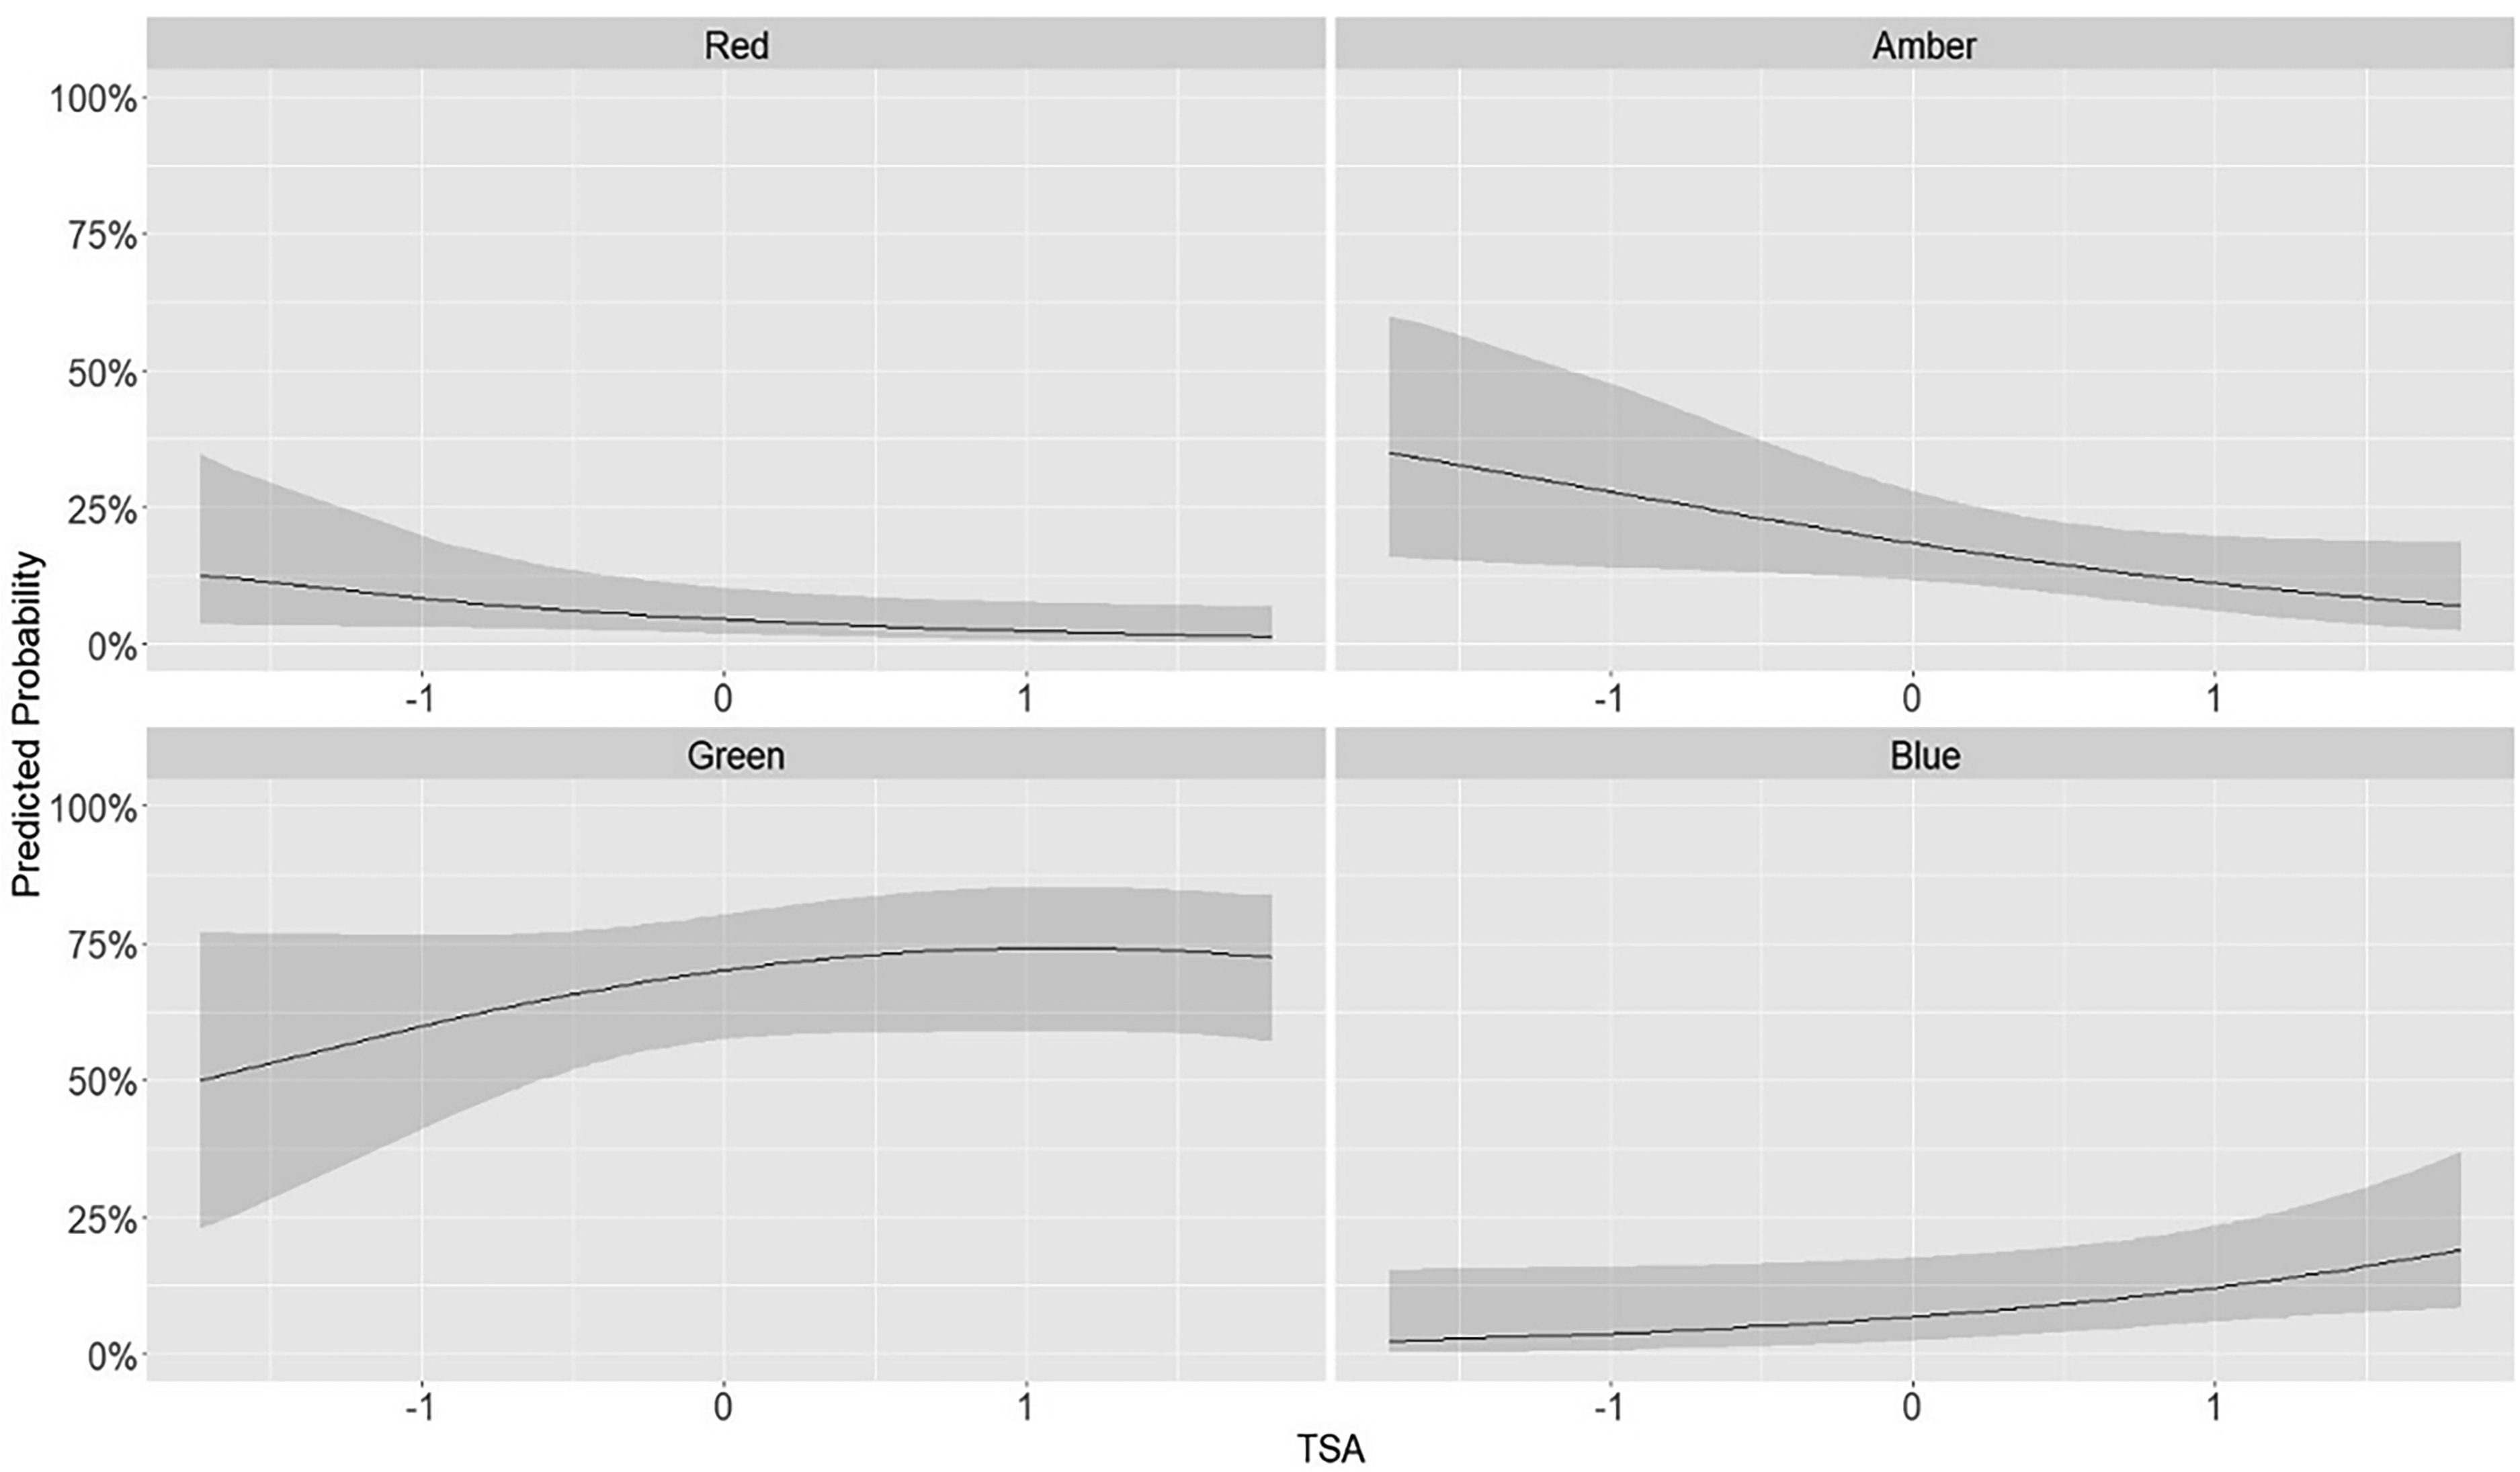
Predicted probabilities of being perceived at each level of potential in relation to TSA.
The random effects of the model (i.e., players), account for the variability in the perceived potential response that can’t be explained by the predictor variables (mean match rating and TSA), allowing each player to have a different response category for perceived potential whilst considering the repeated measurements within that player. The estimated random intercept variance (between-subject variance) is τ00 = 0.36 for the random effect of coaches (n = 6) and τ00 = 0.79 for the random effect of players (n = 101), indicating the variability in response attributable to individual differences. The ICC of 0.26 suggests that 26% of total variation in perceived potential response is due to differences between individual coaches and players that is unexplained by mean match rating or TSA alone.
A graphical representation of the findings, displaying players TSA, mean matching rating and level of future perceived potential is plotted in Figures 4 (distinct levels of potential) and 6 (combined plot), highlighting a general observation of better current performance and physical ability leading to a higher level of perceived future potential. The blue ellipse in Figure 5 represents those perceived to have the highest future potential, with the majority of players perceived to have high potential showing above average scores for both mean matching rating and TSA.
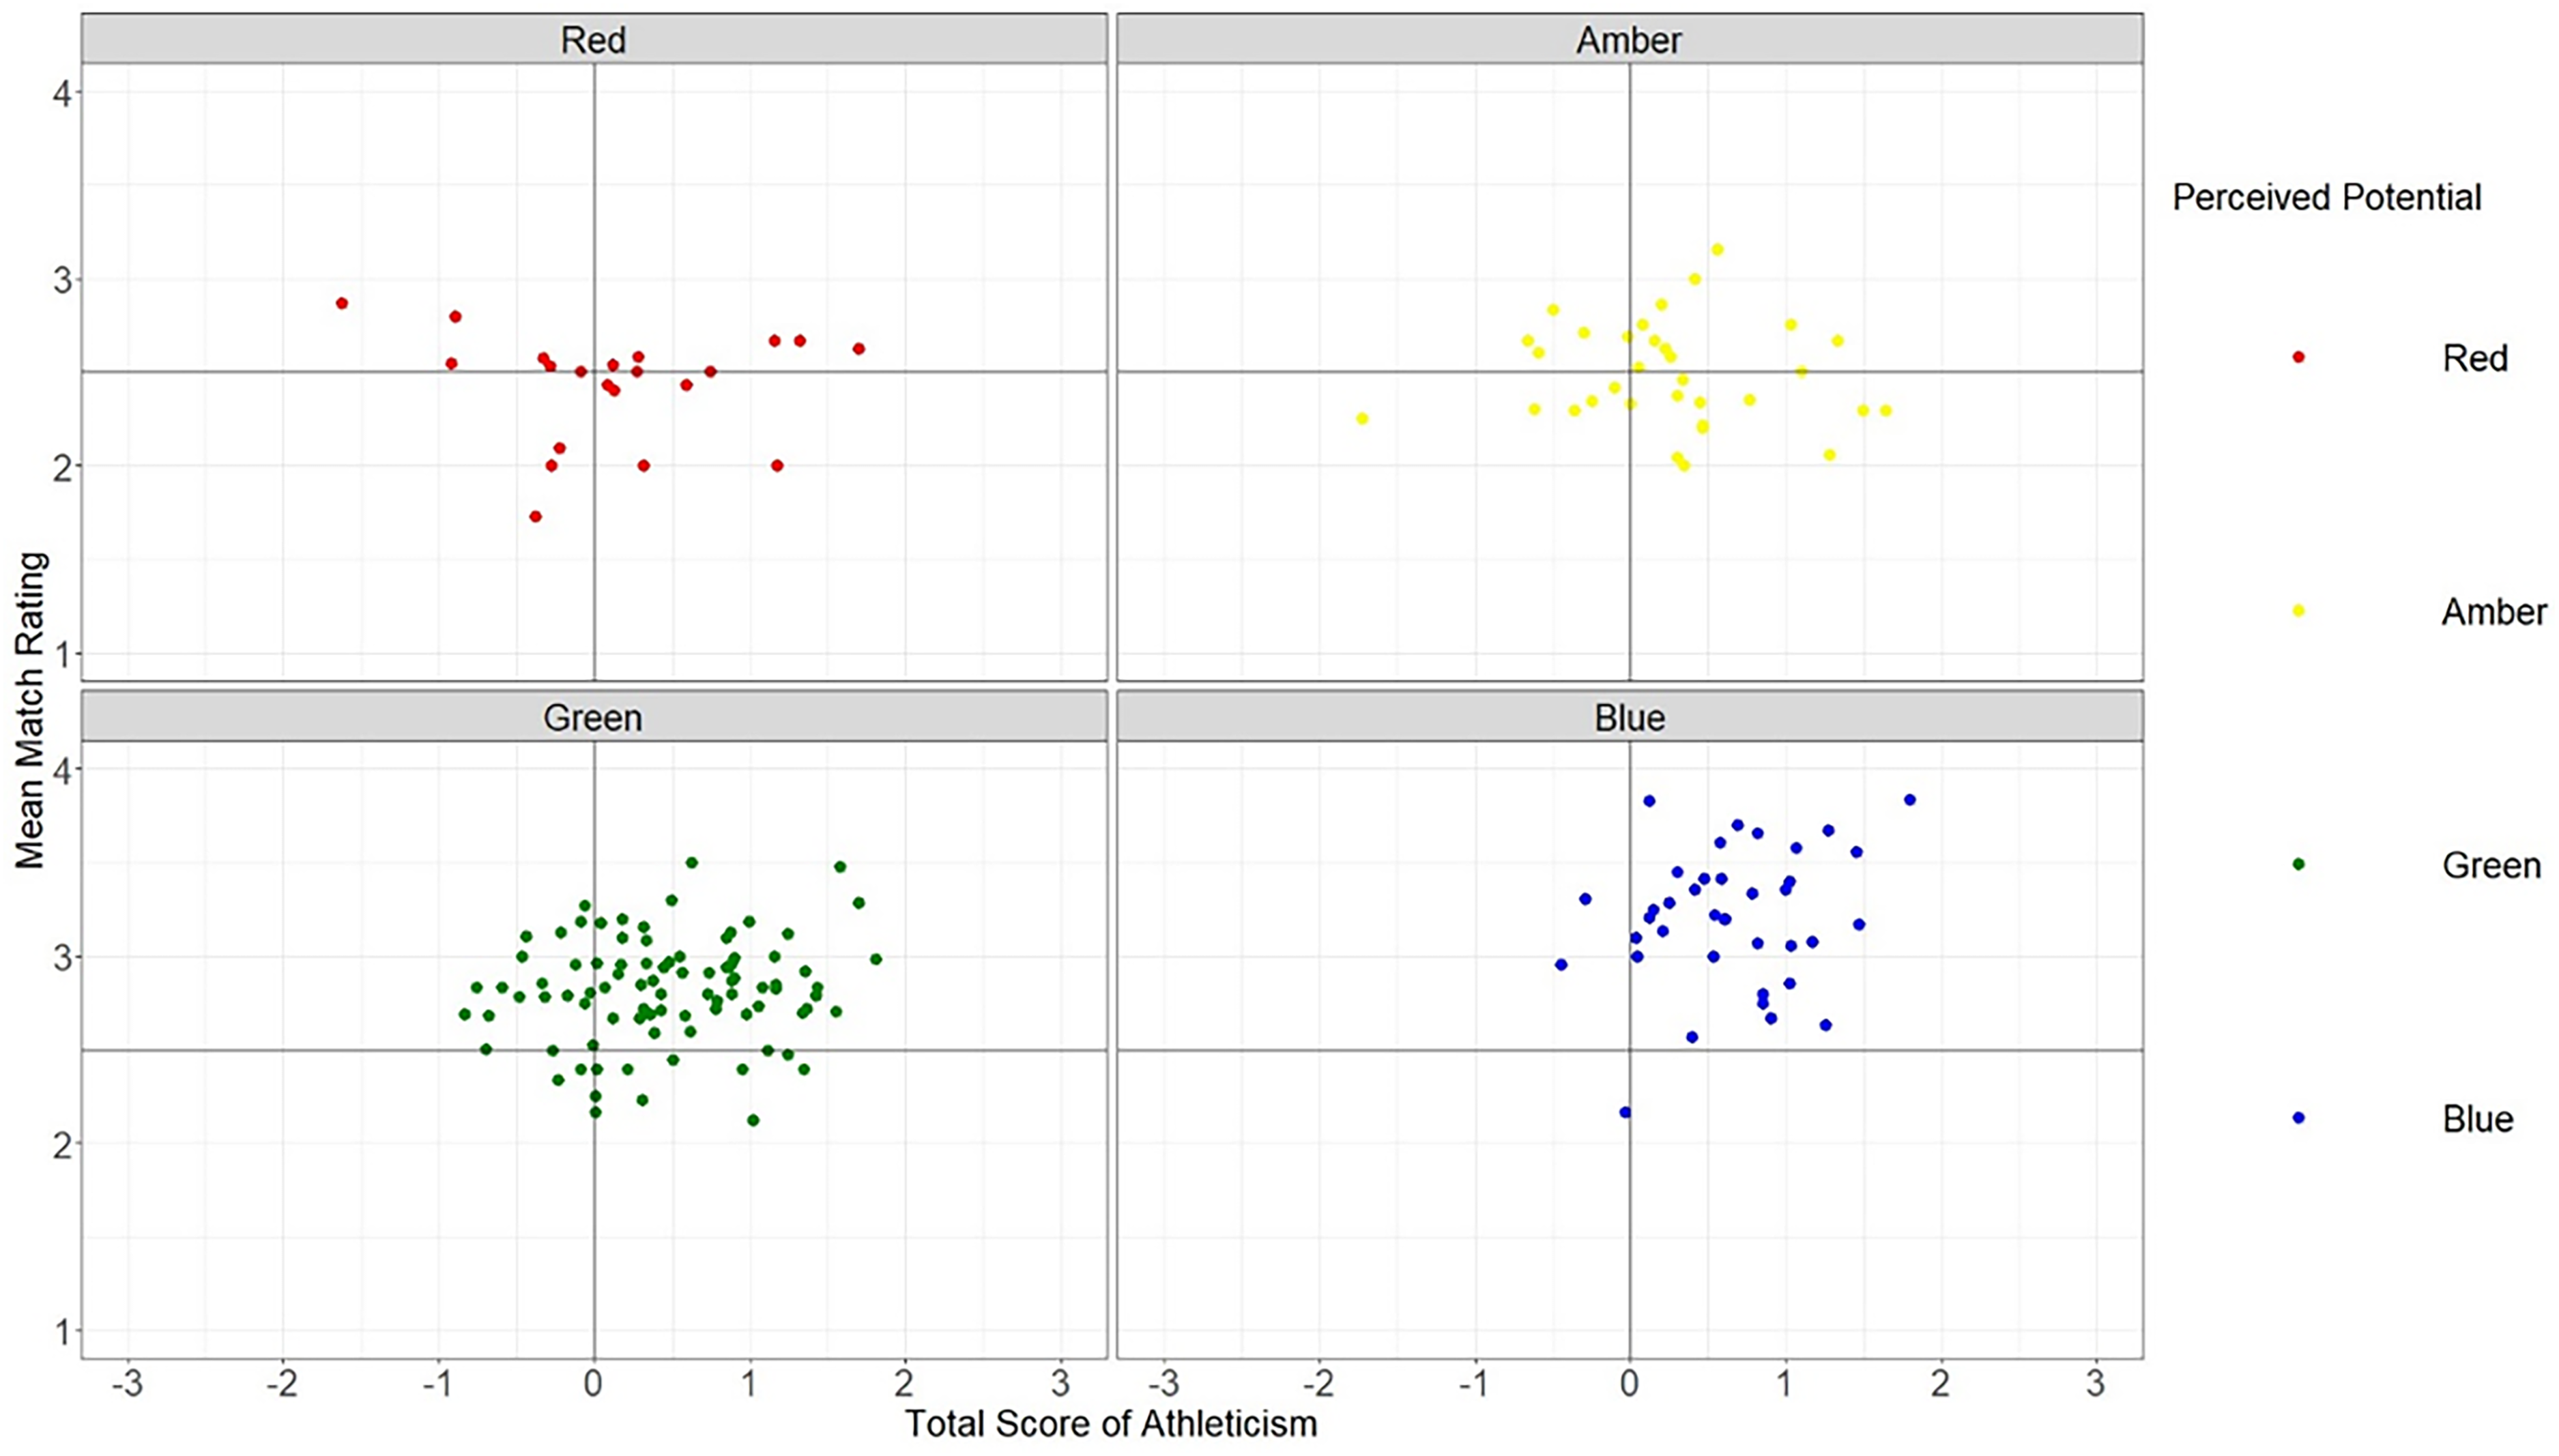
Relationships between mean match rating, TSA, and perceived potential separated by category of perceived potential.
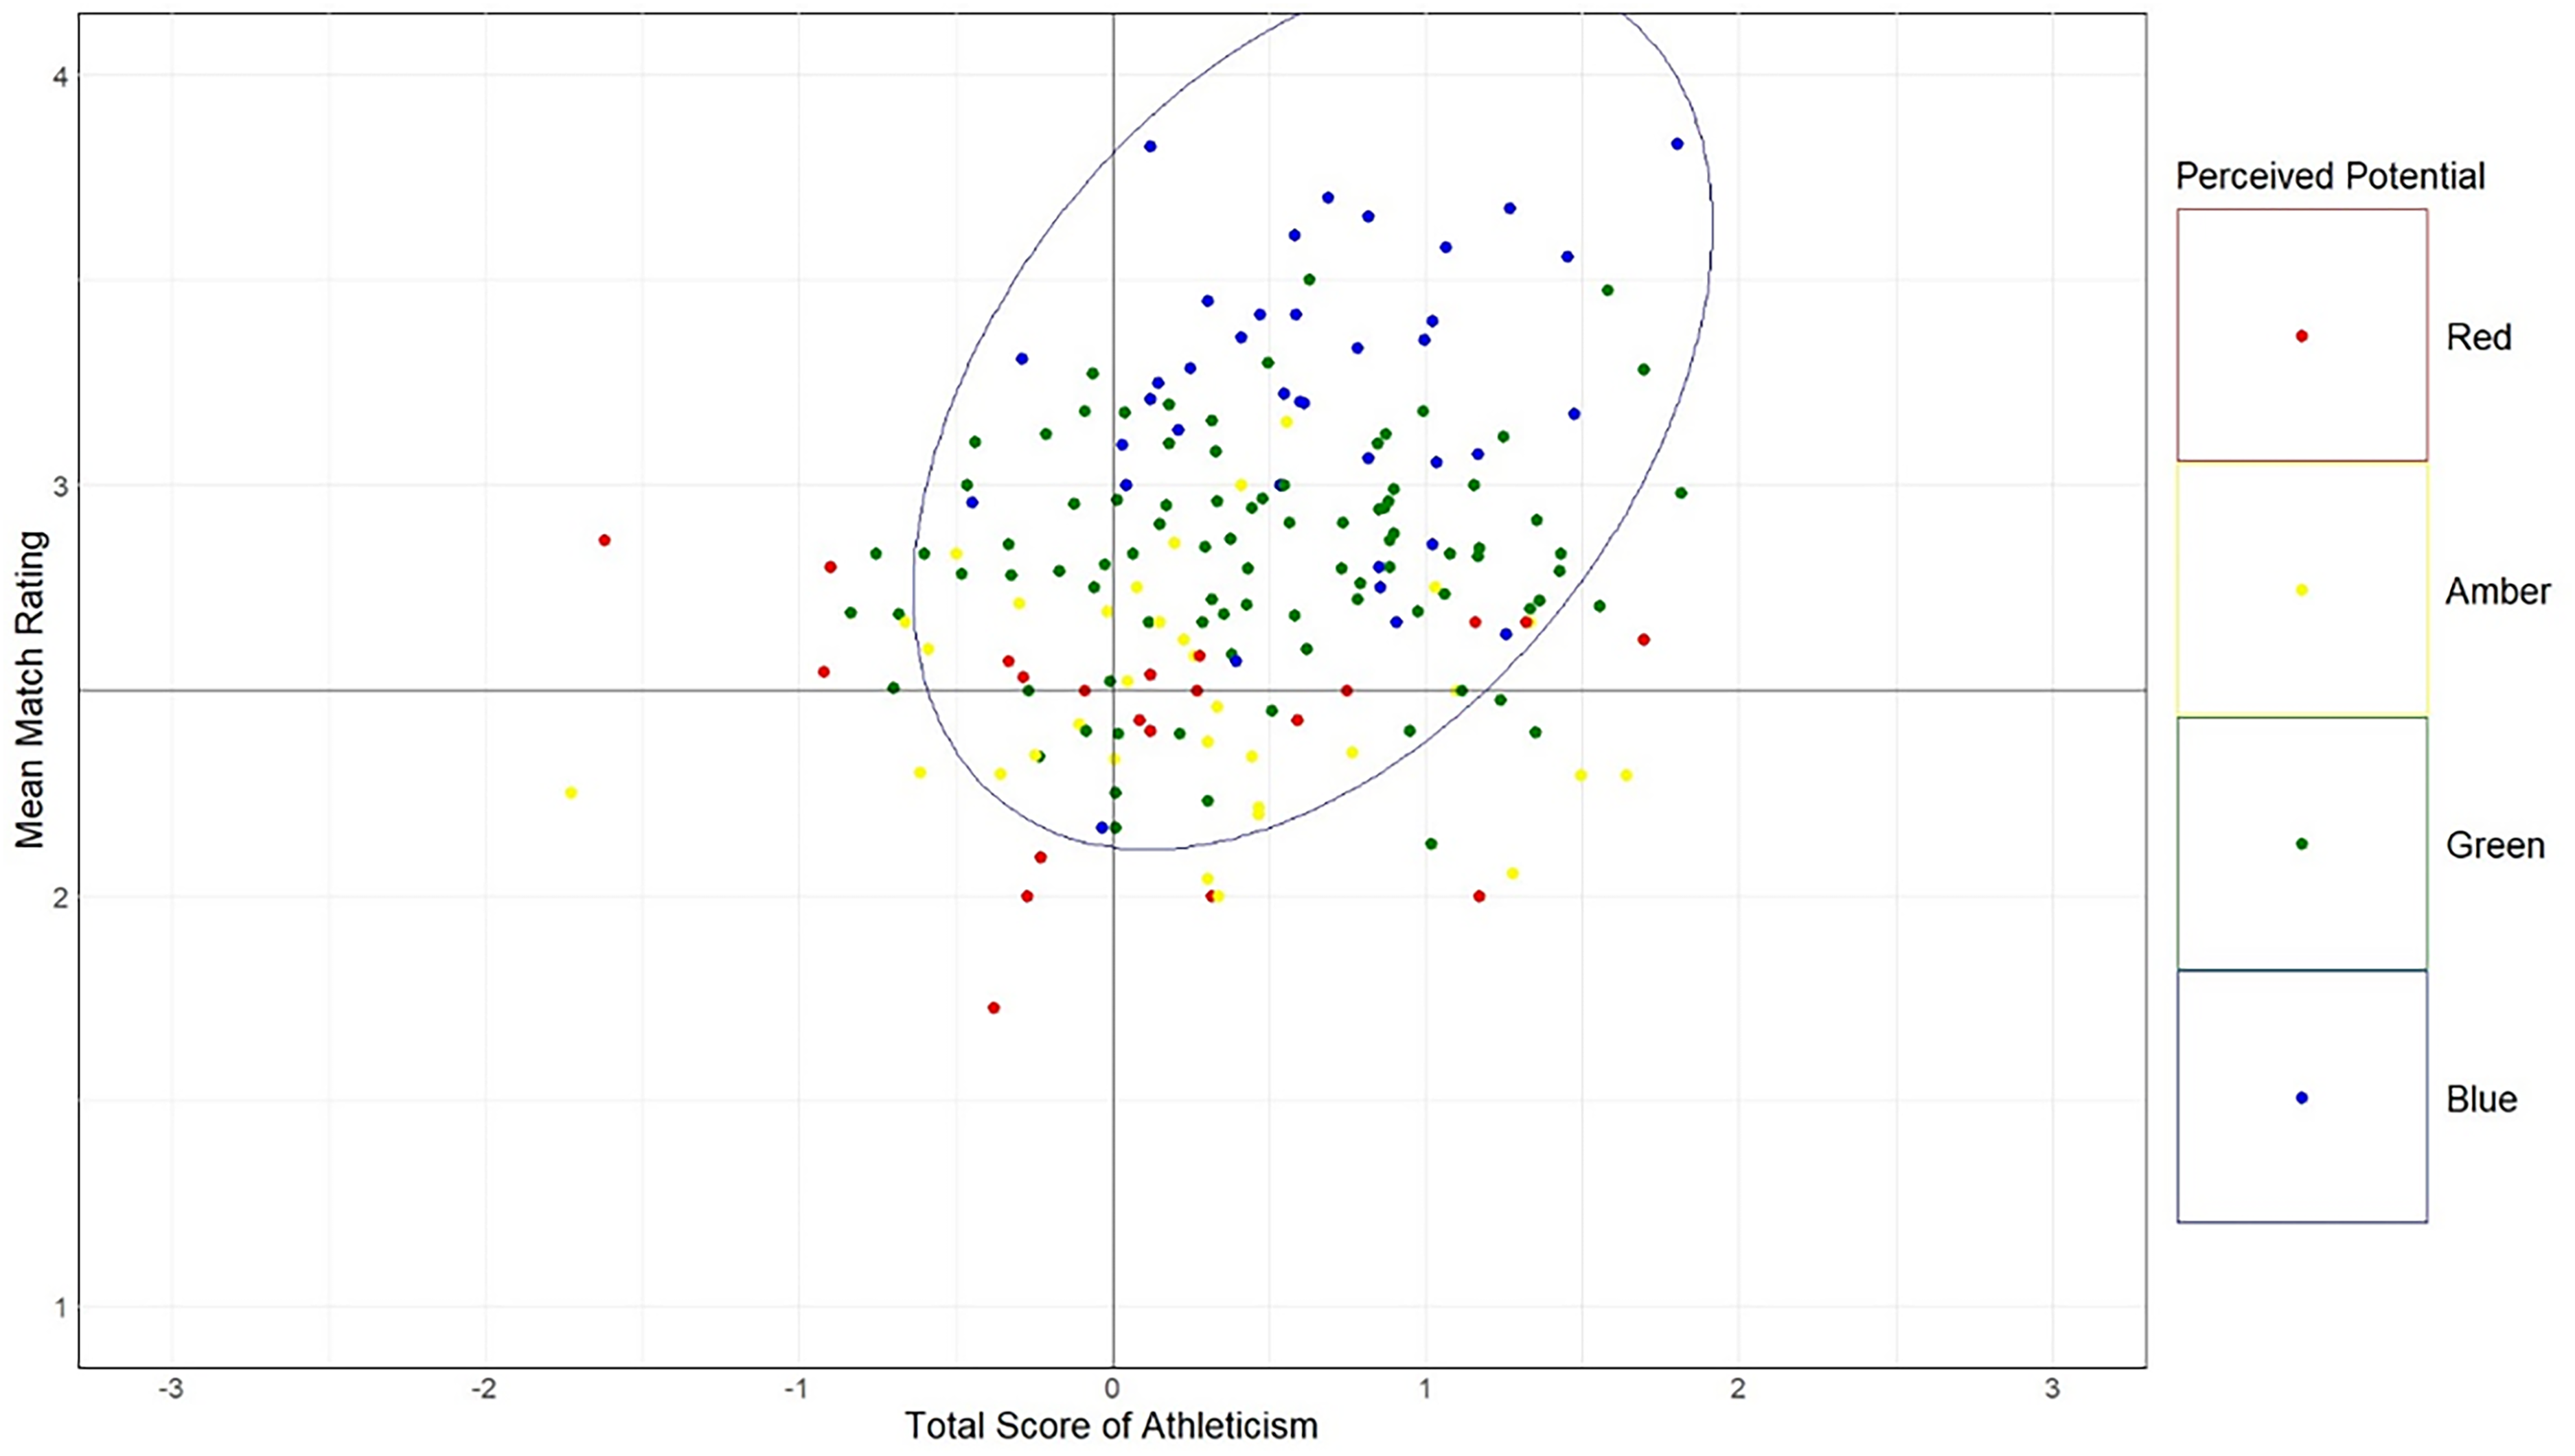
Relationships between mean match rating, TSA, and perceived potential across all categories of perceived potential.
Discussion
Talent selection risks have previously been presented as a combination of potential and performance, often informed by coaches’ SEOs. 10 However, limited research exists exploring evaluations of player potential5,7,33 through coaches’ SEOs and the relationships between data that may influence such evaluations (e.g., match performance, athleticism). Therefore, this study presented ratings of perceived potential from players in an elite youth soccer academy and explored the relationships between perceived potential, athleticism, and match performance. The study findings showed that ratings of player potential decreased as age groups increased and were lowest within older age groups (e.g., U18). Secondly, a key finding was that coaches’ perceptions of a player's future potential are strongly related to a player's current match performance, based on (mean) match ratings from the current season. Additionally, findings also highlighted an association between a player's current athleticism (TSA) from the current season and their perceived future potential, however, this finding was statistically non-significant. These findings have implications for TID, the rating of future potential, and the factors that may impact upon possible ratings for monitoring player development within soccer academies.
Player potential
In relation to players perceived potential ratings, within the U12-U18 age groups, over 70% of players were perceived to have high levels of potential (Green or Blue ratings). The U12 and U15 age groups demonstrated the greatest percentage of players perceived to have high potential with 85% and 84% of players within those groups respectively being rated as green or blue potential players. Such findings may be reflective of a degree of uncertainty amongst coaches, who do not wish to “miss out” on potential future elite players and may also represent a form self-serving bias from the coaches within these age groups, who possibly overestimate player's potential to justify the impact their coaching has had on such players.6,32
The highest count of players perceived to have the lowest level of potential (Red) occurred within the U18 age group. Only 31% of players within this age group were perceived to have high potential (Green or Blue). Such findings are in agreement with the work of Kite et al., (2023), who demonstrated coaches’ perceptions of player potential were capable of determining (de)selection status, but only in close proximity to the (de)selection decision itself. Intuitively, such findings are repeated in the current study, with a lower frequency of high potential ratings at the U18 age group, reflective of the limited quantity and opportunity for players to obtain professional contracts at the elite level. 56 Finally, as the U18 age groups signifies the culmination of the developmental academy pathway (i.e., final age group prior to possibly receiving a professional contract), the lower frequency of high potential ratings may coincide with a coach perceiving such players have limited remaining time for development.
Objective and subjective assessments
Findings demonstrated that both subjective ratings of soccer performance (mean match rating) and objective measures related to soccer performance (TSA) may be linked to coaches’ perceptions of future potential. These findings are in agreement with previous research highlighting the use of both objective and subjective data in providing valid prognostic relevance for future career level.23,26 For example, Sieghartsleitner et al., (2019), found that the use of coaches’ SEO (rating of in-game performance, i.e., match rating) combined with objective assessments (physical attributes, biological maturation, psychological skills, familial support, technical skills and training history) provided significantly better predictions of future career (de)selection than the use of objective assessment alone in elite youth soccer players. Similarly to the current study, in-game performance was shown to have a significant contribution as a single variable. Whilst undoubtedly a valuable assessment tool, such findings demonstrate prior evidence of the possible misuse of current performance as an indicator of potential given they are regarded as distinct constructs. Additionally, Höner et al., (2021), assessed a variety of soccer related performance factors using both objective (sprint, agility, dribbling, ball control, juggling) and subjective assessments (kicking skills, endurance, tactical skills, psychosocial skills), demonstrating that combining both objective and subjective assessments provided better predictions of future career success. Such findings support the notion that player related attributes (e.g., athleticism) influence coaches’ perceptions of future success (i.e., potential).
Associations between match rating and perceived potential
The strong relationship between match rating and perceived potential in the current study is consistent with the increased use of coaches’ SEO within both research and practice.26,47,48 In the results of the current study, the U18 age group demonstrated consistently lower match ratings and a low percentage of high potential ratings (31%), with the U12 age group demonstrating the highest match ratings and the highest frequency of high potential ratings (n = 9) in comparison to other age groups. Additionally, match ratings increased concurrently with ratings of perceived potential across all age groups. Such findings further highlight the possibility that coaches were (un)intentionally extrapolating current performance to infer future potential. 10 Equally, it could be argued that the U18 age group represents a significantly greater standard of play and expectations in comparison to age groups within the YDP phase, partly explaining the lower mean match ratings. Further, it could be suggested that as the U18 age group represents a biannual age category (i.e., U17 and U18 players), the combination of more (U18) and less (U17) experienced players who coaches will have spent more and less time with those groups respectively, may have impacted coaches’ judgements, as match ratings are likely to be an integration of technical/tactical aspects and knowledge of the player in other domains (e.g., psychological skills, training history, familial support26,32;
Associations between TSA and perceived potential
Whilst statistically non-significant in the current study, the positive relationship between TSA (representative of a player's physical ability) and future potential is in keeping with previous research highlighting favourable physical differences between future selected and de-selected players.36,57 Results from the current study suggest that, generally, more athletic players were more likely to be considered higher potential by coaches with coaches perceiving them to have greater chance of future elite success. Although physical abilities are directly important to soccer match play, our findings perhaps highlight that high levels of ability across multiple disciplines are important when considering the future potential of young soccer players.23,24,26 However, caution is warranted when considering a player's level of athleticism in relation to future potential, given the well documented differences in the development of athleticism when considering individual player maturation.35,58,59
Limitations
Firstly, limitations arise when considering the findings of the current study are limited to a single professional soccer academy in the UK, where findings may not be representative of all elite youth male soccer academies who may adopt different philosophies and processes in relation to TID, TD and (de)selection. Additionally, evaluations of both subjective opinion of soccer performance (match rating) and objective scores of player athleticism (TSA) may have represented static observations of athlete qualities. 32 Whilst our current data aggregated repeated measurements of a player across a season, the data still represents an evaluation that fails to consider changes over time (i.e., development). Further, when assessing a player's TSA, biological maturation was not accounted for, which is known to affect measures of athleticism and coaches’ evaluations of match performance in academy soccer players.35,47,58 Additionally, sample sizes were small within levels of perceived potential - within age groups. However, limited sample sizes can be expected given the applied nature of the research within a single soccer academy and despite the limitations, our findings may in fact represent a reality and true reflection of observations across numerous soccer academies. Finally, only match ratings and TSA were considered within the current study representing only certain elements that may contribute to player potential (i.e., technical, tactical, physical). A multidisciplinary approach is recommended for future research that considers physical, 60 technical / tactical,61,62 psychological, 63 and sociological 64 factors that may contribute to TID and perceptions of player potential.2,65
Practical applications
The positive associations found between the predictor variables (match rating, TSA) and future perceived potential perhaps suggest a limitation of coaches in their ability to evaluate the non-linear, dynamic development of talent. Practically, understanding how potential is evaluated within elite youth soccer players throughout various age groups and understanding relationships that may contribute to such evaluations may be a key application and reflection for youth soccer academies. As a hypothetical example, overlaying the data from the current study with the proposed risk matrix from Baker et al. (2018) as shown in Figure 6, would result in no player in the current study being categorised as high potential (Blue) but under performing (Box 1). Similarly, very few players categorised as having lower potential (Red/Amber), would currently be performing well (Box 9). Disregarding the development of talent and assuming it is a fixed capacity, that is reflected through current performance, remains a central problem for TID and TD as it increases the risks associated with (de)selection decisions. 10 As such, clear definitions of performance (e.g., 66 and potential should be made explicit within organisations to facilitate objective and valid assessments and improve methods relating to coaches’ assessments. 63
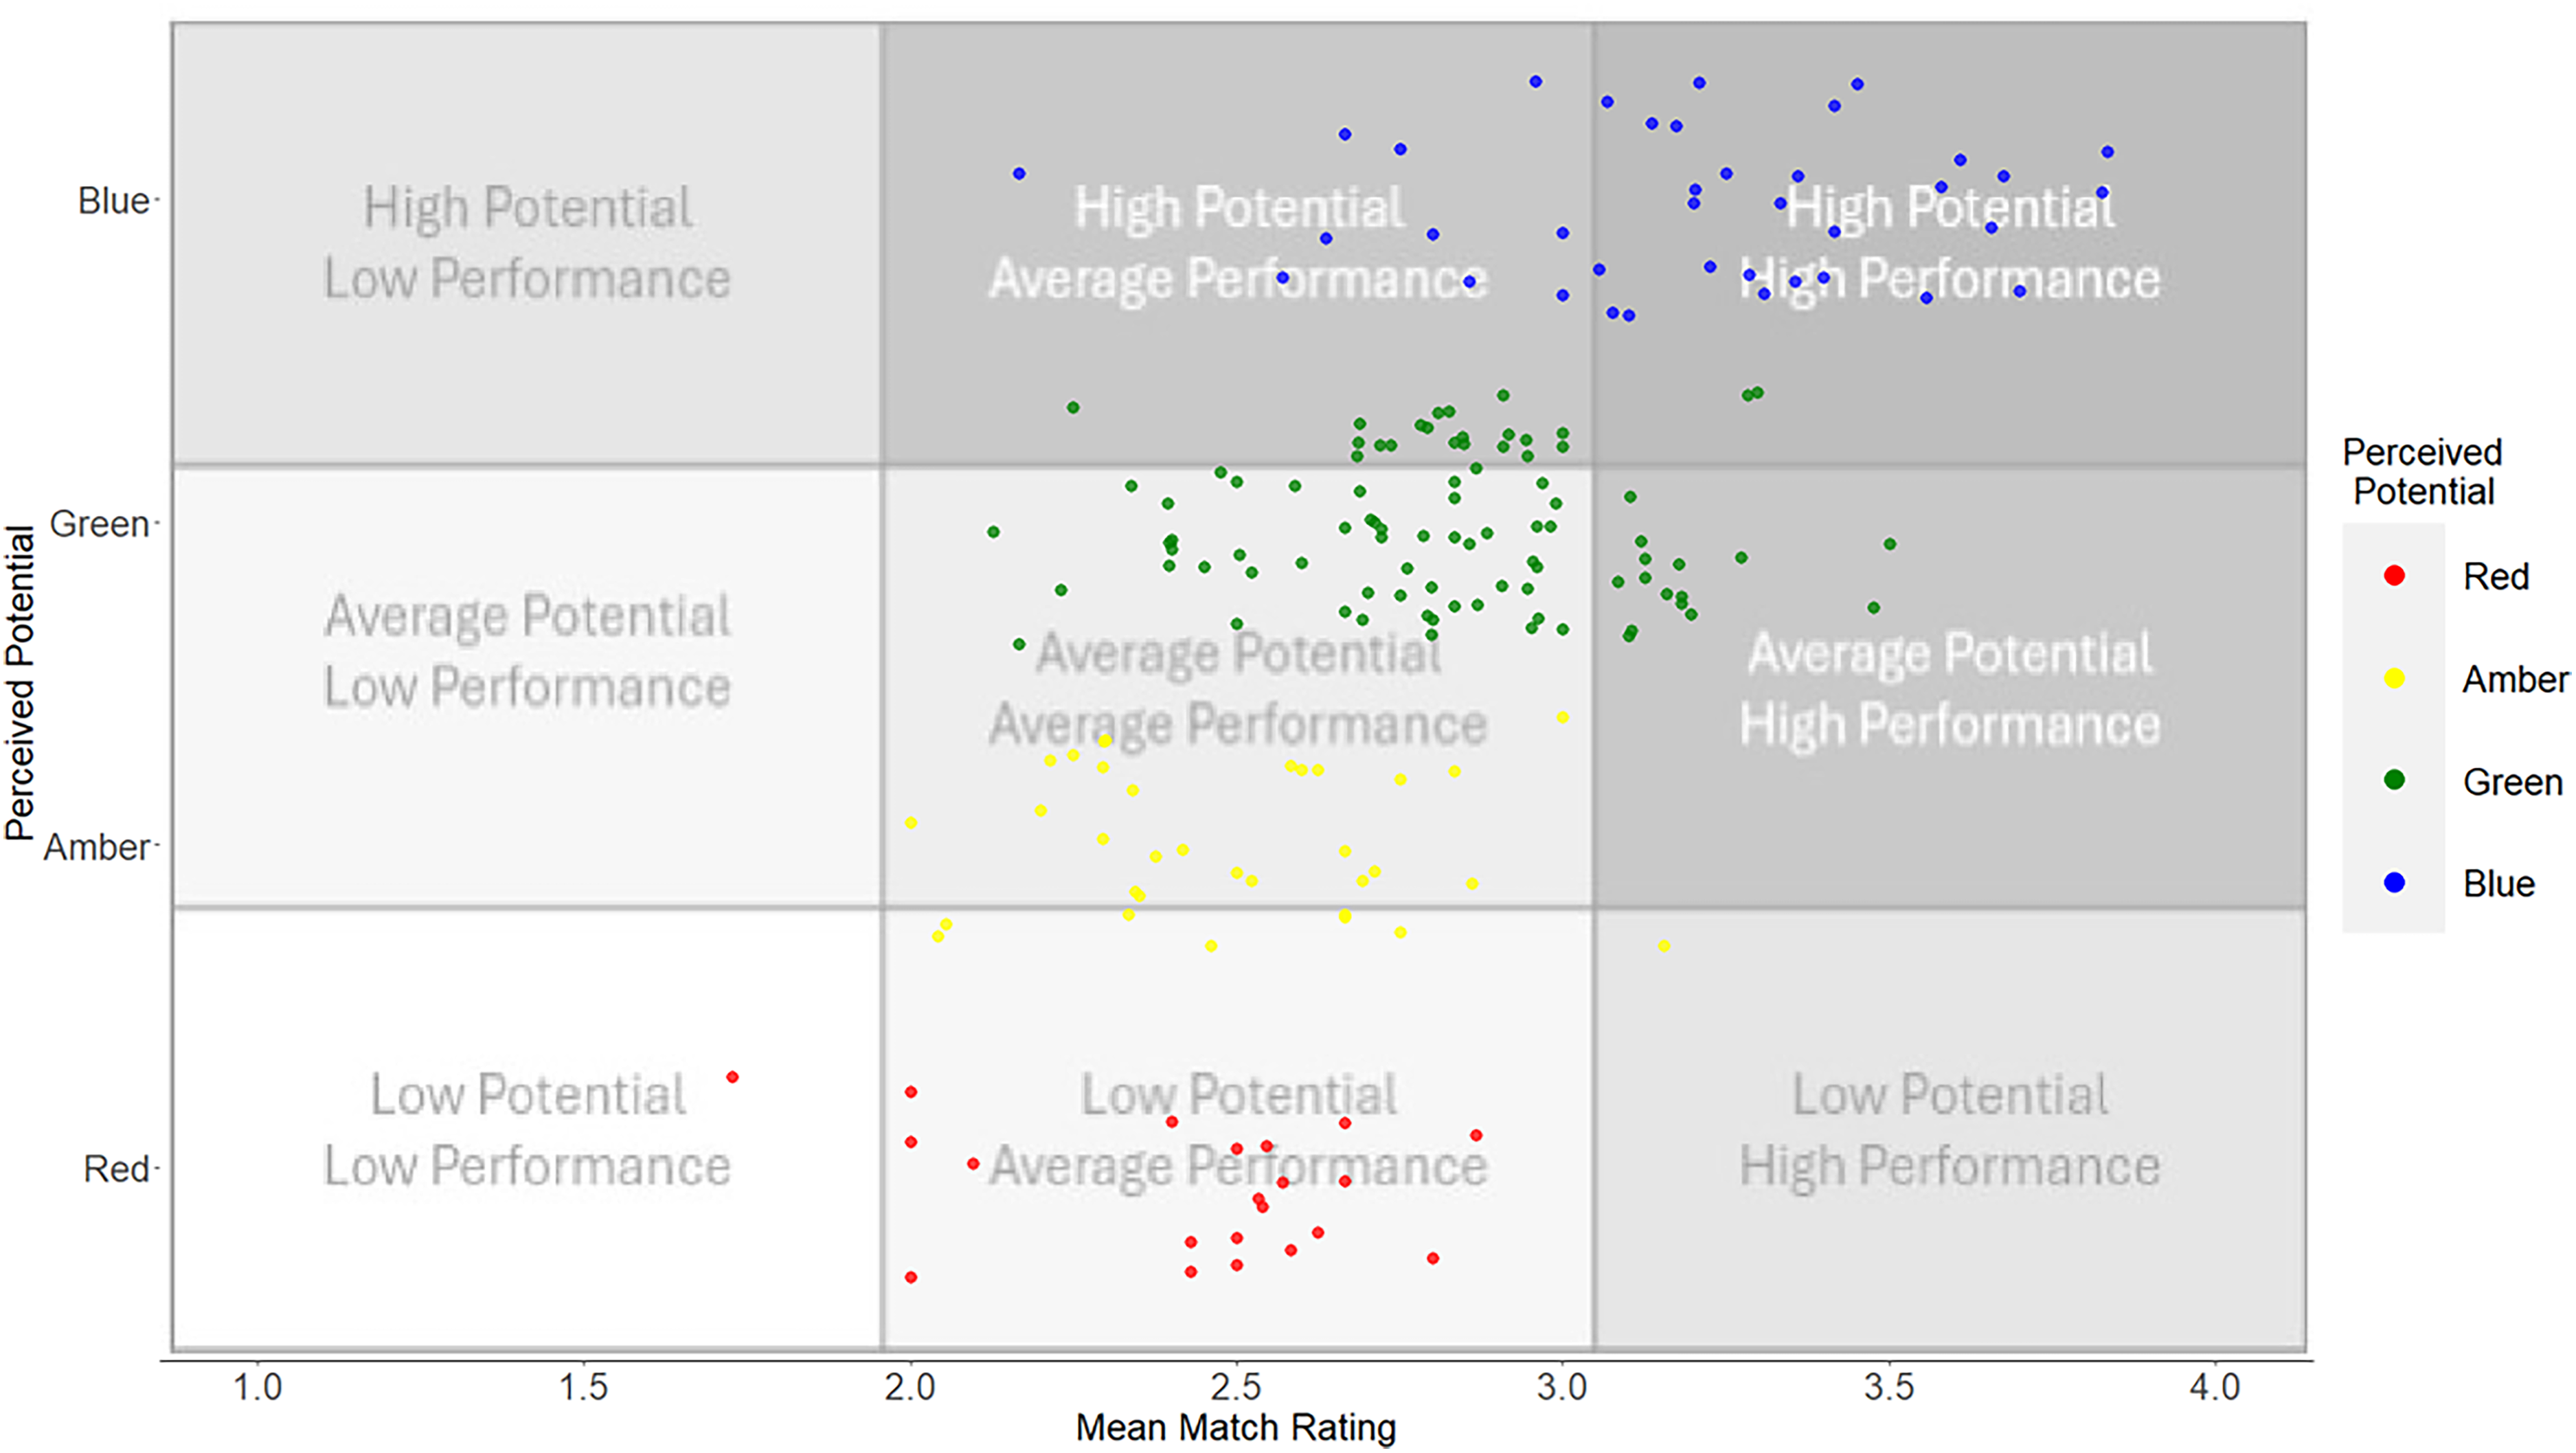
Overlay of mean match rating and perceived potential results on a redrawn version of Baker et al.'s (2018) risk matrix. Note: points have been jittered along perceived potential axis for illustrative purposes.
Findings from the current study demonstrate lower ratings of potential within the U18 age group in comparison to U12-U16 age groups and highlight that current match performance and a player's level of athleticism has a strong relationship with coaches’ perceptions of player potential. Undertaking such analysis within organisations can aid in discerning possible (sub)conscious biases relating to physical abilities17,35 and perceived match performance18,47 from coaches’ perspectives, and can highlight a possible misunderstanding between performance and potential.
Conclusion
This study presented player potential ratings from a soccer academy and explored the relationships between potential, athleticism and match performance ratings. Ratings of potential were highest in the U12 age group and lowest in the U18 age group, with 70% of all players being perceived to have high potential (Green or Blue). Overall, players rated as having the highest potential (Blue), demonstrated higher mean match ratings and TSA, with the exception of TSA in the U16 and U18 age groups. An ordinal regression model established a significant and positive association between a player's match rating and the odds of them being rated in a higher category of perceived potential. Additionally, a player's TSA was also found to have a positive association with coaches’ ratings of perceived potential, although there was some uncertainty in the coefficient estimate. These key findings highlight that a coach's perceived levels of future performance for individual players may be strongly linked to those players’ levels of current performance, as evidenced through the coaches’ match ratings. With this in mind, it is difficult to conclude how a single discrete rating of performance can be fully explanatory of a coach's evaluation of talent. More work is required to develop a deeper understanding of what coaches may consider when evaluating player performances in match situations, as this study highlights such considerations may heavily influence perceptions of future potential. Additionally, this research also found that a player's current level of athleticism (TSA) may impact the coach's perceived level of player potential, with more athletic players regarded as having a higher potential for future success in soccer. Coaches should be aware of potential biases that affect their subjective player assessments and be cautious of the differences between performance and potential when evaluating their players, given the longitudinal, non-linear, dynamic nature of talent development.
Footnotes
Declaration of conflicting interests
The authors declared no potential conflicts of interest with respect to the research, authorship, and/or publication of this article.
Funding
The authors received no financial support for the research, authorship, and/or publication of this article.