
Abstract
This paper considers how player acceleration changes in soccer relative to age. A plot of average maximum acceleration versus age is produced. The construction of the plot is based on methods from functional data analysis and the availability of tracking data from the 2019 season of the Chinese Super League. For an individual player, we calculate his maximum acceleration for each single match of the 2019 season. Since the players’ maximum accelerations are observed only on a single season instead of their entire careers, we treat them as incomplete functional data, called functional snippets. The average maximum acceleration, i.e., the mean function of the functional snippets rather than full curves is estimated by a local linear smoothing method. The most important observation is that the shape of the acceleration curve closely resembles curves of soccer performance versus age. This observation has implications for predicting future performance since acceleration is more easily and more accurately measured than performance.
Introduction
In sport, the term “quick” is frequently used to describe athletes. If an athlete is deemed quick in team sports, it is generally regarded as an advantage. By definition, quickness is a measure of speed. However, we believe that many sports insiders regard quickness more as a measure of acceleration. For example, in many team sports, changing direction is important, and this is a trait that is measured via acceleration.
The investigation considered in this paper was motivated by a hunch: Namely, that maximum player acceleration in soccer is closely related to player performance. This hypothesis is potentially of great interest since the prediction of future player performance in soccer is a fundamental problem facing teams. Naturally, teams wish to build successful rosters, and this is addressed via player retention and acquisition. One aspect in the prediction of future player performance that is well-known is the impact of aging; young players improve, reach a plateau and then decline in performance. However, although the average shape of the performance/aging curve is concave, there is variation in player-specific performance/aging curves. For example, some players reach their peak quickly/slowly, and other players have rapid/gradual declines beyond their peak. Another challenging aspect involving player-specific performance/aging curves is that performance is difficult to measure. A player’s performance can be impacted by various factors including luck and teammates. If it is the case that maximum acceleration/aging curves closely resemble performance/aging curves, then maximum acceleration may be used as a proxy for performance. The great advantage in this case is that maximum player acceleration can be accurately and relatively simply measured. Our analysis reveals that the two curves are similar in shape, and this insight may facilitate the prediction of future player performance.
In sports analytics, there seems to be a limited literature on the relationship between maximum acceleration involving soccer specific movements and age. Lorenzo-Martinez et al. 1 classified 420 La Liga players into four age groups, and found that older players (31–38 years of age) had fewer accelerations and decelerations per match than players 17–23 years, 24–27 years and 28–30 years. However, their findings revealed no significant age-related declines in players’ maximum acceleration, and only trivial differences were observed in maximum deceleration. In sports science, there is a common research thread that investigates the relationship between acceleration and various physical measurements. See for example, Zhang et al., 2 Loturco, 3 Yildiz et al. 4 and Little and Williams. 5
In this paper, we study maximum acceleration for players in soccer. During the course of a match, modern technology permits the constant measurement of a player’s acceleration. However, there is often no need for the player to exhibit high-end acceleration. Therefore, we are not interested in average acceleration, but rather the upper limits that a player can accelerate, i.e., their maximum acceleration. Maximum acceleration is an intrinsic property that contributes to player ability.
To measure maximum acceleration during a match, we have access to, and we utilize player tracking data. With player tracking data, the location coordinates for every soccer player on the field are recorded frequently (e.g., 10 times per second in soccer). With such detailed data, the opportunity to explore novel questions in sport has never been greater. The massive datasets associated with player tracking also introduce data management issues and the need to develop modern data science methods beyond traditional statistical analyses. Gudmundsson and Horton 6 provide a review of spatio-temporal analyses that have been used in invasion sports where player tracking data are available.
Ideally, we would like to observe the maximum acceleration profile for a player with respect to their age. Such data are functional data where each player’s acceleration curve is unique. Techniques from functional data analysis (FDA) would then permit the construction of an average curve across all players. For a practical introduction to FDA, see Ramsay and Silverman 7 and Ramsay, Hooker and Graves. 8
However, our processed data for an individual soccer player takes the form of maximum acceleration observed during a match, measured across all matches during a season. Therefore, our acceleration data are truncated from a career to a single season. We treat the incomplete acceleration data as functional snippets, a type of functional data which are observed on a short segment of the entire domain. The analysis of such data requires more sophisticated methods from FDA. Specifically, we make use of a local linear smoothing method. See, for example, Lin and Wang, 9 Zhang and Wang, 10 and Yaoet al. 11 FDA is an important tool for sports analytics since many quantities of interest are indexed by the time of the match, by matches or by seasons. FDA has been utilized in various sports including basketball 12 and rugby league. 13 Statistical contributions to sport are highlighted by Albert et al. 14
In the "Data" section, we describe the data used in the development of the maximum acceleration curve. The "Construction of acceleration curves" section is the more technical component of the paper where FDA techniques are implemented to handle the truncated acceleration data. The major result from this section is the construction of the maximum acceleration versus age curve shown in Figure 1. In the “Relationship to ageing curves" section, we provide an introduction to ageing curves in sport, and demonstrate the remarkable similarity between the maximum acceleration curve produced in the “Construction of acceleration curves" section with a soccer ageing curve. The similarity has profound implications for the prediction of future performance, a problem that has been traditionally difficult to solve. In the “Performance prediction in practice" section, we describe an informal procedure for assessing maximum acceleration curves. A short discussion follows in the “Discussion" section.
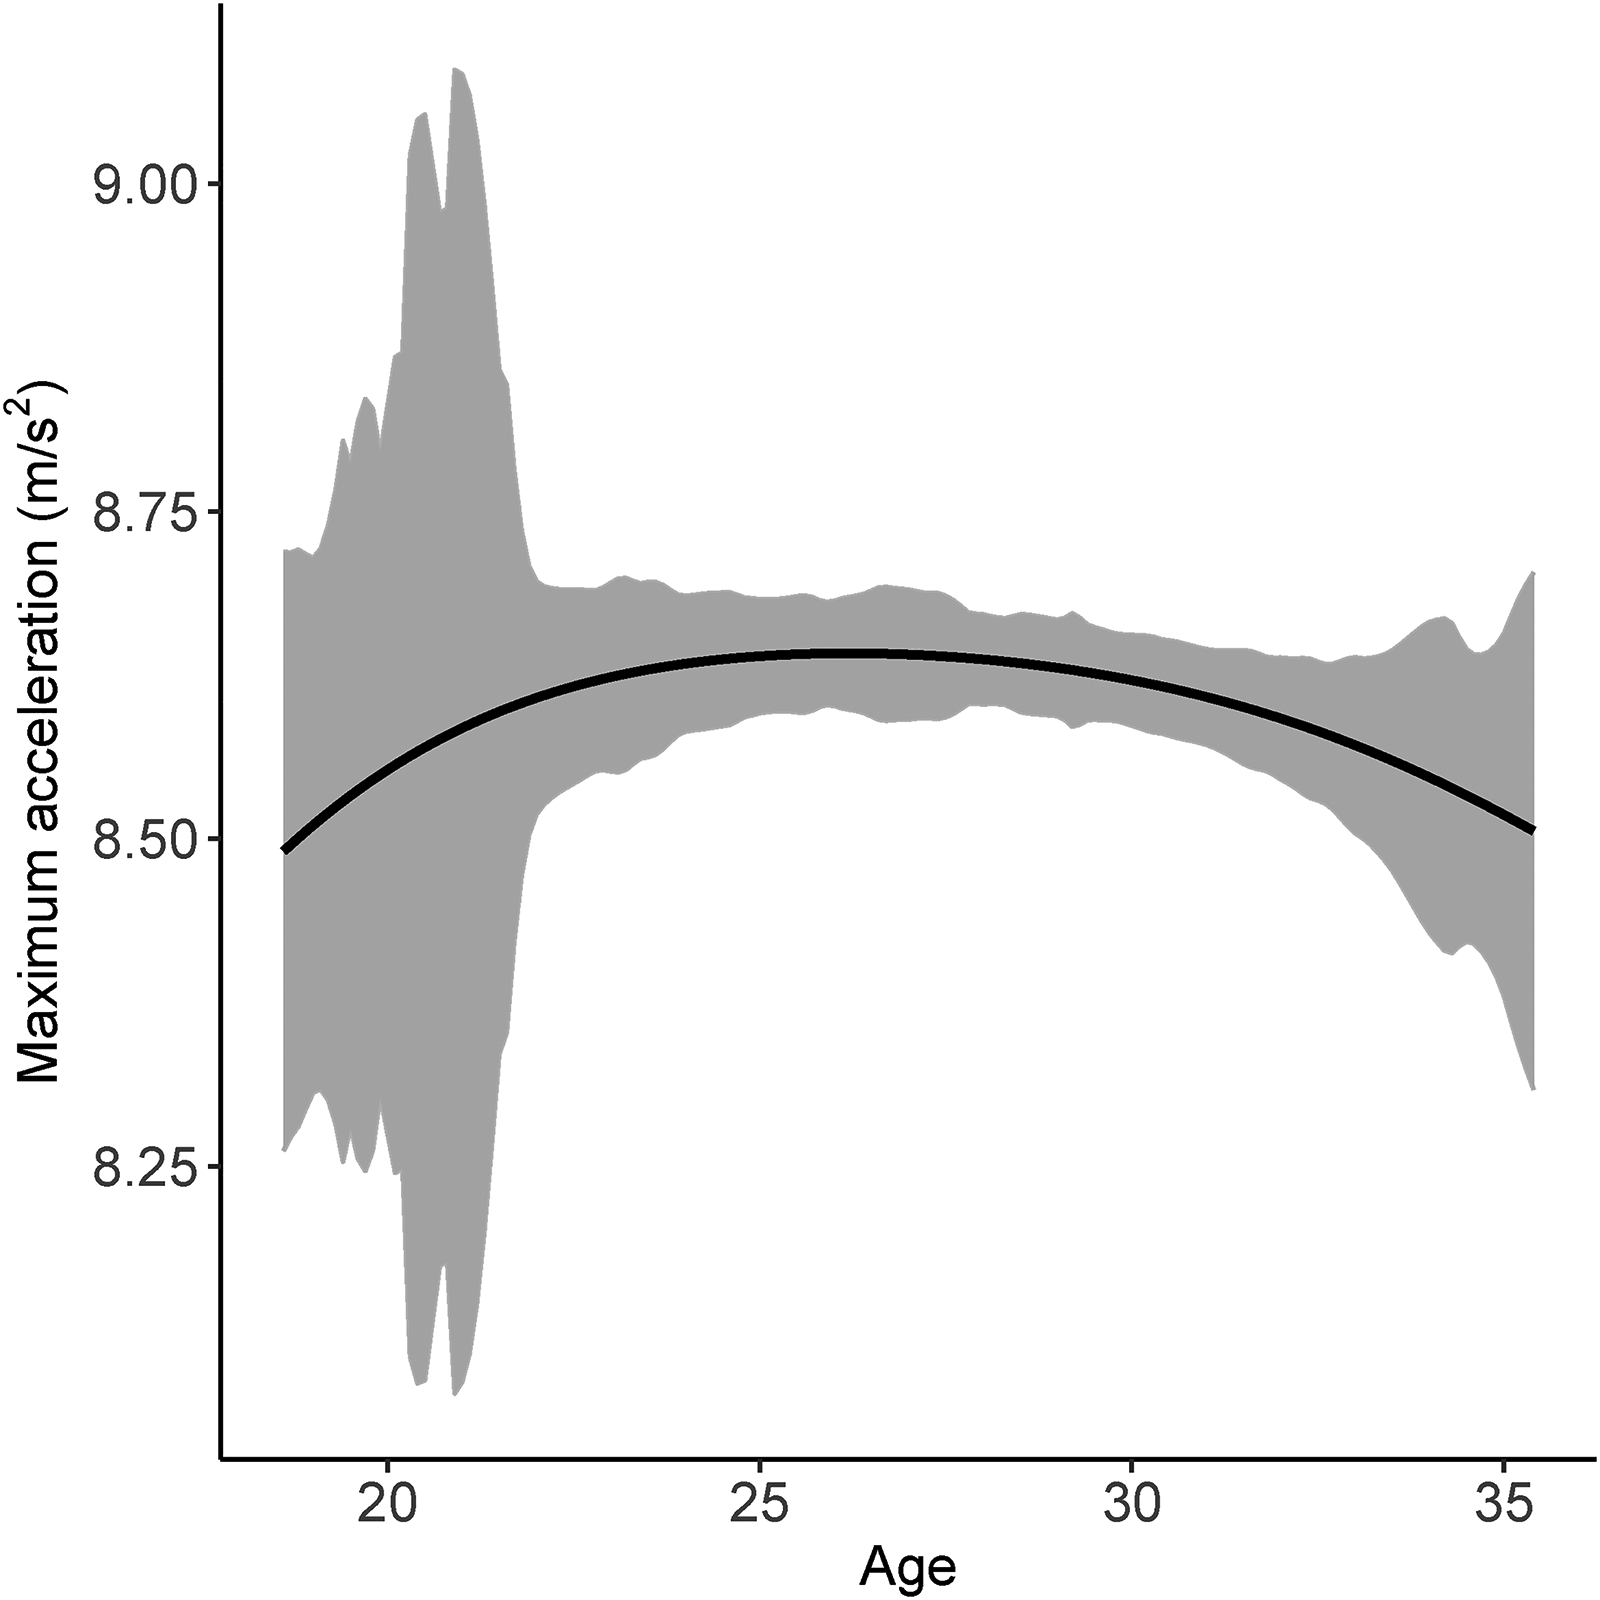
Curve and 95% CI of maximum acceleration versus age obtained from the functional data analysis (FDA) methods of the “Construction of acceleration curves’ section.
Data
For this investigation, we have a big data problem where player tracking data are available for 237 regular season matches (three matches missing) from the 2019 season of the Chinese Super League (CSL). The schedule is balanced where each of the 16 teams plays every opponent twice, once at home and once away.
There are various ways in which tracking data can be collected. One approach involves the use of radio-frequency identification technology where each player and the ball have tags that allow for the accurate tracking of objects. In the CSL dataset, tracking data are obtained from video and the use of optical recognition software. Our tracking data consist of roughly one million rows per match where the data are recorded every 1/10th of a second. Each row corresponds to a particular player at a given instant in time. Although the inferences gained via our analyses are specific to the CSL, the methods are applicable to any soccer league which collects tracking data. Furthermore, the CSL is the top professional league in China, and we suspect that player acceleration profiles may be similar between the CSL and other major soccer leagues. CSL tracking data have been used in various recent sport analytics investigations including Guan et al., 15 Wu and Swartz, 16 Epasinghege Dona and Swartz17,18 and Wu et al. 19
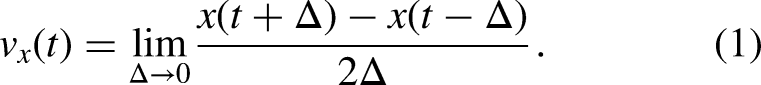
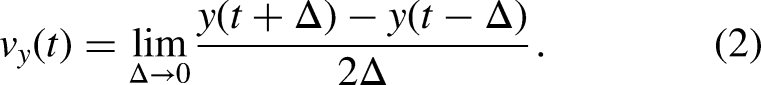
Using the CSL tracking data, we now consider the calculation of maximum acceleration for a particular player for a single match. The following development is based on Wu and Swartz
20
where there is an emphasis on the accuracy of calculations involving player tracking data. If
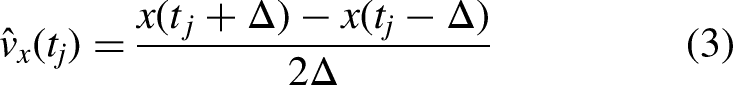
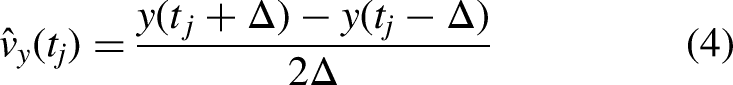
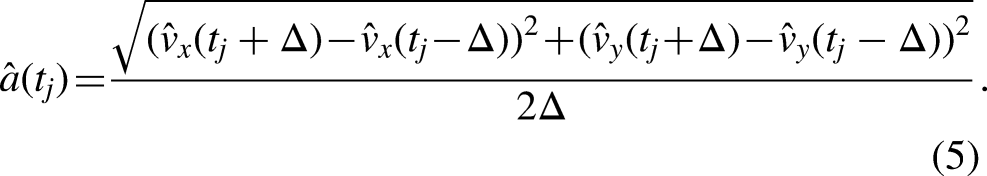
We measure acceleration as a scalar quantity, without a directional component. Therefore, following the above development, and using (3) and (4), we approximate

Ideally, we would like to record
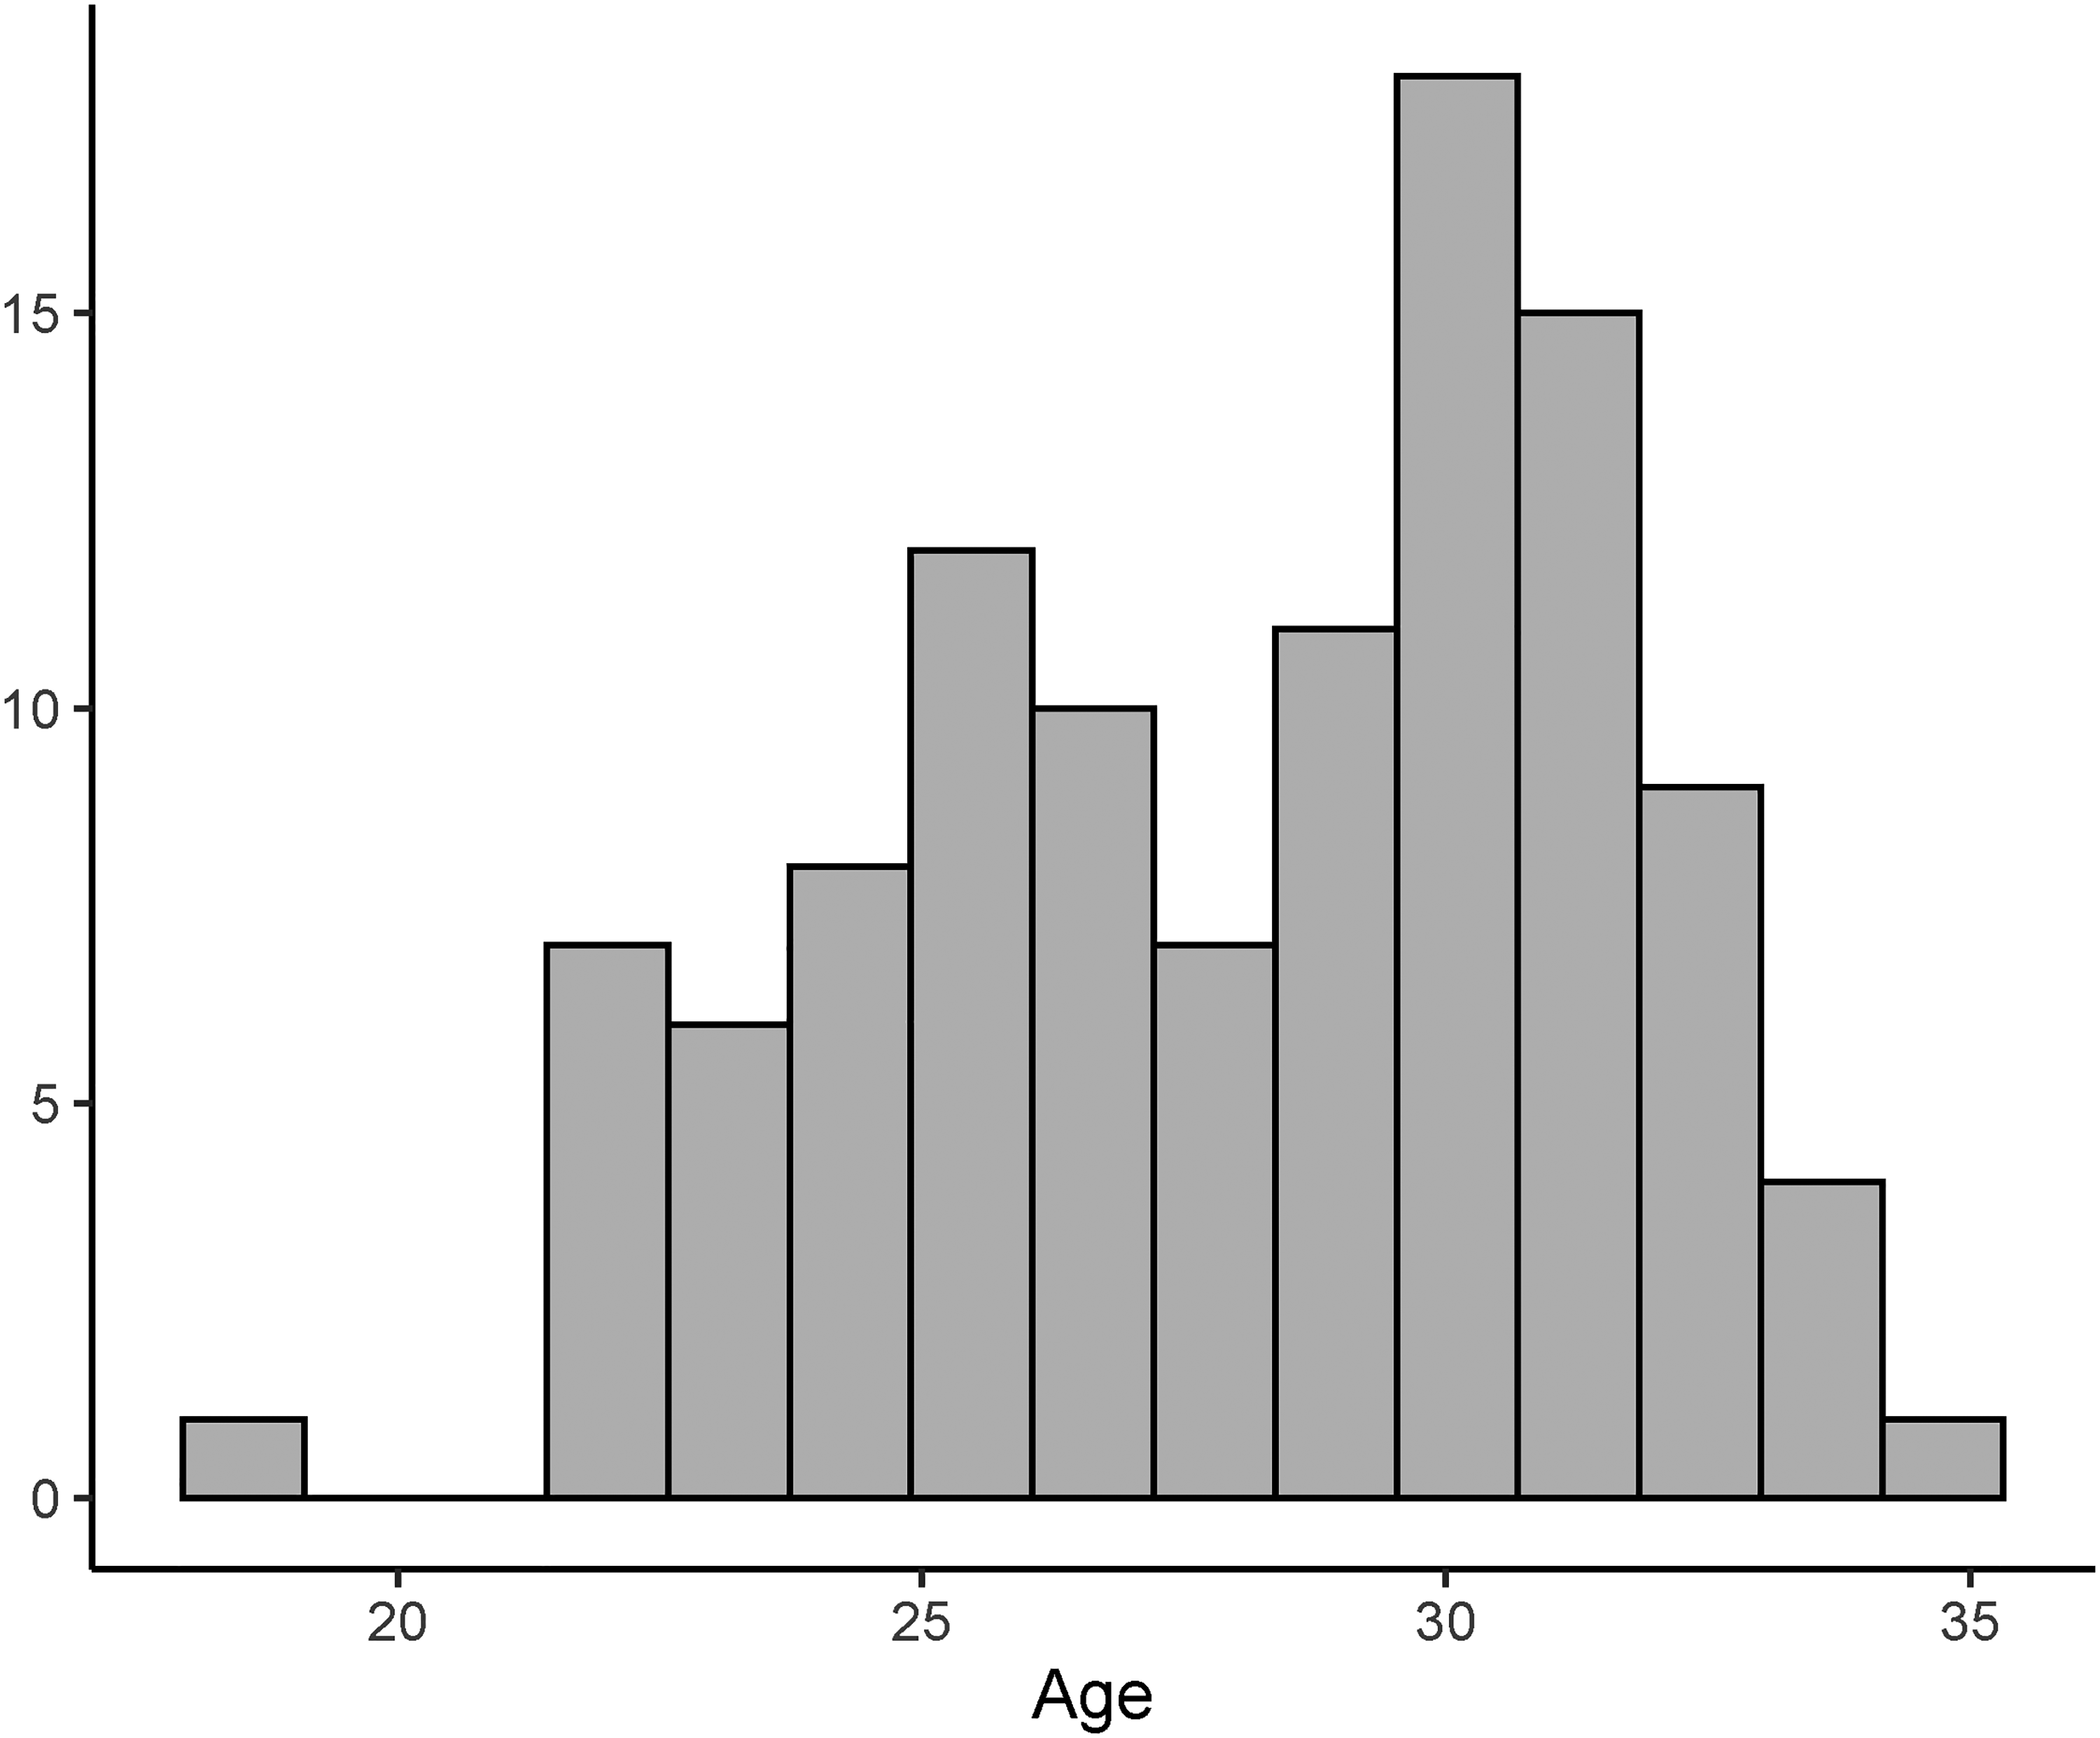
Barplot of the ages of the 109 players in the dataset.
We now illustrate the data collected for a particular player. Consider Paulinho from the Guangzhou Evergrande Taobao Football Club. Paulinho has enjoyed a distinguished football career having played internationally for Brazil (2011–2018) and for Tottenham Hotspur in the English Premier League (2013–2015). In Figure 3, we plot Paulinho’s maximum acceleration over his 28 matches. With age plotted on the horizontal axis, we note that Paulinho began the season at 30.60 years of age, and finished the season at 31.35 years of age. Paulinho had an average
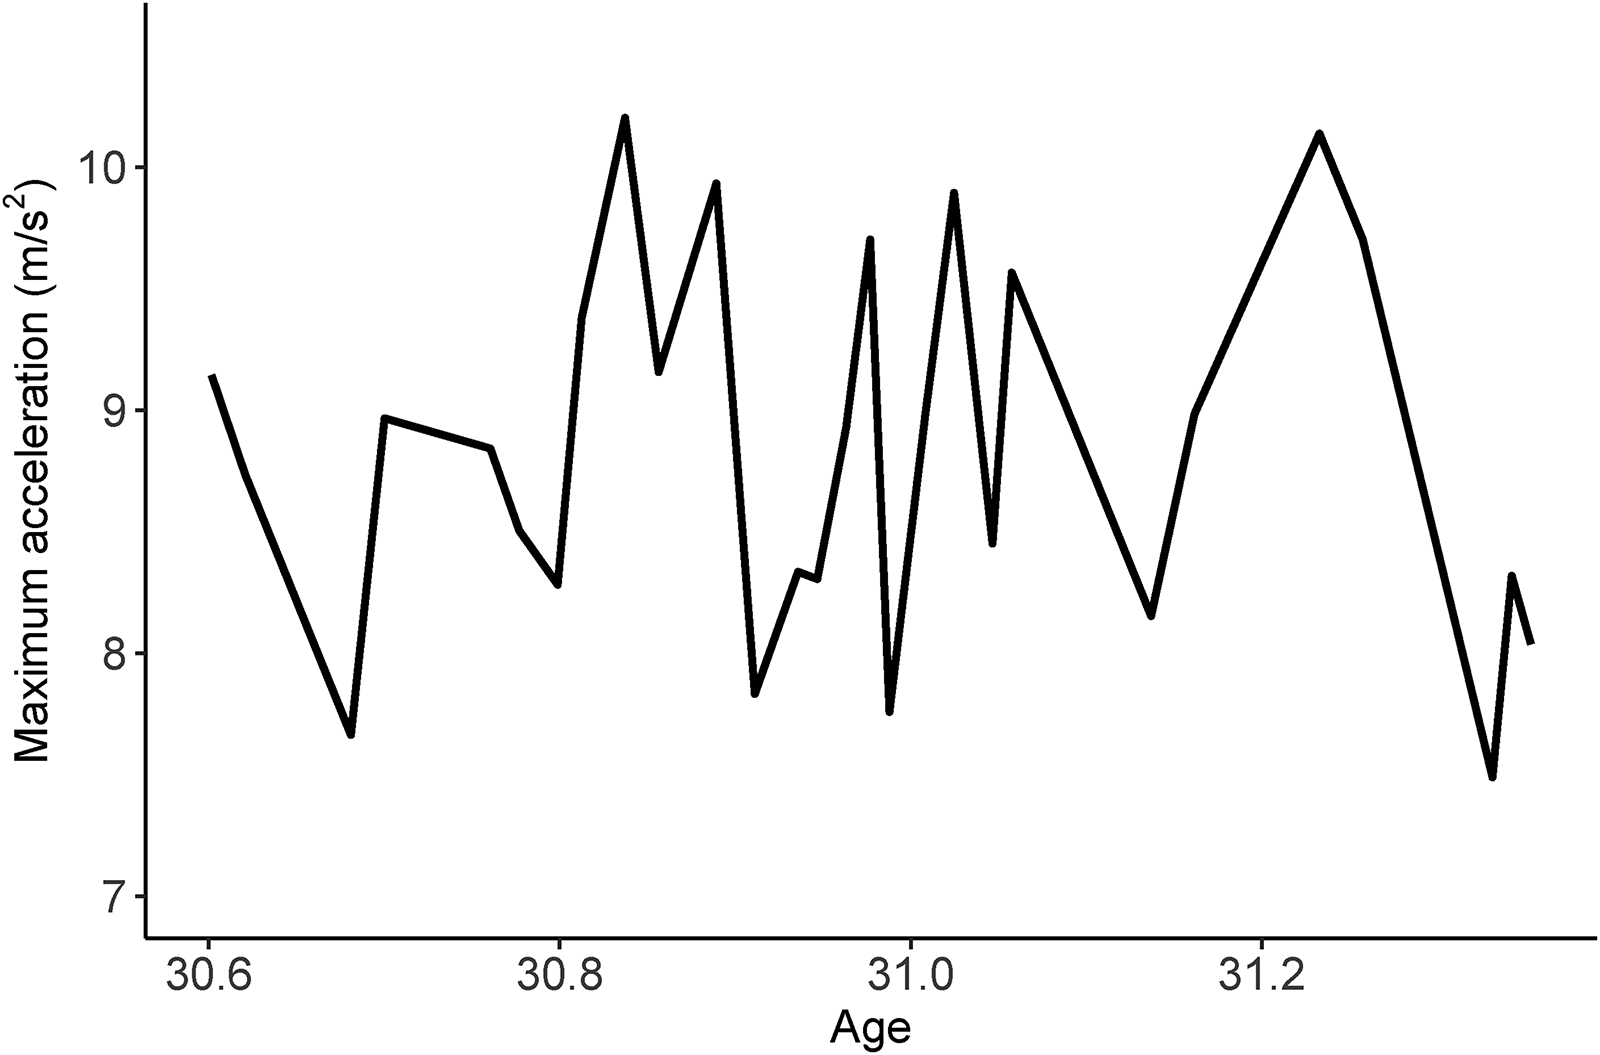
Plot of
Construction of acceleration curves
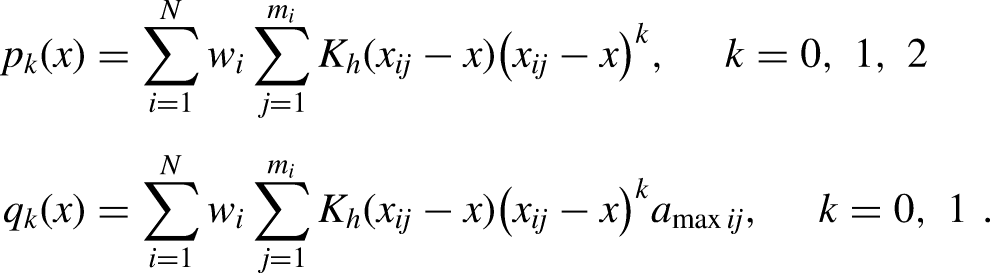
Let

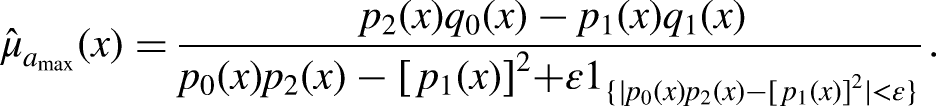
We use a ridged version of the local linear smoother
9
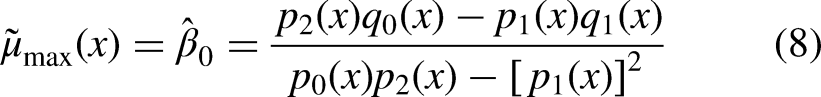
to estimate the mean function
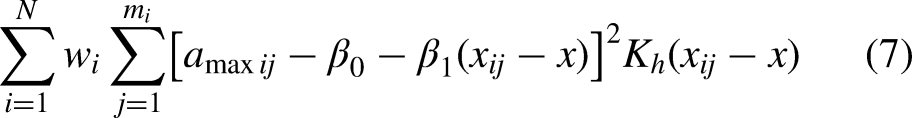
Minimizing (7) yields the nonridged estimator
In the estimating procedure, we use the Gaussian kernel function
By eye, the curve in Figure 1 does seem to have a nearly quadratic shape and this simple approximation may be useful to practitioners. Using the points from Figure 1 at half year increments, we fit the model
Relationship to ageing curves
Important decisions made by the front office staff of major sports clubs involve predicting the future performance of players. These decisions typically arise in the context of drafting, player retention and player acquisition. Good decisions naturally rely on accurate prediction models that relate performance to age. The development of such models in team sports is challenging due to the fact that player performance is highly dependent on teammates and the number of minutes played. This area of research is further complicated by the fact that individual athletes age differently. The resultant curves that relate performance to age are known as ageing curves. On average, players tend to improve from their earliest seasons, plateau, and then decline in performance until they retire from their sport.
There has been considerable work done on ageing curves in sport. In soccer alone, ageing curves have been developed by Swartz et al., 21 Dendir 22 and Kalén et al. 23 Other contributions that address ageing in soccer include Sal de Rellán-Guerra et al., 24 Jamil and Kerruis, 25 Rey et al.26,27 and García-Calvo et al. 28 A review of ageing curves and a new approach for their construction is given by Cavan et al. 29
Swartz et al.
21
produce an ageing curve for soccer that generally resembles alternative constructions of ageing curves. An interesting aspect of Swartz et al.
21
is that they utilize salary data to define the required player performance measure. They suggest that team personnel (who determine salaries) have an intimate knowledge of player performance that is perhaps superior to contextual statistics that may also be used to gauge player performance. With access to the ageing curve data,
21
we denote their performance measure
To compare the acceleration curve of the “Construction of acceleration curves" section with the ageing curve of Swartz et al.,
21
we estimate parameters from the simple linear regression model for performance

In (9), we obtain least square estimates
Dendir 22 presents various analyses that address peak age of soccer players. In particular, Dendir 22 considers separate analyses for defenders, midfielders, and forwards. We calculated the sample correlation between our maximum acceleration curve (Figure 1) and the fixed effect quadratic regressions of Dendir. 22 Again, we obtained strong correlations of 0.822, 0.908, and 0.802 in the case of defenders, midfielders and forwards.
In Figure 4, we superimpose the maximum acceleration curve of Figure 1 with the ageing curve of Swartz et al. 21 The agreement between the curves is very strong, and this leads to an implication of potentially great importance. Namely, since performance is difficult to assess and maximum acceleration is easy to measure, teams may consider using maximum acceleration as a proxy for performance. When a player’s maximum acceleration begins to decline, this may be a signal of anticipated reduced performance.
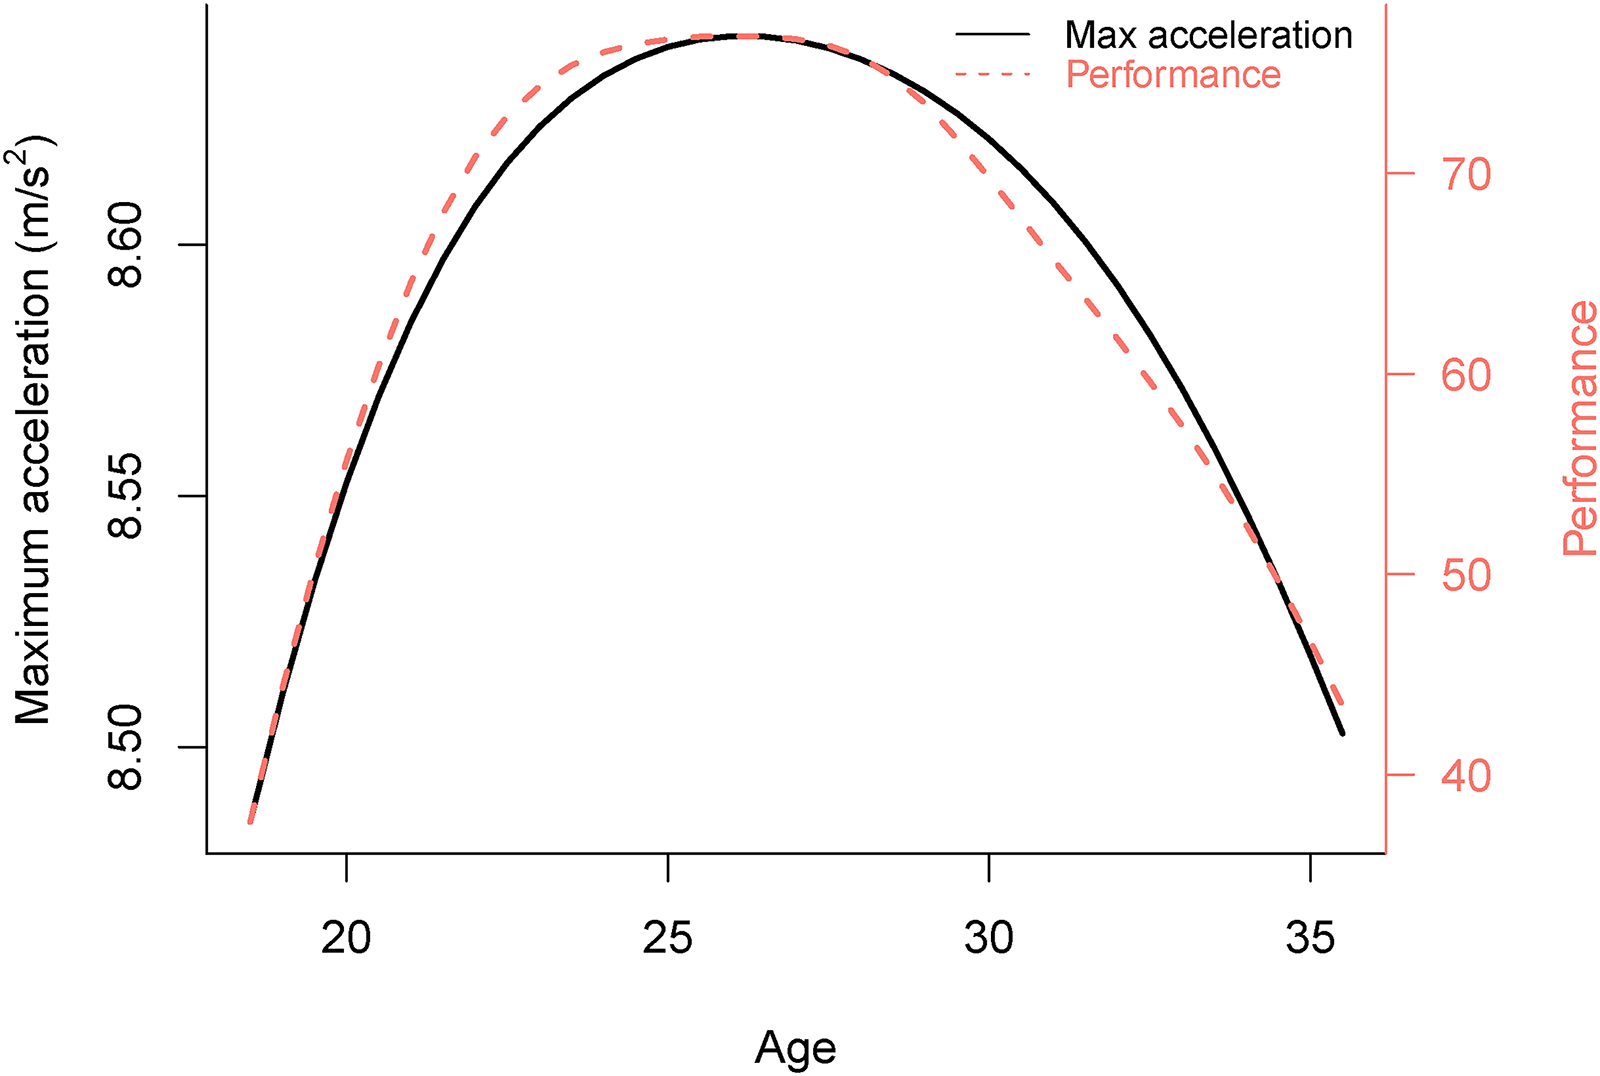
Plot of maximum acceleration curve of Figure 1 superimposed with the scaled soccer ageing curve from Swartz et al. 21
Performance prediction in practice
In practice, suppose that we have a player for whom 5–10 years of tracking data are available. Although formal methods for assessing future performance may be developed, we describe a simple informal procedure that may be sufficient for front office staff.
For each match in the 5–10 year window, we calculate the player’s maximum acceleration
Discussion
This paper contructs a plot of maximum acceleration versus age in soccer. The approach is based on methods from FDA and utilizes tracking data from the 2019 season of the CSL. We have argued that maximum acceleration is an intrinsic characteristic of players. Therefore, the variability of maximum acceleration for a player during the course of a season should perhaps not be as great as shown (see for example, Figure 3). The variability which we observe may be due to the fact that during particular games, players do not need to accelerate to their maximum ability. Going forward, we might reduce the variation in a player’s plot by calculating maximum acceleration from a group of consecutive games rather than a single game. Alternatively, teams could measure maximum acceleration from training sessions where specific movements are encouraged to obtain more precise measurements of maximum acceleration.
Although the technical development of the acceleration plot and the resultant curve are interesting in their own right, the similarity between the acceleration plot and ageing curves in soccer has potentially great impact for decision making in sports analytics. We have argued that the assessment of performance relative to age is a tremendously important problem for professional sports teams. An issue with performance is that performance is difficult to assess; did the player not score because of bad luck or is the player really experiencing a decline in performance due to age? On the other hand, maximum acceleration can be measured easily, and with minimal error. We also note that match performance metrics typically depend on a player’s team and teammates; this is not the case with the maximum acceleration metric. Acceleration can also be measured by teams over seasons. Therefore, changes in maximum acceleration with respect to age can be detected. If, as it seems, maximum acceleration is highly correlated with performance, then maximum acceleration may be used as a proxy by teams to predict future performance.
As pointed out by the Reviewer, in the future, it is conceivable that teams may consider maximum acceleration as a proxy for the prediction of performance, which creates incentives for players to improve maximum acceleration. This insight suggests various questions: Is it possible to markedly improve maximum acceleration via training? If so, would the observed strong correlation between maximum acceleration and performance continue to exist? Also, future investigations may be carried out involving La Liga since the study by Lorenzo-Martinez et al. 1 did not find a relationship between maximum player acceleration and age. Finally, the variability of the curve in Figure 1 associated with players under 22 years of age suggests that more data ought to be collected for this age interval.
Footnotes
Acknowledgements
The authors thank Daniel Stenz, former Technical Director of Shandong Luneng Taishan FC who provided the data used in this paper. The authors also thank the Reviewer László Csató whose helpful comments improved the paper.
Declaration of conflicting interests
The authors declared no potential conflicts of interest with respect to the research, authorship, and/or publication of this article.
Funding
The authors received the following financial support for the research, authorship and/or publication of this article: Guan and Swartz have been partially supported by the Natural Sciences and Engineering Research Council of Canada. This work has been carried out with support from the CANSSI (Canadian Statistical Sciences Institute) Collaborative Research Team (CRT) in Sports Analytics.