
Abstract
This study aimed to quantify the variability of physical, technical, and subjective task-load demands in small-sided games (SSGs), and the effect of manipulating of pitch size and player numbers in SSG in adolescent rugby union (RU) players. Twenty-six subjects completed six conditions in a crossover study design. In each condition subjects played 4 × 3-min periods of an SSG. Games were completed with either 4 × 4, 6 × 6 or 12 × 12 players on either a small (W: 25 m, L: 30 m), medium (W: 30 m, L: 40 m), or large (W: 35 m, L: 50 m) sized pitch. Match demands were assessed using global navigation satellite systems, heart rate (HR) monitors, ratings of perceived exertion, National Aeronautical Space Association task-load index and video analysis. Statistical analysis comprised of typical error, coefficient of variation (CV) and intra-class correlations to assess variability, and the use of linear mixed effects modelling to assess differences between conditions. A range of variability was observed in technical (CV = 25.00% to 52.38%), physical (CV = 4.12% to 51.18%) and subjective task-loads (CV = 7.65% to 17.14%) between identical games. Reducing player numbers increased physical demands such as m/min (ES range = 0.45 to 1.45), technical exposures such as total involvements (ES range = 0.04 to 0.63) and effort, physical and temporal task-loads. Increasing pitch size caused greater movement demands such as m/min (ES range = 0.11 to 0.79), but did not change the technical demands.
Introduction
Small-sided games (SSGs) are a popular method of training in team sports, such as rugby union (RU). 1 SSG are thought to be useful for athletes as they allow physical, tactical, technical and psychological elements of a sport to be trained simultaneously.2,3 However, altering the constraints of SSGs has been shown to influence factors that are important to developing physical capacities and technical skills, such as training intensity (e.g. m/min) and technical exposures (e.g. passes per player).4,5 Consequently, designing SSG that can target certain physical, tactical, technical, or psychological elements is important for coaches to ensure games are specific to the desired outcomes. One method that alters the outcomes of SSG is task constraint manipulation.3,6
The constraints of SSG (e.g. pitch size and player numbers) can be manipulated to elicit different outcomes. 7 For example, changing the field size from 400 m2 to 2800 m2 with junior rugby league players increased the distance covered by approximately 15 m/min. 8 However, the study employed ‘offside touch’ games, 8 whereby players can be in an ‘offside’ position and pass the ball in any direction, altering the physiological and skill demands of the game. 9 Additionally, altering the number of players on the pitch can change the number of technical exposures.4,5 There is currently limited research into the effect of manipulating task constraints on physical demands in onside RU SSG. Therefore, developing an understanding of how constraint manipulating influences game demands allows coaches to plan training loads and target certain qualities accordingly.
The training practices of adolescent athletes, and the subsequent physiological responses can be measured through external and internal load monitoring tools.10,11 Global navigation satellite systems (GNSS) and accelerometry have been used extensively in adolescent RU. 12 However, some previous research investigating the effect of pitch size on external demands was performed using GNSS units that have been shown to have poor reliability at high speeds. 13 Additionally, internal load measures, such as heart rate (HR) or session rating of perceived exertion (sRPE) can be used to assess responses to the external load. 14 Despite the high frequency of acceleration and decelerations in RU, average acceleration demands have not previously been reported for SSG.3,15 Acceleration and deceleration demands have been associated with common fatigue markers including soreness, creatine kinase concentration, and decreases in neuromuscular function.16,17 Understanding both the internal and external demands of SSG may assist coaches in planning effective training practices.
One of the benefits of SSG is that they can be used to practice technical skills, in addition to developing physical capacity,5,8,18 whilst also exposing athletes to a variety of psychological situations. Skill development through a games-based approach is thought to be more effective than traditional, closed drills, due to greater specificity. 19 However, there is conflicting research as to the variability of skill exposure when task constraints are identical.20,21 Further, it is not currently known how manipulating pitch size and player numbers may influence technical exposures in RU SSG. Understanding the technical demands of SSG, and the effect of constraint manipulation, may alter the exposure to skilful tasks (e.g. catching, passing), in a variable environment. Altering constraints will also change subjective task-loads which are important in understanding the psychological demands of different drills. 22
To fully understand the influence of constraint manipulations on SSG it is important to examine the changes in technical, tactical, physical, and task-load demands. Accordingly, the aims of this study were to assess the effect of manipulation of pitch size and player numbers in SSG on the physical, technical, and subjective task-load demands in adolescent RU players during an on-side touch game. Additionally, this study assessed the variability of physical, technical, and subjective task-load demands in SSG. It was hypothesized that reducing pitch size and increasing player numbers would increase the movement demands; that reducing player numbers would increase the technical exposures, with no effect on pitch size; and that reducing pitch size and increasing player numbers would increase subjective task load scales such as level of effort and physical demands. Additionally, it was hypothesized that physical demands would have low variability, whilst technical exposures and subjective task-loads would have high variability.
Methods
This study assessed the effects of pitch size and player number manipulation on the physical, physiological, technical, and subjective task-load demands in adolescent RU players using a crossover study design. A convenience sample of 26 adolescent males volunteered to participate within this study (M ± SD, age: 16.0 ± 1.0 years, height: 1.76 ± 0.06 m, body mass: 75.85 ± 11.67 kg, years from peak height velocity: 1.28 ± 0.86, MAS: 3.75 ± 0.28 m s−1, MSS: 8.45 ± 0.43 m s−1). All subjects had at least two years’ experience in RU and were in a schoolboy ‘performance squad’. Teams during the SSG were pair matched according to athlete MAS, with each teams opposition decided randomly. If subjects were unable to attend the training session (n = 3) they were replaced with a player with similar MAS. Ethics approval was granted by the Australian Catholic University human research ethics committee (2022-2717H). All subjects and parents were provided with an information letter and gave written assent, along with parental consent.
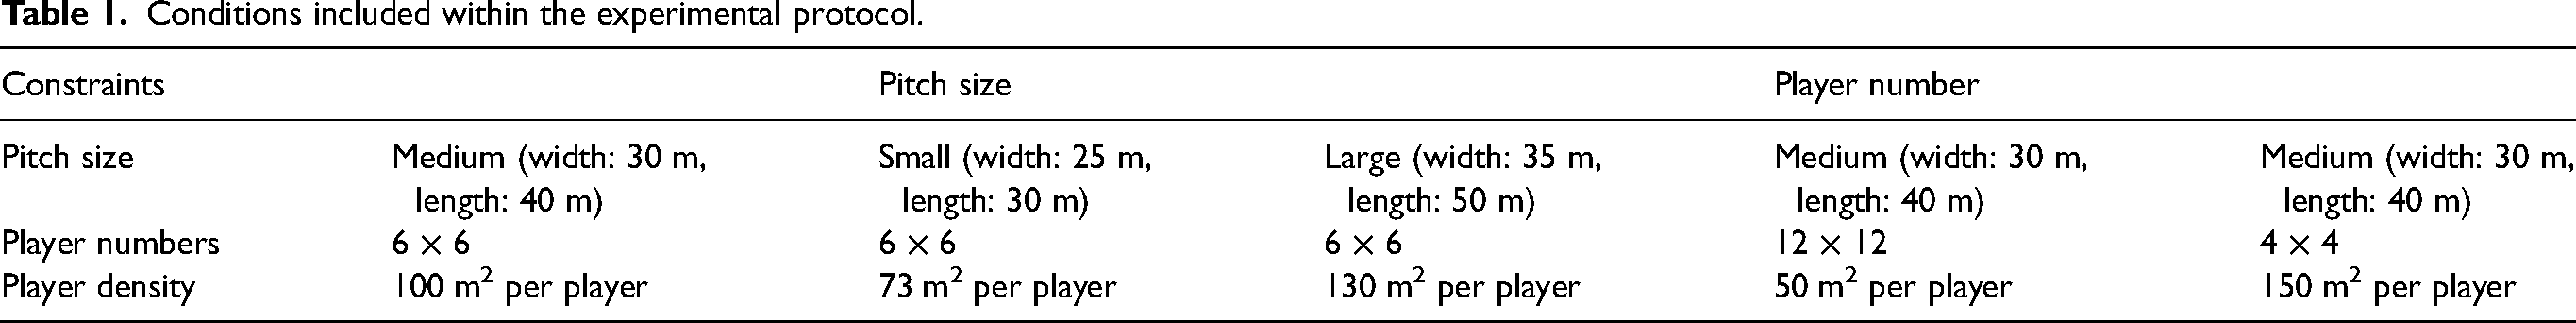
All subjects completed seven sessions within a three-week period. In the first session, subjects were familiarised with the SSGs, and completed anthropometric screening (standing height, seated height, and body mass) and physical testing (40 m sprint, 2 km time trial). In sessions 2 and 3, subjects completed a 6 × 6 game on a medium-sized pitch as the reference condition to establish reliability. In sessions 4 and 5, the pitch size was manipulated using a counterbalanced design and player numbers were manipulated in sessions 6 and 7 (Table 1). Pitch size was determined using common landmarks on the pitch, and ensuring similar player densities to those previously reported4,23,24
Conditions included within the experimental protocol.
Subject standing and seated height were recorded using a stadiometer (Design No. 1013522, Surgical and Medical Products, Seven Hills, Australia). Maturation was estimated using the Mirwald equation. 25
Maximal sprint speed was assessed using a 40 m linear sprint. Two markers were placed 40 m distance away from each other, on a dry, synthetic outdoor running track. Subjects begun in a two-point stance, immediately behind a marker, and self-initiated the start of the sprint. 26 Each subject was allowed two attempts, separated by approximately 3 min. Maximal sprint speed was recorded using a 10 Hz GNSS device (Catapult Optimeye X4 and S5; Catapult Innovations, Melbourne, Australia), which is valid in assessing MSS (mean bias = −0.77% (90% CI: [−1.13 to −0.42]).11,27 To assess aerobic fitness, subjects completed a 2 km time trial on the same 400 m running track. The 2 km time trial was selected as it has previously been shown to have strong relationships to maximal aerobic speed 28 and has demonstrated acceptable reliability (CV 1.9%; intra-class correlations [ICC] 0.95). 29 Time was assessed via a hand-held stopwatch (Regent 240 Econo Sports Stopwatch, Regent, Victoria, Australia) and manually recorded. All subjects were encouraged to give a maximum effort throughout the 2 km trials. The result of the 2 km time trial was then used to infer MAS using the Bellenger equation. 28 Anaerobic speed reserve (ASR) was then calculated by subtracting MAS from MSS. 30
SSG rules
All games used the same modified, onside, ‘touch’ rules. These rules required the tackler to touch the ball carrier with two hands to simulate a tackle. After a touch, the tackler completed a modified burpee, which involved the tackler going to ground and rolling to simulate the post tackle sequence, while the ball carrier went to ground, and passed to a support player. Each team had six touches before a turnover occurs on the sixth, or a knock-on (i.e. the ball was dropped and went forward) occurred. When a try was scored, the team that scored the try remained in possession of the ball and played in the opposite direction to facilitate continuity of play. If the ball went out of bounds, referees would immediately feed a new ball to the opposition of the team that last touched the ball. The same referees were used throughout all sessions, with consistent encouragement to the players.
Match demands
All sessions were completed with subjects’ wearing a 10 Hz GNSS (Catapult Optimeye X4 and S5; Catapult Innovations, Melbourne, Australia) device secured between subjects’ shoulder blades using a fitted bib. These devices have been shown to be reliable over multiple days for measuring the variables of interest. 31 All subjects were assigned a GNSS unit to be used throughout the data entire collection period. Signal quality throughout the period of data collection was adequate, as the average number of satellites was 12.6 ± 3.0, and the average horizontal dilution of precision was 0.77 ± 0.11. 32 GNSS units were turned on 15 min prior to the start of each session. Data were downloaded using OpenField (Catapult Innovations, Melbourne, Australia). In addition to average running speed, running was categorised into five individualised velocity bands, <60% MAS, 60–79% MAS, 80–99% MAS, 100% MAS–29% ASR, and >30% ASR. 33 Relative velocity zones were used as it has been demonstrated that the use of arbitrary speed thresholds is likely to inaccurately estimate the workloads performed. 34 Additionally, acceleration load and acceleration density index were collected. 35 Acceleration density index is the ratio between acceleration load and total distance (i.e. acceleration load per 10 m). 36
All subjects wore an HR monitor (H10, Polar, Oy, Finland), that was secured to the subject's chest with an elastic strap. HR monitors were synced to the subject’s GNSS unit, and data was downloaded using Openfield. The variables assessed were average and maximal HR. Additionally, to assess the perceived internal response to training load, 15 min following the end of the touch games subjects completed a written sRPE questionnaire using the Borg category-ratio 10 scale, which has previously been validated in adolescent athletes.37–39 Subjects completed the sRPE questionnaires independently and blinded from other subjects to control for peer influence. 40
The National Aeronautics and Space Administration Task-load Index (NASA-TLX) was used to assess subjective task-related workload. 41 The NASA-TLX has been previously validated and is comprised of six scales, representing physical, mental and temporal demands, as well as levels of frustration, effort and performance.41,42 Subjective task-load is the perceived effort or cost incurred to achieve a level of performance, based on all elements of a task, and has previously been related to increased fatigue and reduced athletic performance.43,44 Each scale is made up of 21 gradations, between ‘Very Low’ and ‘Very High’. Subjects completed the NASA-TLX, approximately 15 min following each condition, by writing an X on the scale. Subjects completed the NASA-TLX independently and were blinded from other subjects to control for peer influence. 40
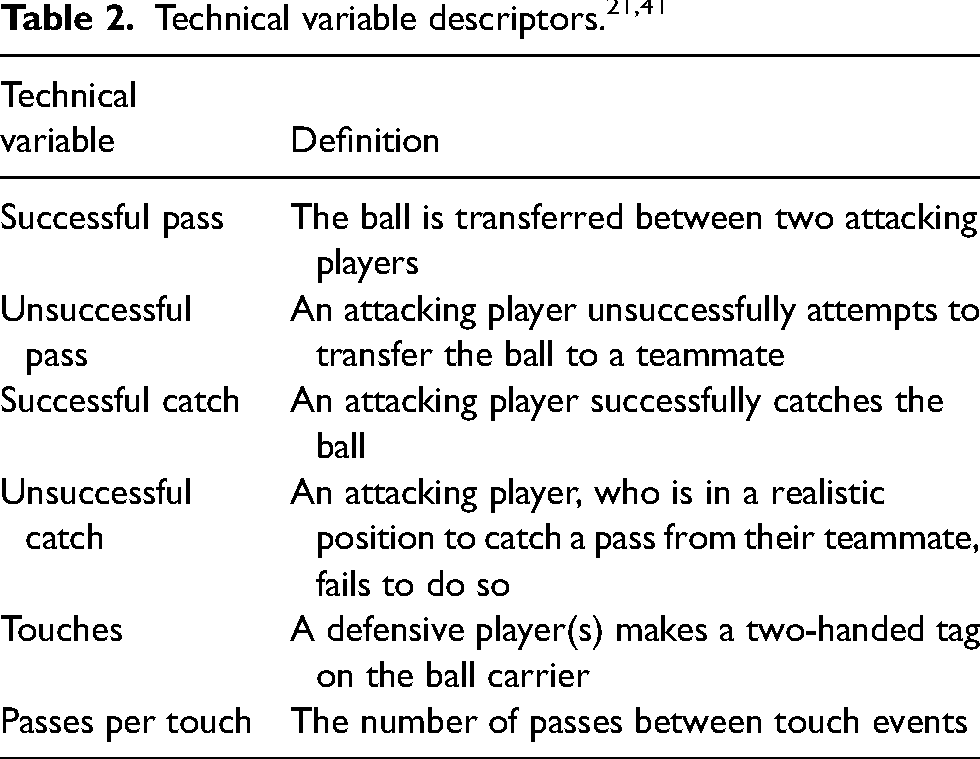
To assess the technical and tactical demands, games were filmed using a VEO Camera 1.0 (VEO Technologies, Copenhagen Denmark), raised on a 7.3 m tripod. To determine intra-rater reliability, a single game was selected at random, and re-analysed two weeks following initial analysis (ICC = 1.00). To ensure appropriate interrater reliability, a single game was selected at random and all technical variables were analysed by a second observer (ICC = 1.00). Technical variables that were selected are commonly performed actions in RU and have been previously reported in SSG research (Table 2).3,45
Statistical analysis
Unless indicated, data are presented as mean ± standard deviation (SD). To determine whether continuous dependent variables (i.e. m/min, average acceleration, etc.) were significantly different between conditions, linear mixed effects models with gaussian regression were used, whereby condition (i.e. pitch size or player number) was a fixed effect, and subject ID was included as a random intercept. Post-hoc pairwise comparisons were performed with a Tukey adjustment to account for multiple comparisons. Separate models were built for each outcome variable of interest (i.e. m/min, percent maximum velocity (%VMAX), and acceleration density etc.). To assess count variables (i.e. number of passes, catches, and TLX subscales), generalised linear mixed-effects models with Poisson regression were used; with separate models were built for each outcome variable of interest. To assess the magnitude of the differences Cohens d effect sizes were estimated from the t statistics.46,47 Effect sizes were considered trivial (d = 0.00–0.19), small (d = 0.20–0.49), medium (d = 0.50–0.79) and large (d = ≥0.8). 48 Confidence intervals were constructed using pooled standard deviations. Unclear effects were identified by the confidence intervals crossing 0.2 on both the positive and negative boundaries. Statistical significance was set at p < .05 for all analyses.
Reliability was assessed in the 6 × 6 condition, on a medium-sized pitch. Absolute reliability of all variables was assessed by the typical error of the measurement. Relative reliability for continuous was determined via a log-transformed within subject coefficient of variation (CV), expressed as a percentage. Relative reliability for count variables was assessed using the CV median absolute deviation method. 31 Additionally, the ICC coefficient (model2,k) was reported. Reliability data were calculated using a purpose made excel spreadsheet. 49 All other statistical analyses were performed using the R statistical programming language (R version 4.2.1, R Foundation for Statistical Computing, Vienna, Austria) within the RStudio environment (Version 1.1.383, Posit, Boston, MA).
Results
The mean ± SD results for physical, technical, and subjective task-load demands can be found in Table 3. Additionally, the reliability for all reported variables can be found in Table 4.
Description of the physical, technical, and subjective task-load demands in each condition.
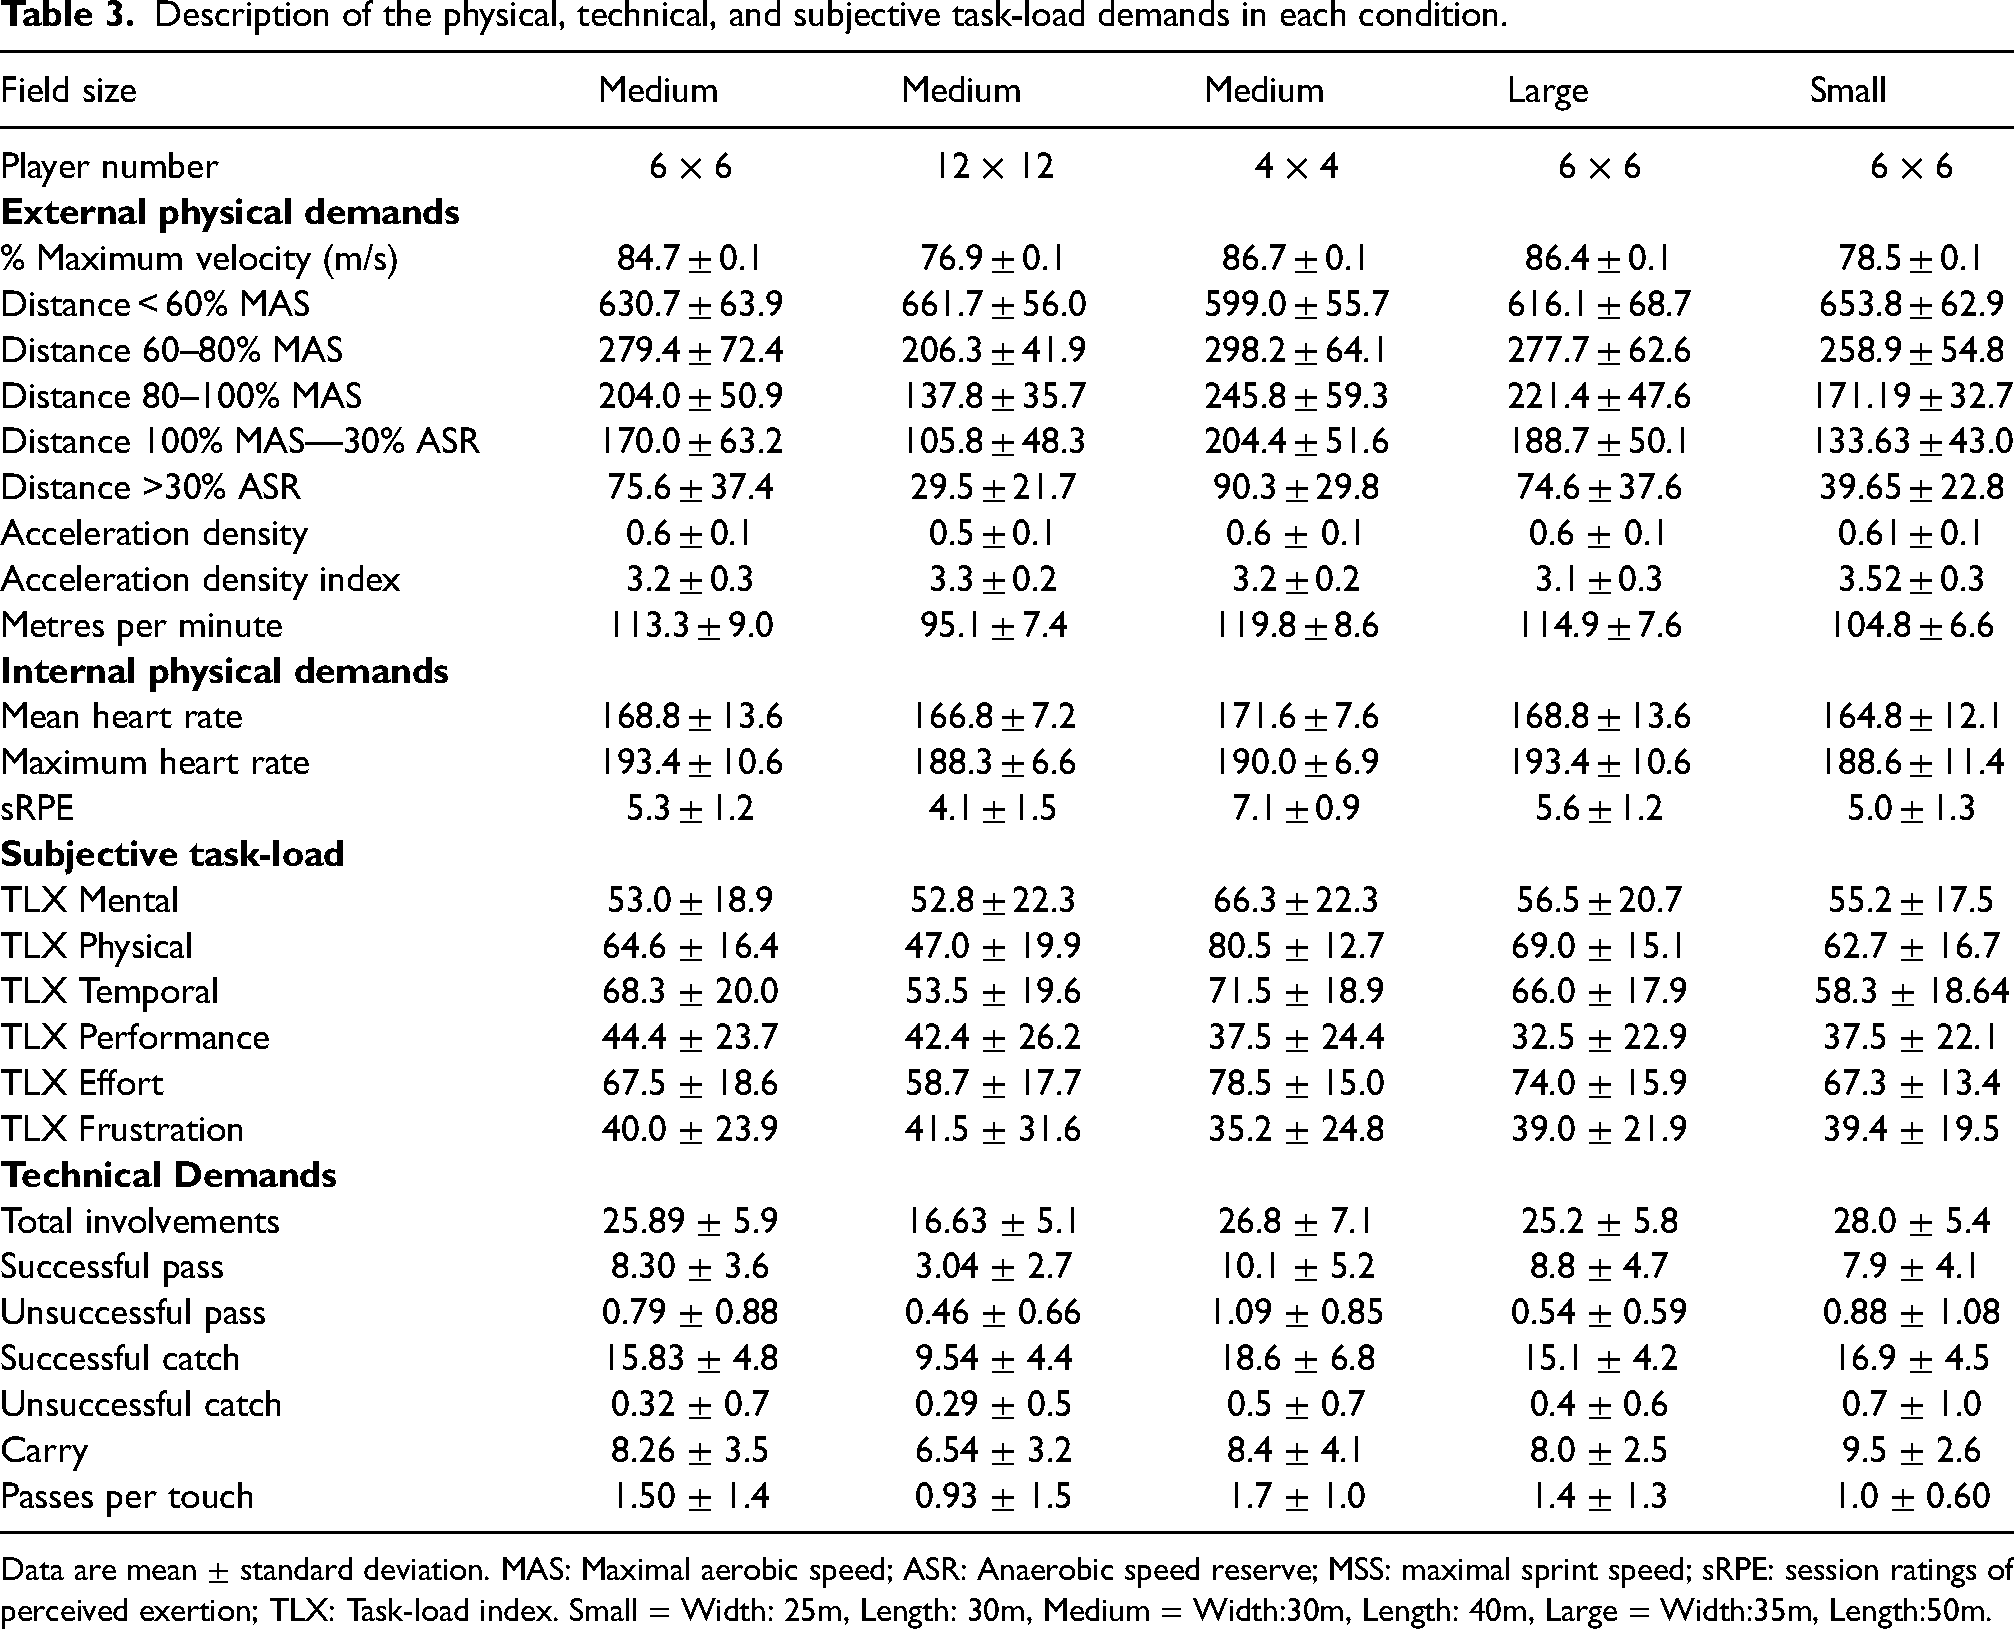
Data are mean ± standard deviation. MAS: Maximal aerobic speed; ASR: Anaerobic speed reserve; MSS: maximal sprint speed; sRPE: session ratings of perceived exertion; TLX: Task-load index. Small = Width: 25m, Length: 30m, Medium = Width:30m, Length: 40m, Large = Width:35m, Length:50m.
Reliability statistics for physical, tactical, and subjective task-load demands in 6 × 6, medium condition.
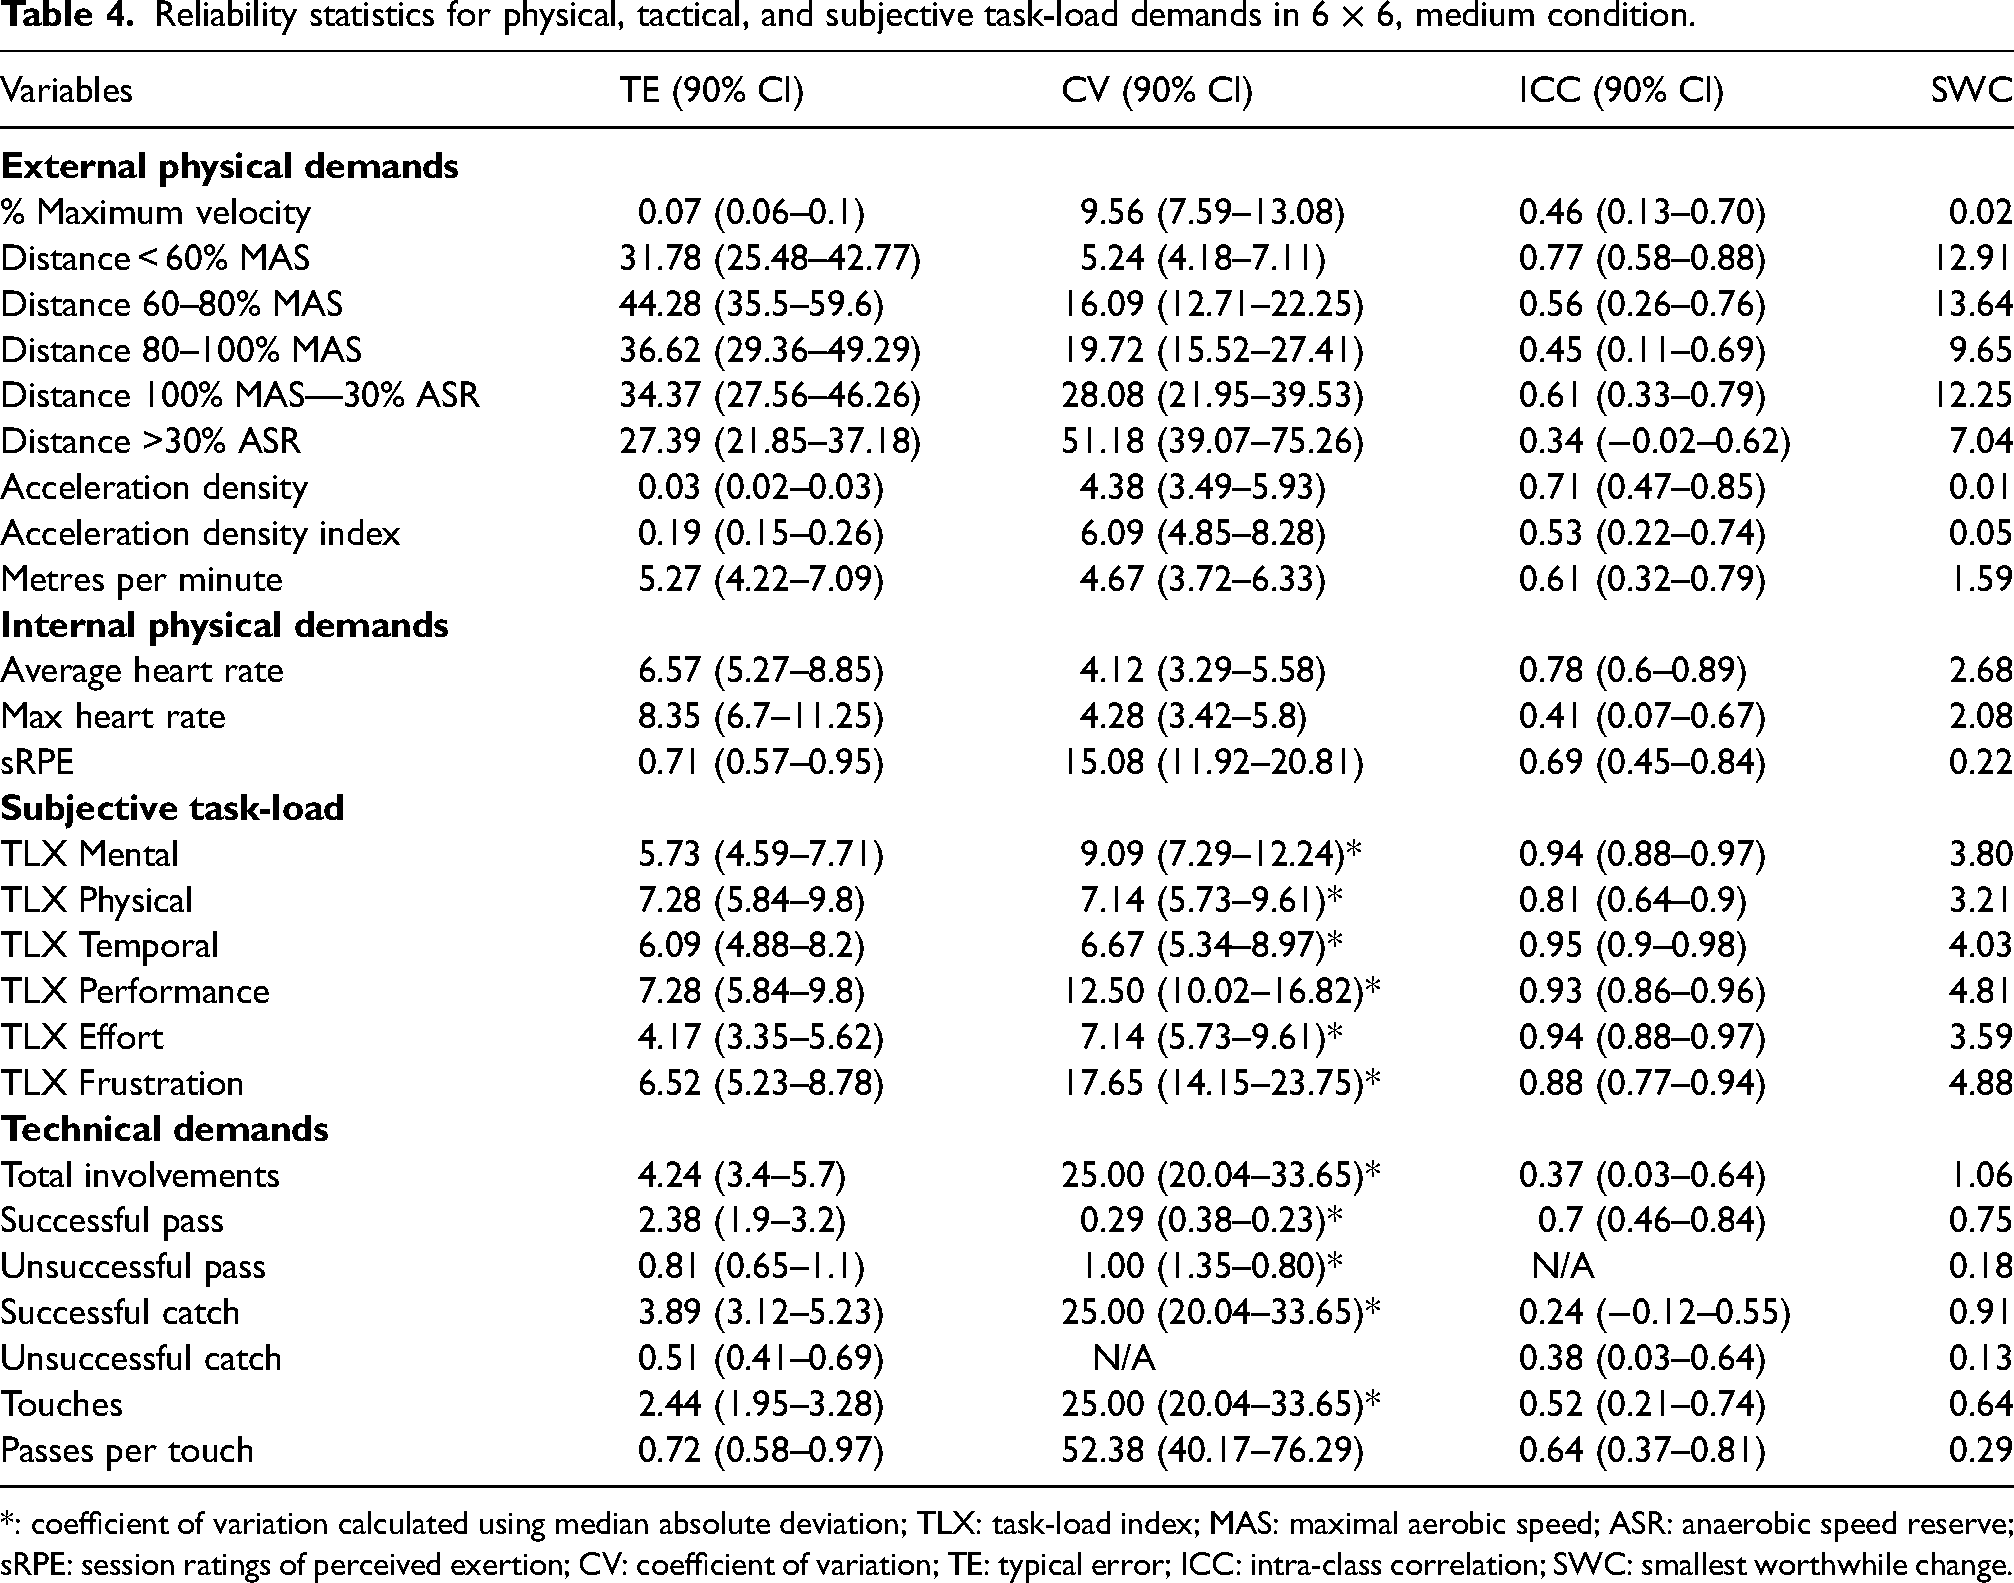
*: coefficient of variation calculated using median absolute deviation; TLX: task-load index; MAS: maximal aerobic speed; ASR: anaerobic speed reserve; sRPE: session ratings of perceived exertion; CV: coefficient of variation; TE: typical error; ICC: intra-class correlation; SWC: smallest worthwhile change.
Physical demands
Pitch size
For physical demands, there were no significant differences between the medium and large pitch size conditions (Figure 1).
Difference in physical demands between medium 6 × 6 and large 6 × 6 conditions. Data are Cohens d effect size ± 95% CI. *: p < .05, **: p < .01, ***: p < .001. Dashed horizontal lines represent ES threshold for small, medium and large effects. MAS: maximal aerobic speed; ASR: anaerobic speed reserve; sRPE: session rating of perceived exertion.
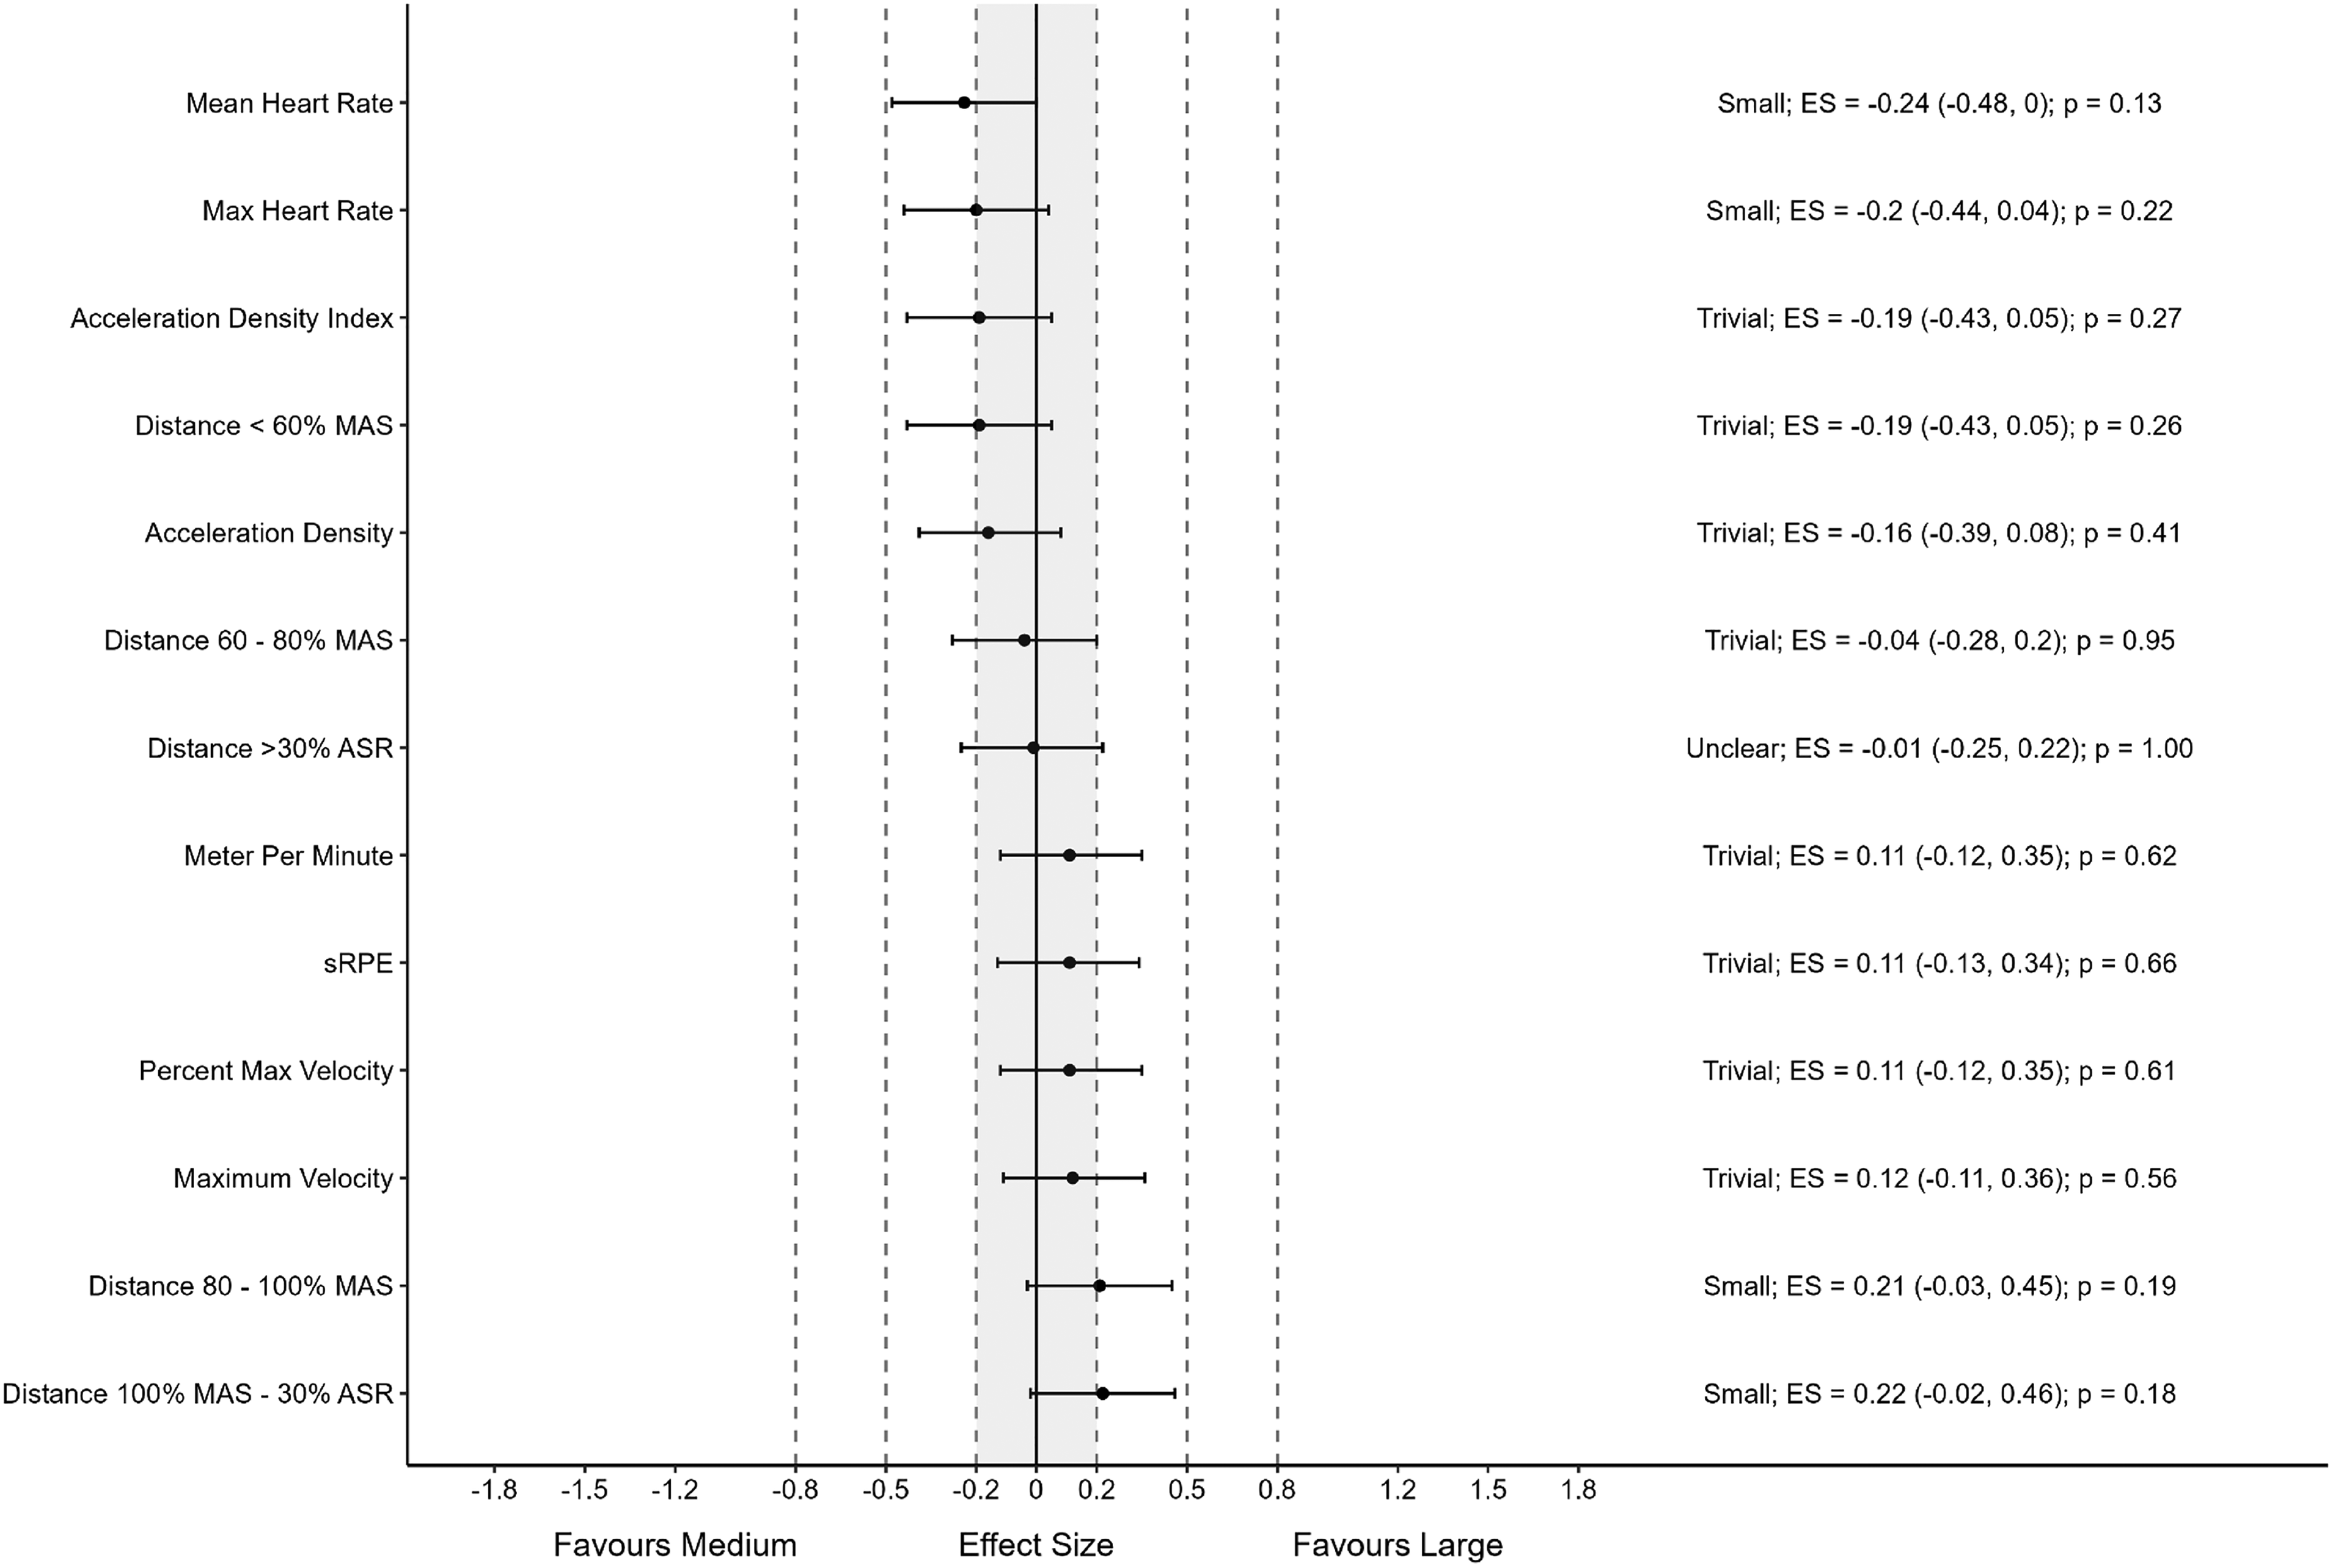
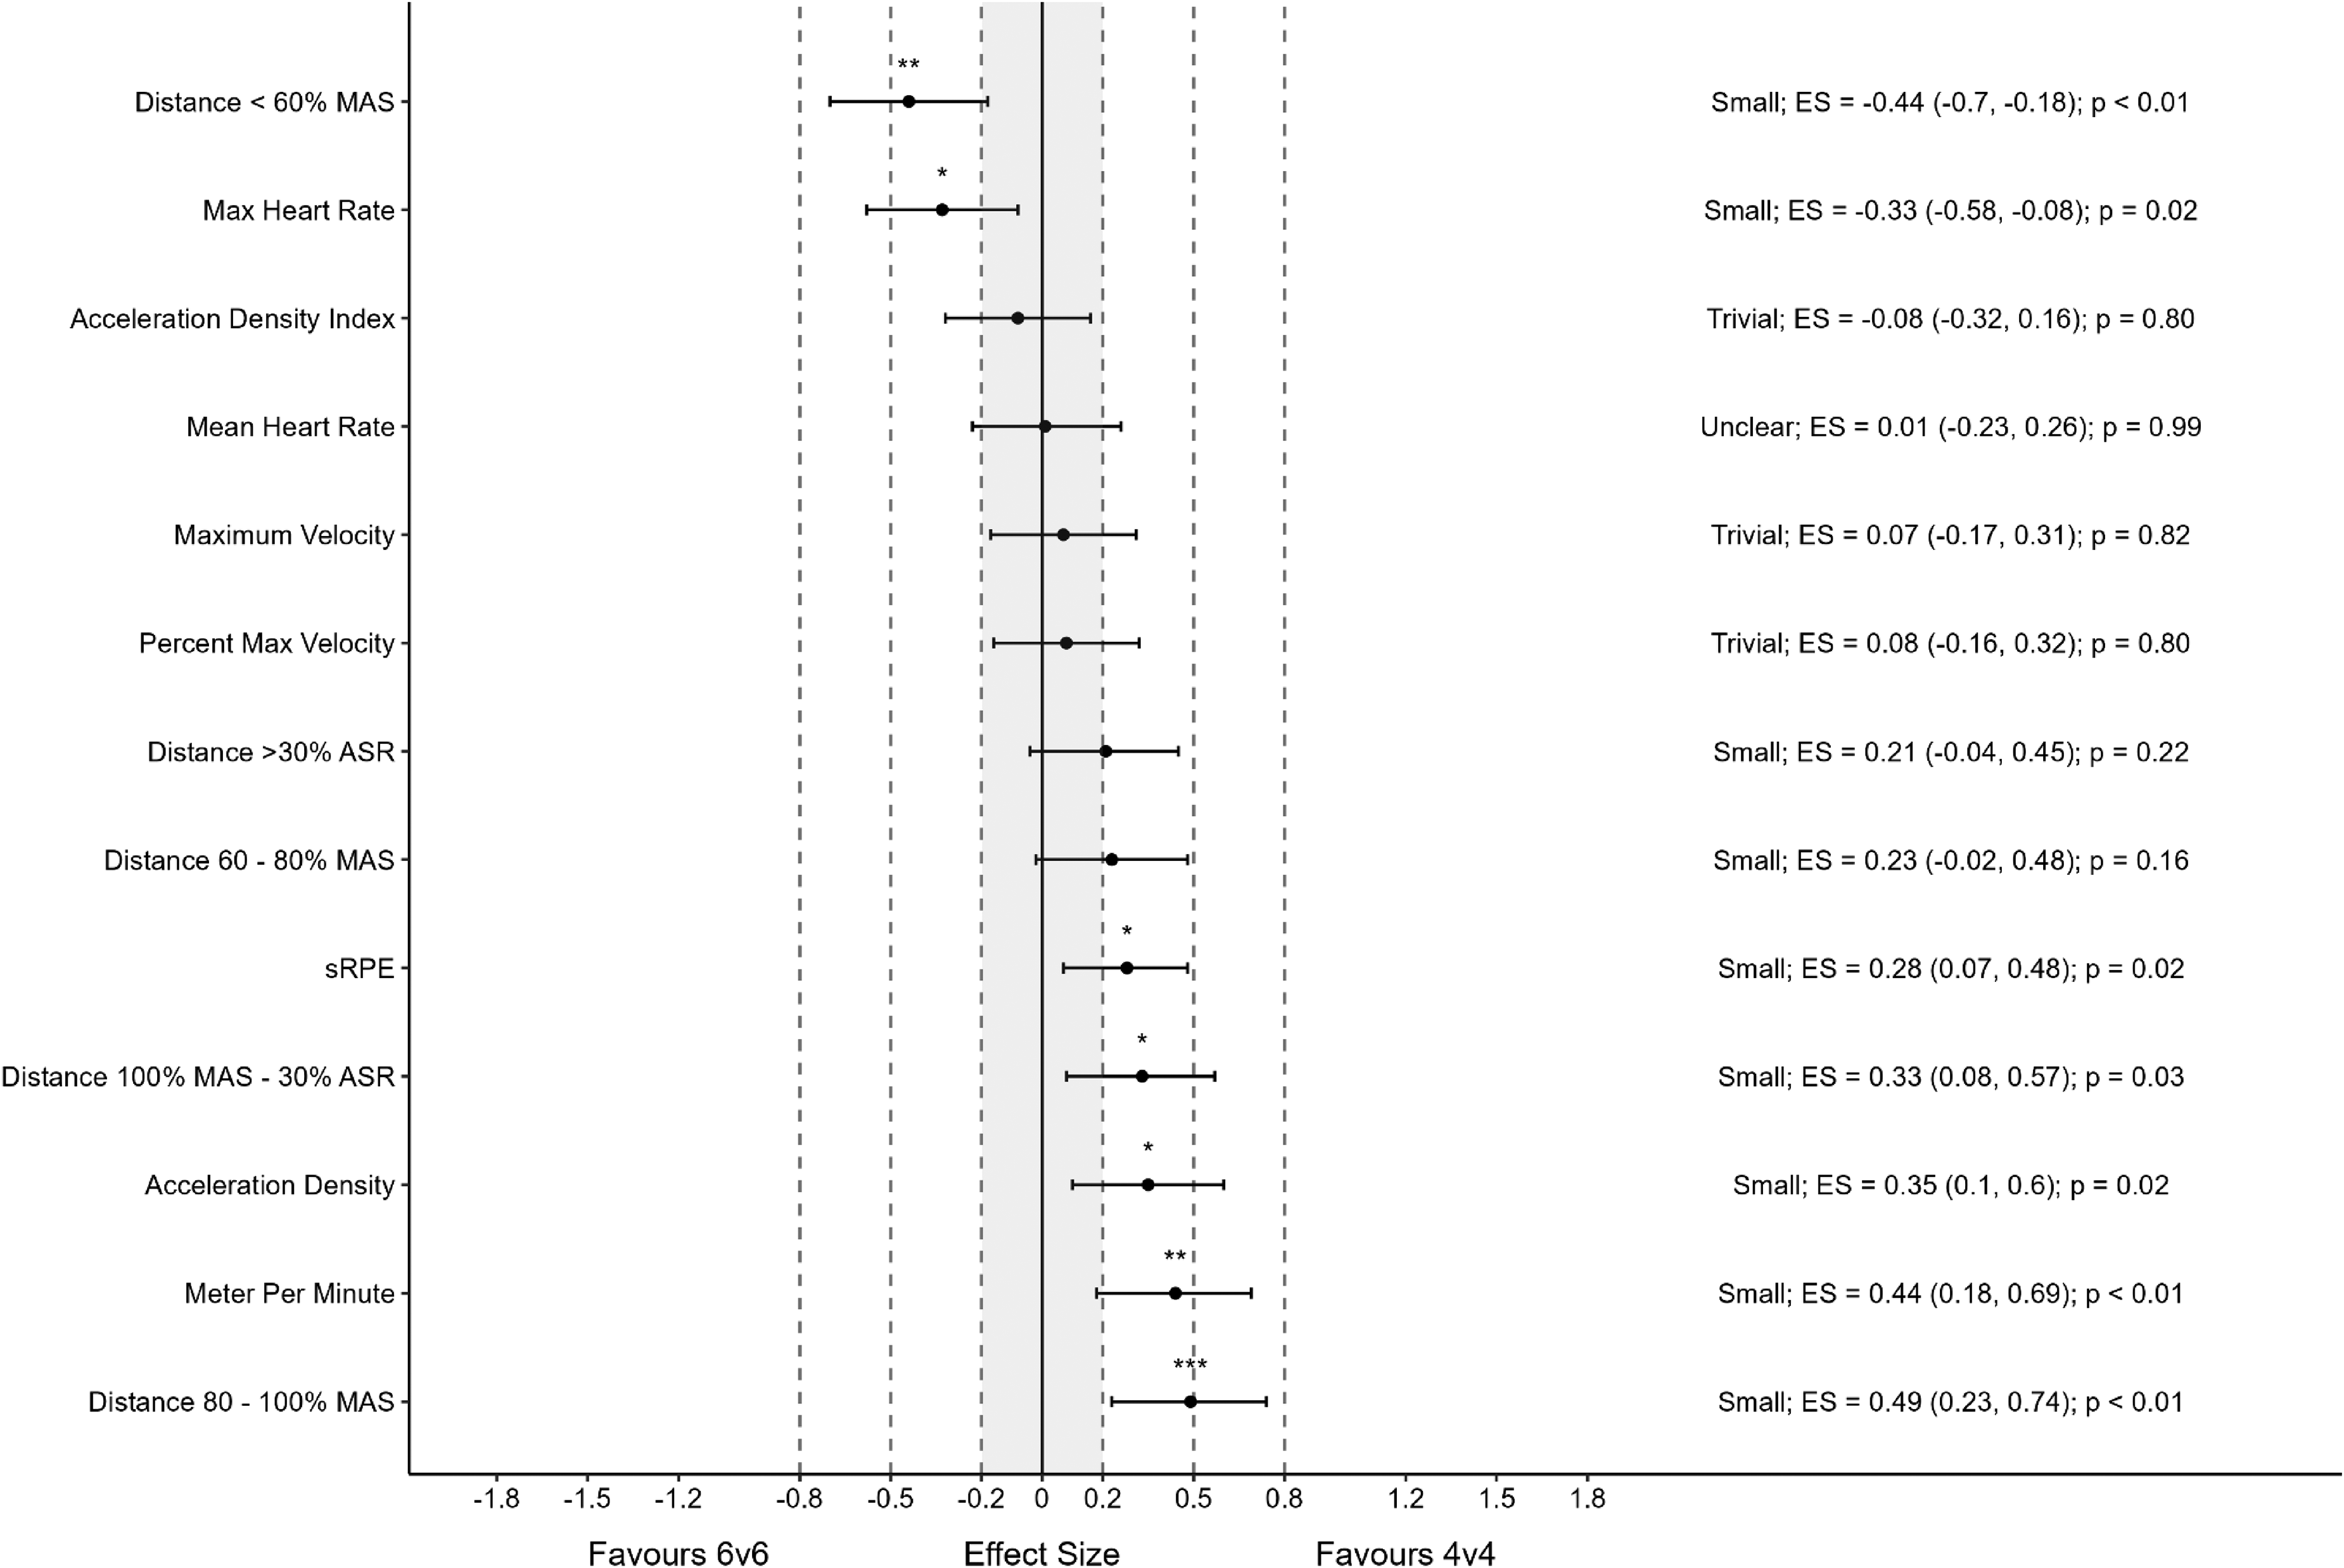
When comparing the small and large pitch conditions, there was a general trend for greater high-velocity movements in the large condition, with five physical variables significantly greater in the large condition, and two greater in the small condition (refer to Figure 2). These results were similar when comparing the medium and small conditions (refer to Figure 3). There was no trend for HR response with changes in pitch size.
Difference in physical demands between small 6 × 6 and large 6 × 6 conditions. Data are Cohens d effect size ± 95% CI. *: p < .05; **p < .01; ***: p < .001. Dashed horizontal lines represent ES threshold for small, medium and large effects. MAS: maximal aerobic speed; ASR: anaerobic speed reserve; sRPE: session rating of perceived exertion.
Difference in physical demands between small 6 × 6 and medium 6 × 6 conditions. Data are Cohens d effect size ± 95% CI. *: p < .05, **: p < .01, ***: p < .001. Dashed horizontal lines represent ES threshold for small, medium and large effects. MAS: maximal aerobic speed; ASR: anaerobic speed reserve; sRPE: session rating of perceived exertion.
For technical demands, there were no differences between the medium and large conditions or the small and large conditions. When comparing the small and medium conditions, there were two variables that were greater in the small condition (refer to Table 5).
Effect of differences in player numbers on subjective task-load and tactical and technical demands.
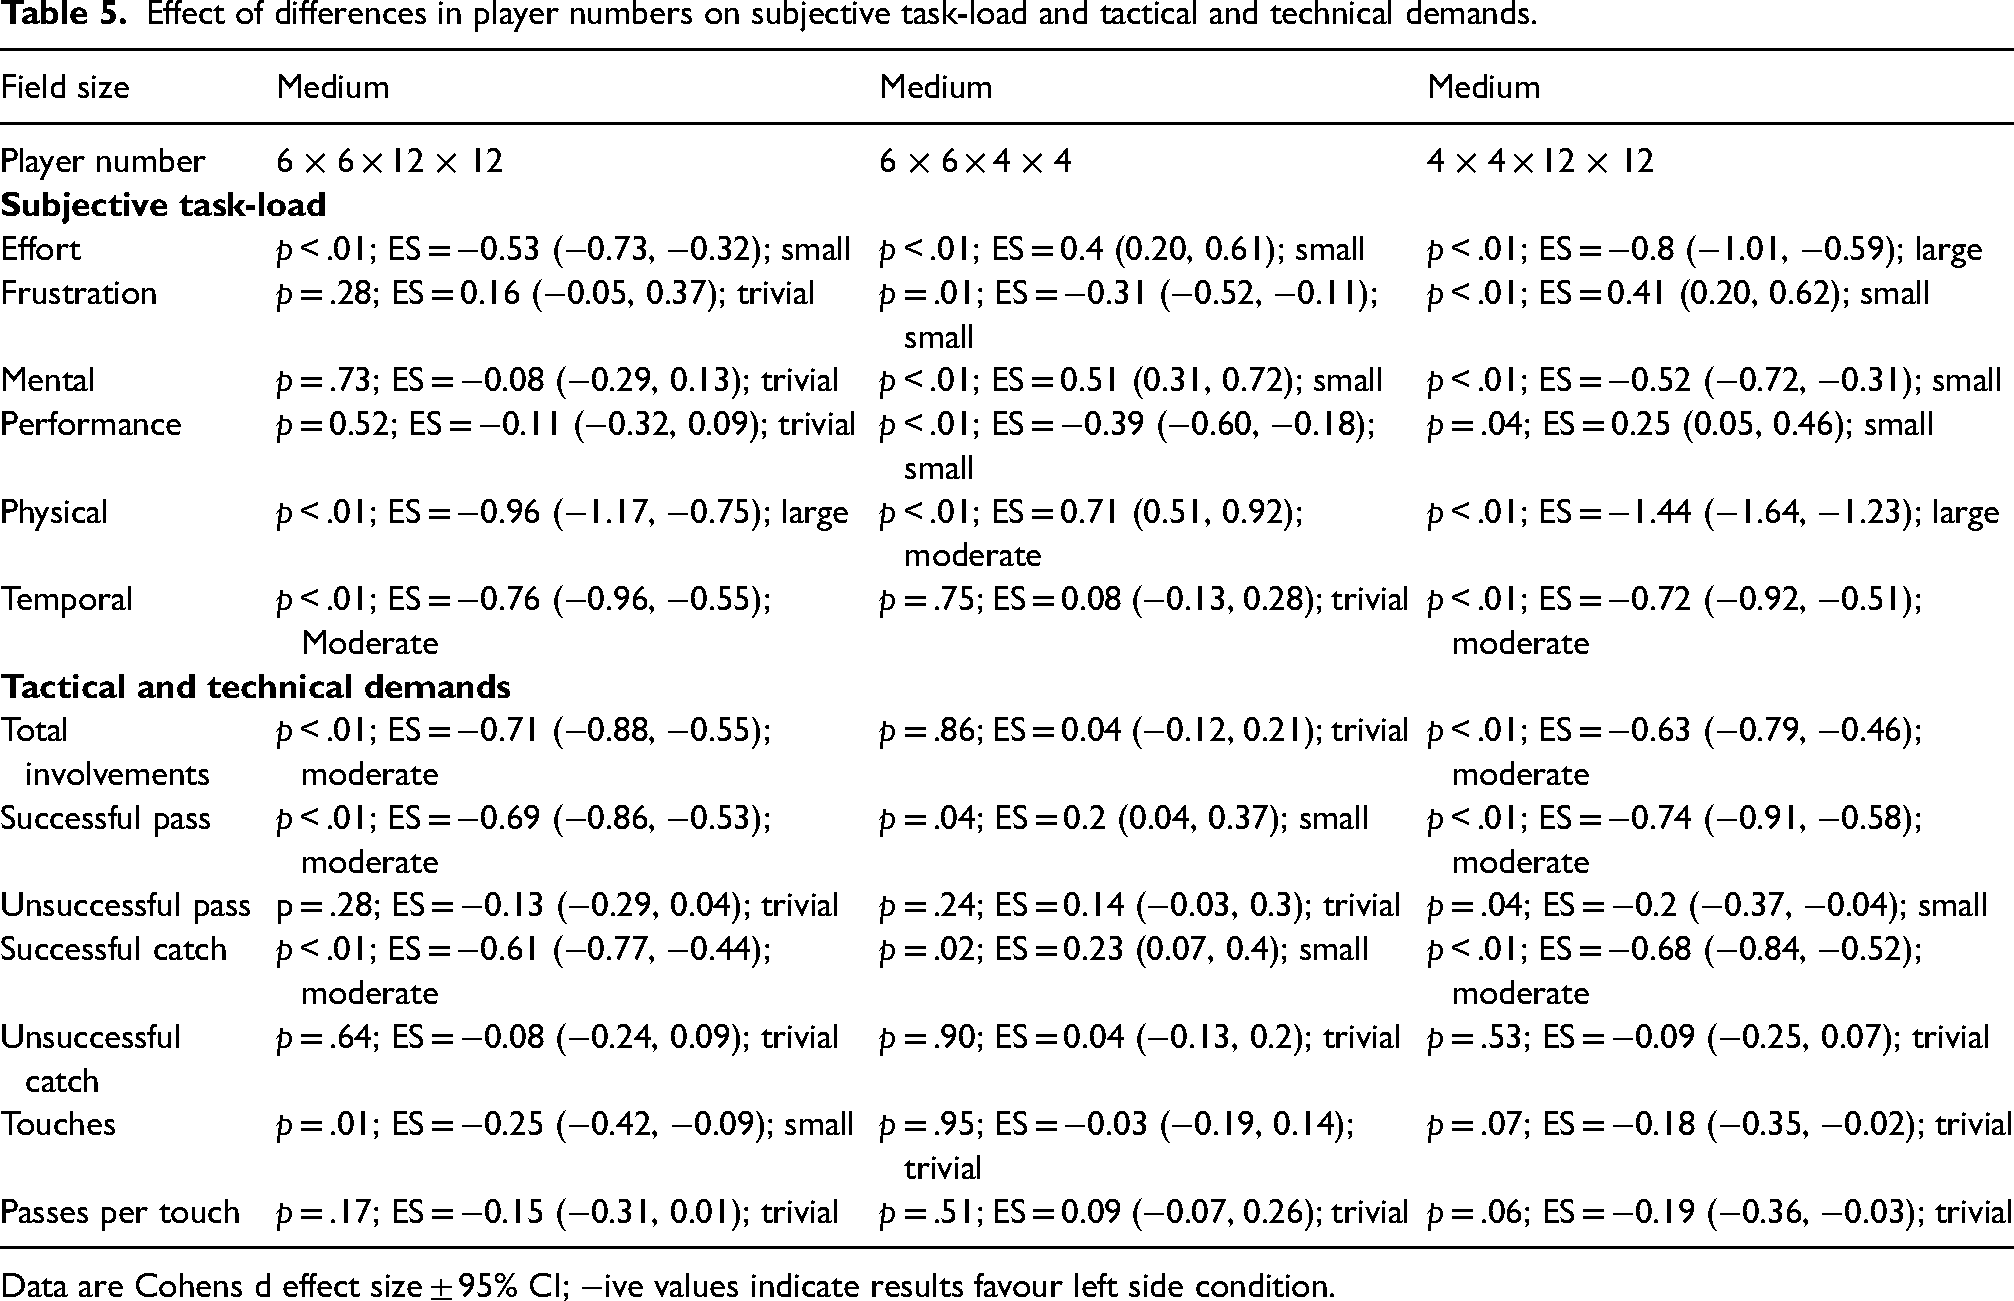
Data are Cohens d effect size ± 95% CI; −ive values indicate results favour left side condition.
For subjective task-load, there was one significant difference in the medium and large condition, favouring the medium condition. There was no difference in the large and small conditions, and one in the medium and small conditions, favouring medium (refer to Table 6).
Effect of differences in pitch size on subjective task-load and tactical and technical demands.
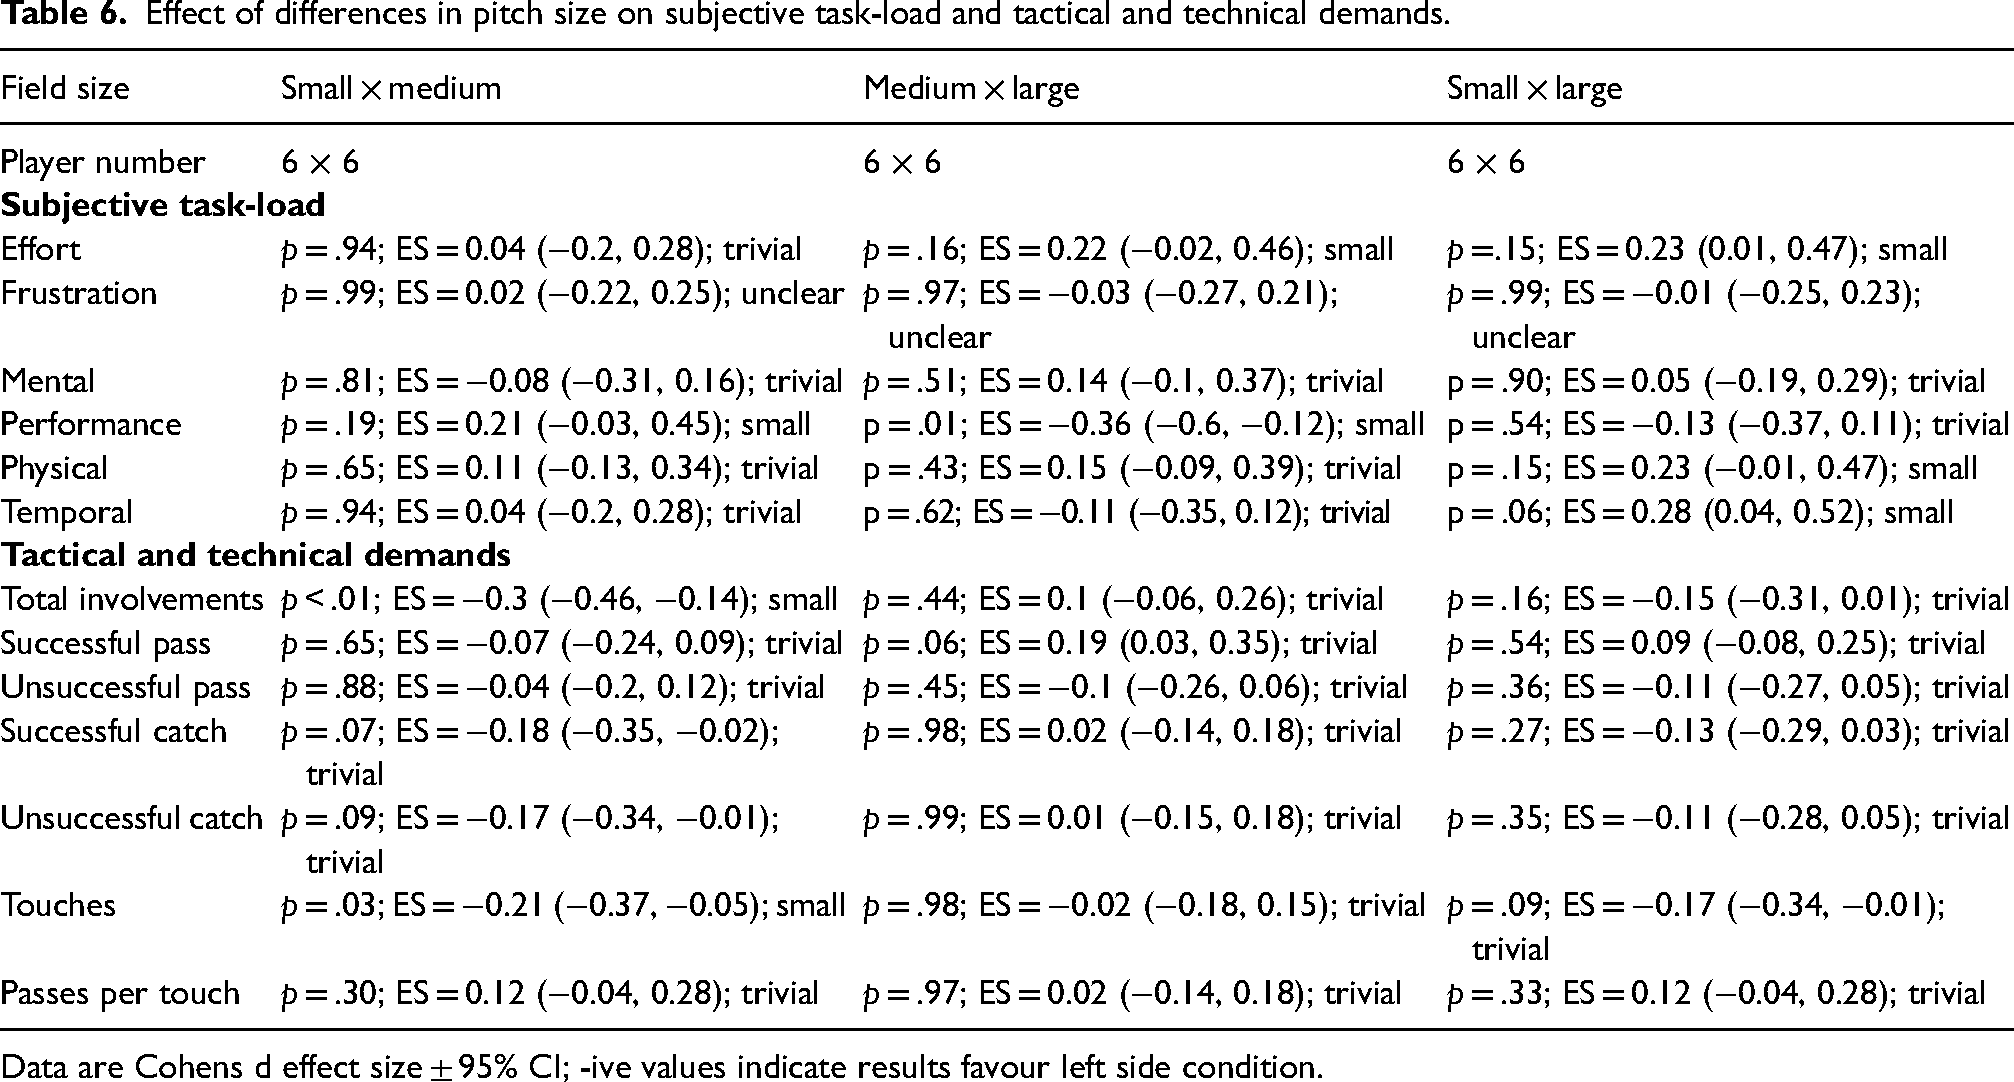
Data are Cohens d effect size ± 95% CI; -ive values indicate results favour left side condition.
Player number
For physical demands, there were significant differences between the 4 × 4 and 6 × 6 conditions, with five variables greater in the 4 × 4 conditions, and two variables significantly greater in the 6 × 6 condition (refer to Figure 4).
Difference in physical demands between medium 6 × 6 and medium 4 × 4 conditions. Data are Cohens d effect size ± 95% CI. *: p < .05, **: p < .01, ***: p < .001. Dashed horizontal lines represent ES threshold for small, medium and large effects. MAS: maximal aerobic speed; ASR: anaerobic speed reserve; sRPE: session rating of perceived exertion.
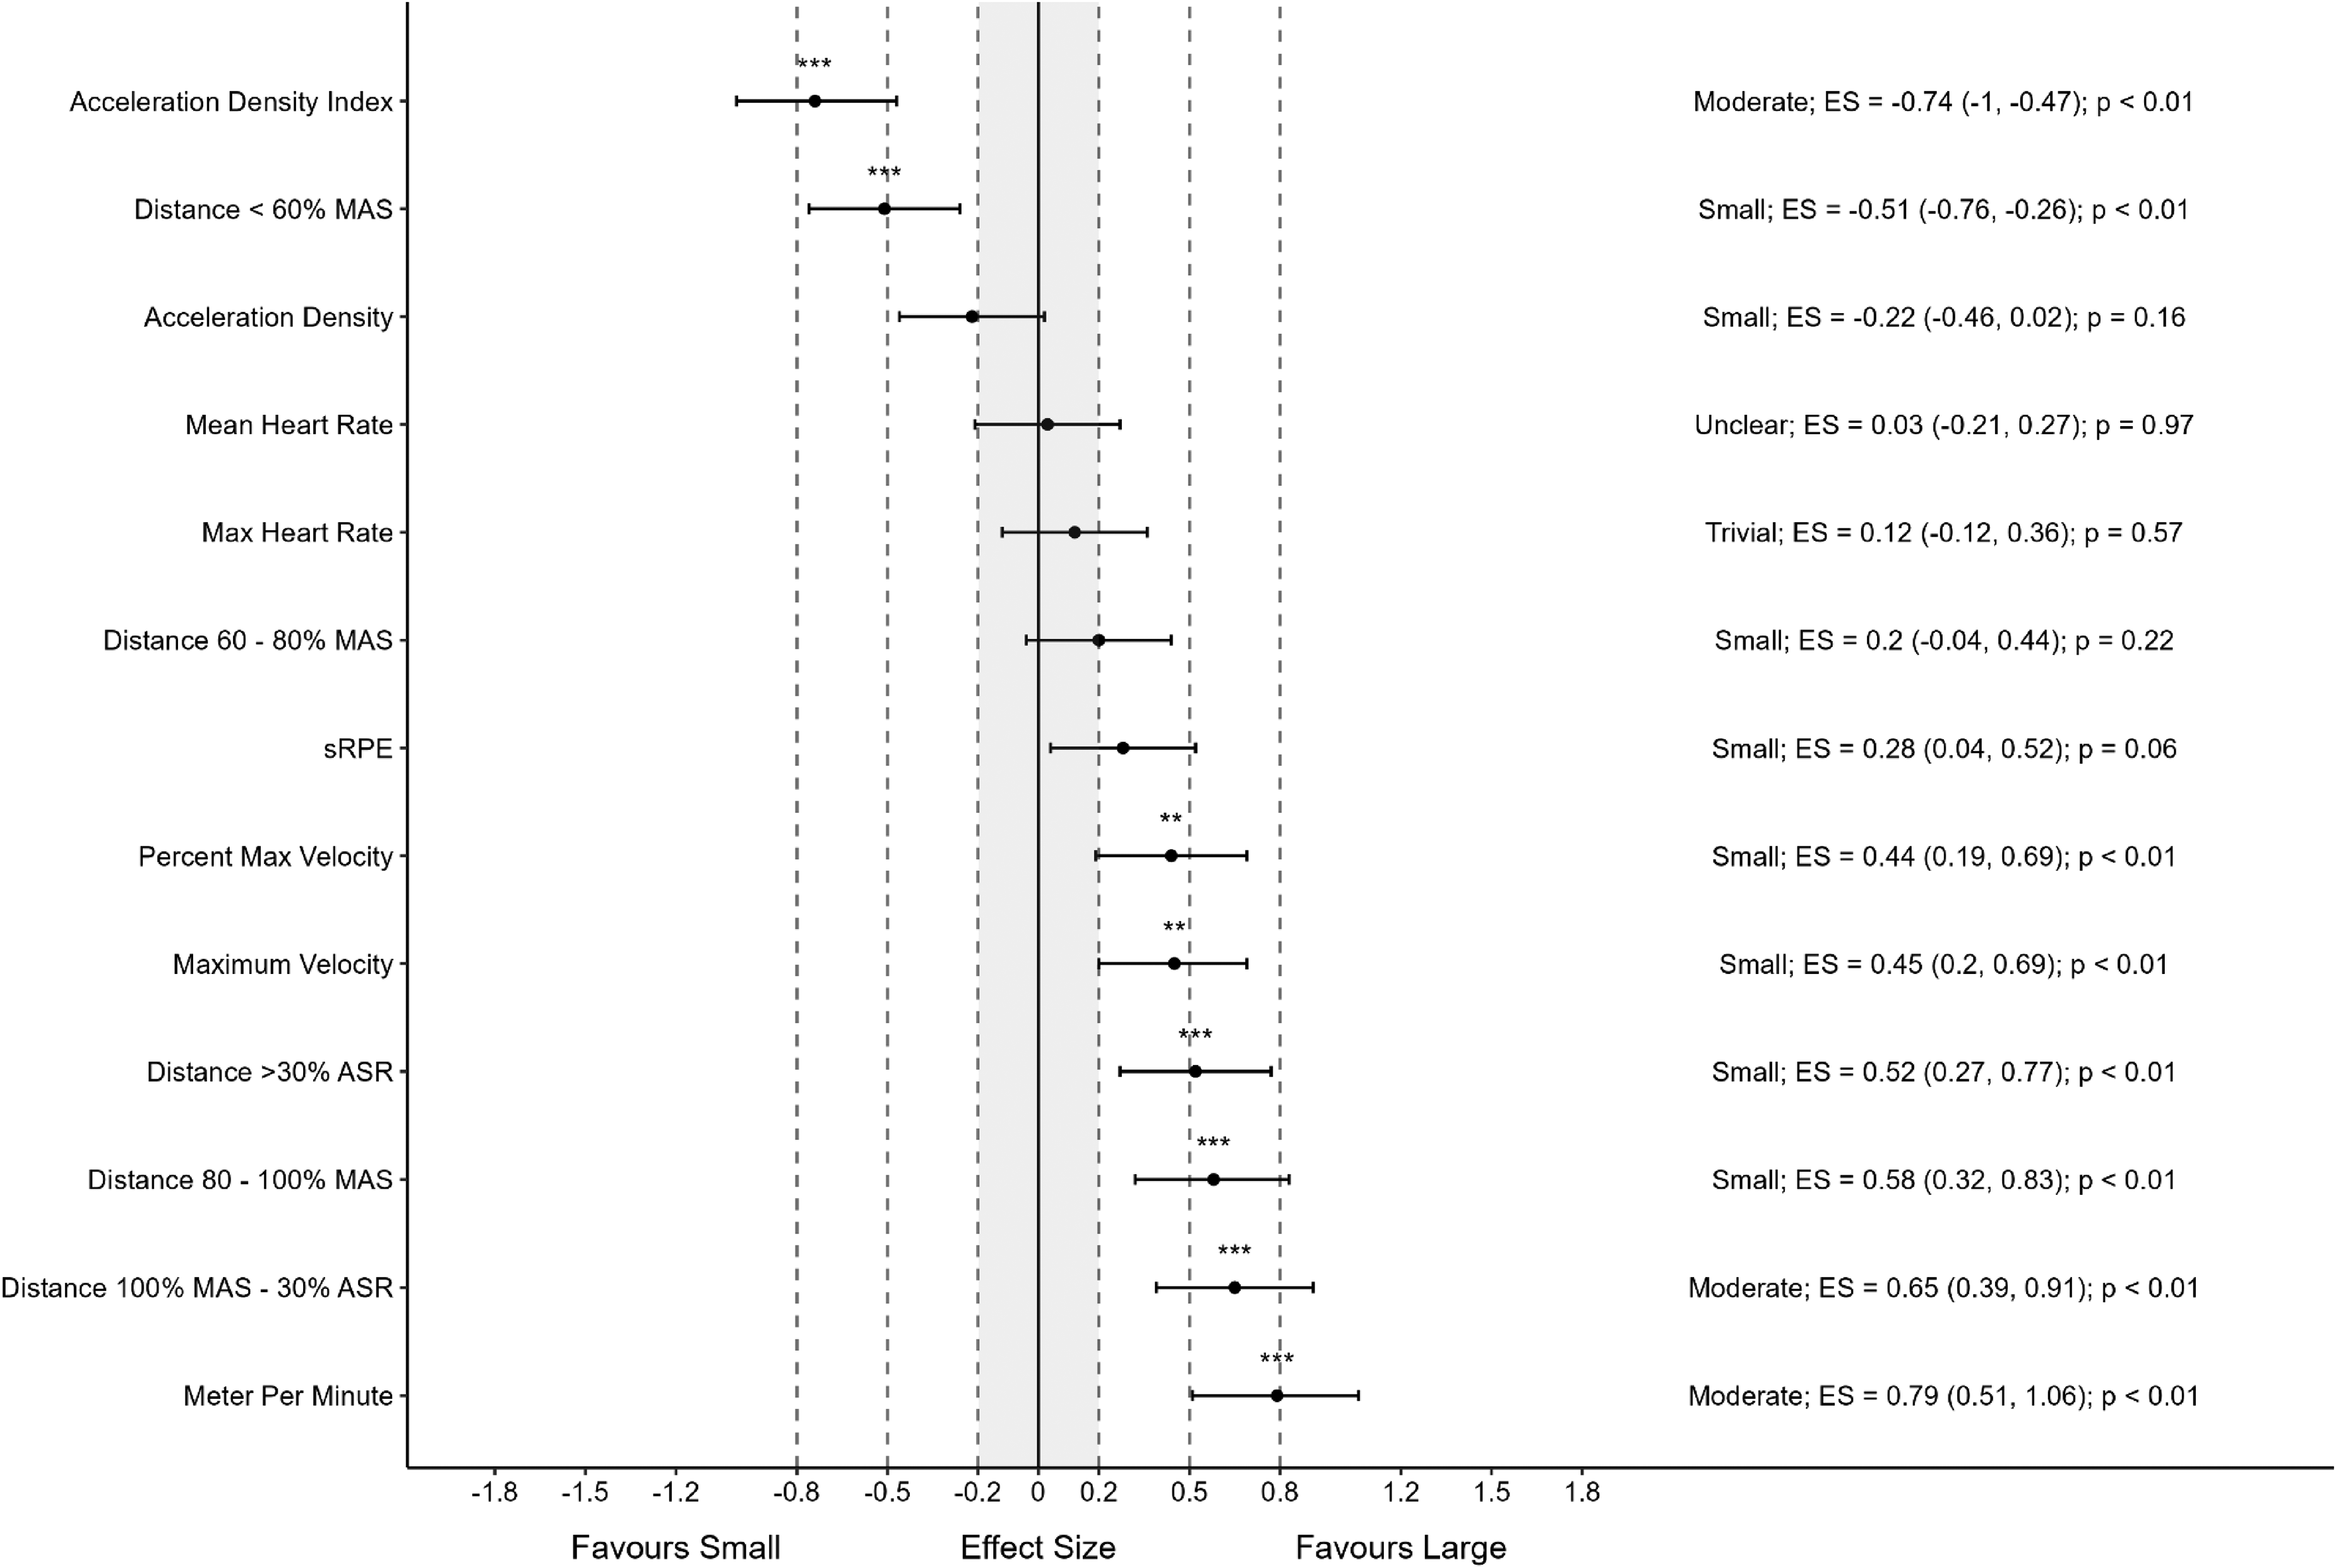
In the 6 × 6 and 12 × 12 conditions, nine variables were significantly greater in the 6 × 6 condition, and one was significantly greater in the 12 × 12 (refer to Figure 5). HR responses were also greater in the 6 × 6 condition.
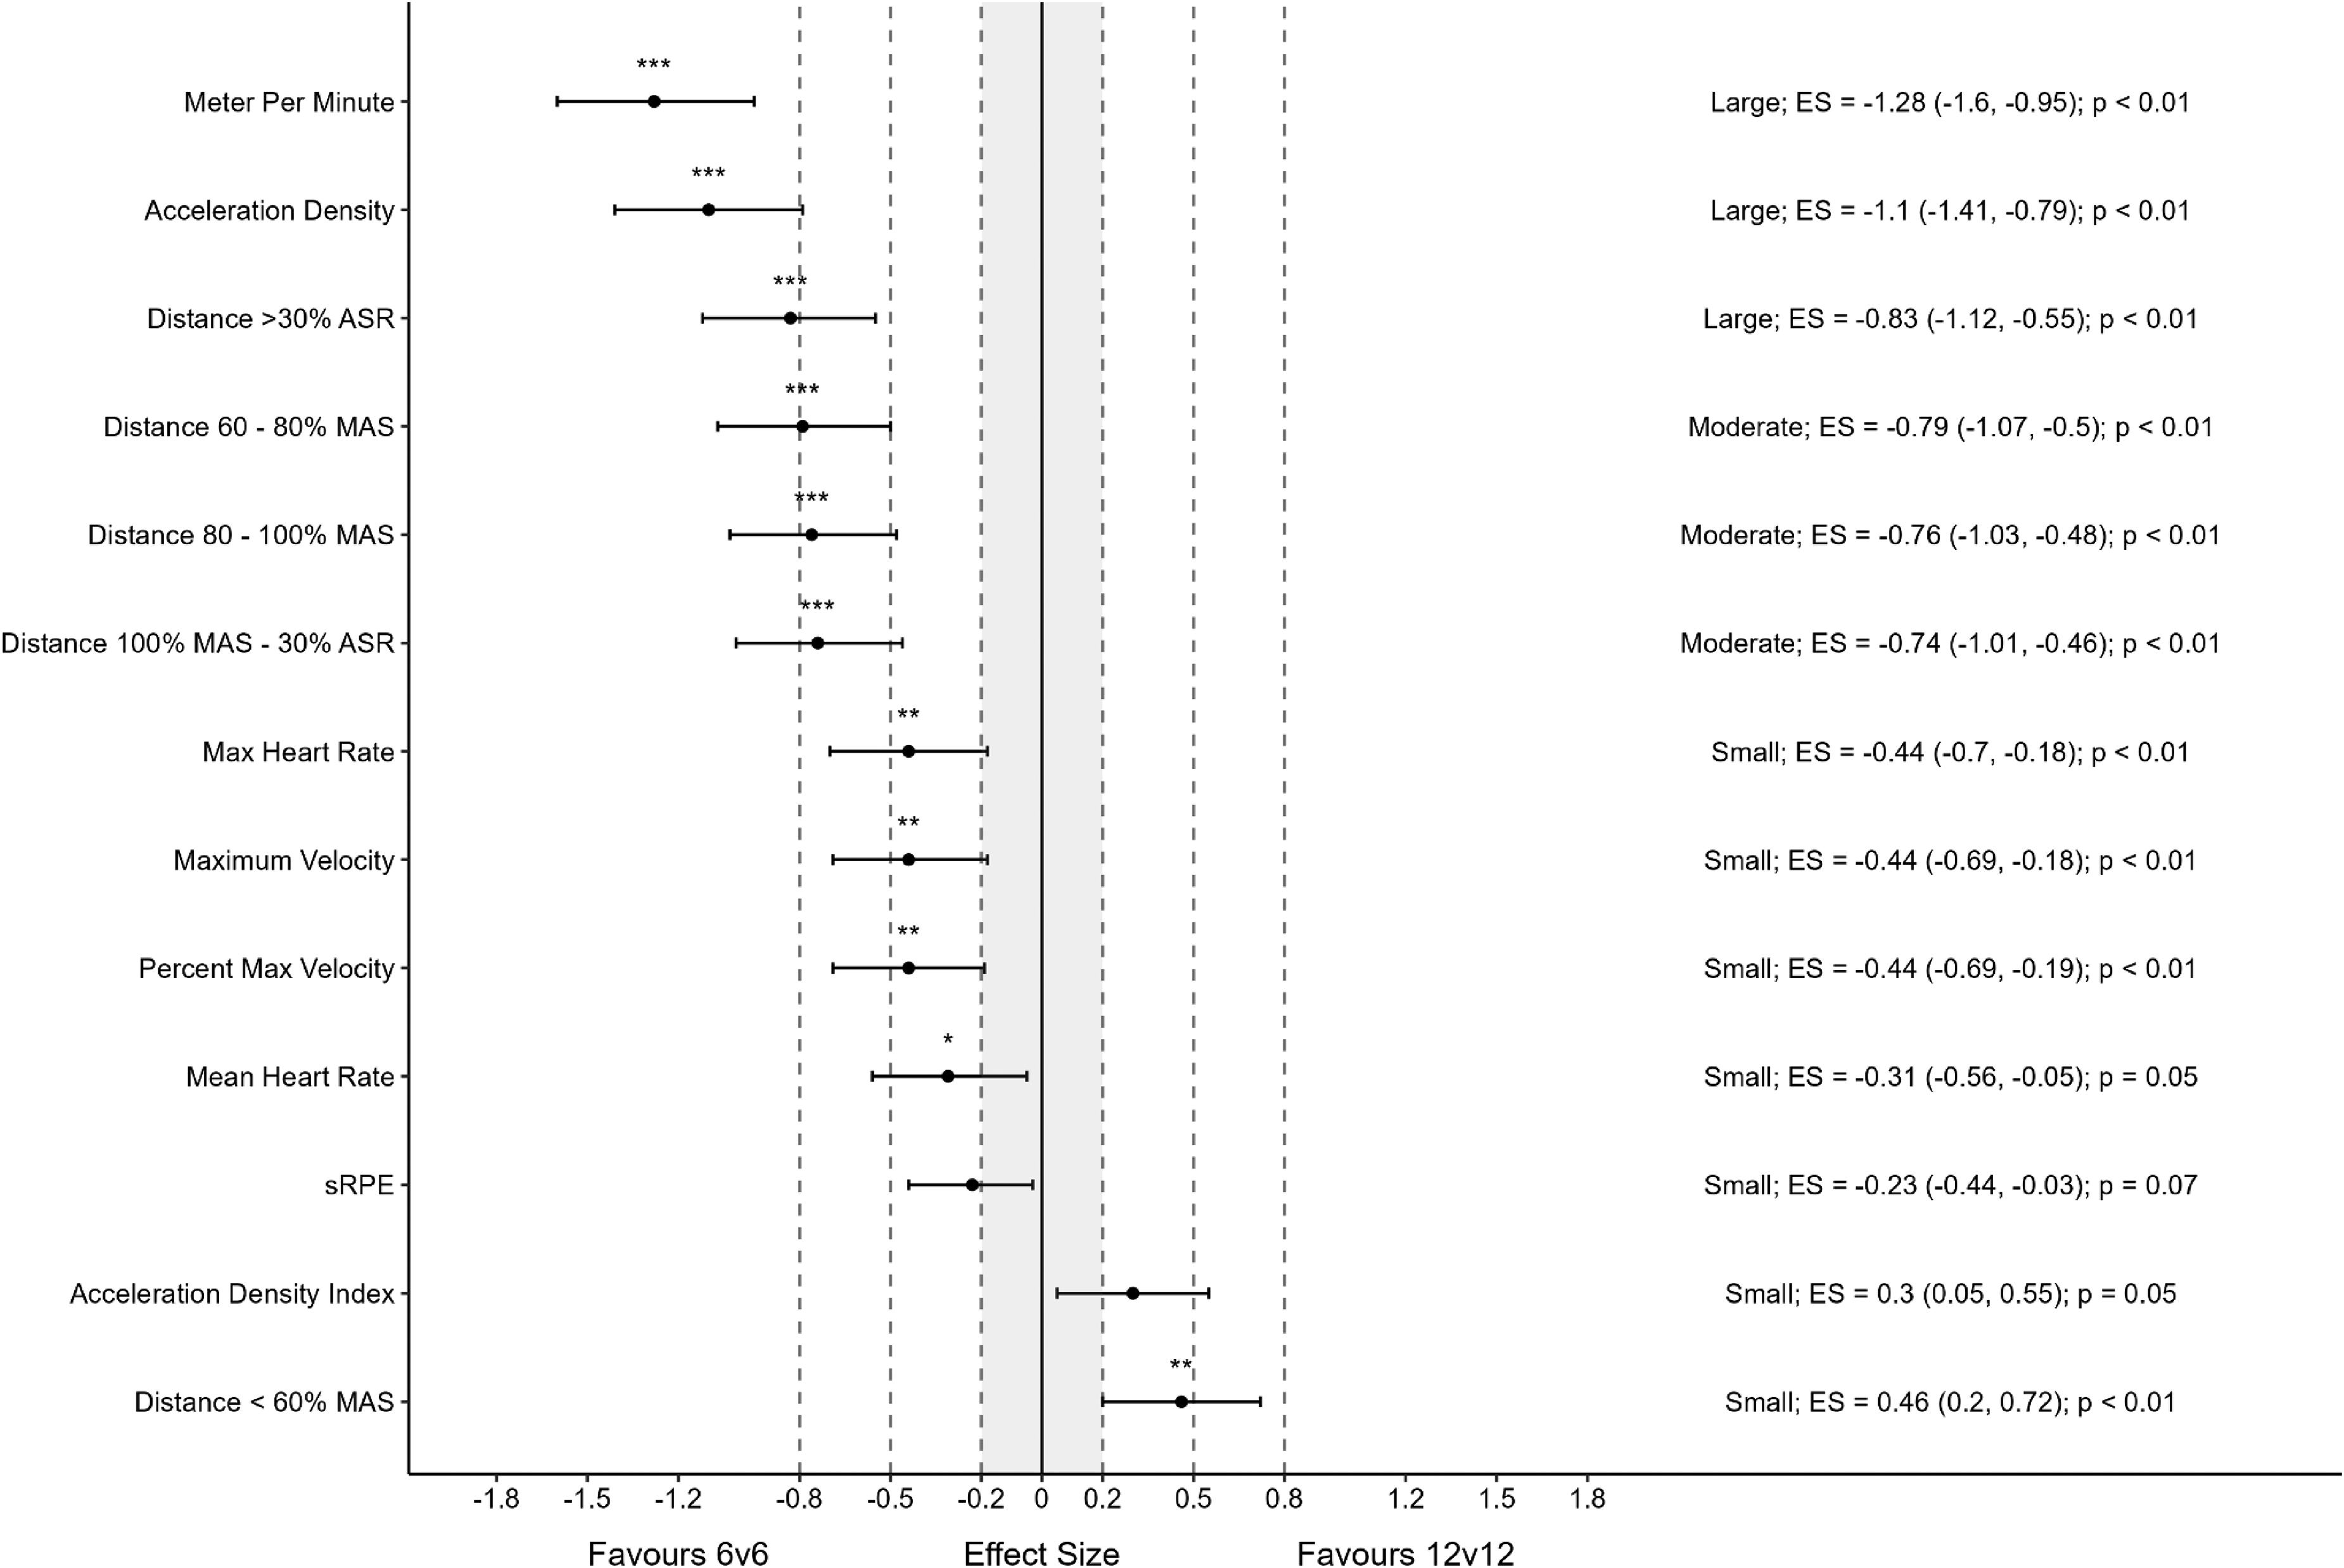
Difference in physical demands between medium 6 × 6 and medium 12 × 12 conditions. Data are Cohens d effect size ± 95% CI. *: p < .05, **: p < .01, ***: p < .001. Dashed horizontal lines represent ES threshold for small, medium and large effects. MAS: maximal aerobic speed; ASR: anaerobic speed reserve, sRPE: session rating of perceived exertion.
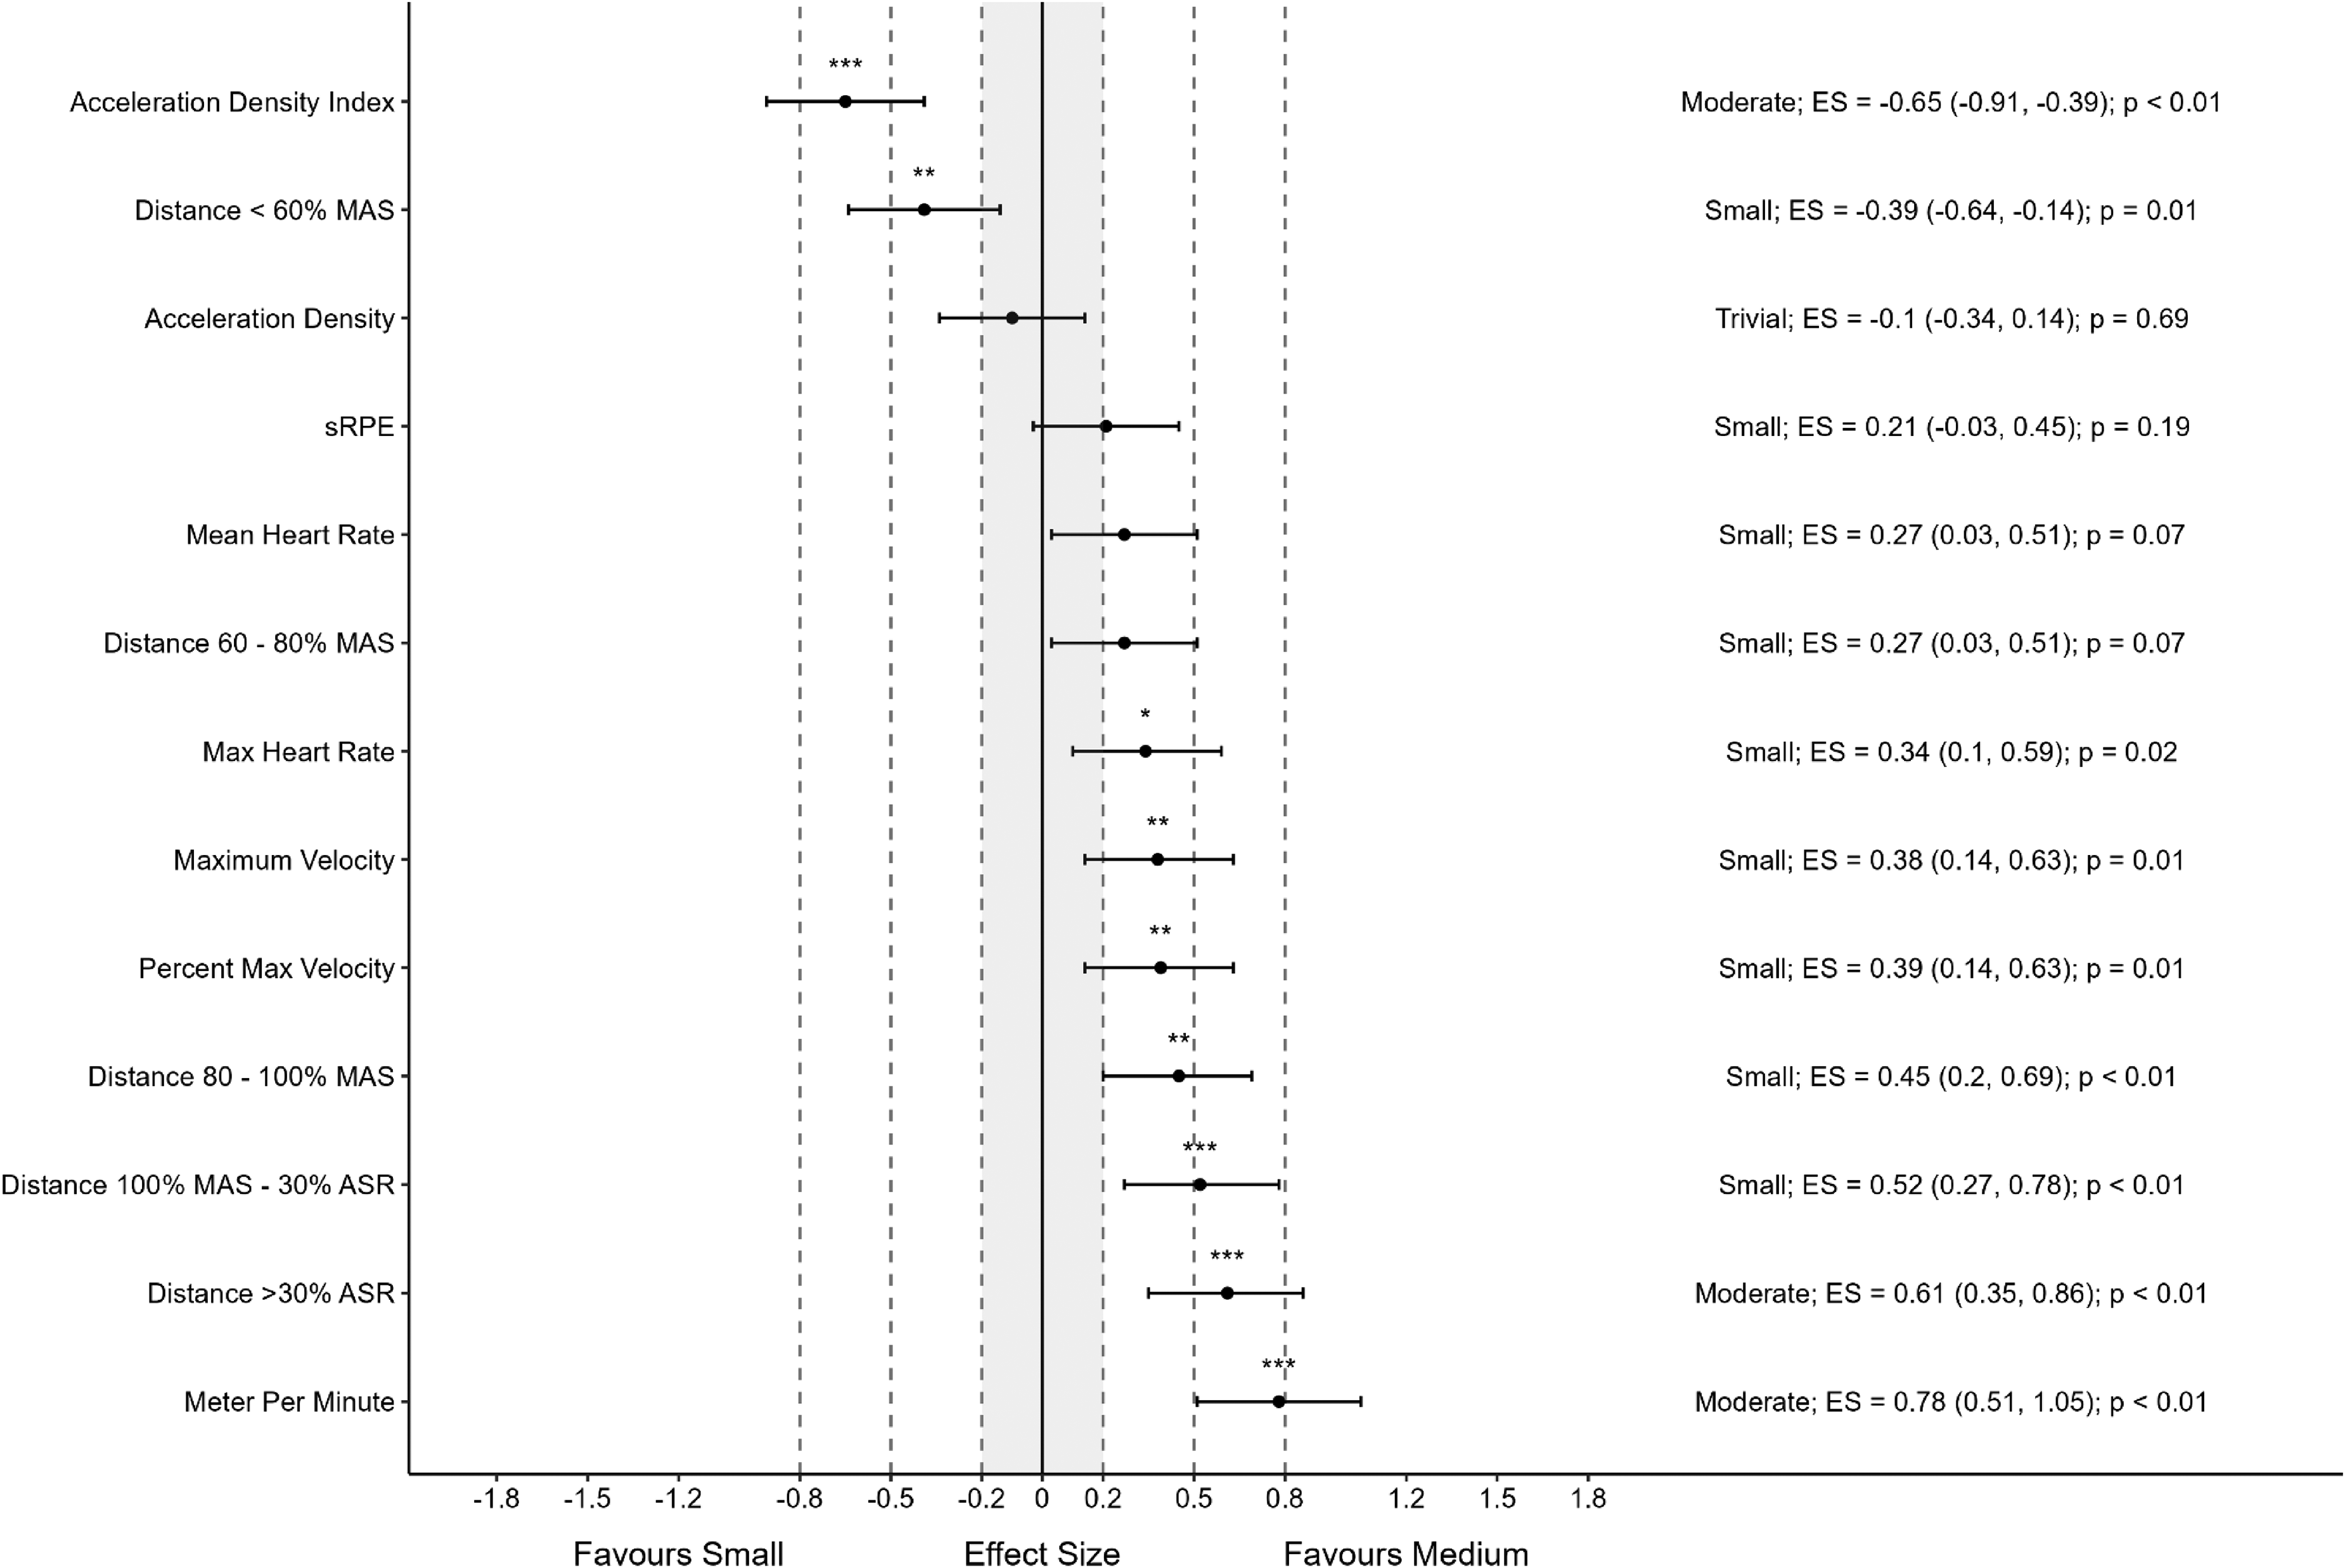
In the 4 × 4 and 12 × 12 conditions, eight variables were significantly greater in the 4 × 4 condition, while two were significantly greater in the 6 × 6 condition (refer to Figure 6).
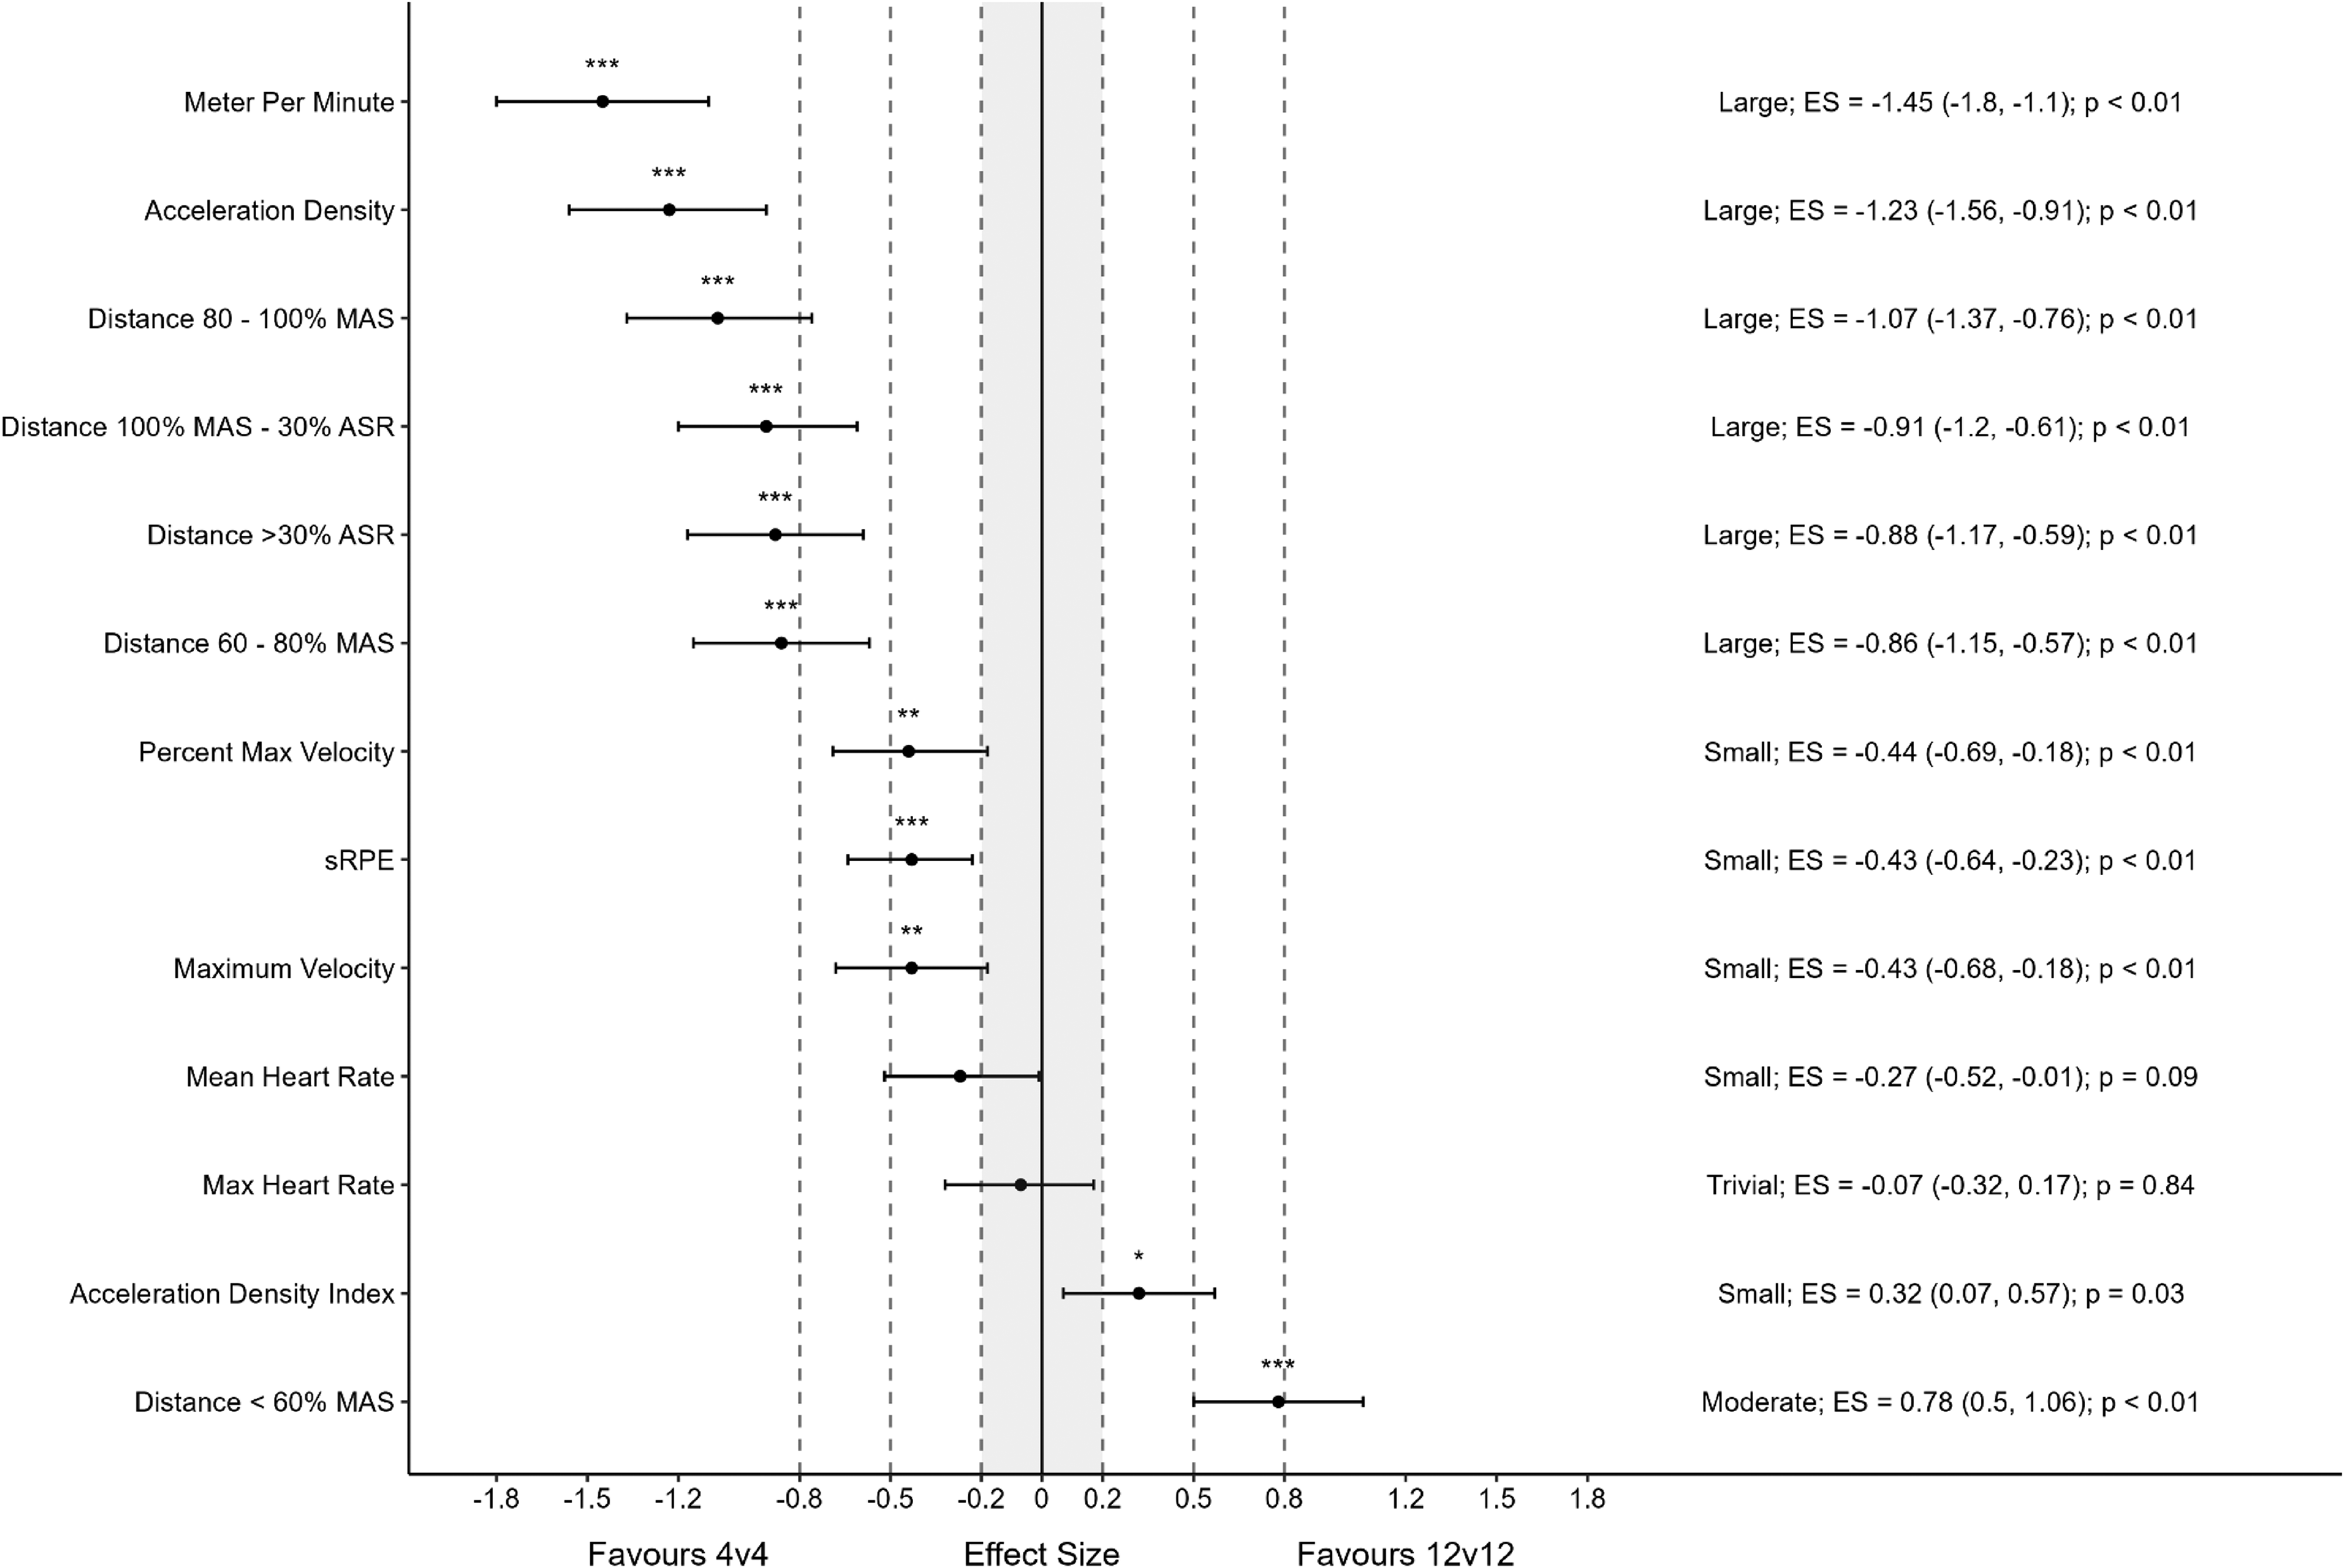
Difference in physical demands between medium 4 × 4 and medium 12 × 12 conditions. Data are Cohens d effect size ± 95% CI. *: p < .05, **: p < .01, ***: p < .001. Dashed horizontal lines represent ES threshold for small, medium and large effects. MAS: maximal aerobic speed; ASR: anaerobic speed reserve; sRPE: session rating of perceived exertion.
For technical variables, in the 4 × 4 and 6 × 6 conditions, two were significantly greater in the 4 × 4. In the 4 × 4 and 12 × 12 conditions, two variables were significantly greater in the 4 × 4 condition. In the 6 × 6 and 12 × 12 conditions, four variables were significantly greater in the 6 × 6 (refer to Table 5).
For subjective task-load, in the 4 × 4 and 6 × 6 conditions, two variables were significantly greater in the 6 × 6 and three were significantly greater in the 4 × 4 condition. In the 4 × 4 and 12 × 12 conditions, four subjective task-load variables were significantly greater in the 4 × 4 condition, and two were significantly greater in the 12 × 12 condition. In the 6 × 6 and 12 × 12 condition, three variables were significantly greater in the 6 × 6 condition (refer to Table 6).
Discussion
This study investigated the variability of physical, technical, and subjective task-load demands in SSG, and the effect of manipulation of pitch size and player numbers in SSG on the physical, technical, and subjective task-load demands in adolescent RU players during an on-side touch game. When the same games were repeated there was high variability in the technical demands (CV > 10%), and in the performance (CV = 12.50%) and frustration (CV = 17.65%) subscales for subjective task-load, as well as for distances travelled at high velocities (≥60% MAS) (CV Range = 16.09% to 51.18%). Heart rate responses (CV < 4.28%), and low speed movements (CV = 5.24%) had much lower variability between the test and re-test conditions. Reducing the number of players increased movement demands such as m/min (ES range = 0.45 to 1.45) and technical exposures such as total involvements (ES range = 0.04 to 0.63). Increasing the size of the pitch increased movements demands but had no effect for technical demands. These results indicate that alteration of player density can influence physical demands, through either pitch size or play number manipulation, however, only player numbers will influence technical exposures. Further, there were trivial to small changes in subjective task-load for manipulating pitch size. Trivial to large changes for player numbers were observed, with large increases seen for physical (ES = 0.8; 95% CI: [0.59 to 1.01]) and performance (ES = 1.44; 95% CI: [1.64 to 1.23]) task-loads, when comparing the 4 × 4 and 12 × 12 conditions. These results show that pitch size and player number manipulation differentially influence the physical, technical, and subjective task-load demands in adolescent RU players.
Player movements increased in games with lower player density, for example, variables such as distance >30% ASR increased by three times across conditions. This study supports previous research that has shown greater external demands when pitch size is increased and player numbers are decreased. 3 While there were clear changes for external demands and sRPE, HR responses showed no obvious pattern to constraint manipulation. The inconsistent HR response may be due to the limitations of HR in assessing intermittent team sports activities, as heart rate can respond slowly to changes in work rate and is influenced by individual constraints such as hydration status.50,51 Although the conditions were performed in standardised conditions, no pre-testing assessments on variables such as hydration were conducted. These results may indicate that HR is not unidirectionally influenced by pitch size or player number, consistent with previous research. 13
The only movement variable that favoured high player numbers, and smaller pitches was low-intensity distance (<60% MAS), which was at a walking pace (≤2.3 m s−1). Findings showed that subjects reached a greater %VMAX in SSG that had lower player density. For example, players in the 4 × 4 and 12 × 12 conditions achieved an average of 86% (range = 75–97%), and 74% (range = 61–97%) of maximum velocity, respectively. This is the first study to quantify how task constraint manipulation influences the %VMAX achieved during SSG in RU. 3 Understanding the %VMAX achieved is important as previous research in elite Australian Rules football has demonstrated that both an excessive and insufficient number of exposures to sprinting velocities greater than 85% of maximum velocity may be a risk factor for injury. 52
Total acceleration demands were influenced by player number manipulation, but not pitch size. Specifically, it was found that decreasing player numbers increased the overall acceleration demands by approximately 19%. Previously research has been shown that reducing the pitch size will emphasise acceleration and deceleration. 53 Despite this, results show there was no effect of pitch size on total acceleration demands. However, this is the first study to report the effect of constraint manipulation in SSG on acceleration density index, a metric that represents the ratio between acceleration load and total distance (i.e. acceleration load per 10 m).3,36 The results show that on a smaller pitch, or with greater number of players, the acceleration density index increases, indicating a greater emphasis on acceleration over distance. These findings can have practical importance when programming SSG for different session objectives to alter the emphasis of training, such as prescribing games with smaller pitch sizes, or with greater player numbers on training days where limiting total distance but maintaining acceleration demands is desired. 53
The use of SSG to facilitate technical development may be beneficial as athletes are exposed to technical demands in an open environment, which is more ecologically valid than closed, repetitive practice and therefore may increase transfer. 54 Technical demands had high variability (CV > 10%), where previous research has reported inconsistent findings, with both high and low variability being reported.20,21 This study found that the technical involvements, such as total involvements and passes, increased as player numbers were reduced, while pitch size had trivial effects. These findings are consistent with previous research in rugby league. 5 Therefore, to increase the exposure to technical actions and potentially improve skill acquisition, coaches may wish to reduce the number of players in their SSG, while still maintaining semblance of the sport to promote skill transfer. 19 However, further research is required to understand the chronic effect of different SSGs on the development of technical skills in adolescent RU players.
Subjective task-load demands can be altered through the manipulation of player numbers during SSG. Lower player numbers caused small to large increases in effort, and moderate increases in temporal demands were observed for both 6 × 6 and 4 × 4 conditions compared to 12 × 12. Previous research has demonstrated that SSG constraints can be deliberately manipulated to target various subjective task-loads, by altering rules of the game without the knowledge of the participants, deliberately making poor officiating decisions, and playing offside rules. 22 Understanding task-load may be useful as high cognitive effort has previously been associated with improved motor learning outcomes in sports. 55 Consequently, practitioners should consider the subjective task-load demands, for example reducing player numbers to increase effort, in conjunction with the physical and technical demands when manipulating SSG, as this may support skill development.
There are some limitations to this study that may influence the applicability of the results. First, isolated measures of technical demands were used, which did not encompass all the technical and/or tactical actions an individual may perform within a game. For example, actions that build defensive pressure, such as line speed, were not recorded. Such defensive actions would likely have a material effect on the actions of the attacking team, as defensive pressure has been found to influence attacking skill execution in female rugby 7s. 56 Therefore, the results in relation to technical demands should not be viewed as a complete account of all technical or tactical actions. Additionally, no information was collected concerning the state of physical or psychological readiness prior to the SSG. Whilst subjects were asked to refrain from physical activity prior to the sessions, the population involved was schoolboy athletes. Consequently school-based activities, such as physical education classes, or examinations, may have influenced readiness prior to the SSG. Finally, no a-priori sample size calculation was performed. The sample size was a convenience sample, based on the logistics of the study. This justification (i.e. resource constraint) is a valid method of determining sample size in applied research. 57 Future research should examine the implications of constraint manipulation, such as how constraints may effect subsequent fatigue, or physiological and/or technical adaptations to assist coaches in understanding how to effectively prescribe SSG.
This is the first study to investigate the effect of manipulating player numbers on a number of novel metrics, such as subjective task load, %VMAX, and acceleration density index in adolescent RU players. Findings show there is high variability in the technical exposures, distance travelled at >60% MAS and the performance and frustration subscales when games were repeated with identical task constraints. Overall, SSG with reduced player numbers have greater physical, technical, and effort and temporal demands. Further, SSG played on larger pitches had generally greater physical and temporal demands. However, there was no effect on technical demands. Additionally, manipulating pitch size did not change acceleration demands. Therefore, as a consequence of the substantial differences in demands placed on the athletes, it is strongly advised when designing SSG that pitch size and player numbers are manipulated to align to the specific aims of the training session.
Footnotes
Practical applications
Increasing the pitch size or reducing the number of players on the pitch will increase movement demands. Increasing movement demands may be desirable at different points throughout the season or playing week. For example, in the preseason the development of physical capacity, such as aerobic fitness, is emphasised. Additionally, higher movement demands may be desirable during the in-season period early in the training week, to allow for adequate recovery prior to the following game. In training sessions closer to game day, it could be recommended that SSG should be played on smaller pitch sizes and with higher player numbers. Increasing player density will reduce the movement demands and subsequent physical fatigue. SSG can be manipulated to increase technical exposures by reducing player numbers. The development of sports-specific skills is a key element of long-term athletic development. Therefore, coaches of adolescent athletes should reduce player numbers, such as utilising 4 × 4 as opposed to 6 × 6 or 12 × 12, in their SSGs to facilitate a greater number of technical exposures. Coaches should be mindful that this study investigated pitch sizes between 750 m2 and 1750 m2, with between eight and 24 players in each game. Extrapolating the results of this study beyond these bounds may reduce the applicability of the findings.
Declaration of conflicting interests
The author(s) declared no potential conflicts of interest with respect to the research, authorship, and/or publication of this article.
Funding
The author(s) received no financial support for the research, authorship, and/or publication of this article.