
Abstract
The baton exchanges are undoubtedly the most critical parts of the 4 × 100 m relay race. Timing of the outgoing runner is critical. In this paper we analyze the race as a minimization problem under uncertainty. We formulate a stochastic model in which the outgoing runner at the baton exchange cannot perfectly assess the incoming runner's exact location relatively a checkmark position, and therefore potentially misjudges the right moment to start running. Also, the team members’ daily shape is subject to uncertainty. To understand the effect of these two random variables—incoming runners’ distance to checkmark and the daily shape of the running team—we conduct a simulation study to investigate the trade-off between the team's expected race time and their probability of being disqualified due to overrunning the takeover zone. Conditioning on a low disqualification probability, the difference in expected race time is shown to be substantial between teams with different variation in distance assessment and forecasting running performance, respectively.
Introduction
One of the most spectacular and exiting event in athletics is the 4 × 100 m relay race. The race captures not only athletes’ acceleration capacities and speed endurance but also their ability to work as teams at the baton exchanges. No matter how fast each member of a team is as an individual sprinter, there is always a risk that the team will achieve a bad relay time or even be disqualified due to false baton exchanges. A number of factors inherent in the 4 × 100 m relay are recognized to affect the team's relay time. Ward-Smith and Radford 1 provide a solid mathematical analysis of the relative importance upon running time of varying some factors affecting the relay time, for example, choice of lane, athletes’ running order, starting positions, positions of baton exchange, distance between the runners at the baton exchanges. Their results show that running in lane eight is by far more advantageous for the team than running in lane one, and that an increased distance between runners at the baton exchanges significantly reduces the overall time. In an extension to this study, Radford and Ward-Smith 2 also examine the positioning of the outgoing runner's checkmark, that is, a mark set by the outgoing runner indicating his departure as soon as the incoming runner reaches this mark. The results obtained in Ward-Smith and Radford 1 are based on a predicted performance profile of an athlete running 100 m, derived in Ward-Smith and Radford, 3 combined with the effect of track curvature upon running time, developed in Greene. 4 In general, Radford and Ward-Smith 2 assume no stochastic elements in their analysis. The predicted optimal positions of the checkmarks rest on the assumption that the outgoing athlete correctly judges when it is time to start accelerating towards the takeover point. Hence, their model is deterministic in the sense that a team does not run the risk of being disqualified when sticking to the predicted positions. Clearly, and admitted by the authors, the use of checkmarks is a hazardous business. A too early departure of the outgoing runner, caused by a misjudgment of the position of the incoming runner, relative to the checkmark, will severely increase the risk of disqualification. Also, a delay of the departure of the outgoing runner likely ensures that the baton exchange takes place inside the takeover zone, but at the cost of a higher total running time. A look at the result lists from the finals of the 4 × 100 m relay—men and women—from the 12 last World Athletics Championships and from the 6 Olympic Games since 2000, confirms the picture of the race being a risky event. In 16 of these 36 finals, two or more teams, out of eight teams, were disqualified or did not finish. 1
In this study, we introduce uncertainty when modeling the optimal positions in the 4 × 100 m relay. Our primary objective is to investigate the trade-off between the relay team's goal to minimize its total running time and its desire to reduce the risk of failure, due to the outgoing runner's difficulty to correctly judge the right moment to start running. In addition, we also think of the athletes’ daily form being stochastic, that is, the athletic performance of the team's members in the race cannot be perfectly predicted by the team's coach. Our numerical analysis is based on the performance profile of an athlete running 100 m, derived in Ward-Smith and Radford. 3 We fit their data into a third-degree polynomial using ordinary least squares (OLS) to obtain a continuous differentiable function reflecting the relation between running time and distance. Given that we limit our estimation of the polynomial on separate segments of a 100 m race, we manage to predict the times presented in Ward-Smith and Radford 3 at a level of a hundredth of a second. To understand the effect of the two stochastic components—incoming runners’ distance to checkmark and the daily shape of the running team—we conduct a simulation study to investigate the trade-off between the team's expected race time and its probability of being disqualified due to overrunning the takeover zone. As a biproduct of our work, we analytically expose the constrained optimization problem inherent in 4 × 100 m relay, that is, minimizing total running time subject to the constraints on where on the lane the three exchanges of the baton should take place. We derive the necessary first-order conditions behind the determination of the optimal locations of runners’ starting and finishing positions. However, to facilitate our analysis, we model the 4 × 100 m relay as a race on a straight track, that is, we exclude the effects of track curvature on running performance.
The paper is structured as follows. Section “Literature” contains a review of previous research on 4 × 100 m relay and some papers on relay races in other sports. We also briefly review related work on risk-taking in tournaments and on stochastic modeling of sports events. In section “A deterministic model for the 4 × 100 m relay,” we present the deterministic model for 4 × 100 m and derive the optimal start and exchange positions. In section “A stochastic model for the 4 × 100 m relay,” we introduce stochasticity in the model and present the outcome from the simulations of the model. Section “Summary and conclusions” discusses the implications of our results and concludes.
Literature
Much of the relatively limited literature on efficient baton exchange in the 4 × 100 m relay is for natural reasons focused on the analysis of the optimal location of starting positions, exchange positions, positions of checkmarks at each of the three exchanges and the optimal leg assignment to athletes. Ward-Smith and Radford 1 and Radford and Ward-Smith 2 mathematically calculate the optimal locations of positions, given the predicted performance profile of an athlete running 100 m derived in Ward-Smith and Radford. 3 Masedu and Angelozzi 5 present a tractable mathematical method to select the optimal combination of four athletes from a larger sample of athletes, given the information of each athlete's performance in each leg. A couple of experimental studies, using video recordings, have been carried out to analyze athletes’ speed and performances in different zones of the 4 × 100 m relay. The outcome from the experiment presented in Boyadian and Bootsma 6 indicates that the outgoing runner adapts his moment of departure to his perception of the speed of the incoming runner, rather than conditioning his departure on a fixed checkmark. Zhang and Chu 7 find in their experiments that the distance between the outgoing runners’ selected checkmark positions and their start lines are shorter than optimally. Salo 8 shows that athletes perform better if the baton exchange takes place farther in the takeover zone. However, in line with the results obtained in Boyadian and Bootsma, 6 the experiments also suggest that the outgoing runner adjusts his acceleration to his perception of the incoming runner's speed. The relation between running time and location of the baton exchange in the takeover zone is also analyzed in Zarębska et al. 9 They record the performance of 27 sprinters in the Polish national team, in total 230 exchanges. Their experiment shows that the farther the baton is exchanged in the takeover zone, the shorter the time the baton spends in the takeover zone, which means a shorter total running time.
The exchange and the optimal composition of athletes in relay races in other sports competitions have also been subjected to analyses. Hext et al. 10 examine the effect of the relay exchange in elite short track speed skating. A salient feature in these competitions is that the four members of a team are allowed to exchange skaters at any time of the race, except during the final two laps. Typically, the exchange takes place every 1½ laps over a distance of 5000 m, in total 29 exchanges. The authors’ analysis of data from three World Cup events during the 2012–2013 seasons indicates that varying the frequency of the exchanges during the race, instead of holding on to the typical norm (1½ laps), could improve performance. Using data for each individual swimmer in international long course competitions in 4 × 200 m freestyle swimming relay races 2010–2018, Wu et al. 11 develop a predictive model to analyze the relationship between the assignment of legs to swimmers and the team's finishing position. Scharfenkamp et al. 12 investigate the impact of age diversity on team performance in biathlon relay races. Their empirical analysis of data, containing results of international biathlon relays for the seasons 2009/2010 to 2016/2017, indicates that increasing age diversity significantly improves team performance.
Our work is related to the row of studies on risk-taking in tournaments (see13–15 for reviews of previous research). Gürtler et al. 13 consider a rank-order tournament model in which agents, who are heterogeneous with respect to their actual position in the tournament, compete for a single price. An agent decides about her speed with which a task is performed. Higher speed means increased performance but at the same time more mistakes are expected, which reduces performance. Their model predicts that trailing agents work faster than they would do in the absence of tournament incentives, that is, taking more risks, especially when competition becomes higher. The authors find support for the prediction in their subsequent analysis of data from professional biathlon. Similar results—trailing teams or underdogs choose riskier strategies—are found in empirical analyses of various sports: soccer, 16 basketball, 17 downhill skiing, 18 golf, 19 and handball. 14
Our methodological approach is also related to the bulk of literature applying stochastic mathematical models to simulate and predict expected outcomes and to assess fairness and excitement under different rules, sequencing of games and choices of strategies in sports events. The properties of alternative procedures to the standard procedure applied in soccer penalty shootouts today, which is viewed as unfair because of a possible advantage for the first shooting team, have been investigated in a number of studies (e.g. see references20–27). 2 The impact of alternative home-away sequencing of play-off games in professional sports leagues on the probability of either team winning the best-of-games series, has been studied in a handful of papers (e.g. see references31–33). Brams et al. 34 analyze the effect on the probability of winning and on the expected length of the game under four different serving order rules in serving sports. Beaudoin and Swartz 35 develop a stochastic model to simulate hockey games under specified strategies with respect to pulling the goaltender. Based on the results from 13 Formula One seasons 2007–2019, Csató 36 simulates, for various scoring systems, the trade-off between the number of uninteresting races (early clinches) and the probability of the champion having not won any race.
A deterministic model for the 4 × 100 m relay
Theoretical outline
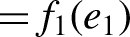
For a 4 × 100 m relay race, we define the running time in seconds for the athlete on the ith leg as a function of a covered distance of d meters,
We define
We formulate the optimization problem as


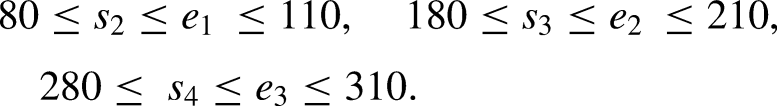
Suppose there is a point
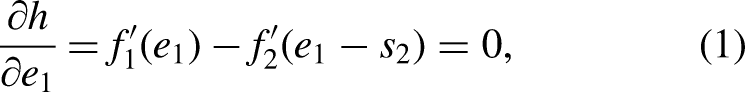
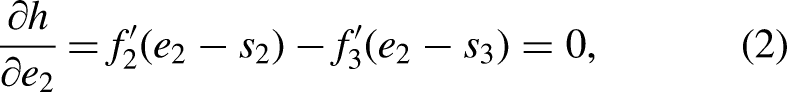
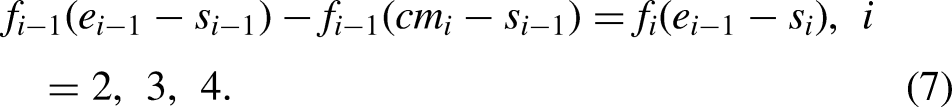
The solution to the equation system yields a minimum since the exchanges take place where the incoming runner is in the deceleration phase, thus f is convex, while the outgoing runner is in the acceleration phase, where f is concave. 3
Besides the variables

Empirical implementation
Our point of departure when empirically determining the optimal start and exchange positions, is the elite male sprint running profile presented in Ward-Smith and Radford, 1 where each of the four runners in the team is supposed to have this profile. Their data is reproduced in columns 2–4 in Table 1.
Representative running profile.
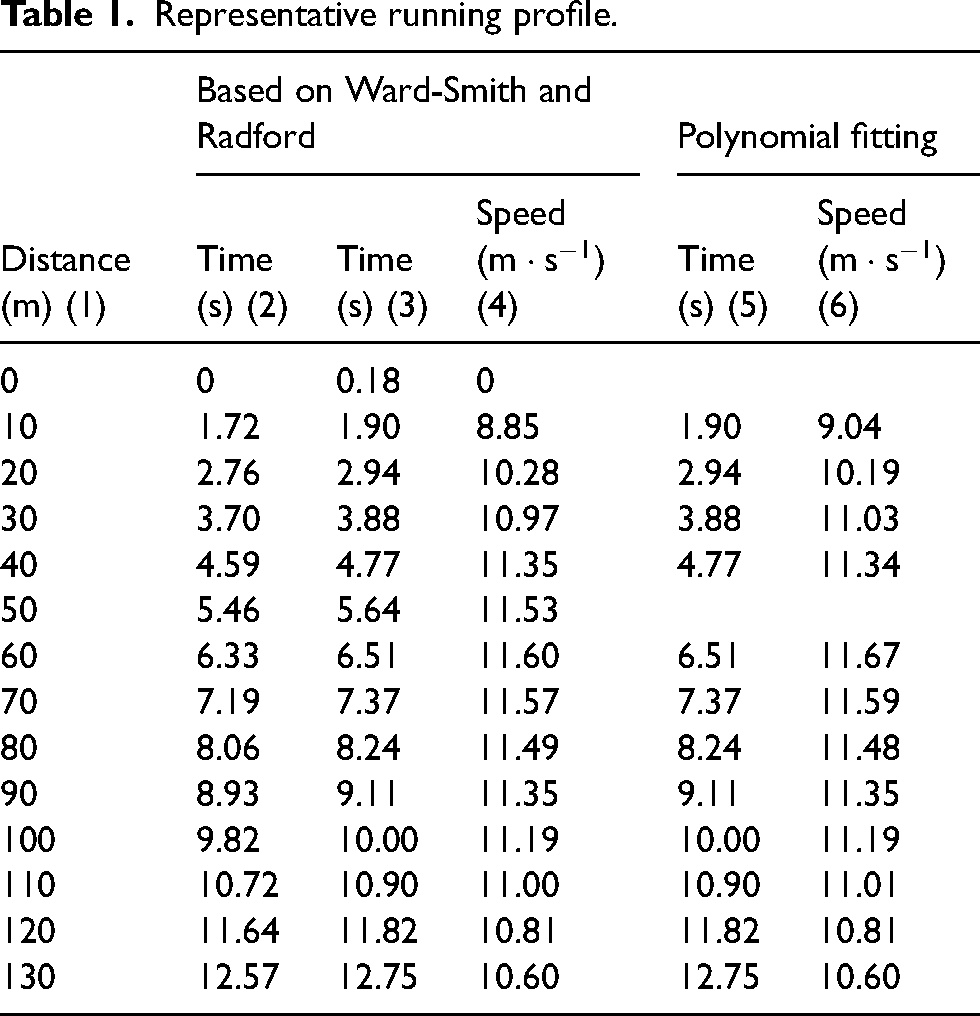
In the third column a reaction time of 0.18 s is added to the figures in column 2. The plot of the time in column 2 against the distance in column 1, shown in Figure 1, reveals a running profile assumed in section “Theoretical outline.” From start, there is an acceleration phase up to an inflection point, here at around 60 m where the speed is at its maximum of 11.60
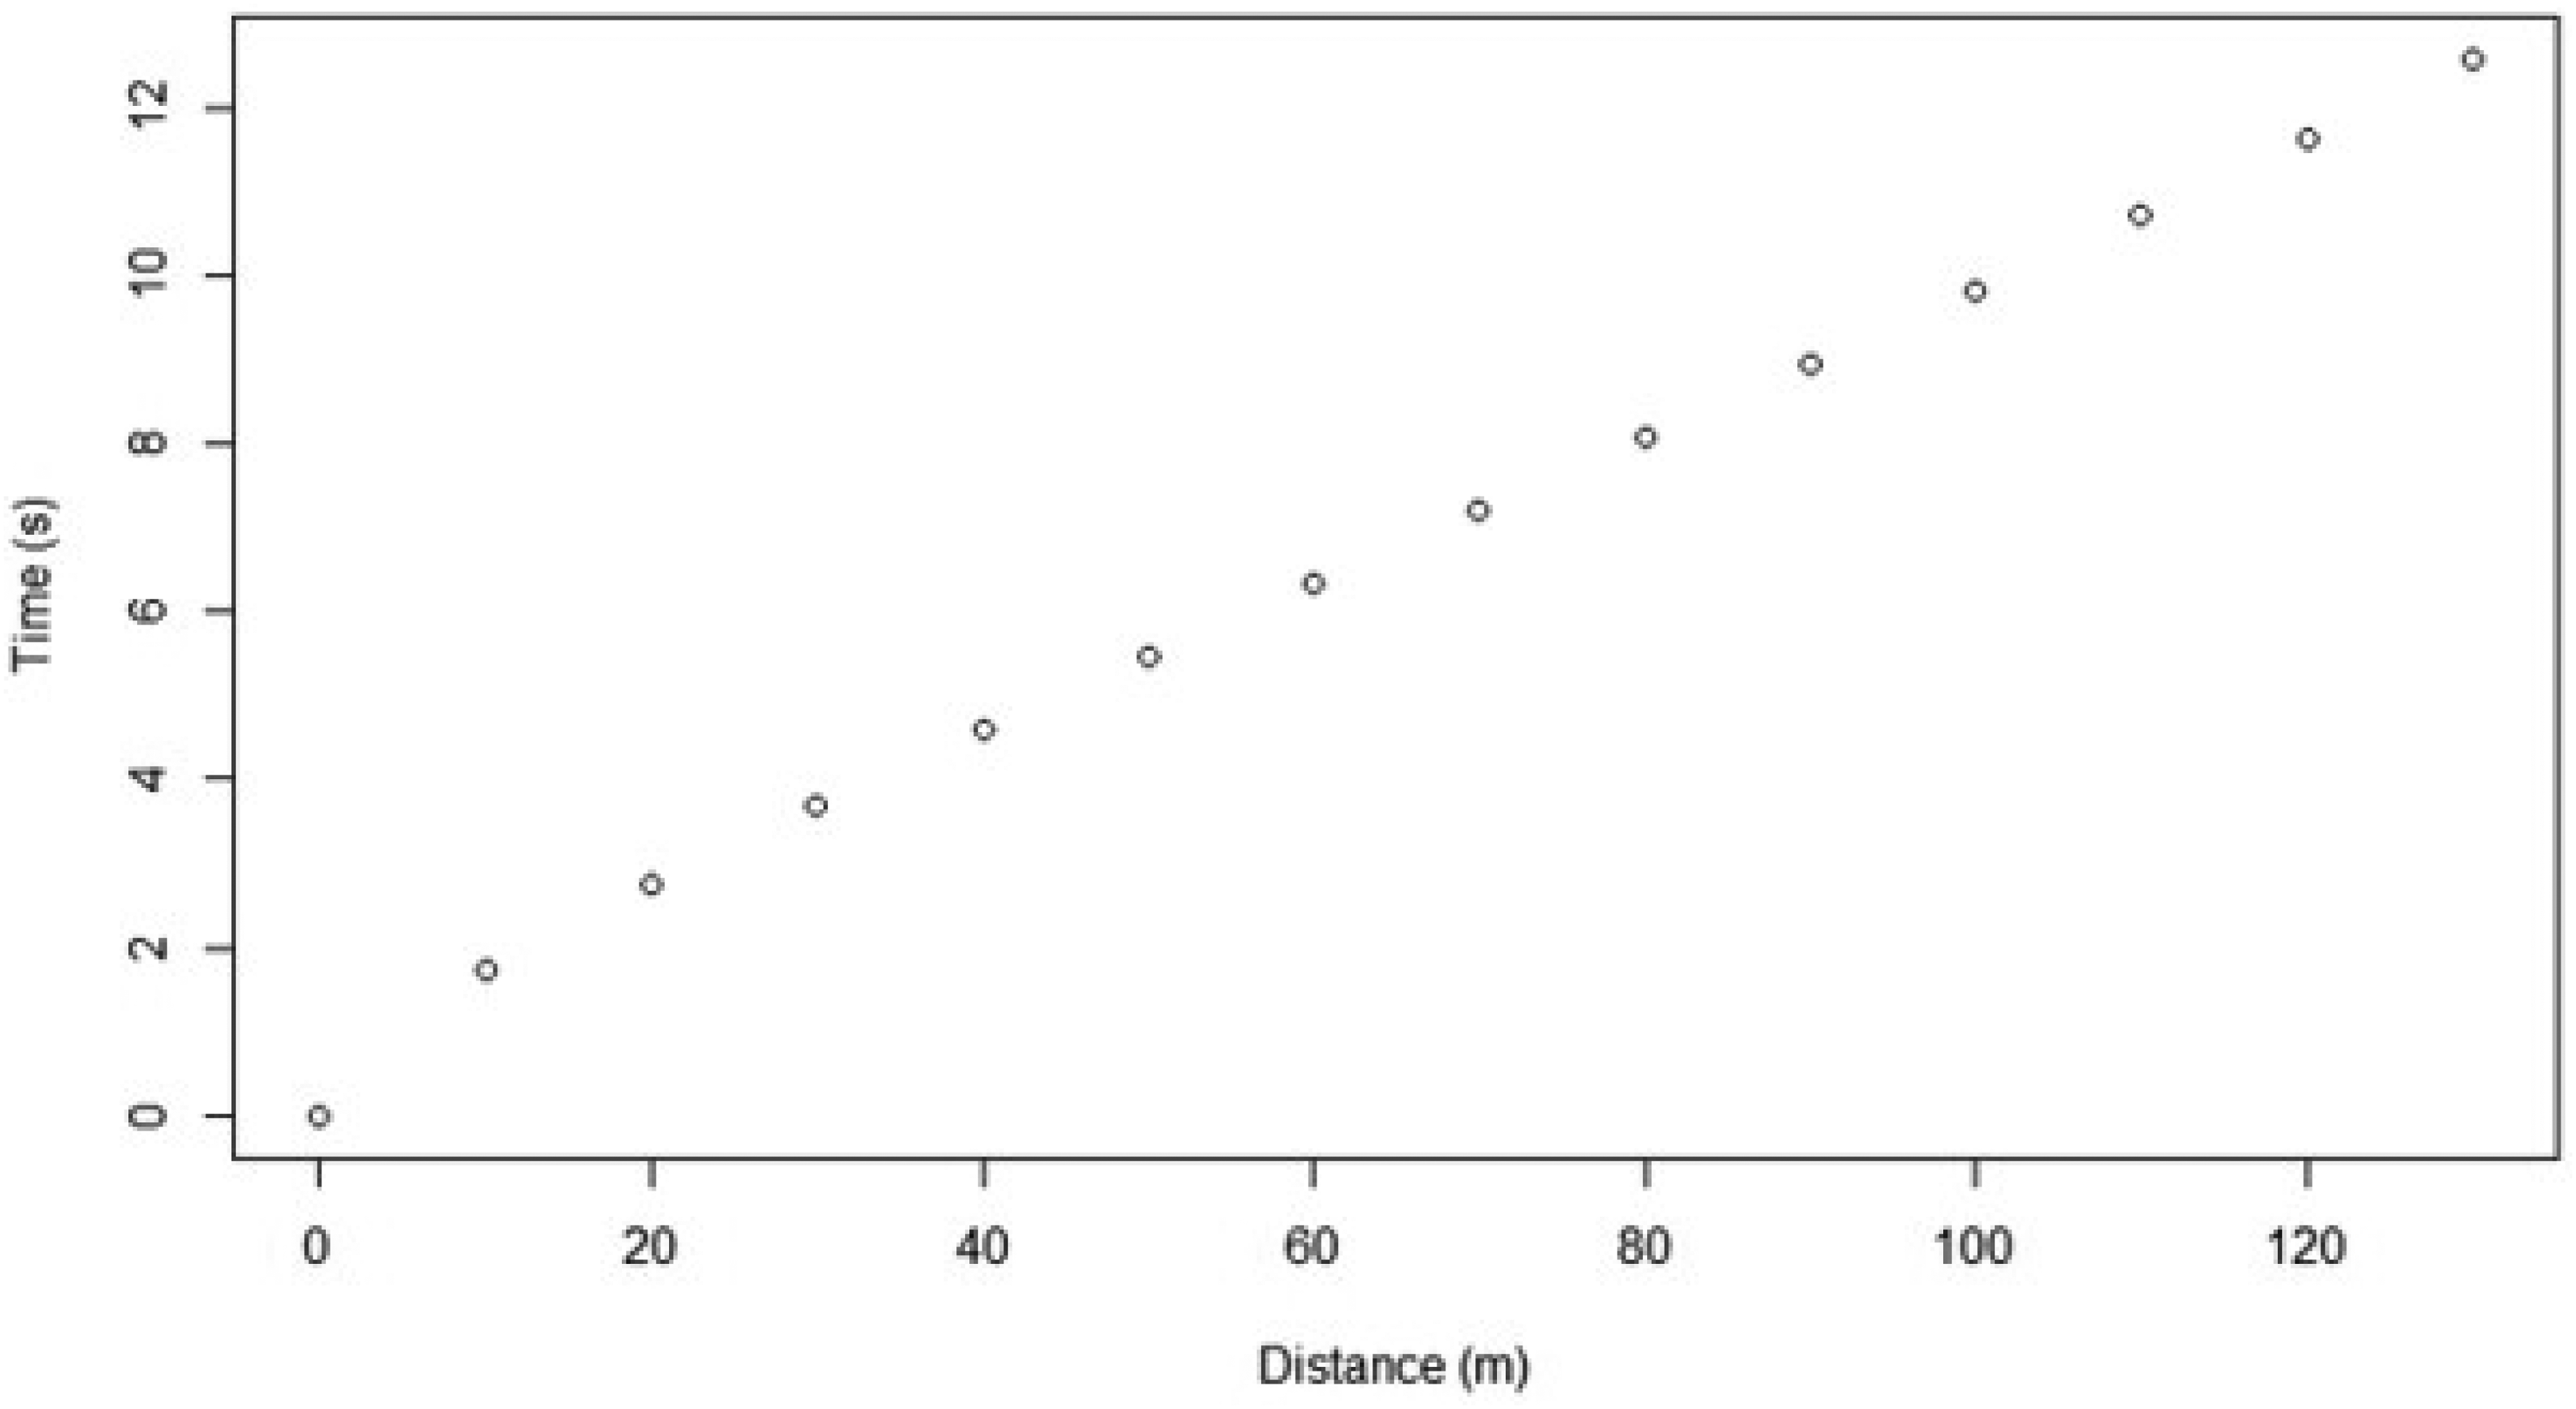
The running profile, time as function of distance.
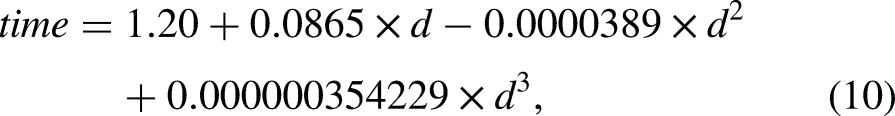
Our method to determine the optimal starting and finishing positions requires a continuous and differentiable function for the team members’ running profiles relating the time to cover a certain distance. A third-degree polynomial was first fitted by OLS to the data plotted in Figure 1. Although such a functional form is flexible enough to allow for a concave acceleration phase, followed by a convex deceleration phase, the fit was not satisfactory. We also tried a fourth-degree polynomial with only minor improvements. Therefore, we abandoned the idea of fitting one function to the entire set of data and decided to estimate one function for the acceleration part (0–60 m) and another function for the deceleration part (60–130 m). The estimated polynomial for the acceleration part, based on four observations (10–40 m), is given by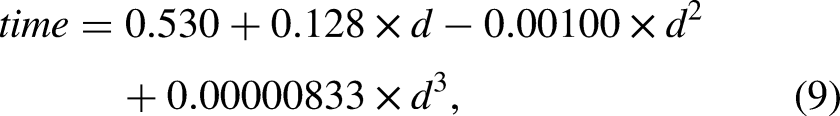
The predicted time and speed are reported in the last two columns in Table 1. Our predictions are overall very good, just slightly overestimating the speed at 10 m, ruling out the need for higher order polynomials.
Consider the problem set out in section “Theoretical outline” of minimizing the race time
Optimal start and exchange positions with resulting race time, with and without restrictions.
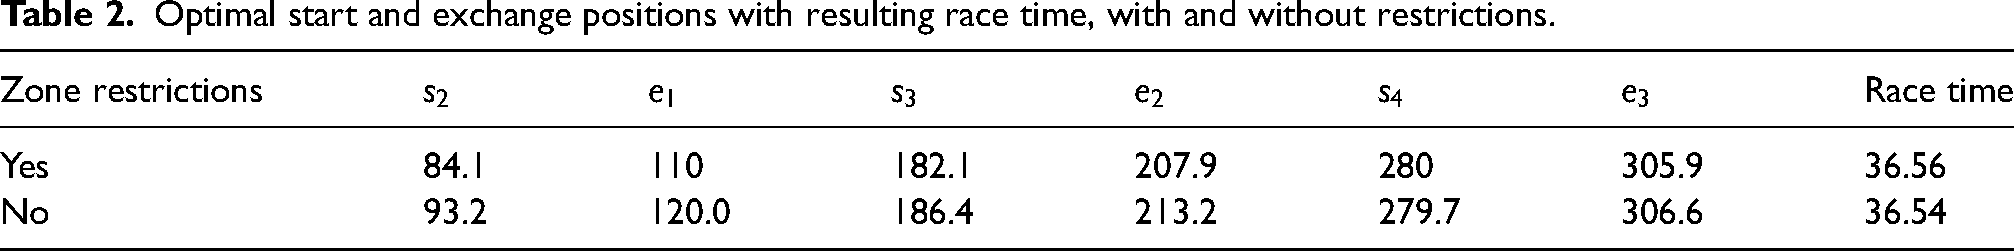
The first and third takeover zones constitute binding restrictions. The first exchange will take place at 110 m, the upper limit of the first zone, while the fourth runner will start at 280 m, the lower limit of the third zone. The restrictions affect start and exchange positions to a certain extent, while the effect on race time is marginal,
It is also implicitly shown that the distance acceleration phase for the outgoing runners is the same. This holds for both cases, slightly less than 26 m with restrictions and almost 27 m without restrictions. These results suggest the speed at the exchange of the outgoing runners is the same for all runners. Table 3 shows the speed at each exchange for the incoming and outgoing runner, as well as the speed at 400 m for the fourth runner.
Estimated speed at the exchanges.
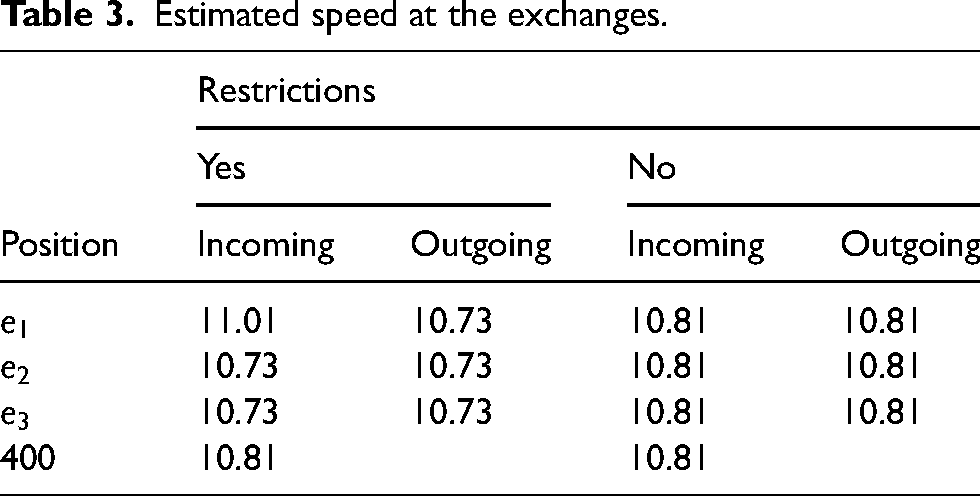
The first-order conditions set out in the previous section are fulfilled for the case with no restrictions. However, with restrictions considered, the speed of the incoming runner at the first exchange is higher than the speed of the outgoing runner, violating condition 1. One might wonder why the second runner does not choose to have a longer acceleration phase to better match the speed of the incoming runner, for example by starting at 80 m instead. That would lower the speed of the second runner when coming into the second exchange, and to maintain a high speed for the baton through the takeover zone, the baton would have to be handed over at a position well before 207.9 m. However, this is not possible since the lower limit of the zone will prevent the third runner to reach a matching speed at the exchange. Condition six is also violated since the fourth runner's speed is higher at the finishing line than at the third exchange. For the speed at the third exchange to equal the speed at the finishing line, the baton would have to be handed over at a position, where the third runner has a higher speed than 10.73, which is at a position before 305.9 m. However, again it is not possible for the outgoing runner to match that higher speed by a longer acceleration phase since he is not allowed to start before 280 m.
Also, how come the speed for the incoming runner at the first exchange is higher with restrictions? Without restrictions, the first-order conditions show that the speed of both incoming and outgoing runners at all exchanges should be the same as well as the speed of the fourth runner at the finishing line. The assumption that all runners have identical running profiles, implies that they need to run the same distance to fulfill the conditions, a distance well over 110 m, because part of the acceleration phase is without baton for the last three runners. The first runner carries the baton during the whole part of his race, meaning that he will hand over the baton beyond the first takeover zone. With restrictions imposed, this will not be possible for the first runner who will hand over the baton at 110 m at a higher speed than 10.81 m/s since he is in the deceleration part.
Finally, in Table 4 the checkmark positions
Checkmark positions and the corresponding checkmark distances for different runners.
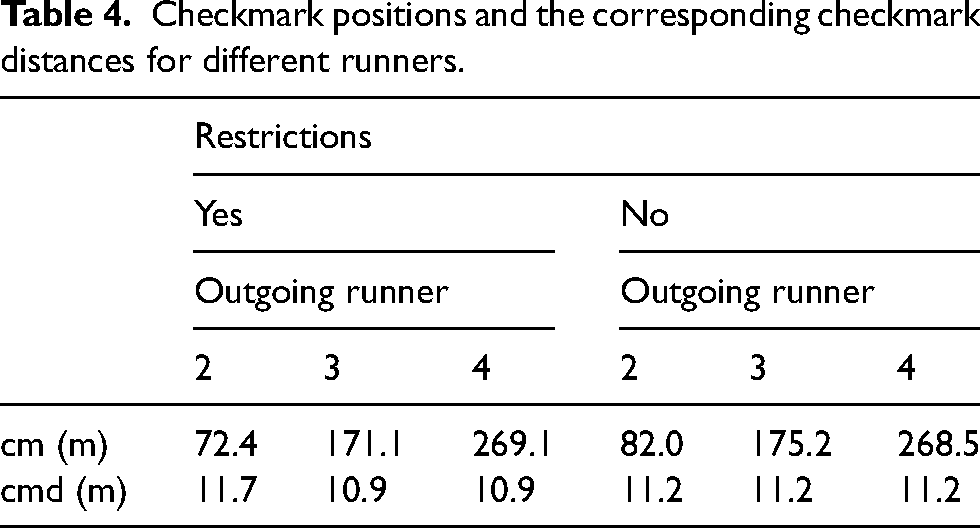
With restrictions the checkmark distance is longer for the second runner than for the rest of the runners. This is explained by the higher speed of the first incoming runner. Not surprisingly, without restrictions the checkmark distance is the same for all runners.
A stochastic model for the 4 × 100 m relay
So far, we have assumed that the outgoing runner perfectly can adjust the time at which he starts to run to exchange at a certain predetermined position. This is accomplished by making use of a distance marker. By the outgoing runner starting when the incoming runner passes the marker, the marker is to be positioned such that the time it takes for the outgoing runner to cover the distance from the start position to the predetermined exchange position is to be equal to the time it takes for the incoming runner to cover the distance from the marker to the exchange position. However, the validity and usefulness of such a calculation of the marker's position rests on two assumptions.
First, perfect information on the team members’ running profiles is needed. Although the coach has information to assess the runner's daily form, it is not reasonable to assume that the coach is perfectly able to forecast the running performance. A discrepancy between actual and expected performance can have negative consequences. For example, if the outgoing runner's daily shape is worse than expected, while the shape of the incoming runner is underrated, the incoming runner will catch up the outgoing runner too early for the exchange to be optimal. Even worse, if the opposite holds, that is, the shape of the outgoing runner is underrated while the shape of the incoming runner is overrated, the exchange will not even occur, since the incoming runner will not catch up the outgoing runner, resulting in a disqualification of the team.
Second, the outgoing runner is assumed to perfectly assess the point of time when the incoming runner passes the position of the marker. However, a certain misjudgment of distance is reasonable to think of since the marker is well over 10 m away from the start position while the incoming runner's speed is high. Such a misjudgment would also have negative consequences. If the outgoing runner starts too late, the incoming runner will catch up the outgoing runner before the optimal exchange position, while a too early departure results in a disqualification, since the incoming runner will not be able to catch up.
In this section, we relax the assumption of perfect knowledge of the team members’ running profiles, as well as the assumption of the outgoing runner being able to perfectly assess the point of time when the incoming runner is passing the marker. Instead, we model the running profile and the judgment of distance as being stochastic.
First, focusing on the running profile, we model the time it takes for runner i to run d meters as
Second, as for possible misjudgment of distance, we define the random variable
As explained above, allowing for these two stochastic elements implies that the team's loss is either a worsen race time or a disqualification. The loss function is certainly asymmetric, suggesting the checkmark distance to be shortened to lower the probability of disqualification by overrunning the takeover zone at the expense of worse expected race time.
A simulation approach
In this section, the design and results from a simulation study to explore the trade-off between expected race time and probability of disqualification by overrunning the takeover zone is presented. We are interested in determining this relationship for various settings of the coach's ability to forecast the running performance and the outgoing runner's distance assessment skills. This would make it possible to quantify the effect of ability and skills on expected race time for a predetermined probability of disqualification.
Design
We assume the coach's forecast of the running profile
To study the effect of the variation of the forecast error, the parameter
The number of possible values of ci used in the simulations depends on which value
For each cell we conduct 10,000 replicates, where each replicate consists of seven independent draws from each of the seven random variables The starting time of the second runner The profiles The starting time of the third runner The profiles Steps 3 and 4 are repeated for the third exchange. Here, The time for the fourth runner to carry the baton from Finally, the team's race time is calculated as
To help the reader to gain insight into the process of generating races, the first two steps concerning the first exchange are illustrated graphically in Figures 2 and 3. In both figures we consider a case where 

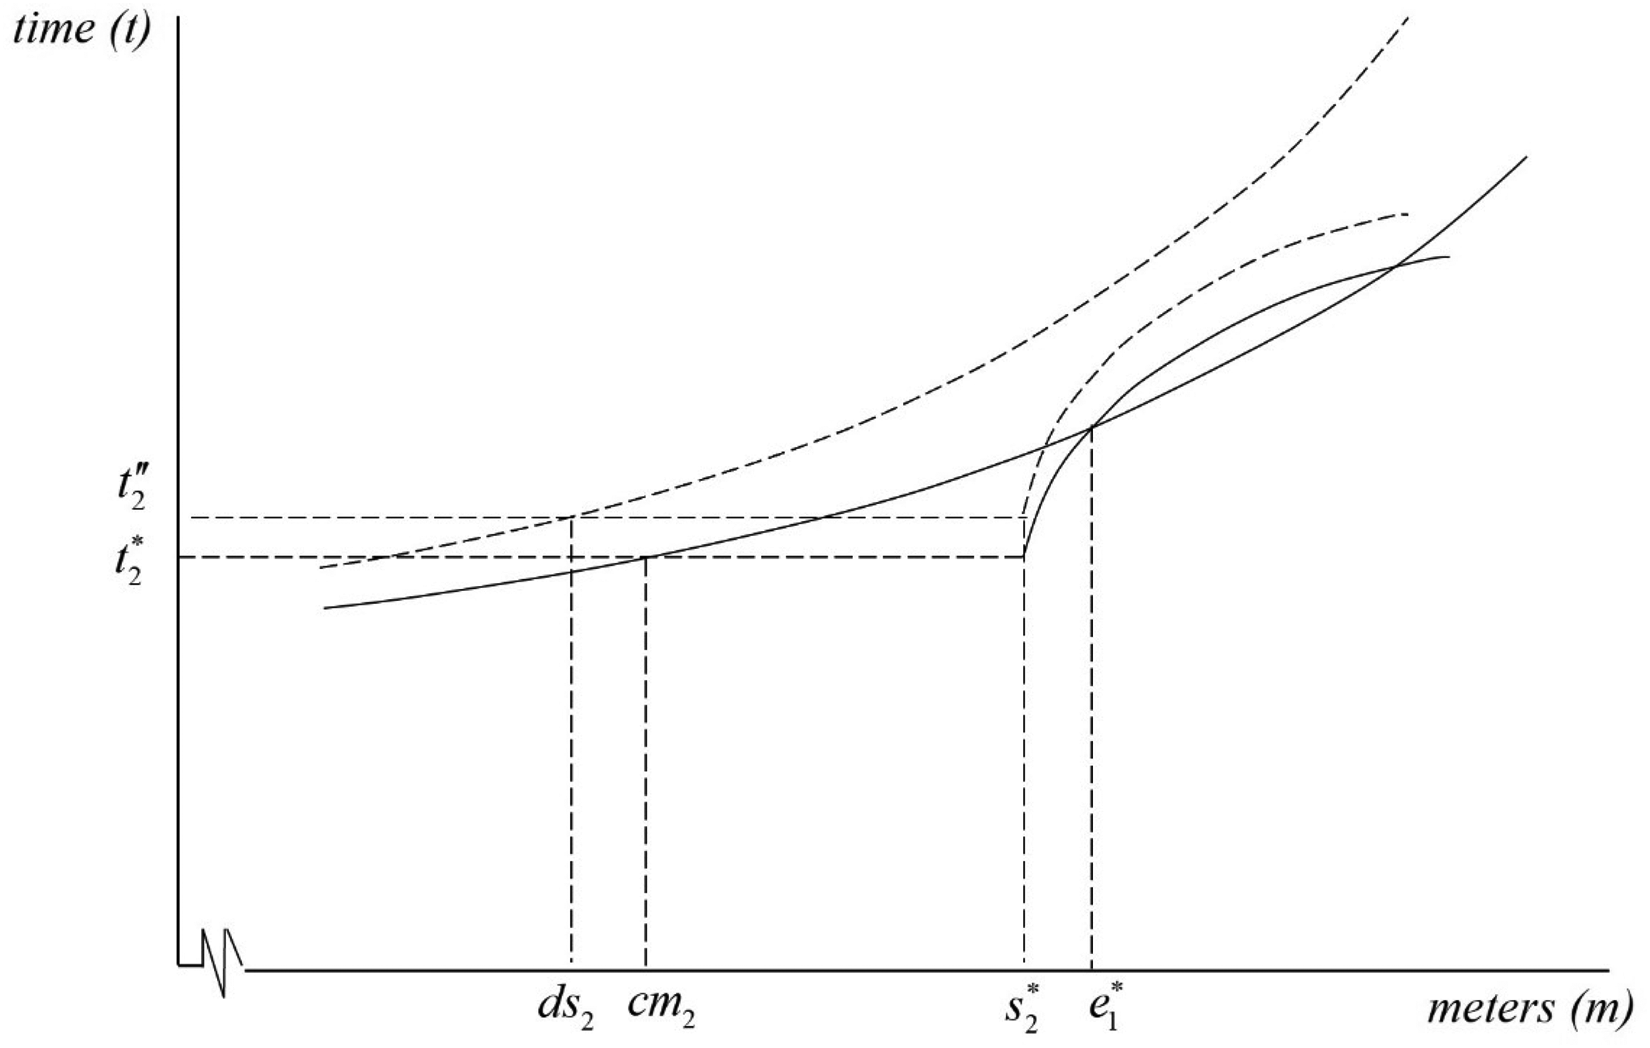
Graphical illustration of steps 1 and 2 in the above scheme resulting in a disqualification.
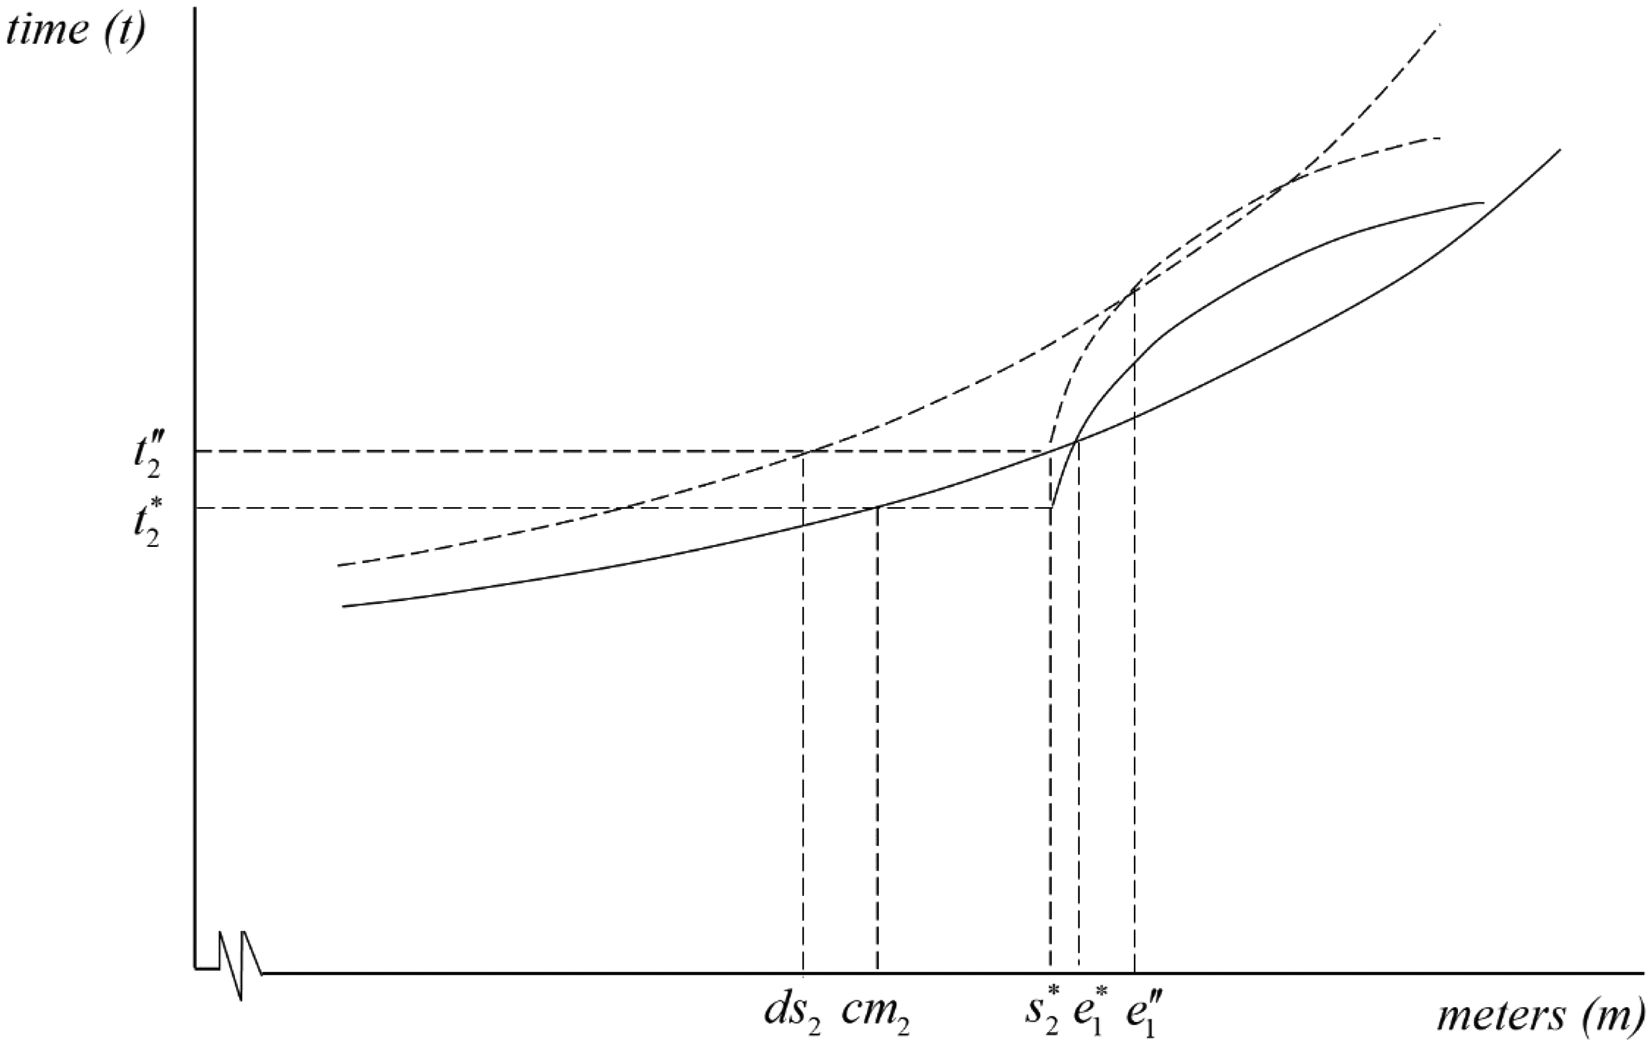
Graphical illustration of steps 1 and 2 in the above scheme resulting in an exchange.
Consider Figure 2, where
However, under the stochastic outcome scenario, since
Now we turn our attention to Figure 3. The settings are the same as before, except that
Once we have generated 10,000 races for a given cell, the probability of disqualification and the expected race time is estimated as the proportion of disqualifications among the simulated races and the average race time for those simulated races not leading to a disqualification, respectively. This is repeated for all cells and cases.
Results
We simulate six cases. In Figure 4, we illustrate the full outcome for the case
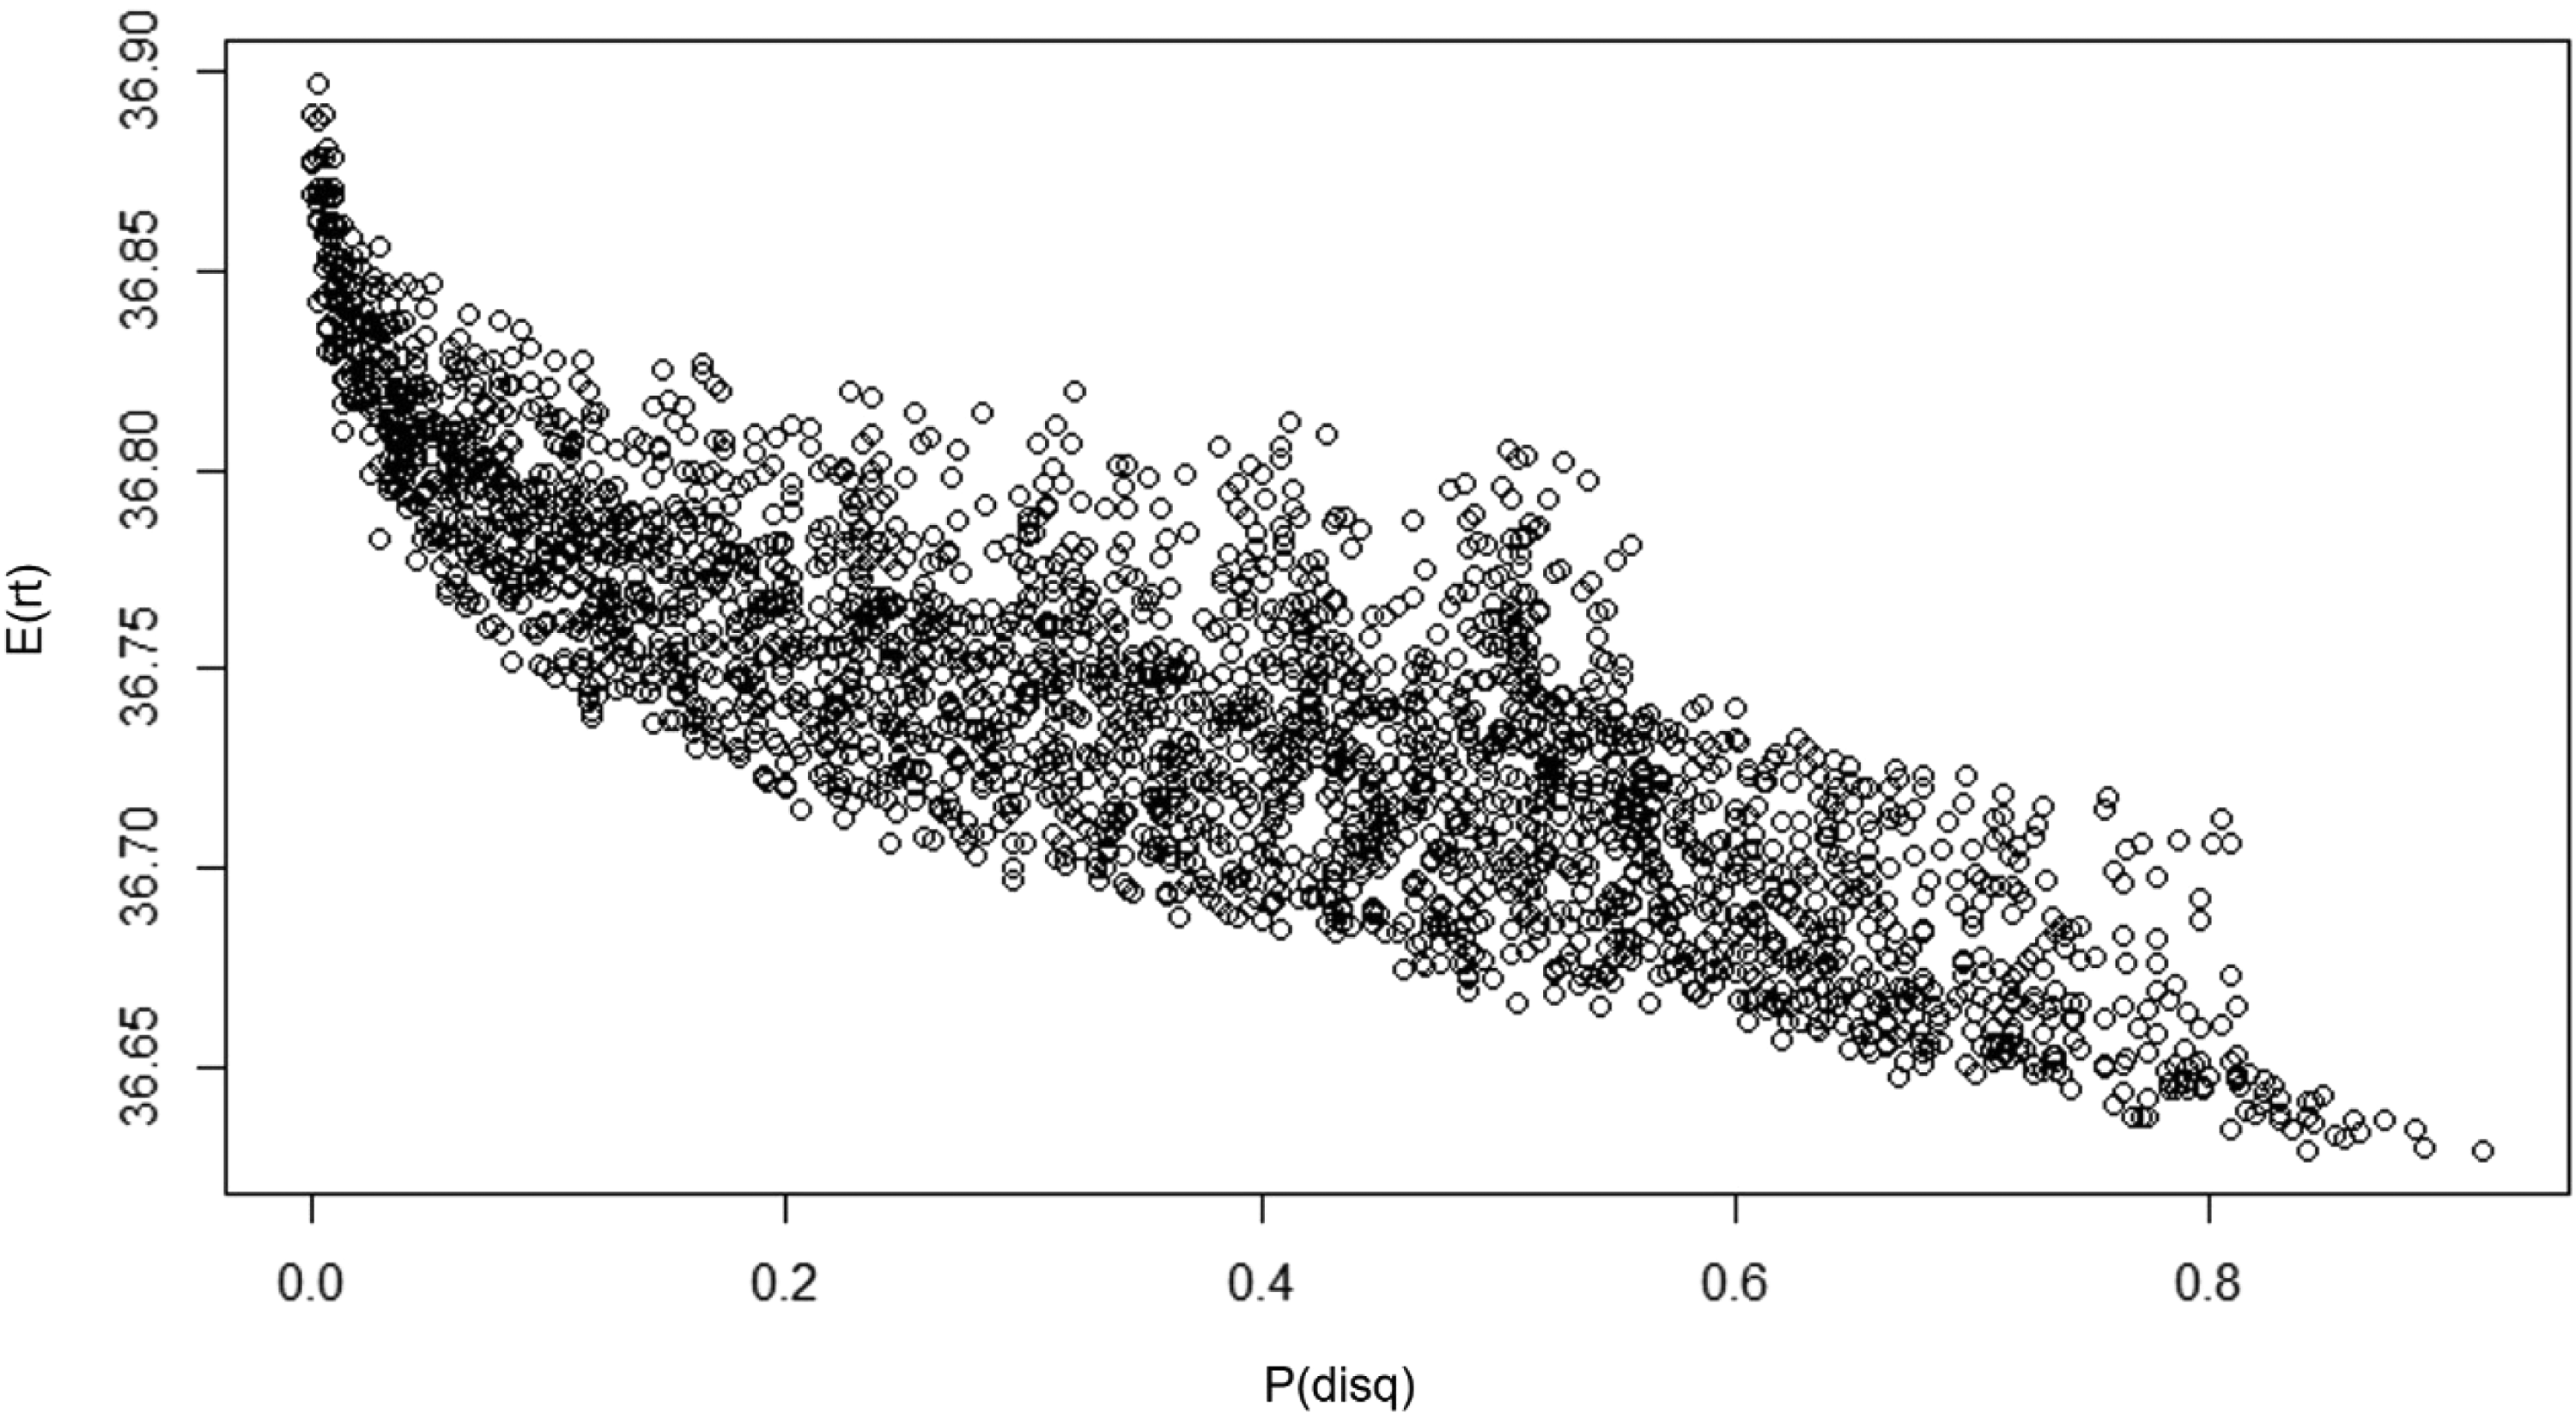
Probability of disqualification and expected race time.
In Figure 5, the efficient frontier is shown graphically for our three different values of
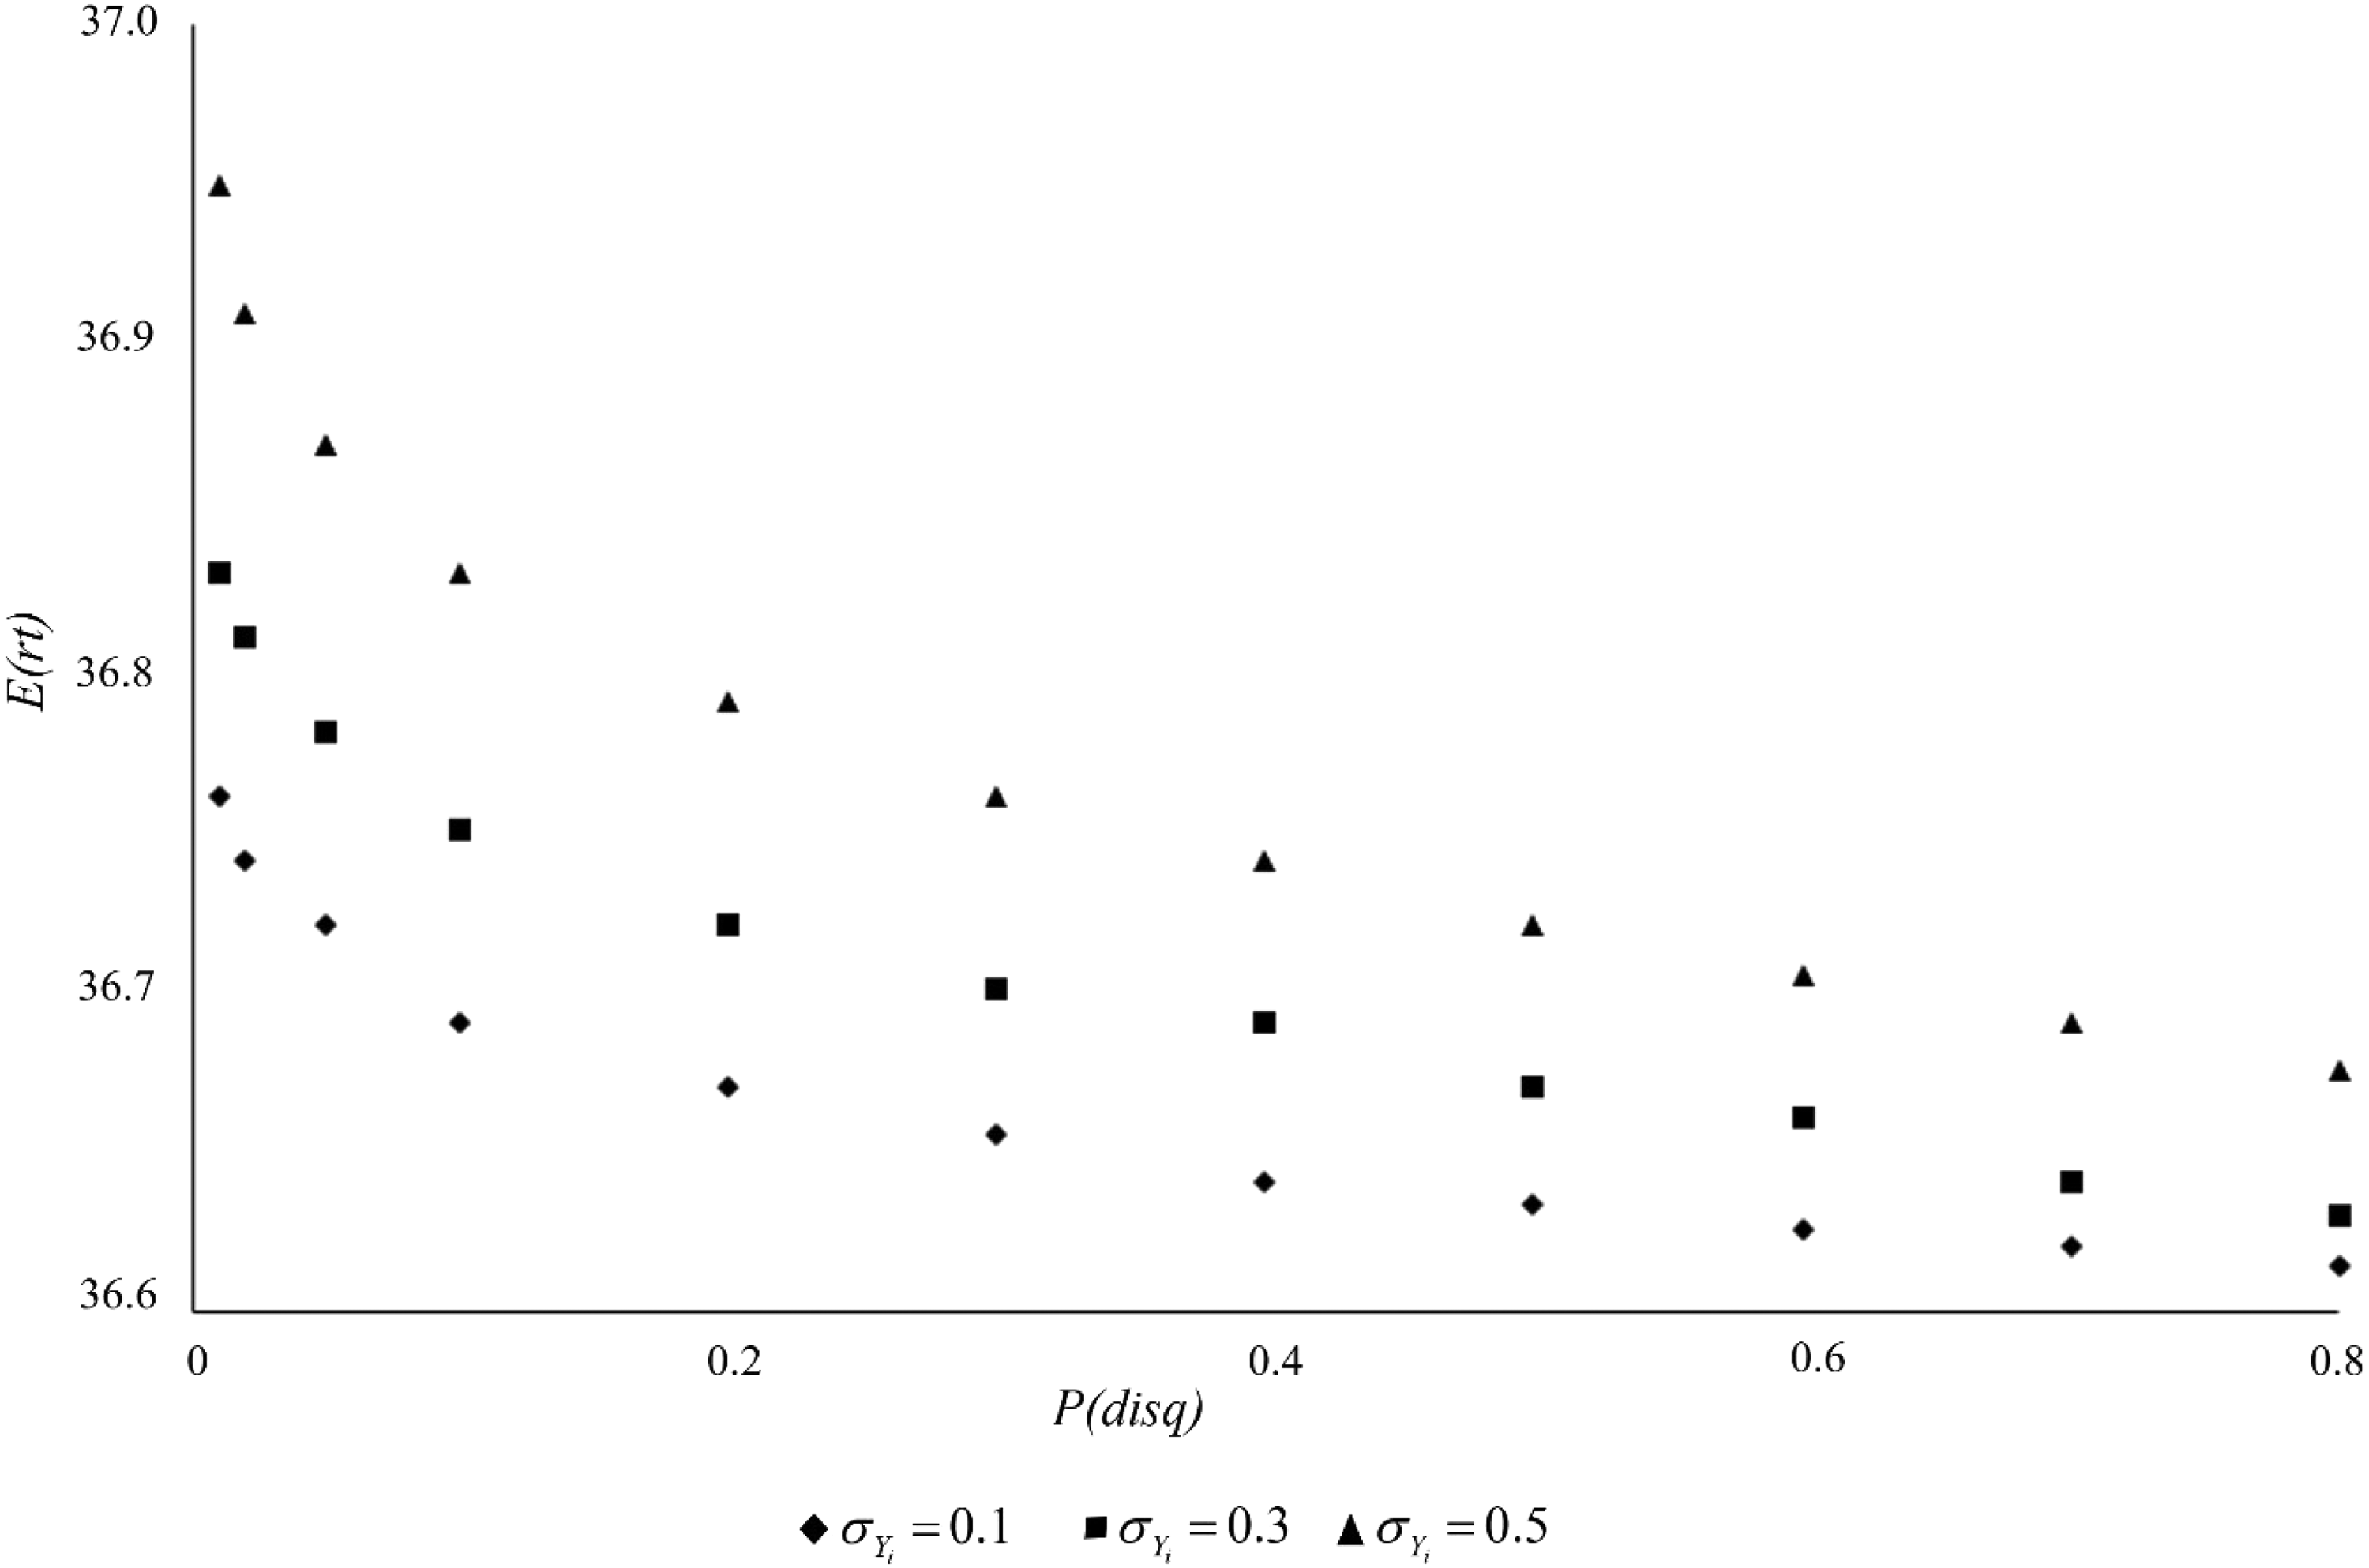
Efficient frontiers for three different values of
A large variation in the outgoing runner's distance assessment has a negative impact on the trade-off between expected race time and probability of disqualification.
Figure 6 shows the efficient frontier for two different values of
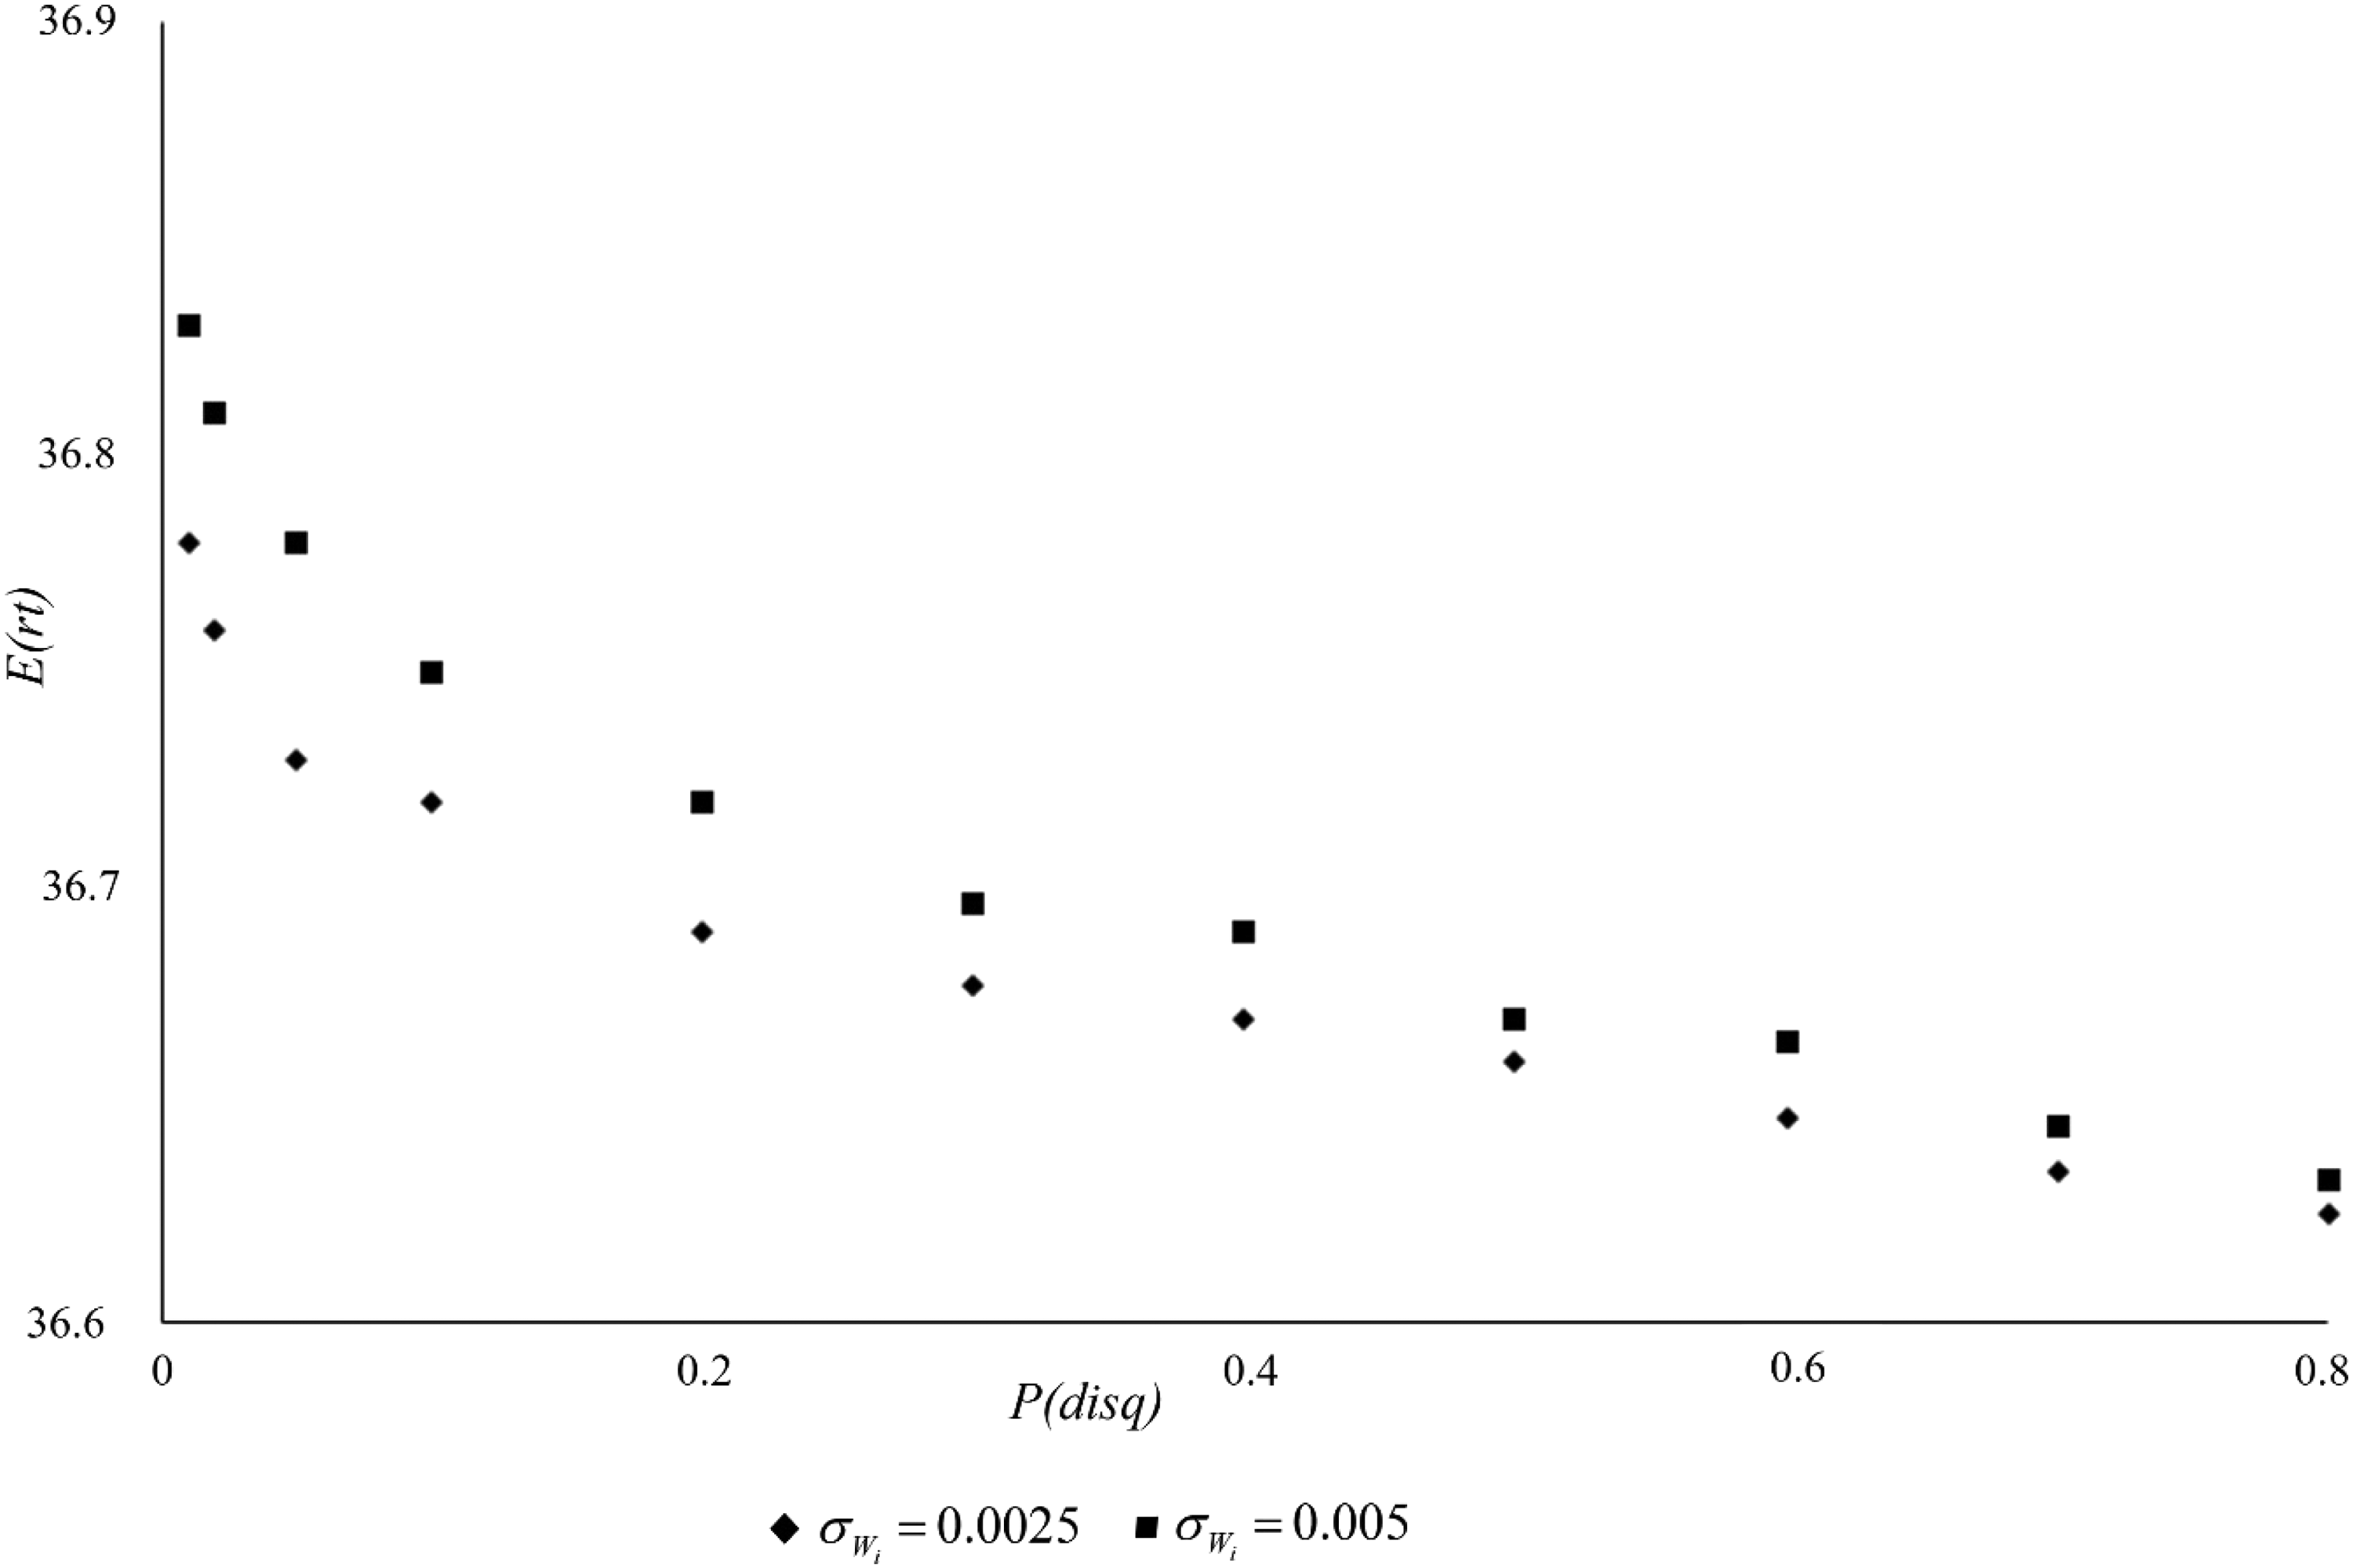
Efficient frontiers for two different values of
In Table 5, seven points on the efficient frontier for each of the six simulated cases are displayed together with the corresponding optimal sets
Points on the efficient frontier for six simulated cases and their corresponding set
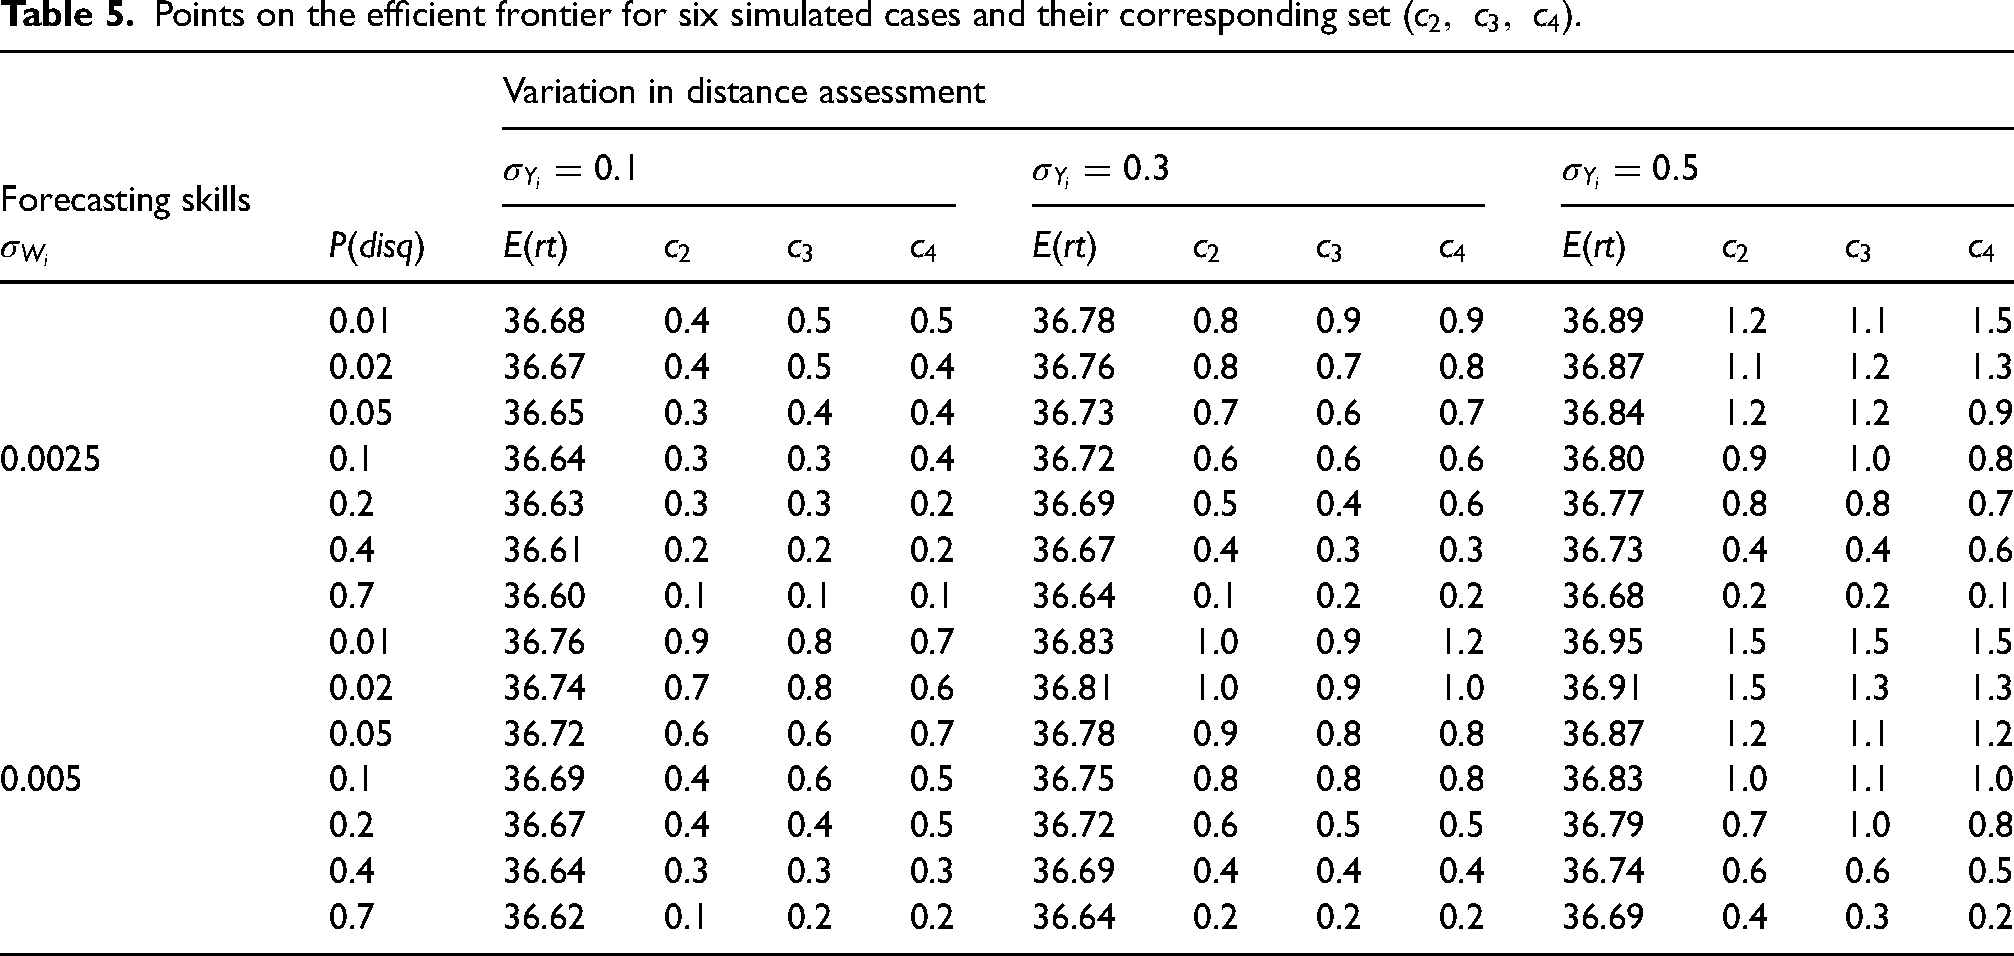
As for the sets
Second, the worse distance assessment skills for a given level of forecasting skills, the more shortening of the checkmark distance for a given disqualification probability is needed. This also explains the variation in expected race times, since if an exchange occurs, a short checkmark distance most likely will result in a large loss of speed at the exchange.
Summary and conclusions
The contribution of the present paper to the literature on the 4 × 100 m relay is twofold.
First, the mathematical formulation as a minimization problem of the race time results in theoretical insights. The first-order conditions reveal the necessary conditions for the team members’ speed at the exchanges, that is, the speed at each exchange should be identical for the incoming and outgoing runner. Moreover, for the last three runners the speed when receiving the baton should be equal to the speed when the baton is handed over, or for the fourth runner, when passing the finish line. For a tentative team, consisting of four identical elite male sprinters, it is shown that some of the restrictions imposed by the positions of the takeover zones are binding. In the constrained optimum the speed of the incoming runner should exceed the speed of the outgoing runner at the first exchange, while the speed of the fourth runner at finish line should exceed the speed when receiving the baton.
Second, quite many teams are disqualified because of failure to exchange within the takeover zone. Two possible explanations for that are identified. First, the outgoing runner might go too early because of misjudgment of when the incoming runner passes the checkmark. Second, the incoming runner will not be able to catch up the outgoing runner because of a bad forecast of a runner's daily shape. The formulation of the stochastic model allows for examining the effects of these two potential problems by conducting a simulation study. The variation in the random variables forecasting daily running shape and distance assessment is varied, as well as the checkmark distance, to determine the best possible trade-off between expected race time and probability of disqualification for different settings of variation of the two random variables. Conditioning on a low disqualification probability, the difference in expected race time is shown to be substantial between teams with different variation in distance assessment and forecasting running performance, respectively.
In this paper, a disqualification occurs if and only if the incoming runner is not able to catch up the outgoing runner within the takeover zone, given their running profiles. Of course, this is a simplification of the affairs. In practice, an outgoing runner having gone too early for example, might slow down the speed to prevent overrunning the takeover zone, thereby avoiding disqualification. Moreover, in reality a disqualification arises if the baton is dropped although the speed of the runners in the takeover zone is matched.
The latter case would be fairly easy to model by simply assigning a probability of such an event based on empirical findings. In the former case, we are faced with the challenge of modeling the way the outgoing runner slows down to determine the time loss of such a behavior. However, we believe such a behavior would most likely result in a substantial time loss, thereby almost being equated to a disqualification and therefore not necessary to model.
Our method of analyzing 4 × 100 m cannot be applied to 4 × 400 m for various reasons. A crucial difference between these races is that an outgoing runner cannot assess the speed of the incoming runner unless he looks back to grasp the baton, due to possible high accumulation of lactic acid of the incoming runner. Consequently, disqualifications are very rare in these races. Also, after the first exchange, all teams are allowed to run on the inside lane, leading to other strategical considerations than the case in 4 × 100 m. At the exchange, an outgoing runner might decide to slow down and take another outgoing runner's back to avoid air resistance.
Ward-Smith and Radford 1 and Radford and Ward-Smith 2 discuss the importance of taking speed reduction on bends into account when deriving optimal start and exchange positions, as well as checkmark distances. Since we assume four straight legs, our results cannot fully be generalized to the real track and field event of 4 × 100 m relay. By comparing results, start and exchange positions are only marginally affected, while our checkmark distances differ percentage wise more and should therefore not be used for normative purposes. The quantitative magnitude of the trade-off between the expected race time and the probability for disqualification, as illustrated in Figures 5 and 6, likely changes for every bended lane considered, but the qualitative result we have obtained in this paper remains the same. Despite this shortcoming of our approach, it is motivated by two reasons. First, it offers an increased understanding of optimizing exchanges in terms of the derived first-order conditions about speed. Second, our approach offers an easy way to highlight the importance of distance assessment ability and forecasting running performance skills on the trade-off between expected race time and probability of disqualification.
A next step in the research process would be to incorporate distance assessment ability and forecasting running performance skills into a model where the speed reduction of bends is considered, requiring a modified approach. Given information on each team member's forecasted running profile on a straight track, variation in distance assessment ability and forecasting running performance skills, such a model could offer the team coach valuable guidance of start positions and checkmark distances for best possible expected race time given a predetermined disqualification probability.
Using the available data from international competitions, for example, World Championships and Olympic Games, an interesting research question would be to investigate risk-taking behavior in 4 × 100 m relay, that is, analyze whether predicted slower teams, whose members individually have worse running times on 100 m than members of faster teams have, are more likely to be disqualified in relay races. 10 In addition, it could also be interesting to test whether the probability of being disqualified differs across male and female athletes.
Footnotes
Acknowledgements
The authors thank László Csató for many helpful and constructive comments.
Declaration of conflicting interests
The author(s) declared no potential conflicts of interest with respect to the research, authorship, and/or publication of this article.
Funding
The author(s) received no financial support for the research, authorship, and/or publication of this article.
Notes
Appendix
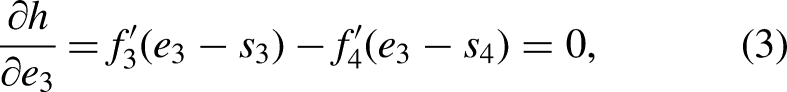
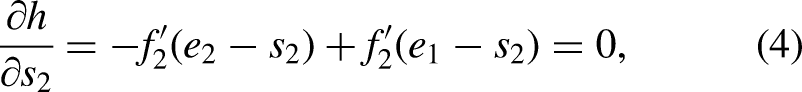
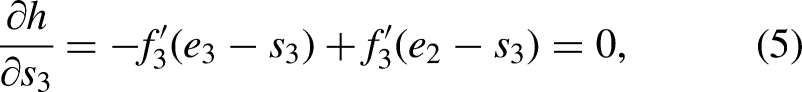
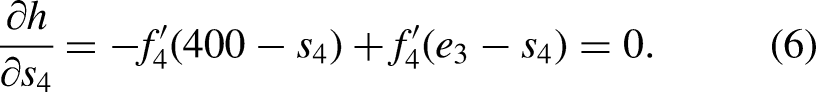
In this appendix, we illustrate and explain the conditions given in equation (1) and in equation (6). Equations (2-3) and equations (4-5) can be illustrated in similar ways.
Consider Figure A1, illustrating the first exchange.
The leftmost graph describes time elapsed from the starting signal as a function of the first runner's position measured from the start of the race. The other three graphs illustrate the corresponding relationship for the second runner for three different starting times. The exchange should take place at
In Figure A2(a) and (b), the sixth condition is illustrated. The upper leftmost graph in Figure A2(a) describes time elapsed since the starting signal as a function of the third runner's position, measured from the start of the race. The other two graphs illustrate the corresponding relationship for the fourth runner for two different starting positions,
A starting position at
However, the average speed with which the baton is carried from
Now, consider Figure A2(b), describing a similar situation as Figure A2(a), except that the alternative scheme is for the fourth runner to start at