
Abstract
Using a pre-post-test design, this study evaluated the impact of implementing a standard on the reliability of player management decision-making within a professional rugby union environment. Five practitioners from a High-Performance Unit (HPU) rated 22 instances of Global Positioning System (GPS)–based external training load information of 14 players across the 2021–2022 season. This rating was whether a peak/trough/normal exposure in load had occurred. The ratings were repeated at four time points (separated by 2 weeks) before (Pre1, Pre2) and after (Post1, Post2) implementing a consensus statement as a subjective standard (using a dashboard) developed previously within the same environment to identify peaks/troughs in player external training loads. Inter-rater agreement between individuals at each voting round was assessed using Light's Kappa, while pre-post-standard intra-rater agreement was determined from Cohen's Kappa (both with 95% confidence intervals). Changes to dashboard usability from implementing the standard were assessed by administering the System Usability Scale to 11 HPU staff at the four time points. Pre-standard moderate inter-rater agreement (Pre1: 0.53 (0.36–0.69), Pre2: 0.60 (0.42–0.77)) increased to almost perfect agreement (Post1: 0.74 (0.57–0.89), Post2: 0.90 (0.79–1)) post-standard. The intra-rater agreement of 2/5 participants was almost perfect post-standard, while it remained within substantial levels for the others. A linear mixed model (χ2(3) = 8.85, p = 0.03) illustrated a slight increase in dashboard usability after incorporating the standard (Pre1: 84.09, Pre2: 81.36; Post1: 87.73, Post2: 87.27). Overall, the results highlighted that the subjective standard enhanced reliability of practitioner agreement for the selected decision.
Keywords
Introduction
With the rapid growth in the use of data for player management decision-making, researchers have emphasised the need to establish data-informed operational mindsets in sport environments. 1 Data on its own has no meaning. 2 It must transition to its higher-order dimensions of information and evidence to adequately support decision-making. A recent health informatics and data science framework highlighted that information is data with context and information compared to standards creates evidence. 3 In sport settings, information is typically contextualised from data by extracting it from storage, transforming it into meaningful forms and then reporting it to users through visualisation techniques. 4 However, the interpretation of evidence from information has both subjective and objective dimensions. That is because both the experiences of practitioners in interacting with player information (subjective) and the insights generated from information through analytical techniques (objective) are important for decision-making. 1 Therefore, to generate high-quality evidence from information, subjective standards that can organise practitioner judgements on information and key performance indicators (KPIs) that define objective benchmarks are needed within player management decision-making processes.
A recent Business Process Management 5 analysis of decision-making processes within the performance department of a professional rugby union environment highlighted that, in certain instances, all stakeholders of a collective decision-making process may be expected to articulate evidence from the same information source. 6 In this study, one such decision was to identify when a player experienced higher (peak) or lower (trough) than normal external training loads from Global Positioning System (GPS)–based information. 6 However, objective standards through research-based evidence to guide this decision are currently limited in the sport literature since there is still an ongoing debate among sport researchers on how objective standards should be defined to extract evidence from training load information.7–9 Yet, from a practical viewpoint, practitioners continue to generate evidence from GPS information to guide decision-making in applied environments like rugby union, as this technology has already become a widely accepted information source within sporting contexts. 10 Due to the absence of relevant research-based guidelines, each practitioner engaged in a collective decision may articulate evidence from GPS information based on his/her individual biases and beliefs, leading to potential noise in decision-making. Hence, unless the evidence generated from such individual judgements is systematically organised, there is a risk that practitioners may be managing noise in their decision-making processes rather than the actual variability observed in player external training load exposures.
In such contexts, techniques like consensus development methods can organise practitioner judgements to create subjective standards to guide decision-making. 11 Previous studies use Delphi, 12 consensus development conference 13 or nominal group techniques 14 as the primary methods to develop such consensus statements. 15 However, pragmatically, it may be challenging to formulate generalisable objective standards across different professional sport environments as each sport organisation has a distinct set of objectives arising from unique operational standards, playing styles, financial strategies, recruitment plans, etc. 5 Thus, although macro-level frameworks can guide the formulation of benchmarks, the resultant micro-level constituents of a subjective standard may still be case specific. Hence, as a first step to organise such practitioner judgements, using the nominal group technique, a recent study had developed a consensus statement within a professional rugby union environment to identify instances of player exposures to peaks/troughs in external training loads using GPS information. 16 The relevant consensus consisted of 12 indicators, which were defined as a subjective standard to support evidence generation. While the implementation of such benchmarks for decision-making is appealing, there is still a lack of scientific evidence to systematically evaluate if such subjective standards can impact the extent of agreement/disagreement among practitioners, articulating evidence for decision-making from the same information source.
Therefore, this article aimed to examine the impact of a subjective standard on the agreement between practitioners making a common player management decision (to identify peaks/troughs in player external training loads) within a professional rugby union club. The specific details of the relevant case study environment were presented previously.4,6 The first objective was to integrate a subjective standard to identify external training load peaks/troughs of rugby union players from GPS information into the decision-making processes within the considered environment through digitalisation techniques (i.e. a data visualisation dashboard implemented using business intelligence software). Next, we evaluated the impact of the standard on practitioner agreement. The goal was not to validate the constituents of the standard but rather to assess how its existence affected within- and between-practitioner agreement on decision-making.
Methods
Subjects
Five High-Performance Unit (HPU) members (representing medical, sports science and strength and conditioning operational units) from a professional rugby union club (English Gallagher Premiership) were selected to rate external training load instances (from GPS information visualisation) of 14 senior squad and academy players (age: 24 ± 4, height: 186 ± 5.4, weight: 104.8 ± 12.2) from the first 33 weeks of the 2021–2022 Gallagher Premiership season. The HPU members were selected through guidance from senior management at the club and involved those who were involved in daily decisions regarding the management of external training load exposures of players. Table 1 illustrates the characteristics of the five HPU members. Ethical approval for the current study was obtained from the affiliated university (Ref. 87207 – Carnegie School of Sport, Leeds Beckett University).
Characteristics of the five HPU members selected to rate the events.
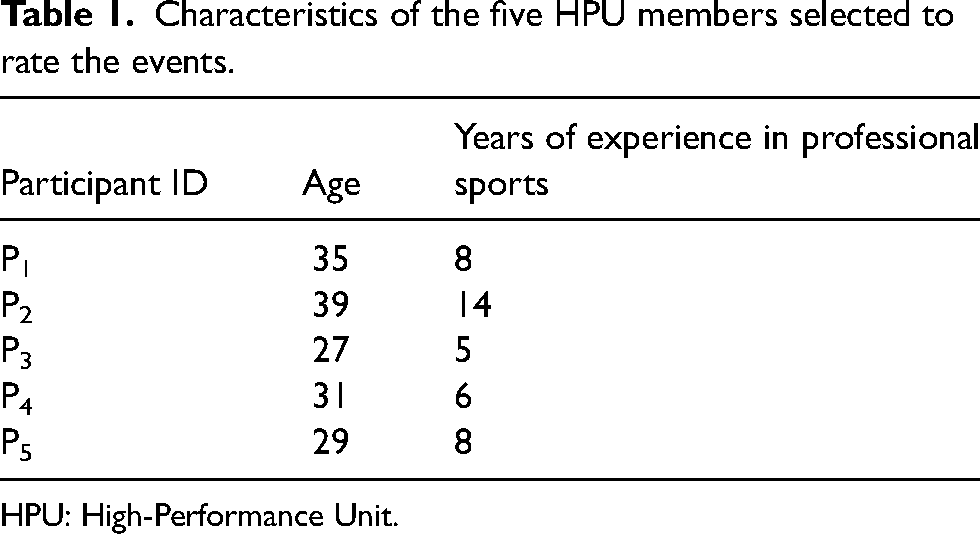
HPU: High-Performance Unit.
Design
This study used a pre-post-test repeated-measures case study design in which the five HPU practitioners made decisions whether 22 instances (refer to the Sample sizes section specified later for the justification) of player external training loads (measured via GPS units) had increased (peak), decreased (trough) or maintained (normal). Subsequently, the ratings (i.e. decisions) were repeated at four time points before and after implementing a subjective standard (i.e. consensus statement), which was specifically developed to identify peaks/troughs in player external loads using GPS information. One to 3 weeks has previously been suggested to be an acceptable washout period (i.e. time period where the intervention is not administered to allow its effects to be worn off) between repeated measurements. 17 Therefore, we separated the ratings by 2 weeks. Figure 1 provides an overview of the study design.
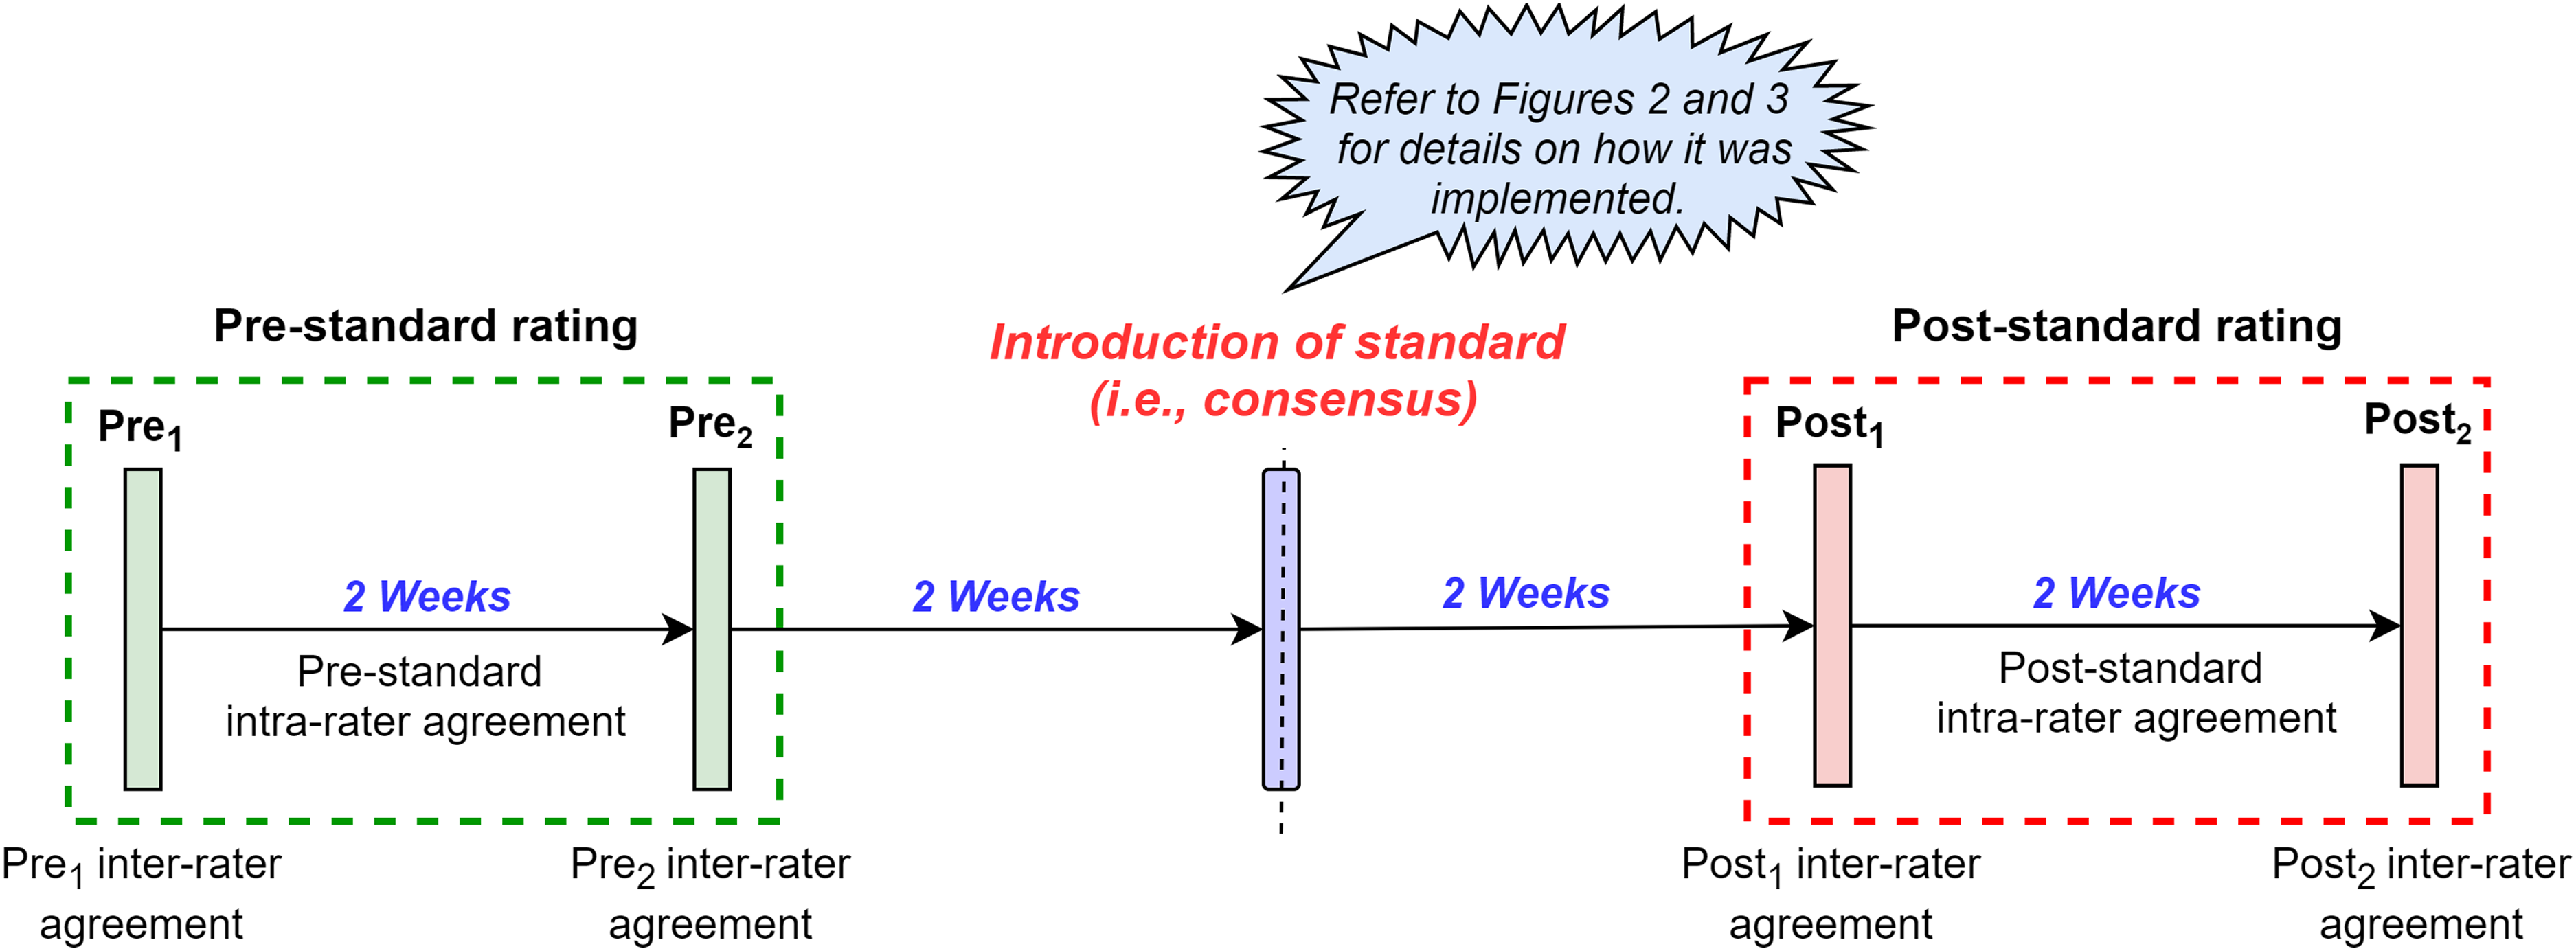
Overview of the study design.
Subjective standard and its implementation
As specified previously, the subjective standard considered in the current study was formulated from a consensus statement previously developed to identify changes (peaks/troughs) in training loads of rugby union players in the same case study environment (this includes the players considered for the current study). 16 The relevant standard was defined by utilising 10/12 indicators (2/12 were omitted due to practical challenges in implementation) from the original statement. The full details of these indicators are provided in Table 2.
Indicators implemented to identify a peak or trough in the external training loads experienced by a healthy player using GPS information.
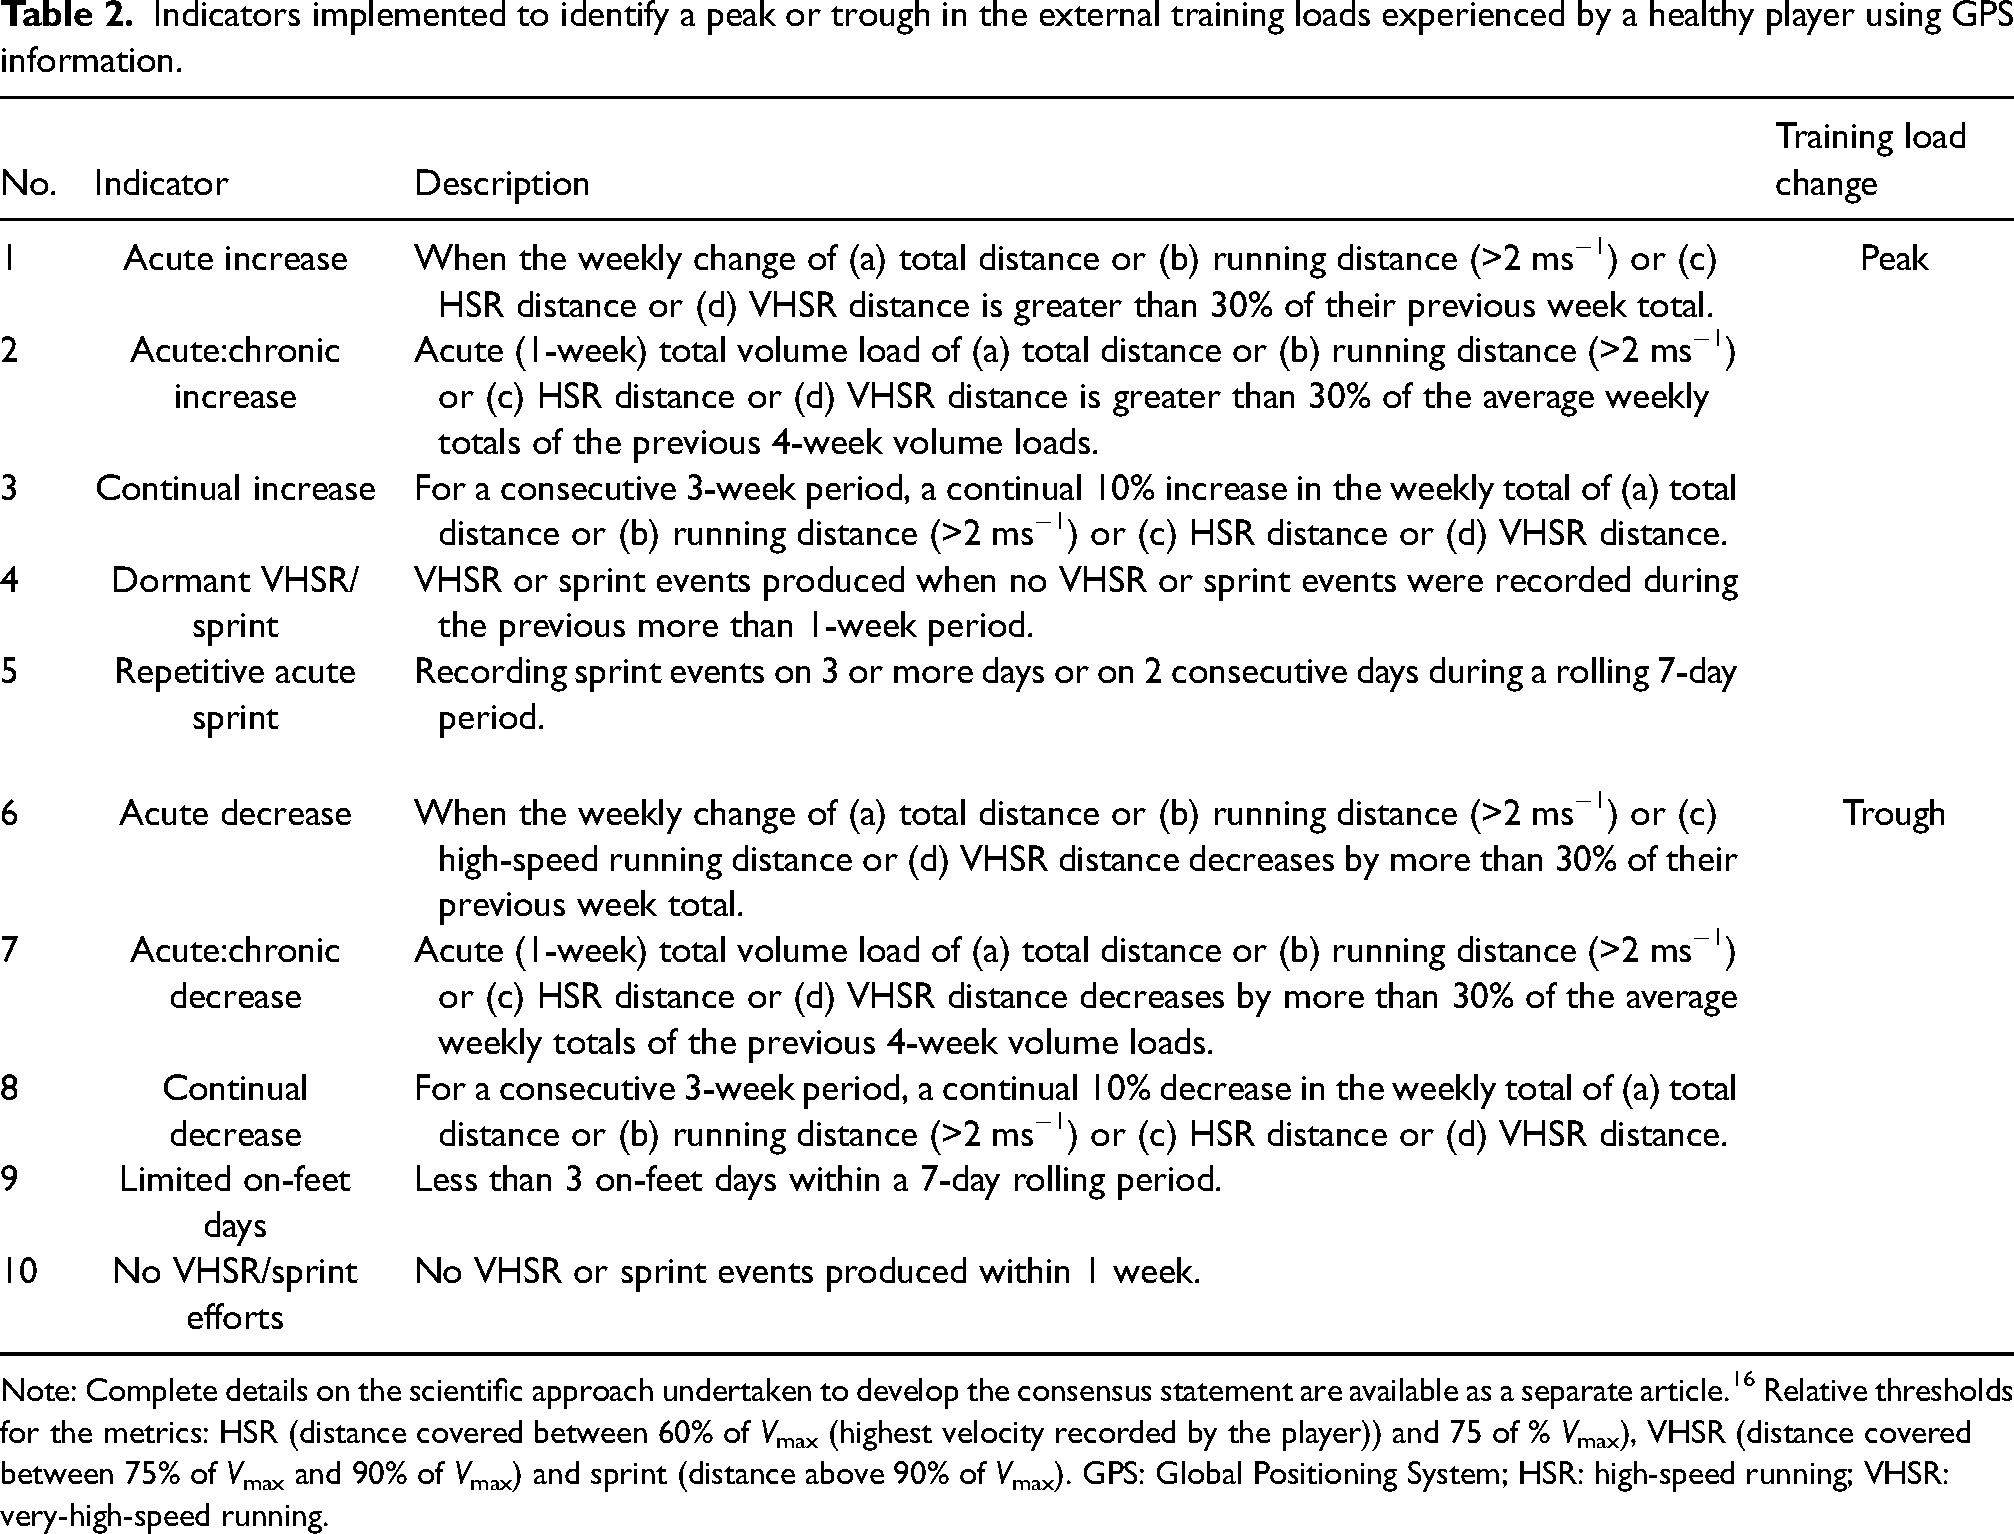
Note: Complete details on the scientific approach undertaken to develop the consensus statement are available as a separate article. 16 Relative thresholds for the metrics: HSR (distance covered between 60% of Vmax (highest velocity recorded by the player)) and 75 of % Vmax), VHSR (distance covered between 75% of Vmax and 90% of Vmax) and sprint (distance above 90% of Vmax). GPS: Global Positioning System; HSR: high-speed running; VHSR: very-high-speed running.
Initially, the 10 indicators in the subjective standard (Table 2) were implemented into the already-existing GPS information visualisation Power BI interface (i.e. dashboard) at the club. As per previous guidelines, 18 this was achieved by using colour-coding schema and labelling techniques. Moreover, the guidelines by Cole and Altman, 19 which specify the use of natural logarithms for dealing with percentage differences, were used in the comparative percentage-based indicators to ensure that the comparisons were symmetric and additive. Figure 2 illustrates the high-level overview of how the latter objective was achieved by using the R programming language for a single indicator in the consensus. The same flow was repeated for all indicators.
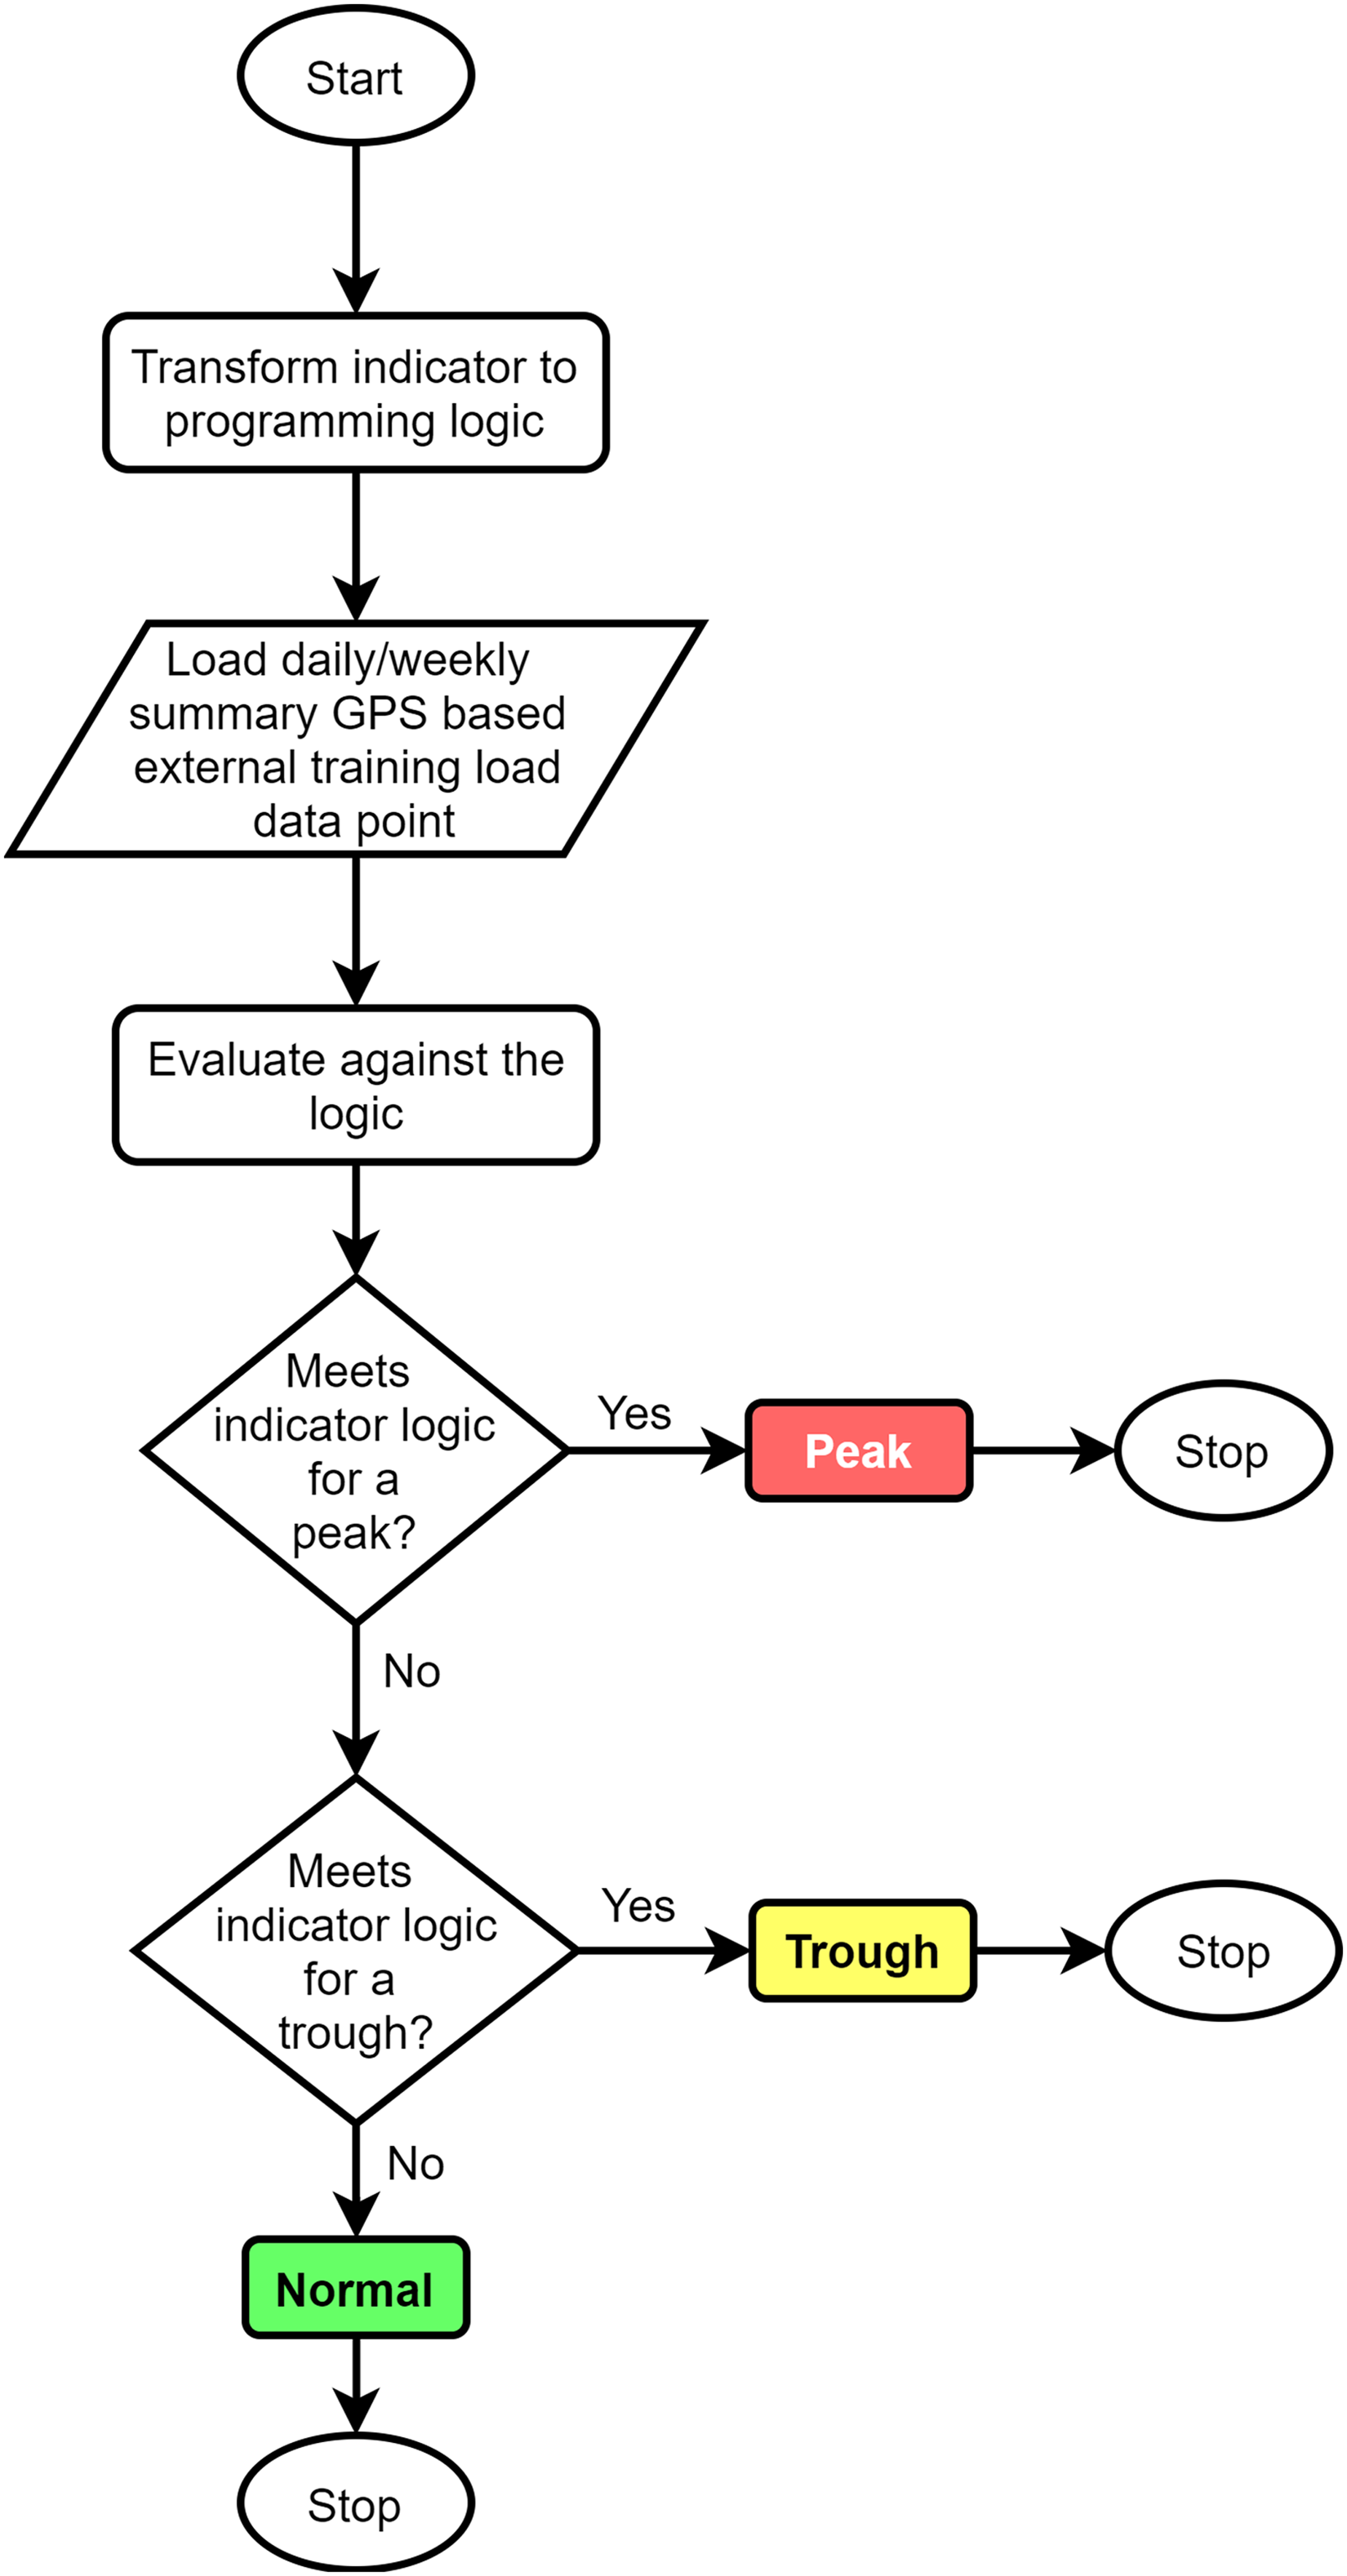
High-level overview of the algorithm flow for categorising daily/weekly GPS information as a peak, trough or normal condition based on a single indicator in the subjective standard. GPS: Global Positioning System.
Figure 3 illustrates the GPS information visualisation interface before and after implementing the subjective standard. In reference to Figure 3(b), the utilised colour-coding scheme clearly depicts instances of peaks (red), troughs (amber) and normal (green) scenarios in player external training loads in relation to each metric. Moreover, additional functionalities like ‘tooltips’ were used to indicate the exact consensus indicator through which the resultant peak/trough was identified. For example, the running distance load of player 1 in week 11 was categorised as a peak through the ‘acute increase’ and ‘acute:chronic increase’ indicators defined in the consensus statement (refer to Table 2). The relevant consensus indicators were also provided as a reference to the user through a separate page in the interface. Additionally, when implementing the standard, special focus was given to minimising the number of changes performed on the dashboard. That was mainly to control any biases affecting the agreement between practitioners due to significant changes in system usability.
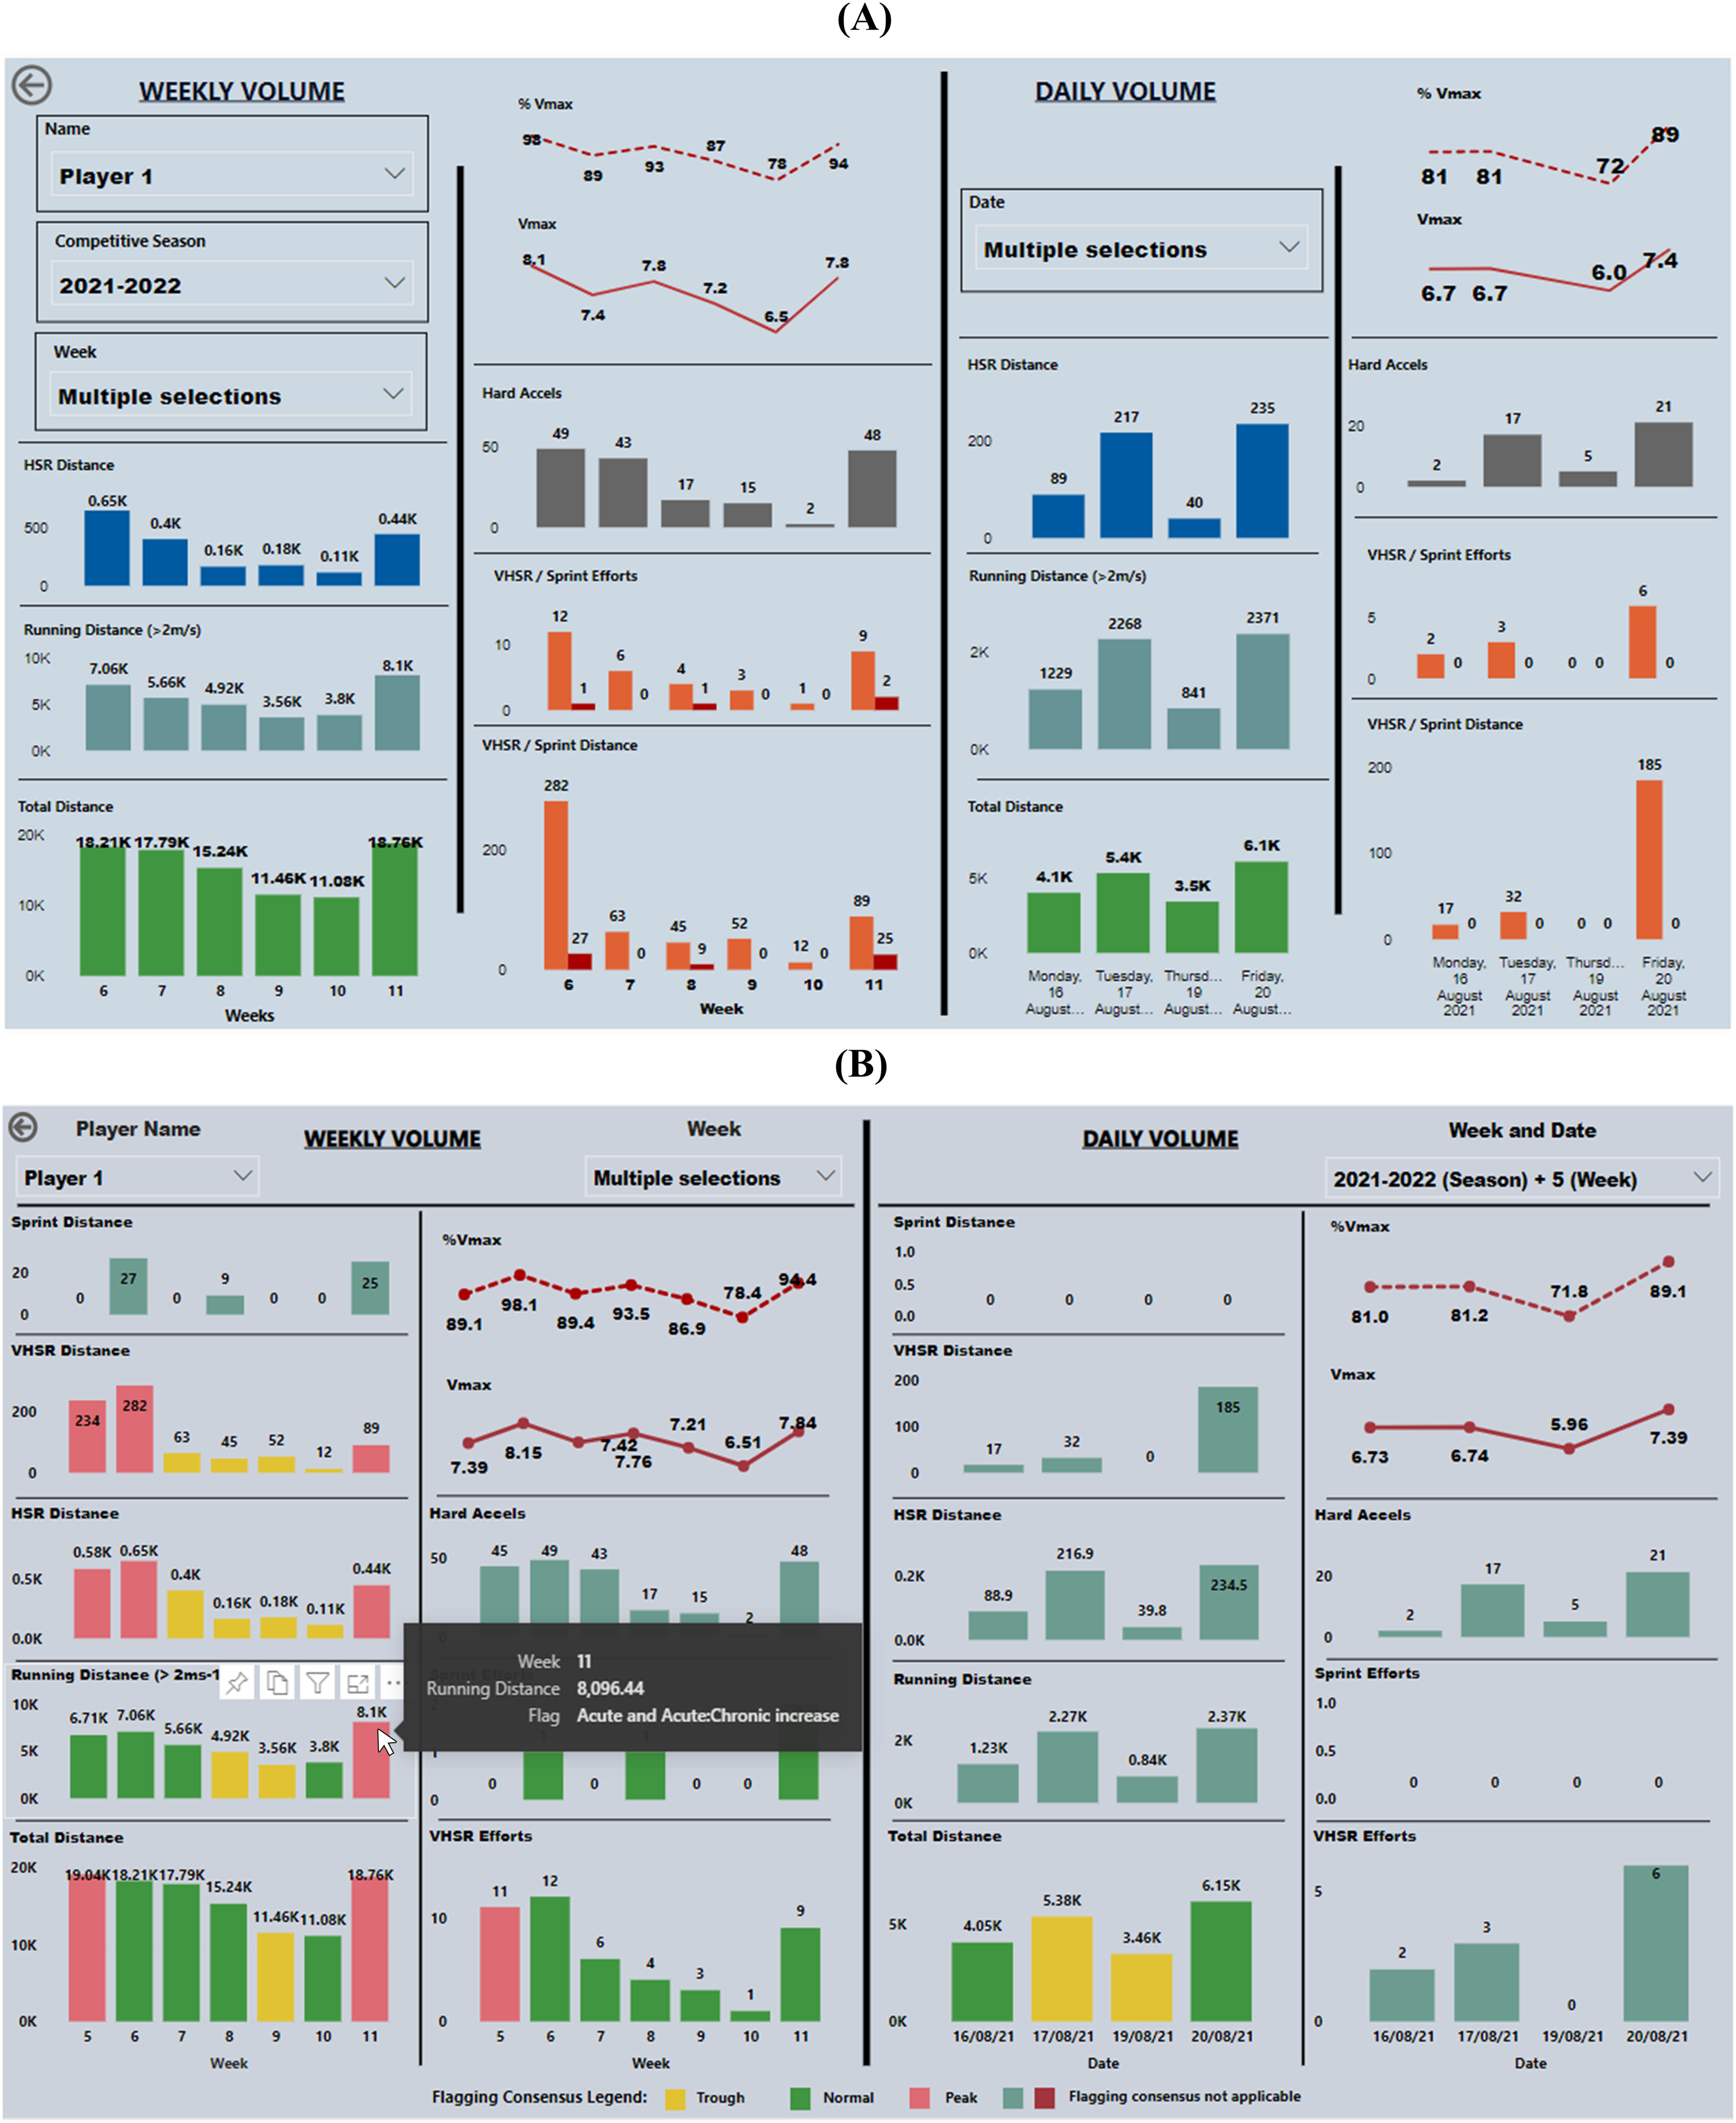
GPS information visualisation (a) before and (b) after implementing the subjective standard using a colour-coding scheme and labelling techniques. GPS: Global Positioning System.
Choice of training load instances for repeated ratings
To choose which instances to rate, we first evaluated GPS data points for each metric of all selected players across the 33 weeks and categorised them as peaks, troughs or normal exposures based on the consensus statement. From these, we randomly selected 22 instances of player external training load exposures obtained from GPS information (refer to the Sample sizes section specified later for the justification) among the three categories (i.e. eight peaks and seven each for troughs and normal exposures). The same 22 instances were repeated across the four time points for the ratings. As a rule, more than two events from the same player were not considered (this was to ensure that all 14 players had at least a single event to be rated). Moreover, the items were selected to represent the GPS metrics used by HPU staff for decision-making. Those selected instances were as follows: total distance, running distance, high-speed running (HSR) distance, very-high-speed running (VHSR) distance, number of VHSR efforts and number of sprint efforts. When rating, the order of all items was randomised for a rater at each time point. Table 3 provides an illustration of 5/22 selected events. When rating, the practitioners were specifically requested to articulate their decision by only factoring the GPS information available to them in the interface (i.e. not to consider other factors like player injury history, age, etc.). For instance, considering the second row, the following question was posed to the practitioner: ‘based on the GPS information currently available in the dashboard, at the end of week 9 of the current season, would you rate if player PL2 has experienced a peak, trough or normal running distance load?’
List of 5/22 events rated by the HPU members.
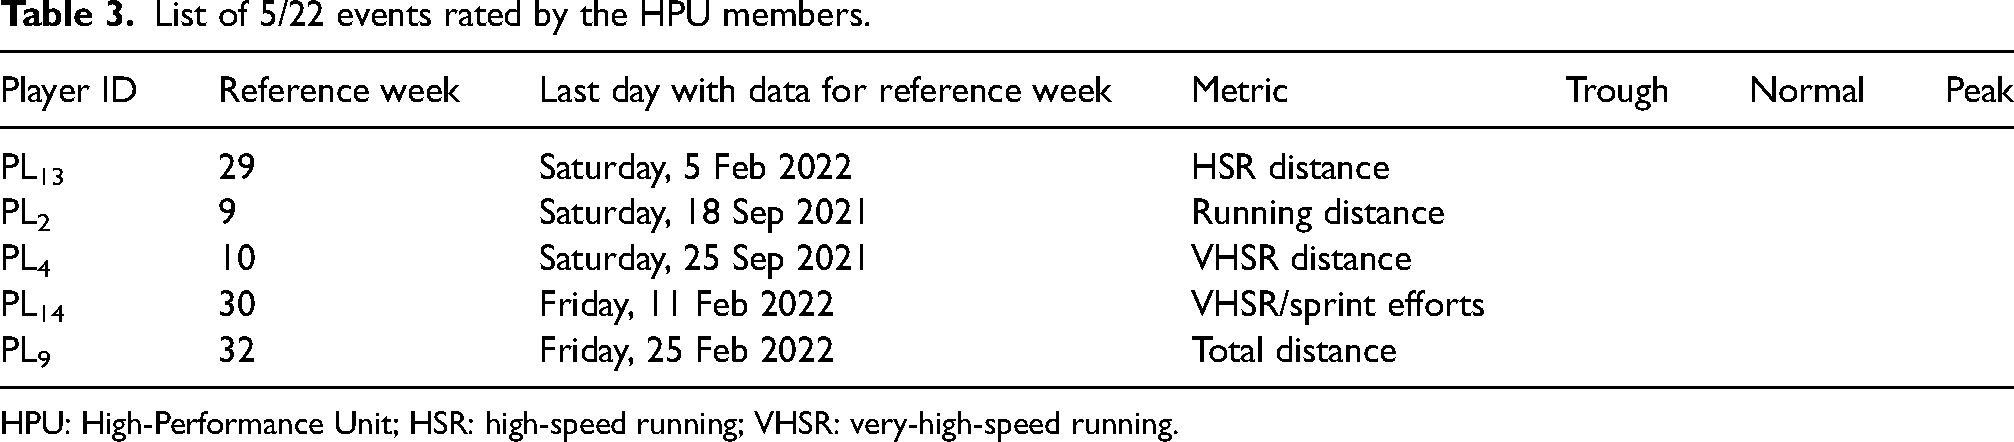
HPU: High-Performance Unit; HSR: high-speed running; VHSR: very-high-speed running.
Usability assessments
Another factor that may have changed from the pre-post-implementation of the subjective standard that could potentially impact a practitioner's judgement was the usability of the dashboard. Specifically, the colour-coding schema and labelling techniques used to illustrate the conditions of peaks, troughs and normal conditions within the interface can alter its usability. Subsequently, those changes in usability can bias the evidence articulated by an individual. Hence, to quantitatively assess the usability of the interface, the System Usability Scale (SUS) 20 was administered to all HPU members (n = 11) at each of the four time points. Moreover, for the usability assessment, feedback from all HPU practitioners was obtained (unlike just five for the repeated ratings) since the SUS questionnaire was a quick (around 5 minutes per individual) and efficient method to collect system usability data.4,20
Statistical methods
Inter-rater and intra-rater agreement
The impact of the subjective standard on the considered collective decision was evaluated from the change in agreement between the five HPU members across the pre-post time points. Since there were more than two raters and as the study was fully crossed, we used Light's Kappa (
Bootstrapped hypothesis testing
To evaluate if the inter-rater agreement between two time points was statistically different (i.e. H0:
Linear mixed model for usability assessment
The repeated measures of SUS scores from the same participants (n = 11) at the four time points resulted in dependency between the measurements. Therefore, a linear mixed model was used to assess the change in SUS scores across the considered pre-post time points. For the model, a fixed effect was defined by the four pre-post time points and variations across the individuals were defined as a random effect (by-participant intercept only). The effectiveness of the model was assessed based on a likelihood ratio test against the null model using the ‘afex’ package in R. 31
Sample sizes
A priori sample size calculation based on the ‘kappaSize’ package in R 32 illustrated that 35 instances of ratings were required to test a hypothesis of inter-rater agreement changing from an initial level of 0.41 (lower threshold of moderate agreement) to 0.61 (lower threshold of substantial agreement) with an α = 0.05 and 80% power. However, our sample size was restricted by resource constraints (i.e. time) within the considered applied environment. 33 Since the study was conducted within the work schedule of a Gallagher Premiership season, data collection from a staff member had to be managed within a time limitation of 30 minutes per each individual for each round of rating, leading to 2 hours of overall contribution to the study. This time limitation was defined by the management at the club. Importantly, the current study is only the second part of a holistic study. As specified previously, the first part 16 focused on scientifically developing the relevant consensus statement with the participation of the HPU members. Subsequently, each HPU member selected for the current study had already allocated close to 5 hours of their work time within a Gallagher Premiership season to contribute to the first part of the study. Therefore, only 2 hours per individual was allocated for this study by the management. Resultantly, author JR initially performed a demonstration with author GR and determined that only 22 items could be rated within 30 minutes. Such limitations in study sample sizes due to resource constraints have been acknowledged by researchers like Lakens. 33
Results
Reliability of agreement (repeated measures)
Inter-rater agreement
Table 4 highlights the inter-rater agreement between the five HPU members (including the 95% CIs) during the four rounds of repeated ratings. Pre-standard reliability of agreement between the five stakeholders was identified as ‘moderate’. Following the immediate introduction of the subjective standard (after 2 weeks) into the information visualisation interface, the agreement between the decision-makers increased to ‘substantial’. With further lag time, there was a ‘near perfect’ inter-rater agreement between the five HPU members for the considered decision. The normality of the bootstrapped samples extracted to calculate the 95% CIs is provided in Supplementary Image 1.
Intra-rater agreement
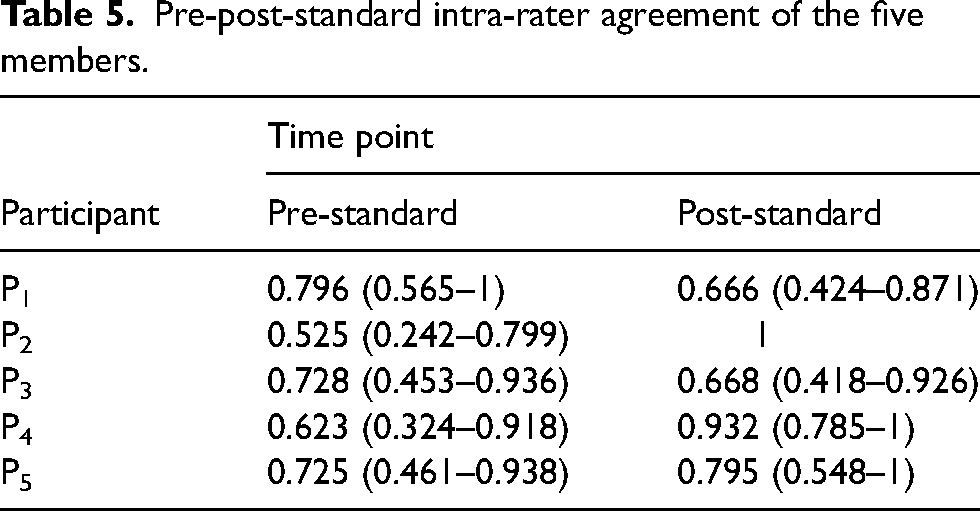
As highlighted in Table 5, the intra-rater agreement of Participants 2, 4 and 5 increased following the introduction of the subjective standard. Specifically, Participant 2 had the largest increase in agreement among all the five members, with a change from ‘moderate’ to ‘perfect’ agreement. For Participant 4, it increased from a ‘substantial’ level to ‘almost perfect’ agreement post-standard. Although the numerical values of intra-rater agreement of Participant 5 increased from the baseline, the interpretation of Kappa values depicted that it did not change from a ‘substantial’ level. Interestingly, the intra-rater agreement of Participants 1 and 3 decreased post-intervention, with the former participant showing the biggest decrease in agreement (0.13). However, even for the two instances with a reduction in intra-rater scores, the interpretation of the relevant figures demonstrated that their agreement remained within a ‘substantial’ level following the implementation of the standard.
Pre-post-standard inter-rater agreement between the five members.
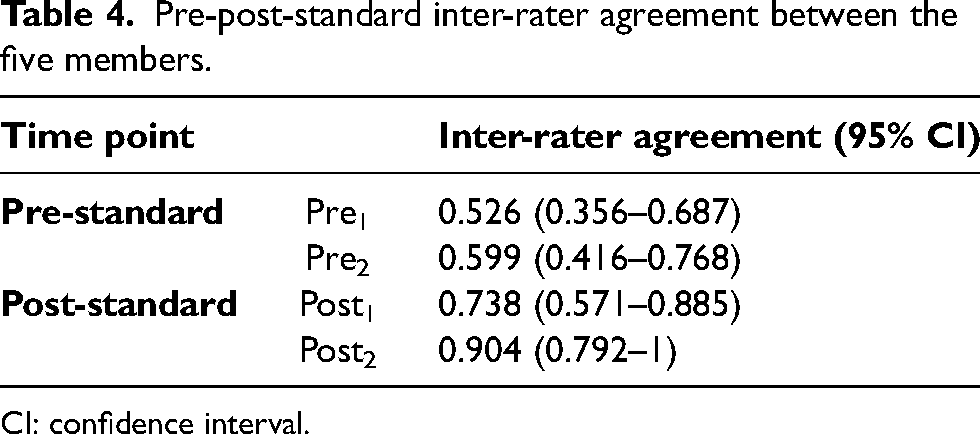
CI: confidence interval.
Pre-post-standard intra-rater agreement of the five members.
Change in agreement
Figure 4 presents the 99% CIs (due to Bonferroni correction) of the bootstrapped Kappa differences between the selected time points (refer to Supplementary Image 2 for the normality of the Kappa differences). The CIs of Pre1 to Pre2, Pre2 to Post1 and Post1 to Post2 differences crossed 0; thus, in those cases, the null could not be rejected. For all other comparisons, including Pre2 to Post2 comparison, the null was rejected (since the CI differences did not include 0) to highlight that the reliability of agreement was statically different between those time points.
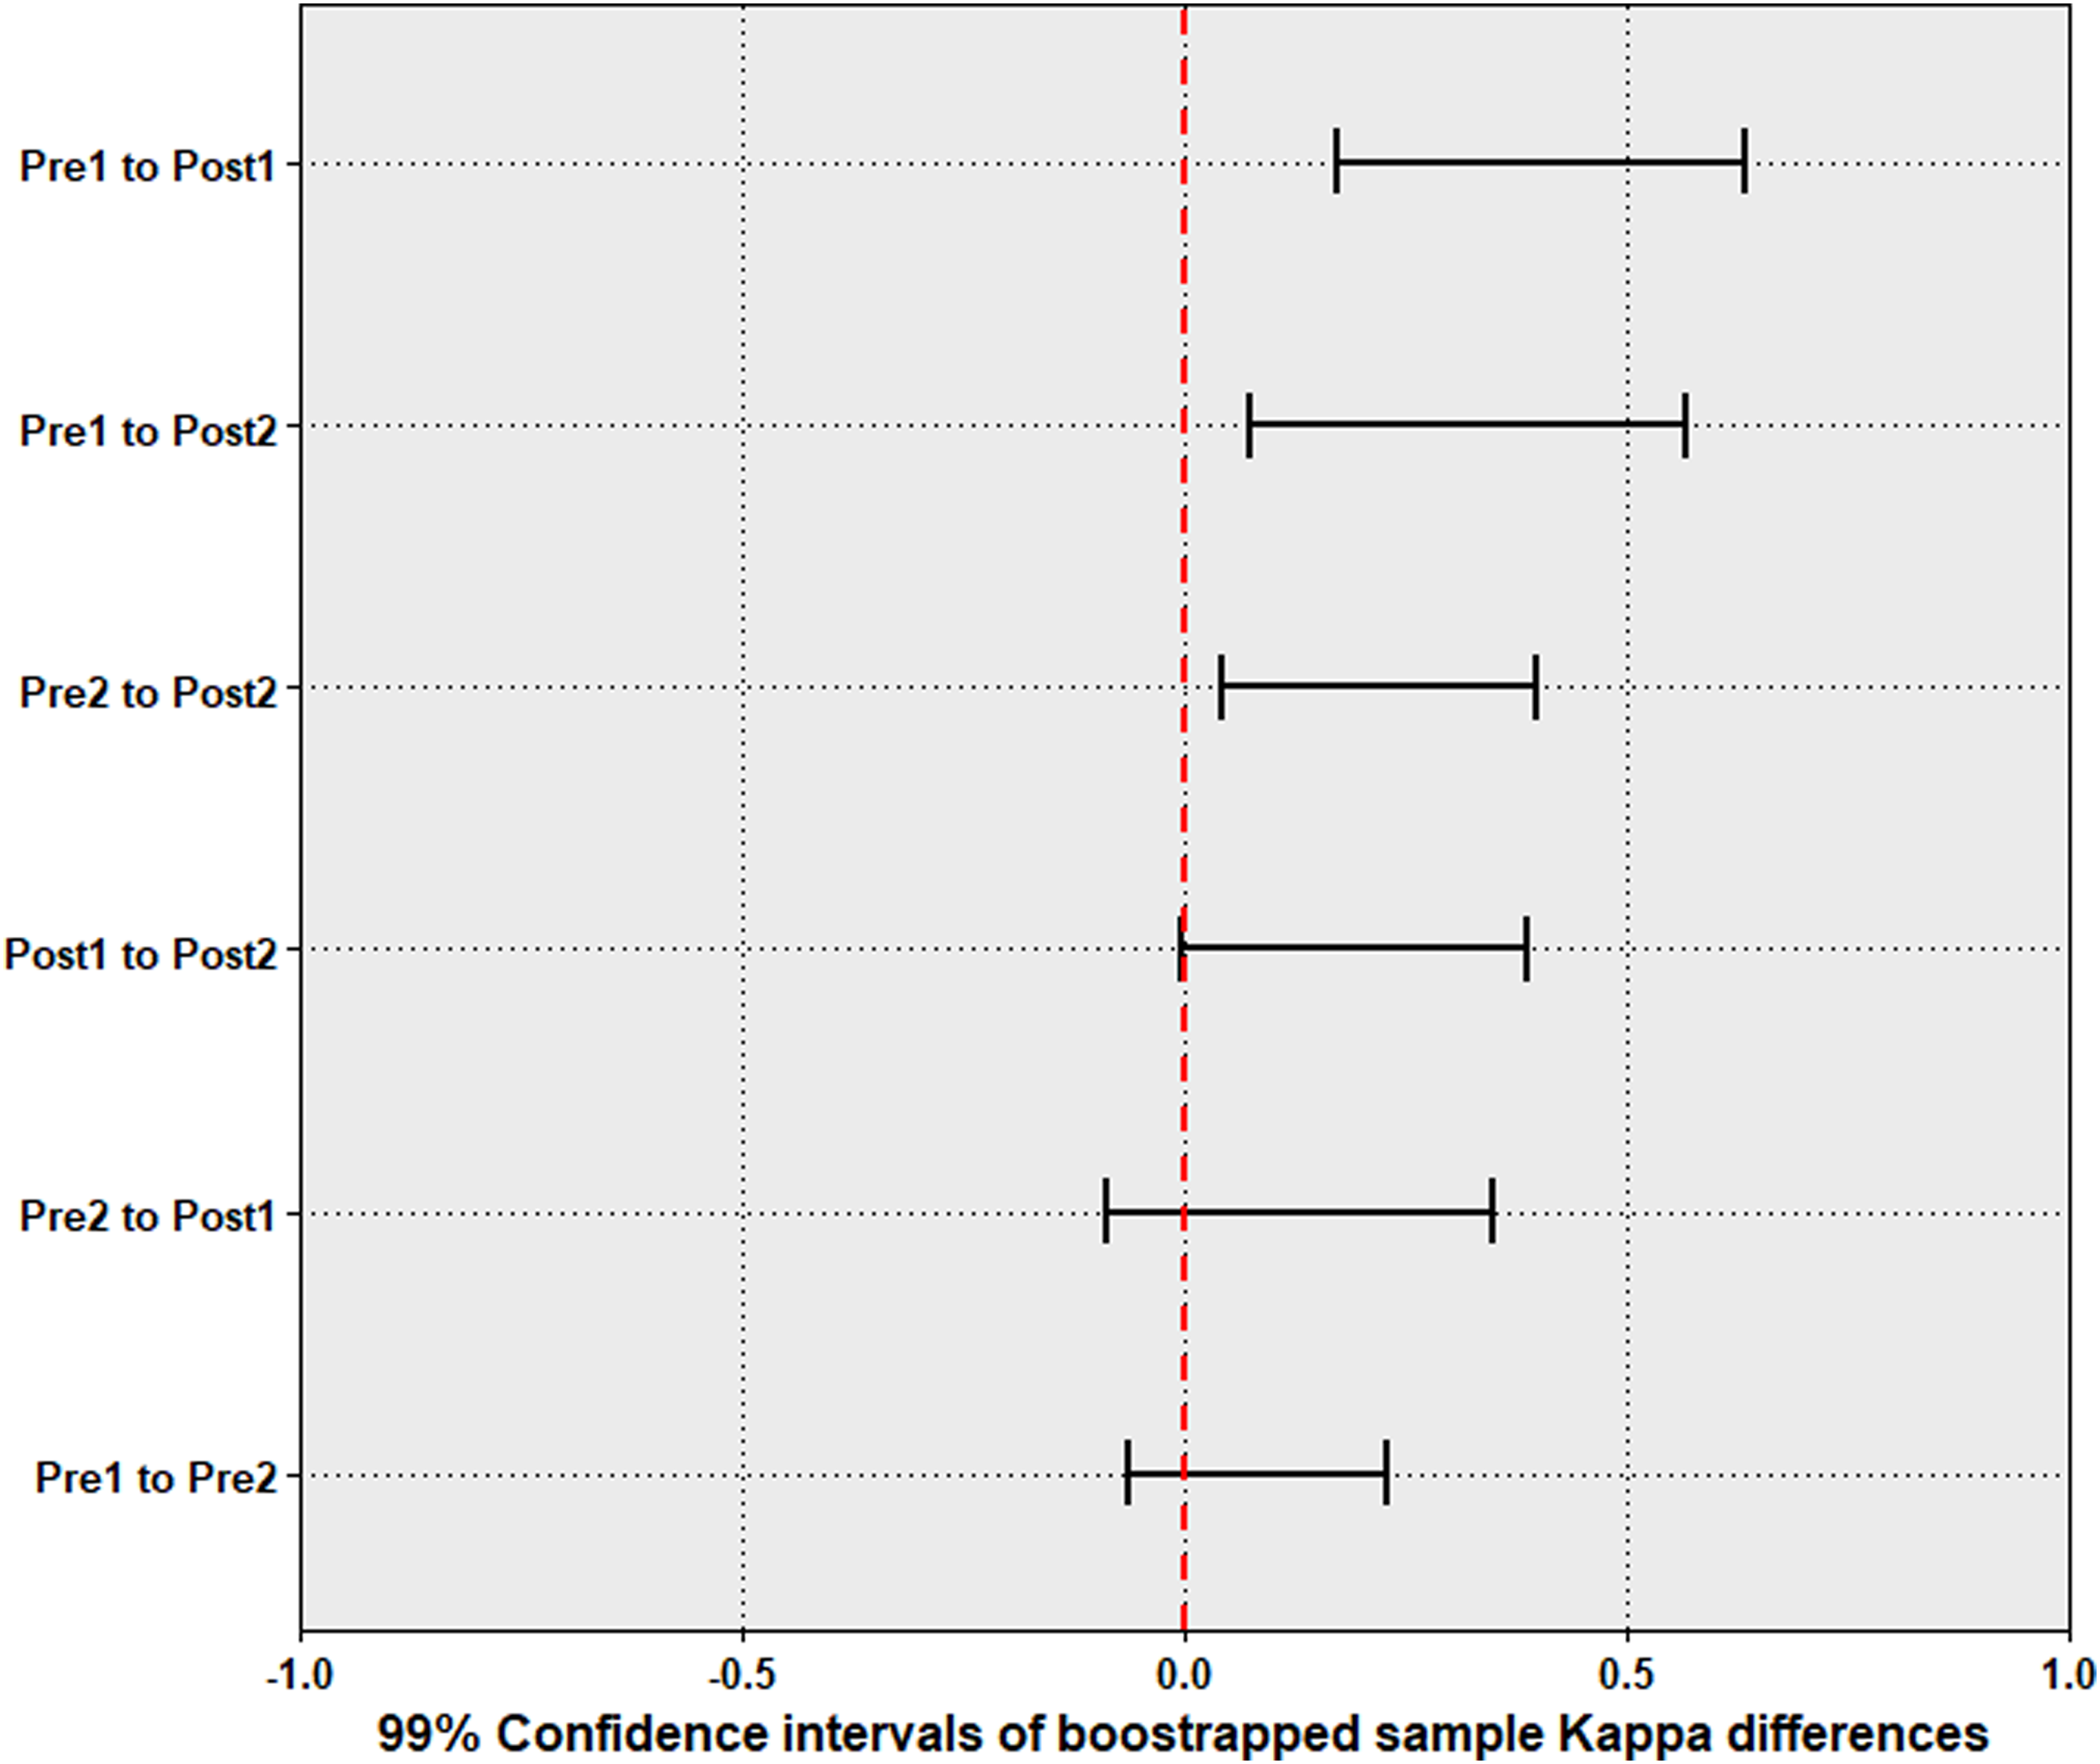
The 99% CIs of the differences in agreement between time points (formulated based on the bootstrapped samples). CIs: confidence intervals.
Pre-post-standard usability assessment of the dashboard
Figure 5 illustrates the difference (and residual) in the system usability score for the information visualisation interface pre-post-implementation of the standard. The likelihood ratio test results demonstrated that the usability of the interface was a better fit for the data than a null model, χ2(3) = 8.85, p = 0.03. The pre-standard usability of the dashboard was rated lower at the Pre2 time point than the Pre1 (
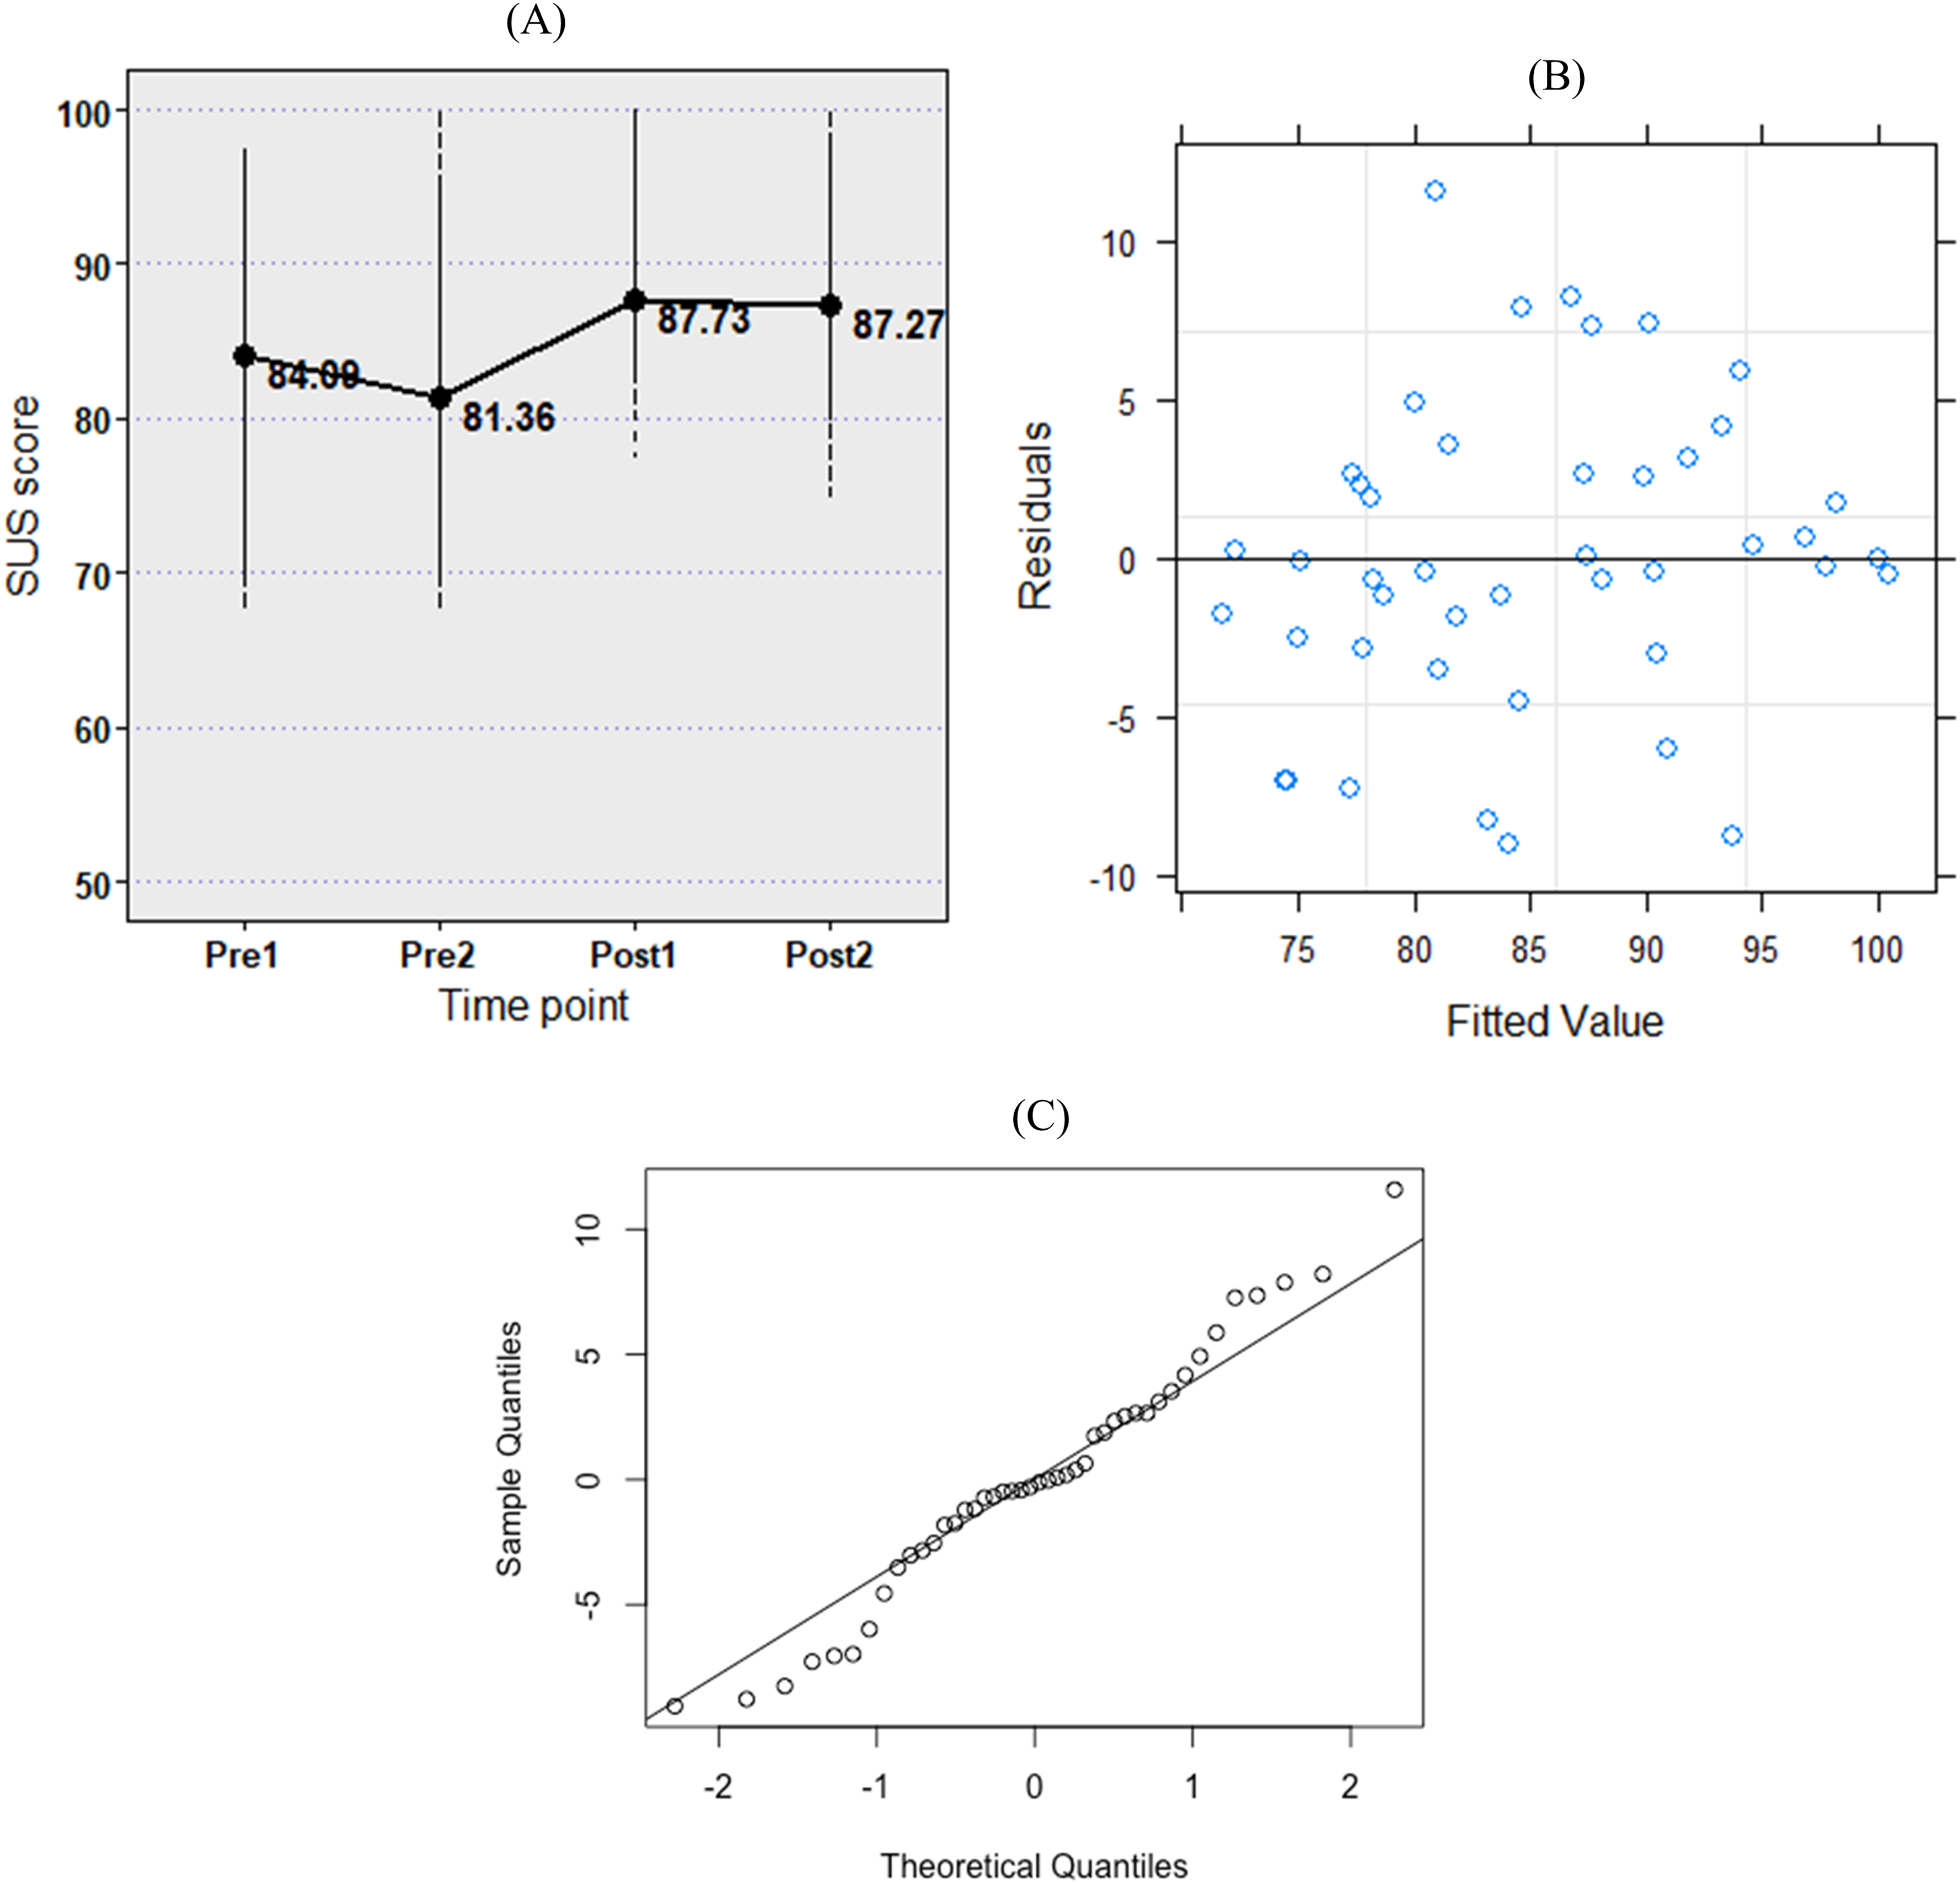
(a) Change in the usability of the information visualisation interface at the pre-post-standard implementation time points. (b) Residuals of the fitted model. (c) Normality of the residuals (Q-Q plot).
Discussion
This applied case study aimed to analyse the impact of a subjective standard on the reliability of agreement between practitioners when formulating a decision on external training load management of players within a professional rugby union environment. Repeated ratings of 22 instances in player external training loads (based on GPS information articulated from a dashboard) illustrated that there was less than a 5% chance that the mean inter-rater agreement between the five practitioners could be equal at the two furthest time points before (i.e. Pre2) and after (i.e. Post2) implementing the subjective standard. Specifically, the reliability of agreement between the individuals increased from a ‘moderate’ pre-standard level (Pre2: 0.599 (0.416–0.768)) to ‘almost perfect’ post-standard agreement (Post2: 0.904 (0.792–1)).
Pre-post-standard agreement
Although there was an immediate increase in the inter-rater agreement once the standard was implemented (Pre2 to Post1), the concurrent increase in system usability by 6.37 SUS scores between those two time points (Figure 5(a)) makes it challenging to interpret whether the change in agreement was only due to the standard. Additionally, the hypothesis test for the latter difference (Pre2 to Post1 in Figure 4) does not also provide enough evidence to justify that the agreement between the practitioners at those two time points was statistically different. The slight decrease in SUS scores between Post1 and Post2 time points (0.46) highlighted that the system usability did not influence the resultant increase in practitioner agreement (0.166) from the Post1 stage to the Post2 stage, potentially illustrating that the change was truly due to the impact of the standard on decision-making. The findings also highlight that approximately 4 weeks of lag time may be required to assess the impact of a digital intervention on decision-making. However, since the presented results are from a single case study environment, we do not think that the results presented in this study can be generalised. Hence, we encourage other researchers to report their findings from similar research.
In the pre-state, 4/5 members (P1, P3, P4 and P5) having ‘substantial’ intra-rater agreement for the considered decision highlighted that participants were somewhat consistent in their decision-making (even without a standard). This possibly signified that each individual adhered to an independent criterion when identifying instances of player external training load peaks/troughs from GPS information. The reduction in the post-standard intra-rater agreement of P1 and P3 practitioners was mainly due to their reduced agreement with the standard immediately after its implementation. For instance, P1 and P3 had an agreement of 0.688 with the standard at the Post1 time point, which increased to ‘almost perfect’ levels of agreement at the Post2 stage (0.938 and 0.875, respectively). However, a discussion with Participant 1 highlighted that his reduced agreement immediately after the standard was due to a usability issue in the interface. Specifically, the change in colours used within the visuals had impacted his decision-making. Consequently, although the SUS questionnaire acted as a quick and easy summative usability assessment technique, it could not capture more specific usability issues in the system. Hence, formative usability assessment methods that can identify core usability issues in the interface may be more applicable to further enhance the scientific rigour of similar studies in the future.
Reliability in decision-making due to a subjective standard
Overall, the results indicated that the implementation of the subjective standard enhanced the reliability of agreement between practitioners when generating evidence from the same information source. From an applied viewpoint, this specifies that the standard was capable of organising practitioner judgements to reduce noise associated with the considered player management decision. While it may be impractical to determine the implications of the standard on the accuracy of the considered decision (i.e. because accuracy is case specific and may only be assessed in comparison to the specific goals of the organisation), the results signify that subjective standards like the one utilised in the current study could improve the precision of player management decisions (from improvements to the reliability of agreement). We believe this illustrates an important step to optimise player management decision-making processes. First, it allows consistency for a decision that is repeated at specific intervals (e.g. like the training load management decision in the current study occurring on each training day). Second, the resultant variability observed in player training loads after improving the precision of practitioner judgements could indicate true fluctuation in his/her exposure to load, hence enabling a practitioner to manage true training load variability rather than potential noise in the decision-making process.
Strengths and limitations of the study
The repeated measures with four rounds of ratings provided a robust study design to evaluate the impact of the subjective standard on decision-making by mitigating potential Type II errors. For instance, the presence of the Post2 time point rating helped to clearly signify the impact of the standard on practitioner agreement that was not influenced by changes in system usability. Importantly, although the reduction in sample size (n = 22) due to resource constraints (i.e. time allocation per practitioner) from the priori sample size calculation (n = 35) may depict an influence on the power of this study, potential Type II errors posed on the inferences formulated pertaining to the changes in the inter-rater agreement between Pre2 and Post2 (this is the main difference considered to articulate the final judgement) time points were minimal. This is because the a priori sample size (n = 35) was obtained to detect a Kappa score changing from 0.41 to 0.61. However, the actual effect observed for the change in inter-rater agreement from Pre2 (0.599) to Post2 (0.904) time points was much greater than the effect set in the priori sample size. Moreover, repeating the sample size calculation for the actual change illustrated that at least 14 events were necessary to detect the observed effect in inter-rater agreement at 80% power. Subsequently, since the actual sample size was greater (n = 22) than the required minimal number of events (n = 14), the validity of this test (to detect the change in agreement between Pre2 and Post2 time points) does not appear to be hindered. Interestingly, such prior limitations can be expected in current contexts (mainly due to the repercussions of the COVID-19 pandemic) when conducting applied research in resource-constrained environments like professional rugby union clubs. On a positive note, the execution of the study during an active Gallagher Premiership season helped to extract true practitioner judgements pertaining to player management from an applied perspective.
The subjective standard considered in the current study was developed in relation to the considered case study environment. Hence, the practitioners themselves may have certain individual biases to the case-specific subjective standard during decision-making. Moreover, since the study was designed to extract individual decisions and evaluate how they relate together through a statistical method, it could not examine the effect of other collective decision-making dynamics like the interactions between individuals that may influence the final outcome of a collective decision. Finally, although a consensus statement was utilised as a subjective standard in the current study, objective standards defined as KPIs using mathematical and statistical methods are equally relevant for evidence generation. Hence, future studies can also consider such objective benchmarks and use the current study design to evaluate how they impact practitioner decision-making.
Conclusion
This case study with a repeated-measures design evaluated how a subjective standard can impact the agreement between practitioners when articulating a player management decision (evidence on peaks/troughs in the external training loads experienced by rugby union players) within a professional rugby union club. The findings indicate that the subjective standard improved the inter-rater agreement between the practitioners, in the considered environment, for the selected decision, while either maintaining or enhancing the decision consistency of the individuals (intra-rater agreement). Finally, there is further evidence to suggest that practitioners may require approximately 4 weeks of lag time to fully adopt a standard that is integrated into their decision-making processes through digitalisation techniques (i.e. digital dashboards implemented using business intelligence tools to visualise player data) within the considered professional rugby union environment.
Supplemental Material
sj-tif-1-spo-10.1177_17479541231188065 - Supplemental material for Evaluating the impact of a digitally implemented subjective standard on professional rugby union player management decision-making
Supplemental material, sj-tif-1-spo-10.1177_17479541231188065 for Evaluating the impact of a digitally implemented subjective standard on professional rugby union player management decision-making by Jayamini Ranaweera, Dan Weaving, Marco Zanin and Gregory Roe in International Journal of Sports Science & Coaching
Supplemental Material
sj-tif-2-spo-10.1177_17479541231188065 - Supplemental material for Evaluating the impact of a digitally implemented subjective standard on professional rugby union player management decision-making
Supplemental material, sj-tif-2-spo-10.1177_17479541231188065 for Evaluating the impact of a digitally implemented subjective standard on professional rugby union player management decision-making by Jayamini Ranaweera, Dan Weaving, Marco Zanin and Gregory Roe in International Journal of Sports Science & Coaching
Supplemental Material
sj-docx-3-spo-10.1177_17479541231188065 - Supplemental material for Evaluating the impact of a digitally implemented subjective standard on professional rugby union player management decision-making
Supplemental material, sj-docx-3-spo-10.1177_17479541231188065 for Evaluating the impact of a digitally implemented subjective standard on professional rugby union player management decision-making by Jayamini Ranaweera, Dan Weaving, Marco Zanin and Gregory Roe in International Journal of Sports Science & Coaching
Footnotes
Declaration of Conflicting Interests
The author(s) declared no potential conflicts of interest with respect to the research, authorship and/or publication of this article.
Funding
The author(s) received no financial support for the research, authorship and/or publication of this article.
Supplemental Material
Supplemental material for this article is available online.
References
Supplementary Material
Please find the following supplemental material available below.
For Open Access articles published under a Creative Commons License, all supplemental material carries the same license as the article it is associated with.
For non-Open Access articles published, all supplemental material carries a non-exclusive license, and permission requests for re-use of supplemental material or any part of supplemental material shall be sent directly to the copyright owner as specified in the copyright notice associated with the article.