
Abstract
The effect of compression tights on running economy is unclear. The purpose of this investigation was to assess the influence of compression tights on economy. Following an incremental test to exhaustion to determine aerobic capacity (V̇O2max) and peak running speed (vV̇O2max), twenty-six moderately endurance-trained males (28 ± 7 years; 76.1 ± 8.4 kg; V̇O2max = 54.7 ± 4.8 mL·kg−1·min−1) were allocated to either a 60% (n = 8), 62.5% (n = 9) or 65% vV̇O2max group (n = 9) using block randomisation. Participants ran for 15 min at the allocated vV̇O2max with compression tights and a non-compression control condition in a randomised, counter-balanced order, separated by seven days. Oxygen consumption (V̇O2) and expired carbon dioxide (V̇CO2) was measured to determine economy as caloric unit cost. No difference was observed between conditions for the 60% and 62.5% vV̇O2max groups, however economy was improved with compression at 65% vV̇O2max (P < 0.01). Combined analysis of all participants revealed ΔRE (Δ = control − compression) correlated with relative aerobic capacity (%V̇O2max) (r = 0.50, P < 0.01) but not running speed (r = 0.04, P < 0.84). These data suggest that compression tights influence economy at 65% vV̇O2max or at relative exercise intensities of approximately 75–85%V̇O2max.
Introduction
Running economy (RE) is defined as the metabolic cost of travelling a given distance at submaximal running speeds and is a useful indicator of endurance performance. 1 At steady state running speed, runners with good economy utilize less oxygen than runners with poor economy. 2 Marginal improvements in economy improve performance of elite 3 and sub-elite runners, 4 such that a 5% improvement in RE may translate into a 3.8% improvement in distance running performance, 5 driving interest in a diversity of interventions aiming to reduce energy cost of running. 4 RE is a multifactorial outcome and must take into account changes in metabolic, cardiopulmonary, biomechanical and neuromuscular factors. 2
Physiological responses to compression clothing originate from mechanical pressure applied to the underlying tissue and the stabilizing support offered by the garment. Lower body compression is reported to alter biomechanical variables during submaximal running and subsequently contribute to improvements in RE, 6 possibly due to improved proprioception 7 and lower levels of soft tissue vibration and muscle activation. 8
Studies investigating compression applied by below-knee garments (stockings, calf socks) show little demonstratable effect on RE 6 or performance. 9 However, unlike stockings, full-length tights compress the large musculature of the upper-leg as well as the lower-leg. Compression applied to the upper-leg and hip region produce smaller knee flexion and valgus angles during drop-landing 10 and a reduction in muscle oscillation during submaximal running. 11 Compression of the full leg-length offers a logical benefit to runners when compared with stockings, such that compression applied to the whole knee, compared with below knee compression, improves joint position sense 12 and may subsequently contribute toward more efficient running gait. However, the effect of compression tights on RE are limited to just three investigations.8,13,14 Bringard et al., assessed the effects of wearing compression tights on economy of six trained athletes running at 10, 12 14 or 16 km·h−1. Compression improved economy when running at 12 km·h−1 only. 13 Dascombe et al., found no differences in the economy of eleven well-trained runners at 10, 12, 14, 16 or 18 km·h−1. However, compression tights impaired economy at 8 km·h−1. 14 Broach et al., also report no differences in the economy of fourteen recreationally active participants at 8, 10 or 12 km·h−1 wearing three commercially available compression tights. 8
One reason so few changes in economy are reported may be due to a lack of measurement sensitivity. The aforementioned studies report economy as the oxygen cost of running as per unit distance (mL O2 kg−1·m−1)13,14 or simply oxygen consumption (l min−1). 8 However, oxygen cost is less sensitive to changes in relative speed1,15 compared with energy cost reported as the caloric unit cost (kcal·kg−1·km−1). Caloric unit cost accounts for substrate dependent variations in energy equivalent of a volume of oxygen, 15 thereby adjusting for different substrate use at submaximal speeds, leading to more accurate calculations of the rate of aerobic energy expended during exercise. 16 Better sensitivity makes it a better choice when investigating interventions known to cause small changes in economy. 6 Furthermore, exercise prescribed as absolute external workload (i.e., 10 km·h−1) fails to account for interindividual variation in internal cardiovascular and metabolic stress. 17 Individualising exercise prescription according to relative exercise intensity accounts for differences in physiological and functional capacity. 18 Investigating the response to an intervention based upon relative exercise intensity allows for the interpretation of other exercise-related responses with more sensitivity. Despite this, previous attempts to investigate the influence of compression tights on running performance only include absolute external workloads.
The aim of the present study was to examine whether full leg-length compression tights improve RE at 60%, 62.5% and 65% of peak running speed and explore changes in RE in relation to relative exercise intensity and absolute running speed.
Methods
Participants
Ethical approval was received from the University of Essex ethical committee. Participants provided written informed consent in accordance with the Declaration of Helsinki. An a priori sample size estimation was performed based on previously observed differences in economy with and without compression tights at 12 km·h−1. 13 The effect size in this study was 1.25. With an alpha = .05 and power = 0.85, the estimated sample size within each vV̇O2max group (60%, 62.5% and 65% vV̇O2max group) needed to show a statistically significant effect is approximately n = 8 in a matched-pairs design. Two additional participants were recruited to account for potential dropouts during the study. Therefore, a total of twenty-six moderately endurance-trained males provided written informed consent during the initial visit.
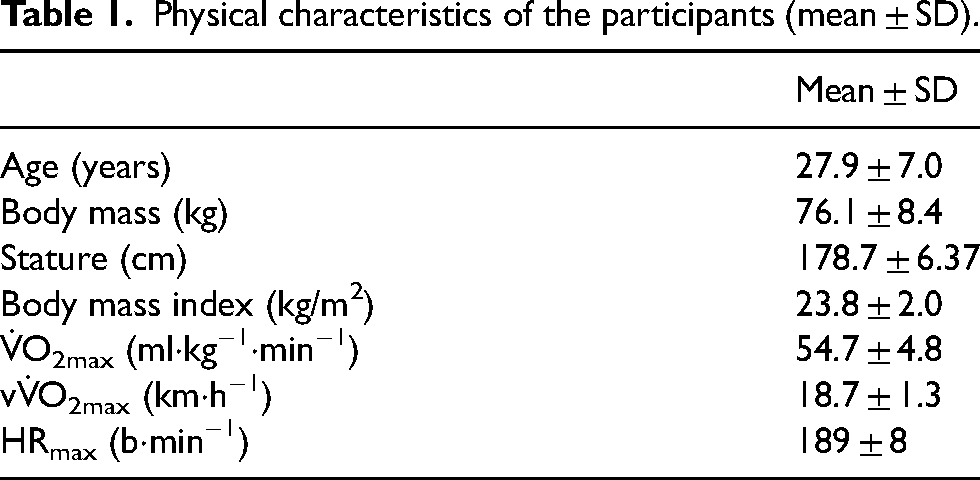
The mean characteristics of the cohort obtained during the initial visit are provided in Table 1. All participants were moderately endurance-trained, covering approximately 5–25 km/wk from various sporting backgrounds (running, basketball, volleyball), familiar with treadmill running, physically active, participating in sport specific training sessions a minimum of three times per week and free from musculoskeletal injury within the one month previous. 19
Physical characteristics of the participants (mean ± SD).
Compression and control garments
The compression garment (CG) used in the investigation were SkinsTM Men's Compression A400 Long Tights (Riverwood, Australia). Garment size was selected in accordance with the manufacturer's sizing guide. The garments were made from warp knitted fabrics, with the fibre reported as 76% nylon and 24% elastane. The pressure exerted by the CGs on the lower limbs were evaluated by the PicoPress® (Microlabs, Italy) pressure monitor (coefficient of variation = <5% at 20 mmHg 20 ). Pressure measures were recorded at two anatomical locations (posterior orientation of the maximal calf girth and anterior thigh at the mid-point between mid-trochanterion-tibiale laterale). The control condition consisted of loose-fitting running shorts, thereby providing a comparison between compression tights and garments typically worn by recreational runners. The same short sleeve top and running shoes were worn on every testing occasion. Participants did not wear compression running socks.
Experimental design
Participants were required to attend on three occasions separated by seven days exactly (Figure 1). At visit 1 participants performed an incremental treadmill test to determine V̇O2max and peak running speed (vV̇O2max). Once V̇O2max and vV̇O2max were determined at the end of the incremental test, participants were allocated into either a 60%, 62.5% or 65% vV̇O2max group. To ensure balance between the three groups, participants were allocated using block randomisation in a parallel group design. A range of 60–65% vV̇O2max was selected to represent the range of speed commonly implemented by moderately trained runners during a marathon race. 21 Following group allocation and a 10-min recovery from the incremental test, participants completed a 5-min familiarisation at a speed corresponding to the designated %vV̇O2max. Compression and control conditions were performed during visits 2 and 3 in a randomised, counter-balanced order, during which participants completed a 15 min submaximal treadmill task.
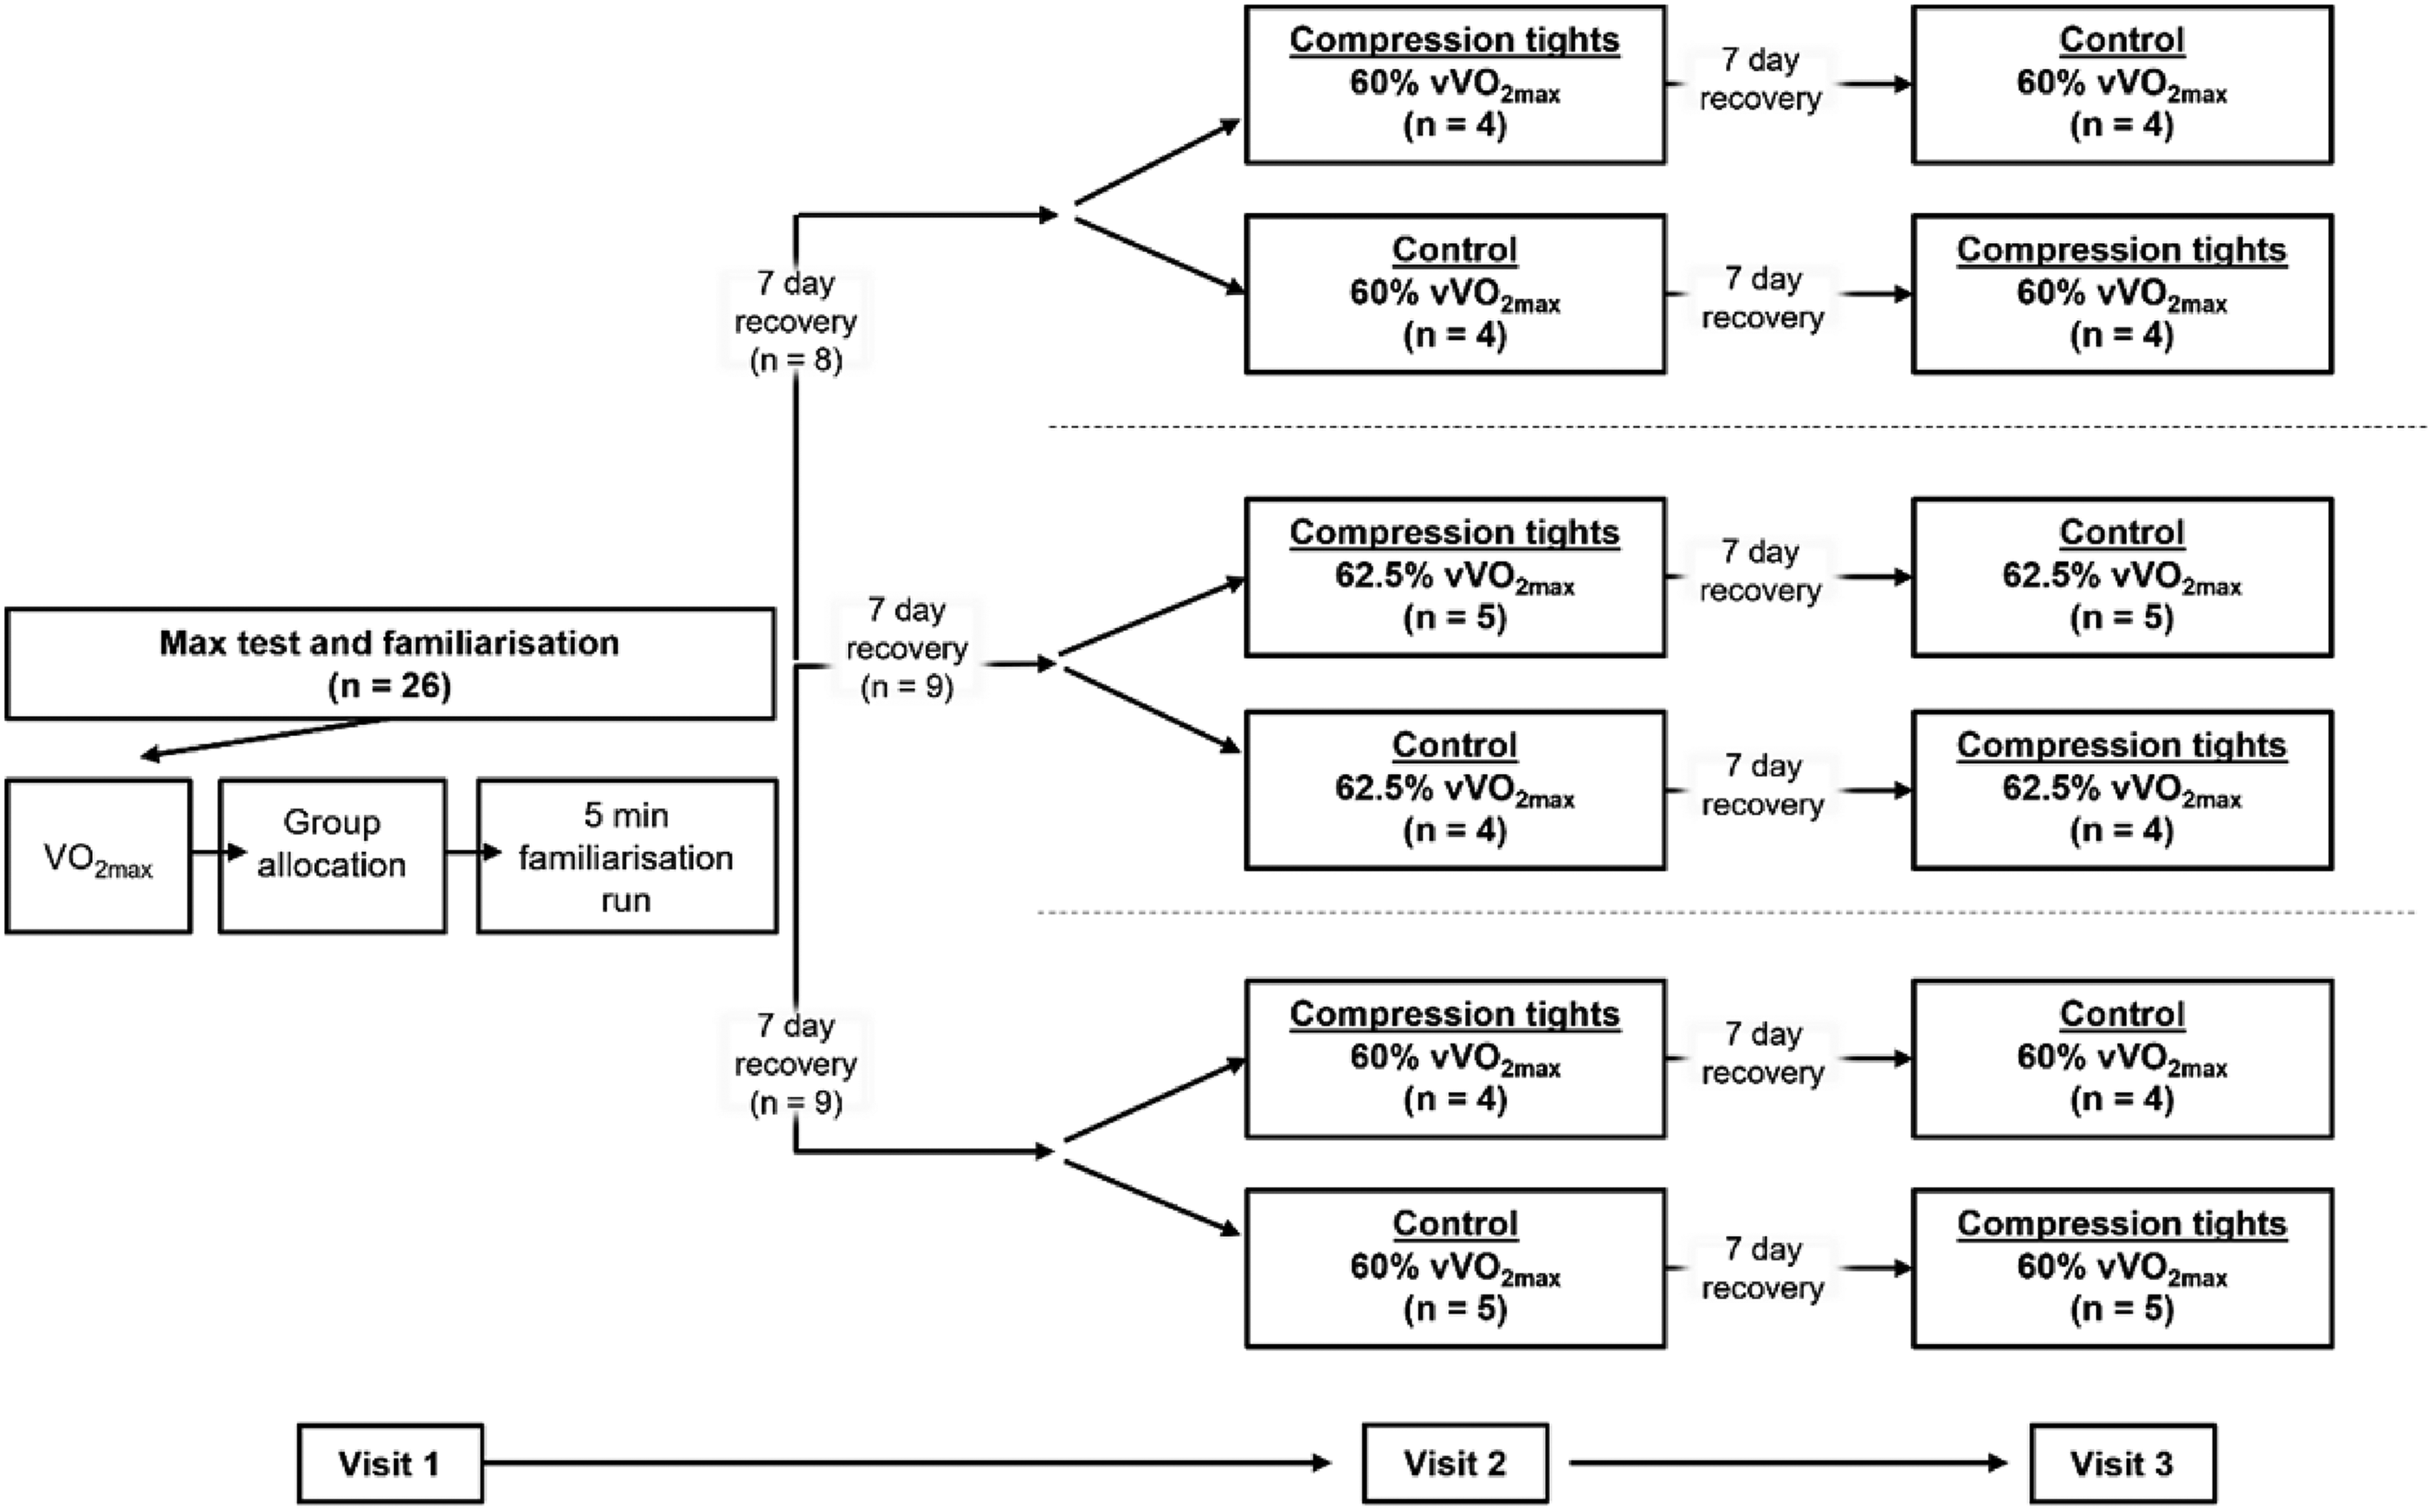
Schematic representation of research design. n = number of participants; V̇O2max = incremental test to exhaustion; vV̇O2max = peak running speed.
Each participant attended the laboratory (temperature: 18 ± 1.0 °C; relative humidity: 64 ± 5.0%) at the same time each visit to minimise variation in physiological parameters that might change with circadian rhythm. In the 24 h prior to testing, participants were asked to refrain from exercise, caffeine and alcohol intake. Participants were asked to record their diet for the 24 h before the initial laboratory visit and to repeat this for all subsequent visits. To ensure RE was not influenced by dehydration, participants were recommended to consume fluid the night before and the morning of testing in accordance with fluid intake recommendations. 22 Participants provided a urine sample on arrival of each session and urine specific gravity (USG) was measured (Atago Co., Ltd, Tokyo, Japan). Participants only began exercise when USG indicated euhydration (USG < 1.020). Two hours prior to testing, no food was consumed but water was allowed ad libitum.
Establishing individual aerobic capacity
Respiratory gases were collected continuously throughout the incremental test. Participants wore a dead-space mask with an impeller turbine assembly (Hans Rudolph, Kansas, USA) and gas concentrations continuously sampled via a capillary line. Concentrations were determined by electrochemical (O2) and infrared (CO2) analysers (Vyaire CPX, Mettawa, Illinois, USA). Prior to each test, the gas analysers were calibrated with gases of known concentration (16% O2 and 5% CO2), and ambient air. The digital volume transducer was connected to the housing blower and calibrated automatically using both high and low flow parameters.
Participants completed an incremental exercise test on a motorized treadmill (Quasar; HP Cosmos, Nussdorf, Germany). The protocol began at 7 km·h−1, after which the speed increased by 1 km·h−1 every minute up to 16 km·h−1. At 16 km·h−1, workload increments continued by increasing the gradient 2% each minute until volitional exhaustion. To determine vV̇O2max, a gradient increase of 1.5% was converted to an equivalent increase in speed of 1 km·h−1. 23 The calculated speed of the last complete stage was added to the multiplication of the speed increment by the completed fraction of the incomplete stage. V̇O2max was determined as the highest 30 s average oxygen consumption.
Submaximal running economy assessment
Prior to the RE assessment, a cycle warm-up (Monark 818E, Sweden) of 5 min at 100 W was completed. Participants were allocated a submaximal running speed of either 60 (n = 8), 62.5 (n = 9) or 65 (n = 9) %vV̇O2max with the aim of achieving a range of relative exercise intensities and running speeds. The submaximal assessment was 15 min of continuous running at a fixed speed and gradient remained at 1% throughout. Respiratory gases were collected continuously throughout the RE assessment. Participants ran at the same constant speed in both sessions, with only the garment condition changing.
Data treatment
Breath-by-breath data were converted to second-by-second data using linear interpolation. Oxygen consumption (V̇O2) and carbon dioxide production (V̇CO2) were averaged over the final 3 min of each submaximal exercise test. Second-by-second V̇O2 and V̇CO2 data were used to determine RE as caloric unit cost (kcal·kg−1·km−1) using equations for moderate to high intensity (50–75% V̇O2max).
24
Equations for the calculation of energy expenditure are displayed below;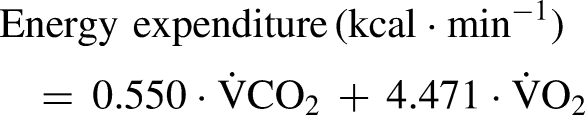
Statistical analysis
Data are presented as mean and 95% confidence intervals (95%CI) for all dependent variables. Normality of distribution was assessed using the Shapiro-Wilk test. Physiological variables were compared between three groups (60%, 62,5% and 65% vV̇O2max) via a one-way ANOVA and Tukey HSD post hoc test. Where data failed the test of normality, a non-parametric Kruskal-Wallis H Test was applied. Paired t-tests were used to analyse RE and % V̇O2max between conditions (compression vs. control) for each %vV̇O2max group. Cohen's d was calculated as a measure of effect size, calculated as the difference between two means and divided by a pooled standard deviation. We interpreted values of d = 0.2, d = 0.5, and d = 0.8 as a small, moderate or large effect size.
We subsequently combined the results from the three groups and calculated the difference in economy (Δkcal·kg−1·km−1) between conditions (ΔRE = control − compression). Associations between ΔRE with relative exercise intensity (%V̇O2max) and running speed (km·h−1) were examined by linear regression analysis and calculation of Pearson's correlation coefficients. Statistical tests were processed using the statistical package SPSS (Version 18), MedCalc (Version 19) and Microsoft Excel (Microsoft Corporation TM, Redmond, WA, USA). The level of statistical significance was identified by an alpha value of P < .05.
Results
Pressure applied by compression tights was 8.9 [7.8, 9.9] mmHg at the calf and 6.8 [6.3, 7.3] mmHg at the thigh. During the submaximal economy assessment all participants maintained a RER < 1.00 and were included in the analysis.
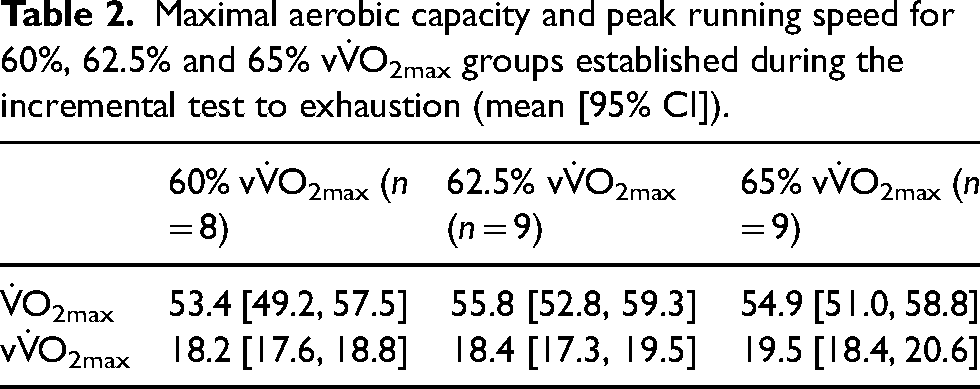
Following the maximal incremental test, no difference was observed in V̇O2max (χ2 (2) = 1.74, P = 0.42) or vV̇O2max (χ2 (2) = 4.75 P = 0.09) between the %vV̇O2max groups (60%, 62,5% and 65% vV̇O2max) (Table 2).
Maximal aerobic capacity and peak running speed for 60%, 62.5% and 65% vV̇O2max groups established during the incremental test to exhaustion (mean [95% CI]).
During the 15-min submaximal assessment, RE (kcal·kg−1·km−1) was found to significantly improve with compression, compared with the control condition, in the 65% vV̇O2max group by 2.7% (t (8) = −5.63, P < 0.01, d = −1.9), whereas non-significant, small, and moderate effect sizes were observed for 60% vV̇O2max (t (7) = −1.18, P = 0.28, d = −0.42) and 62.5% vV̇O2max respectively (t (8) = 1.98, P = 0.08, d = 0.66) (Table 3). In addition, %V̇O2max was lower with compression, compared with the control condition, in the 65% vV̇O2max group (t (8) = −6.44, P < 0.01, d = −2.1), whereas non-significant, small, and moderate effect sizes were observed for 60% vV̇O2max (t (7) = −1.99, P = 0.36, d = −0.34) and 62.5% vV̇O2max respectively (t (8) = 1.99, P = 0.08, d = 0.66). ΔRE was different between vV̇O2max groups (F (2, 25) = 5.65, P = 0.01) with post-hoc comparisons revealing the 60 and 65% vV̇O2max groups are significantly different to 62.5% vV̇O2max.
Physiological values and running speed for 60%, 62.5% and 65% sV̇O2max groups during the submaximal running economy assessment (mean [95% CI]).
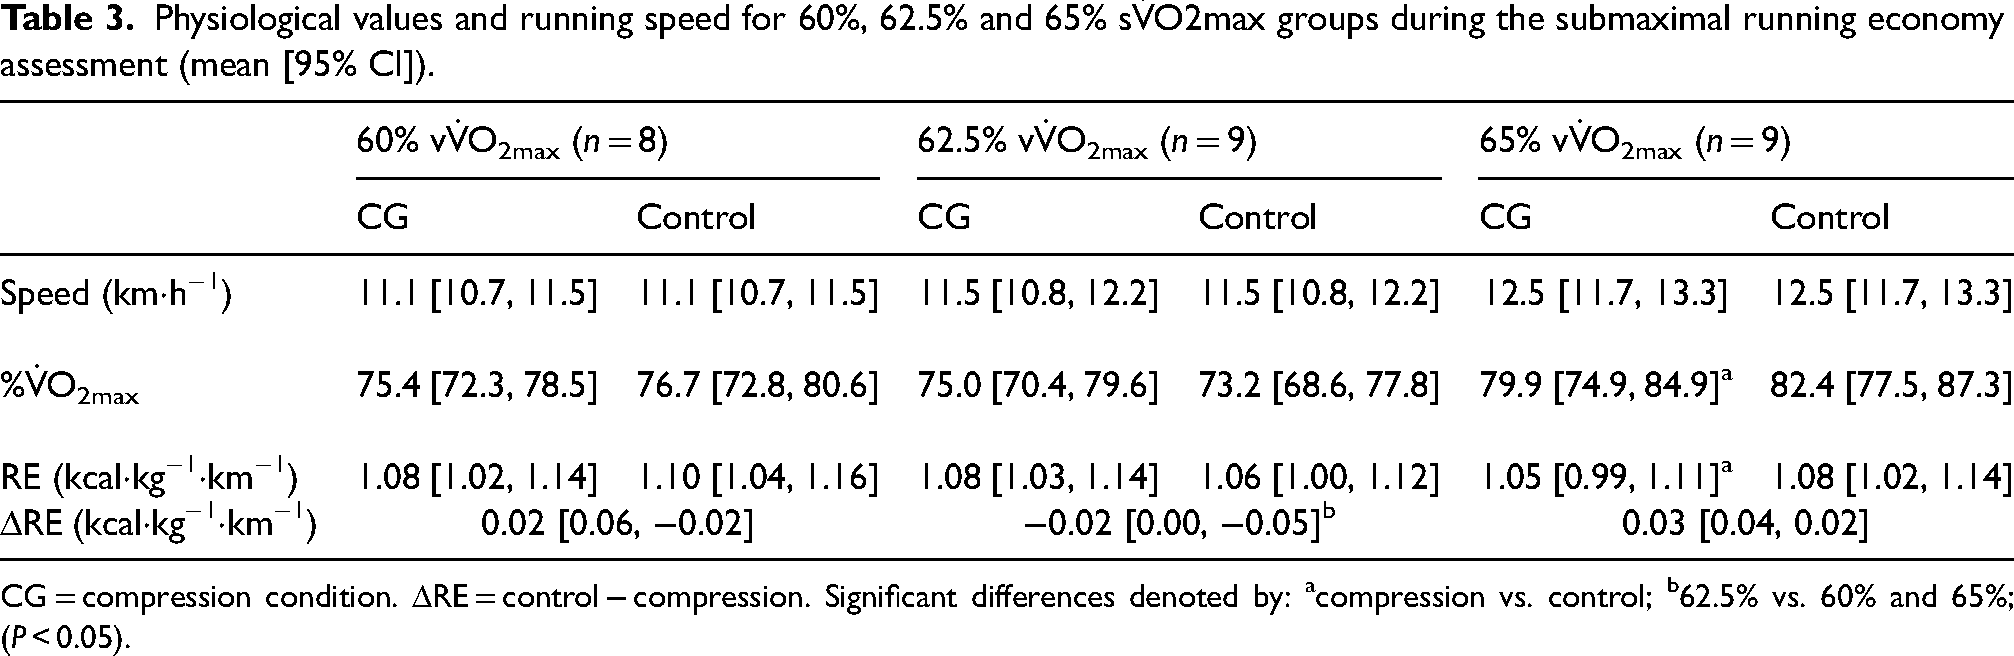
CG = compression condition. ΔRE = control − compression. Significant differences denoted by: acompression vs. control; b62.5% vs. 60% and 65%; (P < 0.05).
The combined results from the three groups (60%, 62.5% and 65% vV̇O2max) report a relative exercise intensity range of 67.1–91.5% and 68.6–89.9%V̇O2max for the control and compression group respectively. Figure 2(a) shows relative exercise intensity (%V̇O2max), determined from the control condition, was positively correlated with ΔRE (y = 0.003*x–0.23). No relationship was observed between absolute running speed (km·h−1) and ΔRE (Figure 2(b)).
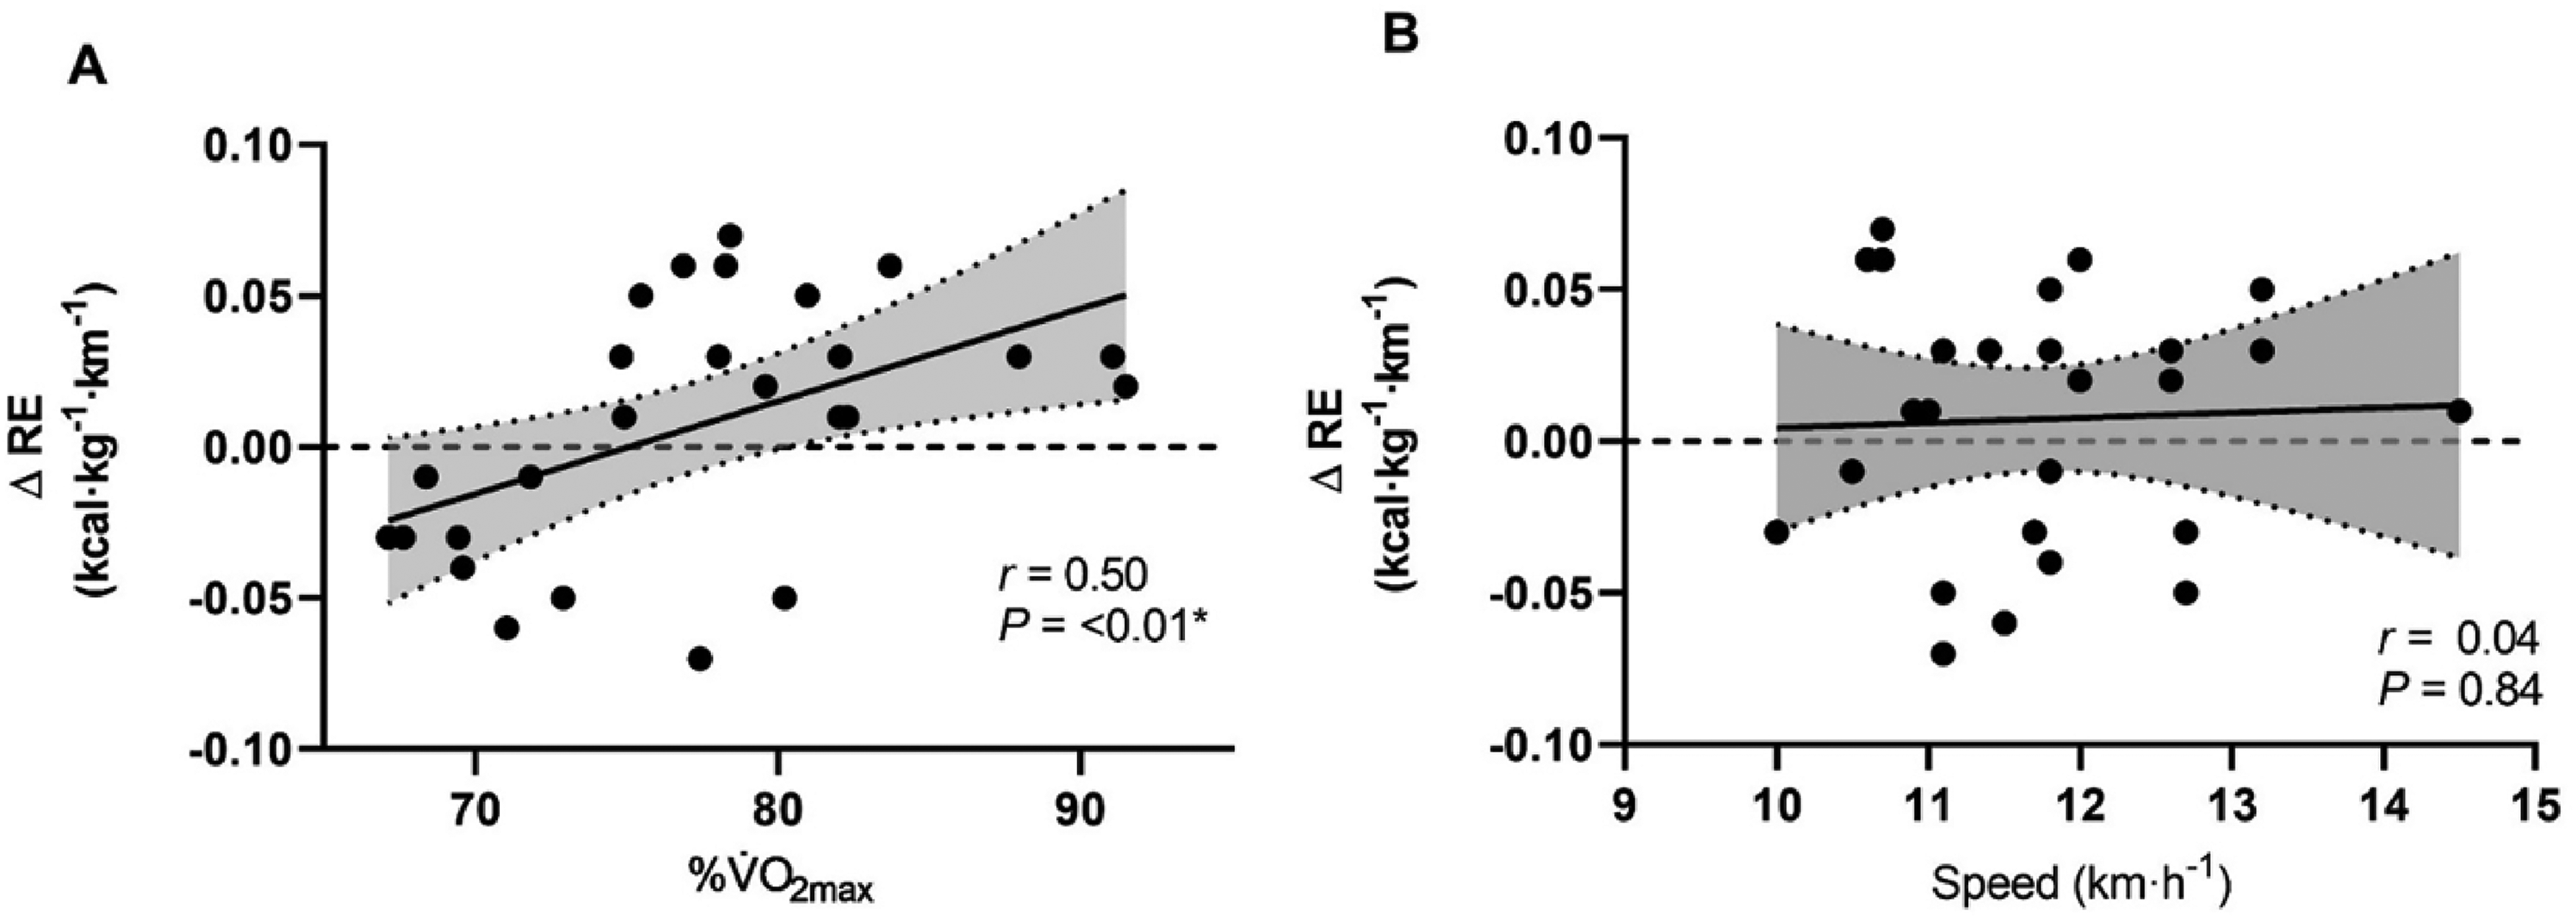
Relationship between ΔRE and (A) relative exercise intensity (%V̇O2max) and (B) absolute running speed (km·h−1). Δ = Control − Compression; 95% confidence interval = shaded area.
Discussion
The current study investigated whether compression tights improve RE at 60%, 62.5% and 65% vV̇O2max and if changes in RE were related to relative exercise intensity (%V̇O2max) and absolute running speed. The results revealed that at 65% vV̇O2max, RE was improved by 2.7% with compression tights, whereas no changes were observed at 60% and 62.5% vV̇O2max.
We report that the influence of compression tights on RE is positively correlated with the relative intensity of exercise but not correlated with absolute running speed. Our investigation provides a new view on the influence of compression tights on economy when reported as caloric unit cost, demonstrating possible ergogenic effects at 65% vV̇O2max or when the relative exercise intensity is approximately 75–85% V̇O2max. The improved economy at a higher relative exercise intensity supports previous findings revealing that compression stockings produce a positive effect on economy at 80% and ∼90% V̇O2max.13,25
The running speed at 65% vV̇O2max corresponded to a relative intensity of ∼80% V̇O2max. Previous research identified that recreational half-marathon runners typically perform at this relative intensity 26 and running at 80% V̇O2max for 90 min causes a gradual increase in running economy. 27 Therefore, strategies such as compression tights, that reduce or attenuate the increase in RE over a prolonged submaximal run are advantageous for runners. The importance of RE and its relationship with running performance was demonstrated when an impairment of 1.11% in RE was reported to reduce 3000 m running performance by 0.78%, demonstrating a direct link between RE and performance. 28
Compression studies typically express economy as oxygen cost per unit of body mass per unit of distance (mL·kg−1·km−1). VO2 may lack sensitivity as it does not account for differences in substrate use at any given speed. 1 Economy can also be expressed as caloric unit cost (kcal.kg−1.km−1). This metric is more sensitive to changes in running speed and differences in substrate use by also considering changes in expired CO2. 15 Better sensitivity makes it a better choice when investigating interventions known to cause small changes in economy such as compression. Despite this, previous compression studies have only reported economy as the oxygen cost. The present study is the first to explore the role of compression tights on caloric unit cost
Similar improvements in economy to those reported at 65% vV̇O2max have been observed following 8 weeks of high intensity interval training, 29 6 weeks of plyometric training 30 and 4 weeks of living and training at altitude. 31 Chronic training interventions that demonstrate an improvement in economy are, however, also likely to elicit several physiologic adaptations that contribute toward improved distance running performance. Conversely, when an improved economy is observed with acute interventions such as the donning of compression tights, it is questionable to what extent this may influence distance running performance. Whether this improvement in economy translates into meaningful performance benefits is equivocal. A limitation of assessing the role of CGs on exercise performance is that it is impossible to blind the participants to the clothing condition. Studies that have investigated the role of compression tights on distance running performance have demonstrated no effect during a 18.6 km trail run 32 or a 5 km time trial in a hot environment. 33
Improved RE within the reported exercise intensity range would be caused by several factors, including altered biomechanical and neuromuscular systems. In particular, previous studies revealed that lower body compression reduced stride length at 10 and 14 km·h−1. 34 Altered stride length may limit intra-individual gait variability in recreationally active runners, 35 maintaining a more consistent gait and contribute toward a lower oxygen cost. 36 Conversely, reductions in stride length due to CGs were associated with poorer economy in highly trained runners. 37 Novice runners demonstrate greater variability in gait characteristics. The physical support offered by compression, or the pressure-induced stimulation of mechanoreceptors 38 may, therefore, limit this variability. Furthermore, economy is related to the stiffness of the propulsive leg, with greater stiffness eliciting the best economy. 2 While compression stockings were shown to increase leg stiffness during flat and hilly trail running, 39 they elicited no change during submaximal treadmill running. 37 Despite these findings, the influence of compression tights on running leg stiffness is yet to be investigated and may help explain the observed improvement in economy. Surface EMG studies report lower activation of leg musculature during sub-max running with compression stockings 40 and long tights. 41 Attenuated muscle oscillation may also lead to a reduction in recruitment of motor units. 42 Additionally, the semitendinosus muscle is involved in decelerating the momentum of the swing limb as the knee extends during the mid and late swing phase. Reduced activation of the semitendinosus muscle with compression tights 41 during submaximal running may also be associated with an altered stride length, however this remains to be explored.
At 65% vV̇O2max, economy in the compression condition was 0.03 kcal·kg−1·km−1 lower compared with control. It is important to note that changes in RE need to be considered in relation to the typical day-to-day variation and reliability of RE measures. When standardisation procedures have been implemented similar to that of the current study (clothing, footwear, dietary and training factors), the within and between-day coefficient of variation for energy expenditure (kJ·min−1) when running at 70% V̇O2max is between 1.7% 43 and 2.2%. 44 In the 65% vV̇O2max group, a difference in energy expenditure (kJ·min−1) of 2.6% between garment conditions is reported and therefore the altered energy expenditure with compression tights at 65% vV̇O2max can be considered beyond the typical error associated with RE assessment. 45
There are several limitations to this study design that require consideration. In the present investigation, comparison of RE across intensities is made between-participants and therefore we are unable to determine if those who demonstrated a positive response to compression at 65% vV̇O2max would also have responded to wearing compression at a lower exercise intensity. The absence of surface electromyography, biomechanical or haemodynamic measures limits the extent in which the observed results can be interpreted. Furthermore, previous studies have reported that the optimal pressure range under resting conditions is 8–18 mmHg of graduated compression across the lower limb. This level of pressure is sufficient to significantly increase deep venous velocity and increase venous return. 46 The pressure applied by the compression tights in the present study is considered low and therefore we are unable to determine the impact of compression tights eliciting a higher pressure. Nonetheless, given the present findings, if low pressure garments can produce favourable improvements in economy, athletes may opt to choose lower pressure garments given the increased perception of comfort. 47 The primary finding identifies that compression tights alter RE at 65% vV̇O2max and that this effect is likely dependant on relative intensity.
Practical application
Wearing lower body CG during sub-maximal running (∼75–85% V̇O2max) leads to a reduction in RE of 2.7% in the final 3 min of a 15-min steady state protocol. This is convincing evidence that compression tights may be beneficial to moderately trained distance runners exercising at similar intensities, since small improvements in running economy become important over long distances. However, compression tights do not appear to influence RE at intensities between 65–75% V̇O2max. Future studies are required to elucidate on the mechanisms integrating with the observed changes in RE, plus identify if these physiological changes translate into a measurable performance enhancement.
Conclusion
This study is the first to identify the influence of compression tights on RE varies by relative intensity and significant improvements with compression are only observed at 65% vV̇O2max, corresponding to approximately 75–85% V̇O2max No change to RE was reported at 60% or 62.5% vV̇O2max. The mechanism behind these observations requires further investigation to corroborate the plausible explanations presented here.
Footnotes
Acknowledgements
The authors are grateful to the participants for volunteering their time and energy to this study. We would like to acknowledge SKINS International Trading AG for providing the compression garments free of charge. No external funding was received for this study, nor potential conflicts of interest reported by the authors.
Declaration of Conflicting Interests
None of the authors have any ownership of stocks, employment or board membership at SKINS International Trading AG or other companies with competing interests with relation to data presented here, neither financial, professional, nor personal.
Funding
SKINS International Trading AG provided the compression garments free of charge. SKINS International Trading AG had no role in study design (other than garment provision), data collection and analysis, decision to publish or preparation of the manuscript. No external funding was received for this study. The results of the current study do not constitute an endorsement of the product by the authors or the journal.