
Abstract
This study explores the influence of lateral dimensions on the electrochemical performance of Ti3C2Tx. Both Ti3C2Tx with big lateral (Ti3C2Tx-B) and Ti3C2Tx with medium lateral (Ti3C2Tx-M) exhibit a surface-controlled charge storage mechanism across all scan rates, with Ti3C2Tx-M showing a significant contribution from surface capacitance. In contrast, only the small lateral Ti3C2Tx (Ti3C2Tx-S) displayed a diffusion-controlled process, and, within the same electrochemical potential range, it demonstrated significant hydrogen evolution performance. Ti3C2Tx-M achieves the highest specific capacitance of 412 F g−1 at 0.5 A g−1, surpassing Ti3C2Tx-B, which reaches 350 F g−1. These findings indicate that the lateral size restrict ion diffusion in the electrolyte, impacting the reaction rate, as smaller dimensions allow ions more time to traverse pores while their diffusion is influenced by the availability of active sites on the electrode surface.

Introduction
In recent years, two-dimensional (2D) inorganic materials have shown extensive potential applications in the field of energy storage, with Ti3C2Tx particularly attracting attention as a nanomaterial consisting of several atomic layers of transition metal carbides.1,2 Ti3C2Tx belongs to the MXene family, where Tx denotes surface function groups terminated with OH, F, and O. Its interlayer structure provides abundant surface chemical active sites, 3 facilitating the insertion of electrolyte ions, thereby enhancing its potential as electrode material for lithium-ion batteries and supercapacitors.
Ti3C2Tx lamellae possess significant lateral dimensions, while their size along the c-axis direction is relatively small. It is generally accepted that electrons predominantly conduct within their plane, and larger lateral dimensions promote better electron conduction.4 –7 In contrast, ion diffusion in the large lateral dimensions is hindered by the complex and lengthy paths, thereby limiting energy and power density. Thus, the diffusion of ions in 2D layered materials is crucial, which can occur either horizontally or vertically along the c-axis. While there is extensive research on vertical diffusion,8 –17 reports on effective horizontal stacking for constructing electrodes with high capacity are relatively sparse.
The larger flakes exhibit higher electronic conductivity due to reduced interfacial contact resistance, while the smaller lamellae offer higher ionic conductivity by providing more pathways for electrolyte ion diffusion. The lateral size of flakes may play a crucial role in determining the electrochemical properties of MXene. To further optimize ion transport pathways and enhance electrode energy and power density, this study investigates the impact of lateral size on the electrochemical performance of Ti3C2Tx. Three different lateral sizes were prepared: big lateral sizes denoted as Ti3C2Tx-B, medium lateral sizes denoted as Ti3C2Tx-M, and small lateral sizes denoted as Ti3C2Tx-S. Compared to Ti3C2Tx-B, the further etched Ti3C2Tx-M exhibits a shorter ion diffusion path in the horizontal direction. In addition, the presence of pore structures on the surface of Ti3C2Tx-M facilitates ion diffusion along the c-axis. Both the Ti3C2Tx-B and Ti3C2Tx-M showed a predominantly surface-controlled capacitive behavior. Especially, the Ti3C2Tx-M demonstrates dominant surface-contributions behavior across the range from 0.1 to 100 mV s−1, further confirming the primarily surface pseudocapacitive and fast Faradaic reactions. Ti3C2Tx-S, with its smaller lateral size and exposure to numerous active sites, is minimally affected by the surface chemical reaction rates of the electrode. As a result, it exhibits rate control throughout the process and demonstrates strong hydrogen evolution reaction (HER), indicating a competitive relationship between the reversible electrolyte ion adsorption on the electrode surface and the HER.
Experimental sections
Synthesis of Ti3C2Tx with different lateral dimensions
1.6 g of LiF was added to a 20 mL HCl solution, resulting in severe initial heat release. The mixture was placed in a water bath at room temperature and stirred magnetically until LiF completely dissolved. Subsequently, 1 g of Ti3AlC2 was slowly added, and the mixture was stirred magnetically at 45 °C for 24 h for etching. After etching, the purple-brown precipitate was washed with 1 M dilute HCl to remove excess LiF impurities. Centrifugation was performed 2–3 times until the upper layer became a clear solution. Then, rinsing with deionized water through centrifugation continued until the pH reached around 6. During this process, the upper solution gradually became turbid, and the viscosity of the solution increased. An appropriate amount of deionized water was added, and N2 ultrasound was applied. The water was changed every 20 min, with intervals of 20 min of ultrasound for a total of 2 h. Finally, the dark green precipitate was collected and designated as Ti3C2Tx-B. And the supernatant obtained for future use.
Two milliliters of the above viscous dark green precipitate (Ti3C2Tx-B) was further dispersed in 20 mL of deionized water with thoroughly stirring. Then transferred to a 50-mL Teflon-lined stainless-steel autoclave and deaerated by bubbling N2 gas. Subsequently, the sealed autoclave was heated in an electric oven at 120 °C for 24 h and then allowed to cool down at room temperature. The Ti3C2Tx-M was collected by centrifugation of the resulting suspension.
Ten milliliters of the above supernatant and 0.5 mL of polyethylene imine (PEI) were dispersed in 20 mL of deionized water with thoroughly stirring. Then transferred to a 50-mL Teflon-lined stainless-steel autoclave and deaerated by bubbling N2 gas. Subsequently, the sealed autoclave was heated in an electric oven at 120 °C for 24 h, and then allowed to cool down at room temperature. The Ti3C2Tx-S was collected by centrifugation of the resulting suspension.
Characterizations
The morphology was characterized by scanning electron microscopy (SEM, Quanta200), and the composition of the sample was determined by X-ray diffraction (XRD, Germany’s Brooke D8advance); The electrochemical tests were conducted on the electrochemical workstation (CHI660D, Shanghai Chenhua Instrument Co., Ltd.).
Electrochemical measurements
Coating the three different lateral size of Ti3C2Tx on the conductive glass with a coating area of 1 × 1 cm2 and a loading mass of 2 mg cm−2. These films were used directly as electrodes for supercapacitors. Cyclic voltammetry (CV) and charge-discharge tests were performed using a CHI electrochemical workstation with voltage windows set at −0.5 to 0.5 V. Electrochemical impedance spectroscopy (EIS) data were obtained using an AC perturbation with an amplitude of 5 mV over a frequency range from 100 kHz to 0.01 Hz.
A symmetric two-electrode system was constructed to investigate the practical possibilities of different lateral size of Ti3C2Tx. In two-electrode system, CV tests were conducted in a 0–0.5 V range in H2SO4 solution at scan rates ranging from 5 to 100 mV s−1.
Results and discussion
Figure 1(a) and (b) demonstrates that Ti3C2Tx-B maintains the accordion-like morphology of MXene. Ti3C2Tx-B approximates a nearly rectangular flake with dimensions around 400 nm in width and 500 nm in length (Figure 1(c)). The multilayer structure of Ti3C2Tx-B can be observed in TEM images (Figure 1(d)), with lattice fringes corresponding to the (104) crystal plane at 0.23 nm. 18 The Ti3C2Tx-M, obtained by further etching the Ti3C2Tx-B, shows adherent fine particles, and the accordion morphology disappears (Figure 1(e) and (f)). At lower magnification in TEM (Figure 1(g)), a more transparent single-layer Ti3C2Tx is visible, featuring with pores and adherent small fragments on the elliptical flake, which measures approximately 300 nm along the long axis and 100 nm along the short axis. And the small fragments possibly originated from more intense etching during hydrothermal processes. Ti3C2Tx-S exhibits a smoother surface in SEM (Figure 1(i) and (j)), likely due to the smaller lateral dimensions of the 2D Ti3C2Tx-S, forming a denser electrode film on the conductive glass surface. The TEM image (Figure 1(k)) showed that the single layer has been broken into aggregates of many tiny flakes, with the lamellar size further reduced to approximately 25 nm. This indicates that the Ti3AlC2 crystal structure has been destroyed, which is further confirmed by the selected area electron diffraction (SAED) pattern. Unlike Ti3C2Tx-B, which has larger lateral dimensions and shows distinct diffraction patterns (Figure 1(d)), Ti3C2Tx-M (Figure 1(h)) and Ti3C2Tx-S (Figure 1(l)) display diffuse, amorphous-like central spots.

Morphology of Ti3C2Tx with different lateral sizes. SEM images of Ti3C2Tx-B films (a, b), and the corresponding TEM images (c, d); SEM images of Ti3C2Tx-M (e, f), and the corresponding TEM images (g, h); SEM images of Ti3C2Tx-S (i, j), and the corresponding TEM images (k, l). The illustrations in (d, h, and l) are selected area diffraction patterns.
This phenomenon is similarly observed in the XRD pattern (Figure 2(a)). Ti3C2Tx-B exhibits diffraction peaks corresponding to TiC crystals (Figure S1). With further reduction in lateral dimensions, the multi-layer crystal structure of the MXenes was destroyed. As a result, the diffraction peaks around 2θ ≈ 10° corresponding to the (002) crystal plane gradually broaden with decreasing lateral size, indicating an increase in interlayer spacing. Ti3C2Tx-B film drop-cast on conductive glass appears dark green, which is consistent with the previously reported Ti3C2Tx. 19 As the lateral size further decreases, the Ti3C2Tx-M appears darker black, and Ti3C2Tx-S is semitransparent (Figure 2(b)), revealing the successful preparation of Ti3C2Tx with different lateral sizes. XRD analysis confirmed that Ti3C2Tx-B still retains some diffraction peaks from Ti3AlC2. However, as the lateral size decreased further, the diffraction peaks disappeared and were replaced by a broad diffraction peak around 10°, indicating the complete disruption of the crystal structure.
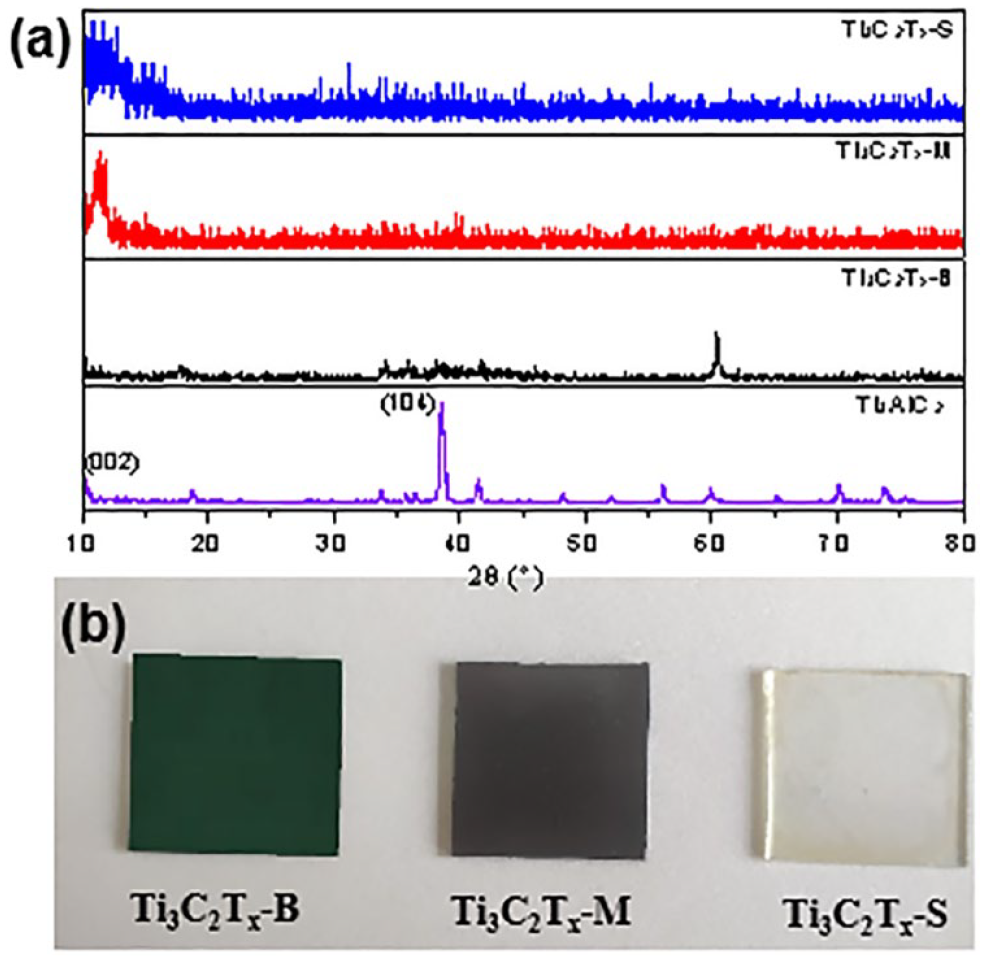
(a) XRD pattern and (b) optical photographs of Ti3C2Tx films with different lateral sizes drop-coated on conductive glass.
The electrochemical performance of Ti3C2Tx films with three different lateral sizes was evaluated using a three-electrode system with 1 M H2SO4 aqueous solution as the electrolyte. Ti3C2Tx-B with larger lateral dimensions mainly relies on the rapid adsorption and desorption of electrolyte ions, which facilitates the formation of an electrochemical double-layer capacitor (EDLC). 20 In contrast, the smaller-sized Ti3C2Tx-M exhibits a larger specific surface area and exposes more metal ions, such as Ti4+. Consequently, at a scan rate of 100 mV s−1, Ti3C2Tx-M demonstrates a larger integrated CV area and more pronounced redox peaks, as shown in Figure 3(a). With the increase in scanning rate, both Ti3C2Tx-S (Figure S3) and Ti3C2Tx-M (Figure S4) exhibit a pair of broad bump peaks in the voltage range of −0.2 to −0.4 V and 0.2 to 0.3 V. This redox peaks may originate from the redox behavior of Ti ions (Ti3+↔ Ti4+) and the interaction between surface-adsorbed water molecules or protons with charge Surface-induced capacitive contribution transfer.21 –23 On the other hand, Ti3C2Tx-S exhibited severe polarization (Figure 3(a) and Figure S5) and undergoes a pronounced hydrogen evolution reaction (HER) (Figure S6). This may be due to the exposure of numerous active sites of Ti3C2Tx-S for HER.24 –26 And the competition between HER and charge storage significantly diminishes the EDLC capability of Ti3C2Tx-S. Figure 3(b) displays the charge-discharge curves obtained for Ti3C2Tx-B and Ti3C2Tx-M at 0.5 A g−1. The charge-discharge curves for both Ti3C2Tx-B (Figure S7) and Ti3C2Tx-M (Figure S8) shows a distorted triangular shape, indicating contributions from both double-layer capacitance and H+ intercalation pseudocapacitance. The specific capacitance of Ti3C2Tx-M electrode is 412 F g−1, which is higher than Ti3C2Tx-B (350 F g−1), attributing a shorter ion diffusion path and a higher amount of exposed Ti4+ active sites. The charge storage data of Ti3C2Tx-S were not given due to the poor charge storage capacity.
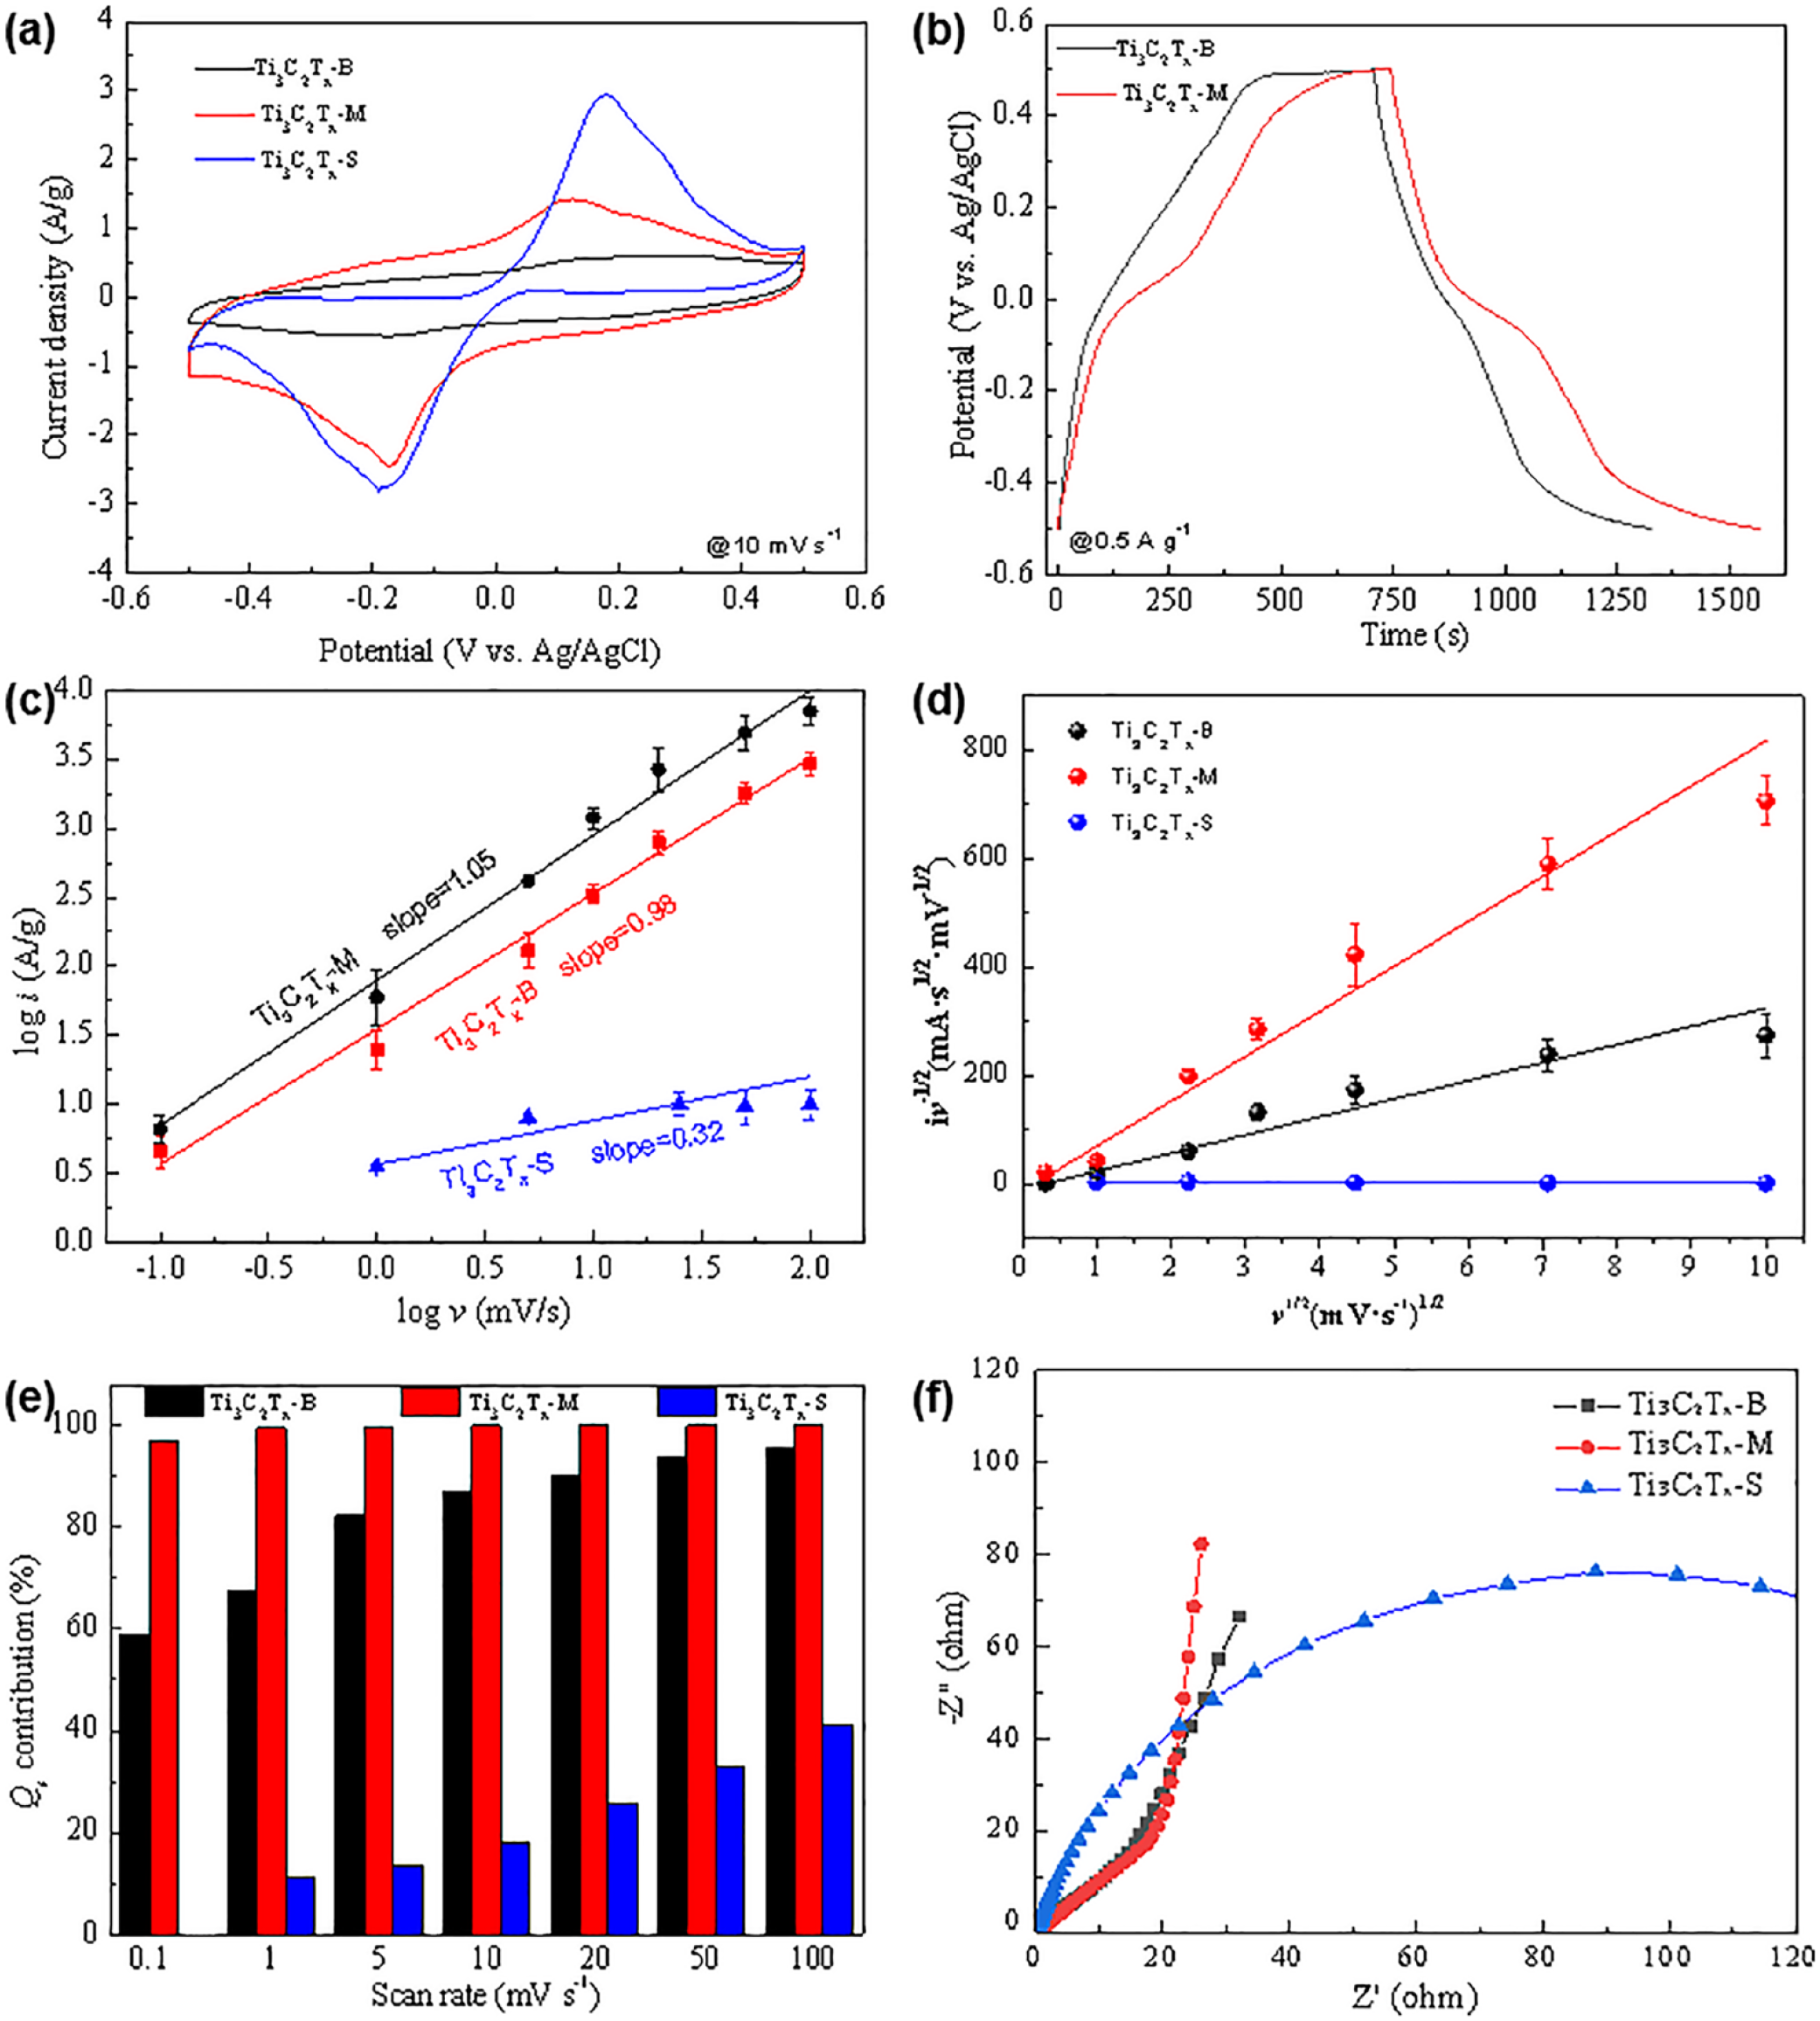
(a) CV curves of the different lateral sizes of Ti3C2Tx electrodes at a scan rate of 10 mV s−1; (b) charge-discharge curves of the Ti3C2Tx-B and Ti3C2Tx-M at a current density of 0.5 A g−1; (c) relationship between peak current and scan rate, and (d) the variation of anodic peak currents as a function of the square root of scan rates with three different lateral sizes of Ti3C2Tx electrodes. (e) Surface-induced capacitive contribution of Ti3C2Tx. (f) EIS analysis of electrodes in 1 M H2SO4 electrolyte.
The charge storage mechanism of the different lateral sizes of Ti3C2Tx was elucidated by analyzing the relationship between current (i) and scan rate (v) obtained by the power law on CV curves obtained at various scan rates:20,27 –29

The parameters a and b are variable. The value of b can be deduced from the slope of the graph plotting log(v) against log(i). A b-value of 0.5 suggests a diffusion-dominated process in which the overall capacitance depends on the Faradaic intercalation. Conversely, when b equals 1, it indicates a non-diffusion-controlled capacitive behavior, where the total capacitance is the combination of EDLC and pseudocapacitance arising from rapid surface Faradaic reactions.
As shown in Figure 3(c), the b values of Ti3C2Tx-B and Ti3C2Tx-M are 0.98 and 1.05, involving a non-diffusion-controlled capacitive behavior, where the total capacitance is the combination of EDLC and pseudocapacitance arising from rapid surface Faradaic reactions. 30 In contrast to Ti3C2Tx-B and Ti3C2Tx-M, which has larger lateral dimensions and relies on the EDLC formed by rapid adsorption/desorption of electrolyte ions, the small lateral sized of Ti3C2Tx-S with a b values of 0.32 exposes more metal ions such as Ti4+, indicating a diffusion limitation.31,32 This result correlates well with the distinct redox peaks observed in the CV curve of Ti3C2Tx-S (Figure 3(a) and Figure S5).
To further specify the capacitive contribution at a certain scan rate, according to the flow equation:19,33,34


where i(V) is the current fixed at the potential (0.3, 0.2, 0.1, 0.0, −0.16, −0.2, −0.25, and −0.3 V) and the contributions from diffusion-controlled (k2ν1/2) and surface-controlled (k1ν) are quantitatively measured. 18 k1 and k2 values can be calculated from the slope and the intercept of the square root of scan rate (ν1/2) against i(V)ν−1/2. The total stored charge is the sum of charge from the surface-confined process (Qs=k1ν) and diffusion-controlled process (Qd=k2ν1/2), as determined by the slopes of fitting lines in Figure 3(d).
As shown in Figure 3(e), Ti3C2Tx-B consistently exhibits a significant surface contribution (Qs, k1ν) across the sweep rates ranging from 0.1 to 100 mV s−1, with a linear increase from 58.7% at 0.1 mV s−1 to 95.4% at 100 mV s−1. This is because Ti3C2Tx-M with large lateral size primarily rely on the double-layer capacitance mechanism for charge storage, and their excellent conductivity facilitates the rapid adsorption of ions on the surface of the layers. For Ti3C2Tx-M, the surface-induced capacitive contribution (k1ν) maintain at a relatively stable value form 97.0% at 0.1 mV s−1 to 99.9% at 100 mV s−1. The smaller lateral size and increased porosity of the Ti3C2Tx-M architecture significantly enhance ion accessibility to surface active sites. This enhancement shortens the transport pathways for electrolyte ions, increasing both non-diffusion-controlled contributions and overall capacitance. This allows Ti3C2Tx-M to maintain a significant surface contribution across a range of scanning speeds from low to high. However, Ti3C2Tx-S shifts to being dominated by diffusion-controlled processes (k2ν1/2) from 58.7% to 88.6% with decreasing scan rate charge.
To better comprehend the electronic conductivity and charge transfer of the electrodes with different lateral dimensions, the EIS was conducted over a frequency range of 0.01 Hz to 100 kHz, as depicted in Figure 3(f). The Nyquist plots of both Ti3C2Tx-B and Ti3C2Tx-M exhibited a semicircular curve in the high-frequency region and a linear curve in the low-frequency region. In the high-frequency region (Figure S9), which represents the electronic conductivity resistance (Rs), including both the electrode and electrolyte contributions, Ti3C2Tx-B shows an Rs of 1.8 Ω, while Ti3C2Tx-M demonstrates 3.6 Ω. This is because the larger flakes of Ti3C2Tx-B exhibit higher electrical conductivity. Ti3C2Tx-S has an Rs of 0.5 Ω, because the smallest lateral size showed a better adhesion of the active materials and conductive glass substrates. At the mid-frequency, the diameter of the curve indicates the charge-transfer resistance (Rct) associated with the Faradaic reaction at the interface between the electrode and electrolyte. The semicircle diameter of Ti3C2Tx-M and Ti3C2Tx-B were almost equal. In the low-frequency region, the slope of the line corresponds to the ion diffusion resistance, and a larger slope indicates a smaller ion diffusion resistance. In the low-frequency region, the slope of Ti3C2Tx-M is nearly parallel to the Y-axis. It is much larger than that of Ti3C2Tx-B, suggesting that Ti3C2Tx-M has better ion diffusion capability and superior capacitive performance compared to Ti3C2Tx-B.
To further demonstrate the difference of Ti3C2Tx-B and Ti3C2Tx-M for practical applications, a symmetric supercapacitor is fabricated at 10 mg cm−2 in two-electrode test configurations. All CV curves deliver quasi-rectangular shapes from 5 to 100 mV s−1 (Figure 4(a) and (b)), consistent with the linear galvanostatic behavior (Figure 4(c) and (d)). Figure 4(e) illustrates the variation in specific capacitance against current density (0.5–5 A g−1). Ti3C2Tx-M shows the highest specific capacitance of 352 F g−1 at 0.5 A g−1. In contrast, Ti3C2Tx-B only reaches 250 F g−1 at a current density of 0.5 A g−1 and 95 F g−1 at a high current density of 5 A g−1. Ti3C2Tx-M, on the other hand, achieves an energy density of 12 W kg−1 at a power density of 125 W kg−1, while Ti3C2Tx-B only achieves 9 W kg−1. The long-term cyclic performance of the diffident lateral size of Ti3C2Tx was investigated at a current density of 10 A g−1. As shown in Figure 4(f), the Ti3C2Tx-M exhibits superior cycling stability with 85.5% retention after 5000 charge/discharge cycles, compared to the Ti3C2Tx-B film electrode with 44.4%. This result further confirms the enhanced performance of Ti3C2Tx-M is ascribed to the reduced lateral dimensions.

CV curves of (a) Ti3C2Tx-B and (b) Ti3C2Tx-M electrode at different scan rates with the two-electrode. charge-discharge curves of (c) Ti3C2Tx-B and (d) Ti3C2Tx-M at different current densities. (e) Specific capacitance at different current densities, and (f) cycling stability of a current density of 2 A g−1 for Ti3C2Tx-B and Ti3C2Tx-M.
The lateral dimension of Ti3C2Tx films play a crucial role in electronic conductivity and ion diffusion. The Ti3C2Tx-B sheets with larger lateral sizes have a longer pathway compared to the Ti3C2Tx-M sheets, resulting in a slower ion diffusion rate for Ti3C2Tx-B (Figure 5(a)). Compared to Ti3C2Tx-B, the surface contribution increases linearly as the scan rate increasing, Ti3C2Tx-M consistently demonstrates a notably high surface contribution across all scan rates. This is because the Ti3C2Tx-M surfaces typically feature sub-micron pore structures (Figure 5(b)). The lateral size and the pores restrict ion diffusion in the electrolyte, directly impacting the reaction rate. And the ions of the smaller lateral size have sufficient time to pass through these pores, but their diffusion is influenced by the number of active sites available on the electrode surface.

Ions transport along the (a) horizontal and (b) vertical direction of the Ti3C2Tx lamellae.
Conclusion
Based on the study of Ti3C2Tx with varying lateral sizes, it is evident that the lateral dimensions significantly influence the electrochemical performance. Among the three-electrode, Ti3C2Tx-M exhibits superior specific capacitance of 412 F g−1 at the 0.5 A g−1, while the Ti3C2Tx-B is 350 F g−1. The Ti3C2Tx-S, with the smallest lateral size, showcases exceptional catalytic activity for the HER. Notably, both Ti3C2Tx-B and Ti3C2Tx-M demonstrate a surface-controlled charge storage mechanism across all scan rates, with Ti3C2Tx-M showing a particularly high contribution from surface capacitance. This indicates that while lateral dimensions play a crucial role in ion diffusion pathways, the presence of defects and pores within the layered structure enhances ion transport at elevated scan rates, providing effective shortcut diffusion routes. And at the two-electrode, Ti3C2Tx-M achieves the highest specific capacitance of 352 F g−1 at a current density of 0.5 A g−1, surpassing Ti3C2Tx-B, which only reaches 250 F g−1 under the same conditions. In addition, Ti3C2Tx-M exhibits superior energy density (12 W kg−1) compared to Ti3C2Tx-B (9 W kg−1) at a power density of 125 W kg−1.
Supplemental Material
sj-docx-1-chl-10.1177_17475198251330484 – Supplemental material for The size effect of Ti3C2Tx nanosheet on the charge storage capability
Supplemental material, sj-docx-1-chl-10.1177_17475198251330484 for The size effect of Ti3C2Tx nanosheet on the charge storage capability by Mingyue Chen, Jiayu Pan, Baozhi Gong, Siyang Wu, Peisong Tang, Kunyan Wang and Yangbin Ding in Journal of Chemical Research
Footnotes
Ethical Considerations
The research was conducted in adherence to ethical standards.
Consent to publication
All authors have consented to the publication of this article.
Funding
The author(s) disclosed receipt of the following financial support for the research, authorship, and/or publication of this article: This work was supported by the Huzhou Natural Science Foundation (No. 2023YZ44), the Public Welfare Application Research Project of Huzhou City (2021GZ09), and the National College Students’ Innovation and Entrepreneurship Training Program (No. 202310347046).
Declaration of conflicting interests
The author(s) declared no potential conflicts of interest with respect to the research, authorship, and/or publication of this article.
Informed consent
Informed consent was obtained from all participants prior to their involvement in the study.
Data availability statement
The data supporting the findings of this study are available from the corresponding author upon reasonable request.
Supplemental material
Supplemental material for this article is available online.
References
Supplementary Material
Please find the following supplemental material available below.
For Open Access articles published under a Creative Commons License, all supplemental material carries the same license as the article it is associated with.
For non-Open Access articles published, all supplemental material carries a non-exclusive license, and permission requests for re-use of supplemental material or any part of supplemental material shall be sent directly to the copyright owner as specified in the copyright notice associated with the article.