
Abstract
This study synthesized semiconducting cobalt-doped zirconium oxide–graphitic carbon nitride (Co-ZrO2/g-C3N4) nanocomposites using a simple technique with low production cost and investigated the collective impact of Co and g-C3N4 on the efficiency of ZrO2 photocatalyst in degrading eosin yellow (EY) dye in synthetic wastewater. The Co-ZrO2/g-C3N4 composites were synthesized via the chemical co-precipitation technique. They were systematically analysed using X-ray powder diffraction (XRD), Fourier transform infrared spectroscopy (FTIR), ultraviolet-visible (UV-vis) spectrophotometry, scanning electron microscopy coupled with energy-dispersive X-ray spectroscopy (SEM–EDX) and dynamic light scattering (DLS). Structural analysis not only confirmed the successful integration of Co and g-C3N4 into ZrO2 but also showed the transformation of the monoclinic ZrO2 into the cubic phase on the addition of the dopant. The UV-vis characterization showed a slight enhancement in light absorption capacity by the Co-ZrO2/g-C3N4 composite system on increasing the concentration of cobalt with an associated decrease in the bandgap from 3.82 to 3.11 eV. The addition of Co and g-C3N4 into ZrO2 nanoparticles improved the performance of the virgin ZrO2 with degradation efficiencies from 30% up to 98% and rate constants (k) from

Introduction
As a consequence of rapid urbanization, industrialization, and population growth, about 2 million tonnes of waste pollutants are recklessly released daily into the public water supply rendering the water unsafe for humans and other lives in the ecosystem. 1 Given that 17%–20% of water pollution is attributable to dyeing industries and textile finishings, 2 the heavy dependence on dyes including Rhodamine B (RhB), Victoria blue, Rose Bengal, Indigo Red, Carmine, Red 120, Eriochrome, Eosin Y (EY), Methylene Blue (MB), Black-T (EBT) and Thymol blue, in the global clothing industries represents a significant environmental threat. 3 Dye-polluted effluents are non-biodegradable as they exhibit thermal and photoresistant stability, highly poisonous and coloured pigments that threaten the aquatic environment and human health. 4
Although research efforts aimed at industrial wastewater treatment, in general, dye-polluted effluents, in particular, such as flocculation, coagulation, ion exchange, photocatalysis and membrane filtration 5 have not been spared. The intractable nature of the challenge and the recent increasing concentrations of these dyes in our water sources globally demand highly effective, economically sustainable, and environmentally benign techniques. Among these methods, photocatalysis is often considered the most favourable due to its cost-effectiveness, complete removal of various pollutants, and minimal or no generation of secondary waste. 6 Metal-oxide-based semi-conductors including TiO2, WO3, SnO2, CeO2, ZrO2, ZnO and Fe2O37–11 have widely been employed in the field of photocatalysis for organic dye decomposition.
ZrO2 with a bandgap range of 5.0–5.85 eV12,13 semiconductor with an n-type electrical conductivity has recently attracted the attention of researchers due to its exceptional properties, such as high chemical and thermal stability, low thermal conductivity, high dielectric constant, high radiation hardness and high melting point.12,14,15 Moreover, pure zirconium oxide, commonly called zirconia, exists mainly in three different crystal structures: monoclinic (m-ZrO2), tetragonal (t-ZrO2) and cubic (c-ZrO2). Each of these structures has distinct properties and applications and can be controlled by factors, such as temperature, pressure and the use a of stabilizing agent. The ability to control and manipulate these crystal structures of zirconium oxide allows engineers and scientists to tailor the material for specific applications. 16 However, virgin ZrO2 has a wide bandgap and a limited surface area of only 100 m2/g. Again, there is a slow rate of generating photo-induced charge carriers but a less electron-hole separation time or high recombination rate. Pristine ZrO2 can only absorb UV light and therefore will decompose compounds in that region of light.17,18
Therefore, ZrO2-based nanocomposites that are visible light-active and possess advanced photocatalytic properties are more desirable for removing dyes from water. By doping pure ZrO2 with metallic elements, including Co, Gd, Ni and La, researchers have modified the surface acidity and oxygen vacancy concentration of nanocomposites thereby enhancing their structural, electrical and photocatalytic properties. 19 These dopants introduce additional energy levels within the energy gap of the host material which acts as trap centres to impede charge carrier recombination rate 20 leading to a long period of electron-hole separation. 21
Despite its recognition as not being entirely ‘green’ due to environmental concerns, Co when used reasonably is considered an effective dopant and has therefore enjoyed a wide range of applications. Co has many unique properties, such as varying electronic states, capable of replacing Co2+ in the host material’s crystal lattice without causing significant changes (due to their comparable ionic radii, that is: Co2+ = 0.74 Å and Zr4+ = 0.80 Å) 22 and also the capacity to increase the number of oxygen vacancies in ZrO2’s structure. For instance, Ahmed and Iqbal 22 confirmed the successful replacement of Co2+ in ZrO2 lattice with a mean crystalline size of 18.0 ± 1.7 nm, significant bandgap tuning from 3.70 to 2.12 eV, improved the dielectric electric constant up to 2.8 × 10⁴ with minimal loss and enhanced the photodegradation of MB dye by nearly 97%. Again, Reddy et al. 23 also synthesized Co-doped ZrO2 nanoparticles via a hydrothermal method to remove methyl orange (MO) under UV-vis light illumination within 100 min. They reported a bandgap decrease from 4.95 to 2.12 eV, which resulted in a remarkable decomposition efficiency of 93.7%. Co-doped nanocomposites have therefore received extensive photocatalytic applications in the environment and energy fields.21,24,25
Besides, a few studies have shown that compositing ZrO2 with g-C3N4 results in an excellent visible light absorption property, making it a good semiconductor for environmental remediation applications. g-C3N4 with a bandgap of 2.7 eV has peculiar properties, including efficient absorption of light and generation of electron-hole pairs, high physicochemical stability, cost-effectiveness and ecofriendliness which make it ideal for photocatalytic activity.26,27 g-C3N4 can be modified structurally and chemically to adjust its reactivity and structure, control its semiconducting characteristics and increase its catalytic uses. 28 For example, Chand and Mondal 29 reported a remarkable photodegradation efficiency of 94.12% when they applied g-C3N4/ZrO2 composite to degrade RhB dye.
The structural, optical and photocatalytic activities of metal oxides are believed to be influenced greatly by Co concentration. For instance, by varying Co concentration, Ahmed and Iqbal 22 observed shifts in bandgap and photocatalytic activity against MB dye. In another study, Jeba et al. 30 also asserted that Cu dopant concentration significantly affected the crystallite size and magnetic properties of ZrO2.
Nonetheless, as far as we are aware, a comprehensive study on the photoactivity of Co-ZrO2/g-C3N4 nanocomposites to photodegrade eosin yellow (EY) dye in wastewater is yet to be done. In addition, the Co concentration on the chemical and surface characteristics of ZrO2/g-C3N4 composites has not been explored in the literature.
This research therefore aimed primarily to synthesize and characterize Co-ZrO2/g-C3N4 nanocomposites for photodegradation of EY. g-C3N4 was synthesized via thermal polymerization, whereas the nanocomposites were prepared by simple but cost-effective chemical co-precipitation technique. UV-vis, XRD, FTIR, dynamic light scattering (DLS), and scanning electron microscopy (SEM) coupled with energy-dispersive X-ray spectroscopy (EDX) analyses were used to characterize the synthesized nanomaterials. The collective impacts of Co and g-C3N4 on the crystal structure, optical absorption and catalytic activities of ZrO2 photocatalyst have also been studied.
Experimental section
The following analytical-grade chemicals were procured from Sigma-Aldrich, (Germany): Urea (CH4N2O), cobalt (II) sulphate heptahydrate (Co(SO4)·7H2O), zirconium oxychloride octahydrate (ZrOCl2·8H2O), ammonium hydroxide (NH4OH) and ethylene glycol (C₂H₆O₂). None of these chemicals were further processed before being used.
Synthesis of g-C3N4
G-C3N4 was produced by heating urea to a high temperature, following a method from Praseetha et al. 31 An aluminium foil–covered crucible containing 35 g of urea was placed in a furnace and subjected to a temperature of 600°C for 180 min. After overnight cooling, the resultant g-C3N4 was ground into powder and used in the synthesis of the Co-ZrO2/g-C3N4 heterostructure.
Synthesis of series of Co-ZrO2/g-C3N4
The Co-doped ZrO2/g-C3N4 nanomaterials were synthesized by adopting the co-precipitation method used in the work by Agorku et al. 13 with slight modification. Typically, about 20 mg of g-C3N4 (0.2% relative to ZrO2) and 10 g of zirconium oxychloride octahydrate were mixed and dissolved in 200 mL of distilled water. While being magnetically stirred, 2 mL of ethylene glycol was added. Furthermore, appropriate amounts of cobalt (II) sulphate heptahydrate were introduced to achieve Co-to-Zr ratios ranging from 0.3 to 1.0 wt%. Afterwards, 25% of NH4OH was added dropwise to adjust the pH between 9 and 10. The reaction mixture was allowed to proceed for 30 min while being stirred. The resulting particles were centrifuged, washed severally using ethanol and deionized water and dried at 60°C for 24 h. The samples were then calcined at 500°C for 2 h. The synthesized Co-doped ZrO2/g-C3N4 was crushed into powder and stored for further analysis and catalytic application. A similar procedure was employed to synthesize bare ZrO2 and ZrO2/g-C3N4 heterostructure without the addition of Co(SO4)·7H2O or g-C3N4. The synthesis method described is graphically presented in Figure 1.

Schematic diagram showing the synthesis pathway for Co-ZrO2/g-C3N4 nanocomposites.
Co-doped ZrO2/g-C3N4 characterization
A variety of analytical methods were used to probe into the characteristics of the synthesized nanocomposites. X-ray powder diffraction (XRD) was used to examine the crystal structures of samples. Optical absorption properties of the as-prepared nanomaterials were also measured using ultraviolet-visible (US-vis) spectrophotometry. Other characteristics, such as functional groups and chemical bonding, morphology, elemental analysis, hydrodynamic particle size and zeta potential, were also studied using FTIR, SEM, EDX and DLS analyses. The Bruker D2 Phaser X-ray powder diffractometer (Bruker, Germany) was employed for the XRD analysis within 2θ values from 5° to 80°. The FTIR studies were carried out with a PerkinElmer Spectrum Two photometer (PerkinElmer, USA) for wave numbers between 400 and 4000 cm−1. In addition, a UV-1800 Shimadzu UV spectrophotometer (Shimadzu, Japan) was used to examine the light absorption behaviour of the prepared nanomaterials between the wavelengths of 200 and 800 nm. A Zeiss EVO MA 15 SEM equipment (Oxford Instruments, United Kingdom) was used to analyse the morphology and elemental investigations of the nanomaterials. The hydrodynamic particle size and surface charge were ascertained using the Malvern Zetasizer Ultra Nano series (Malvern Panalytical Limited, UK).
Photodegradation studies
To conduct an investigation into the photocatalytic activity, 100 mg of the photocatalyst was added to 100 mL of a 20 mg/L EY aqueous solution and stirred vigorously at room temperature for 30 min in the dark. It was then exposed to simulated solar light created with port 9600 full-spectrum solar simulators fitted with a 150 W ozone-free Xenon lamp adjusted at 10 cm. However, 5 mL of the solutions were carefully taken from the reactor every 30 min for 3 h using a syringe fitted with 0.4 µm filters made of polyvinylidene fluoride (PVDF) membrane. Absorbance measurements were done on each of the 5 mL samples to estimate the amount of the EY dye left after each 30-min time interval. The photodegradation performance of the nanomaterials was evaluated through kinetic studies and degradation efficiencies. Using Equation 1, the decomposition efficiency (%E) catalysts were calculated:

where C0 and Ct are the before and after concentrations of the dye.
Equation 2, which represents the simplified first-order kinetic model of Langmuir–Hinshelwood, was also employed to fit the light-induced catalytic degradation of the dye: 26

here k, c and co denote the rate constant, the solution of face concentration, and the concentration at t = 0, respectively.
Results and discussion
ZrO2, ZrO2/g-C3N4 and a number of Co and g-C3N4 co-doped ZrO2 photocatalysts have been synthesized successfully through co-precipitation approach. These synthesized samples were applied for the removal process of EY dye from synthetic wastewater. The nanomaterials obtained were analysed with FTIR, XRD, UV-vis, DLS, SEM and EDX techniques prior to the dye removal process.
FTIR analysis
FTIR spectroscopy was employed in the investigation of the functional groups on the as-synthesized photocatalysts. The FTIR spectra of photocatalysts are given in Figure 2 and consist of g-C3N4, ZrO2, ZrO2/g-C3N4 and (0.3%–1.0%) Co-ZrO2/g-C3N4.

FTIR spectra of g-C3N4, ZrO2, ZrO2/g-C3N4 and Co/g-C3N4 co-doped ZrO2 with different Co concentrations.
The bands between 3400 and 3500 cm−1 represent the stretching and distortion OH (hydroxyl group) bonds by water molecules that may adhere to zirconia’s surfaces.32,33 Aromatic heterocycles have stretching vibrations of C–N bonds that are very pronounced in g-C3N4 pattern. The frequency emitted by C–N bands of aromatic heterocycles occurs between 1185 and 1727 cm−1. 34 The band found at 3108–3320 cm−1, in which the N–H band is linked with the stretching vibration of NH2 groups in urea. A peak seen at around 773 cm−1 represents the breathing mode of triazine units found in carbon nitrides. 35
XRD analysis
The structural characteristics of the synthesized nanomaterials, such as crystal structure, crystallinity and crystallite size were obtained using XRD spectroscopy. The diffraction patterns of pure ZrO2, ZrO2/g-C3N4, (0.3%–1.0%) Co-ZrO2/g-C3N4 and g-C3N4 nanoparticles are seen in Figure 3.

XRD patterns of bare ZrO2, ZrO2/g-C3N4, Co/g-C3N4 co-doped ZrO2 with different Co concentrations and g-C3N4.
The patterns showed that the synthesized nanomaterials were polycrystalline except for 0.8% Co-ZrO2/g-C3N4 which appeared more amorphous-like material instead of a crystalline. Figure 3 showed the formation of g-C3N4 as two prominent peaks at around 2θ = 10.68° and 27.53°,
36
corresponding to (100) and (002) planes, respectively (JCPDS Card no. 87-1526).35,37 These two peaks can be related to the interlayer stacking sequence and interplanar structural arrangement of g-C3N4.38–40 Moreover, the diffraction patterns of bare ZrO2 showed 10 peaks at 2θ = 17.61°, 24.13°, 28.22°, 31.41°, 34.42°, 40.93°, 44.93°, 50.27°, 55.5° and 59.87° which are associated with the crystallographic planes denoted as (100), (011), (11
The mean particle size, D, was calculated using the full width at half maximum (FWHM), β, of the most intense peak, the wavelength of light, λ (1.5406 Å), the constant, K (0.89) and the Bragg’s angle, θ, which are described in the Debye–Scherrer’s formula (Equation 3): 47
The mean particle size was determined to be 27 nm.
SEM/EDX studies
The morphology and elemental distribution of the 0.8% Co-ZrO2/g-C3N4 nanocomposites was studied by SEM and EDX methods. The SEM image of the synthesized nanomaterial represented by Figure 4(a) highlights the sheet-like morphology of g-C3N4 46 functionalized with Co-ZrO2 crystal particles with irregular shapes and sizes.

(a) SEM image of 0.8% Co-ZrO2/g-C3N4, (b) EDX spectrum of 0.8% Co-ZrO2/g-C3N4; images depicting the elemental distribution of (c) C, (d) N, (e) O, (f) Co and (g) Zr at the highlighted area of SEM image.
Elemental mapping that was done within the selected area from the SEM image identifies the distribution of C, N, O, Co and Zr elements (Figure 4(c)–(g)). The elemental mapping of the observed area of Figure 4(a) illustrated that all elements distributed in each part were well distributed in Co-ZrO2/g-C3N4 nanocomposites. Also, Figure 4(b) represents the EDX spectra, where all five elements were confirmed, with their atomic and weight percentages. No impurity was observed in the EDX spectra, confirming the purity of the nanomaterials as corroborated by the XRD investigation.
Surface charge and particle size distribution studies
The Malvern Zetasizer was used to measure the electrophoretic and particle size movement of the particles suspended in deionized water at 25°C. From the spectrograph in Figure 4, the zeta potential (ZP) value was found to be −6.38 mV, indicating that the particles in the suspension carry a negative charge. This ZP is consistent with our previous report on La-doped ZrO2/g-C3N4. 48 The possibility of particle aggregation is suggested by the comparatively low value of ZP, which is consistent with the morphological studies reported in this work. This negative charge could emanate from the presence of ions or surface functional groups. One crucial metric that shows the stability of nanomaterials is the ZP (Figure 5). 49 The relatively low polydispersity index (PDI) of 0.311 suggests a narrow or good uniformity in particle size distribution. 50 The hydrodynamic particle size was found to be 230.1 nm. This value is greater than the average crystallite size obtained from the XRD analysis. The higher hydrodynamic particle size is indicative of the tendency of the nanoparticles to aggregate and form larger clusters in a solvent. 49

Size distribution by (a) intensity, (b) volume and (c) apparent zeta potential for the 0.8% Co-doped ZrO2/g-C3N4.
Optical absorption analysis
UV-visible spectrophotometric analysis was carried out to ascertain the optical behaviour of the synthesized nanomaterials. The wavelength range of 200–800 nm was employed in this study. The results are as presented in Figure 6.

Absorbance spectra of ZrO2, ZrO2/g-C3N4 and Co-ZrO2/g-C3N4 with varied Co concentrations.
Figure 6 shows that the fundamental absorption edge increased slightly towards a longer wavelength with increasing dopant concentration up to 0.8% Co, after which it decreased, suggesting a reduction in the optical bandgap. Hence, 0.8% Co is the optimal percentage concentration of dopant for the synthesis of Co-ZrO2/g-C3N4 in this study under the experimental conditions outlined earlier. This improvement in the optical absorption of ZrO2 resulting from the introduction of dopants into ZrO2 matrix may be attributed to the creation of dopant-induced defect states within the bandgap of the host material. These defect states are believed to enhance the creation of e–h pairs thereby impacting photocatalytic activity positively. 22
Using Stern’s relation provided in Equation 4, the bandgaps of the synthesized nanomaterials were calculated from the absorbance data: 51

where A represents the absorbance, k is a constant, hv signifies the photon energy, Eg denotes the energy gap and n takes values of 1 for direct-allowed transitions and 4 for indirect-allowed transitions. In this report, the value of n was taken as 1 because ZrO2 is a direct bandgap semiconductor.
52
Plotting

Stern’s plot of ZrO2, ZrO2/g-C3N4 and Co/g-C3N4 co-doped ZrO2 with different Co concentrations.
The bandgaps of the various synthesized photocatalysts with their degradation efficiencies, rate constants and R2 values.

Photocatalysis studies
The photoactivities of the synthesized nanoparticles were evaluated via EY dye degradation under UV-vis light illumination over 3 h. To analyse the decomposition processes, the maximum absorption peak of 510 nm 56 chosen for the EY was chosen. The photocatalytic degradation results for the various photocatalysts against EY dye are shown in Figure 8(a)–(c).
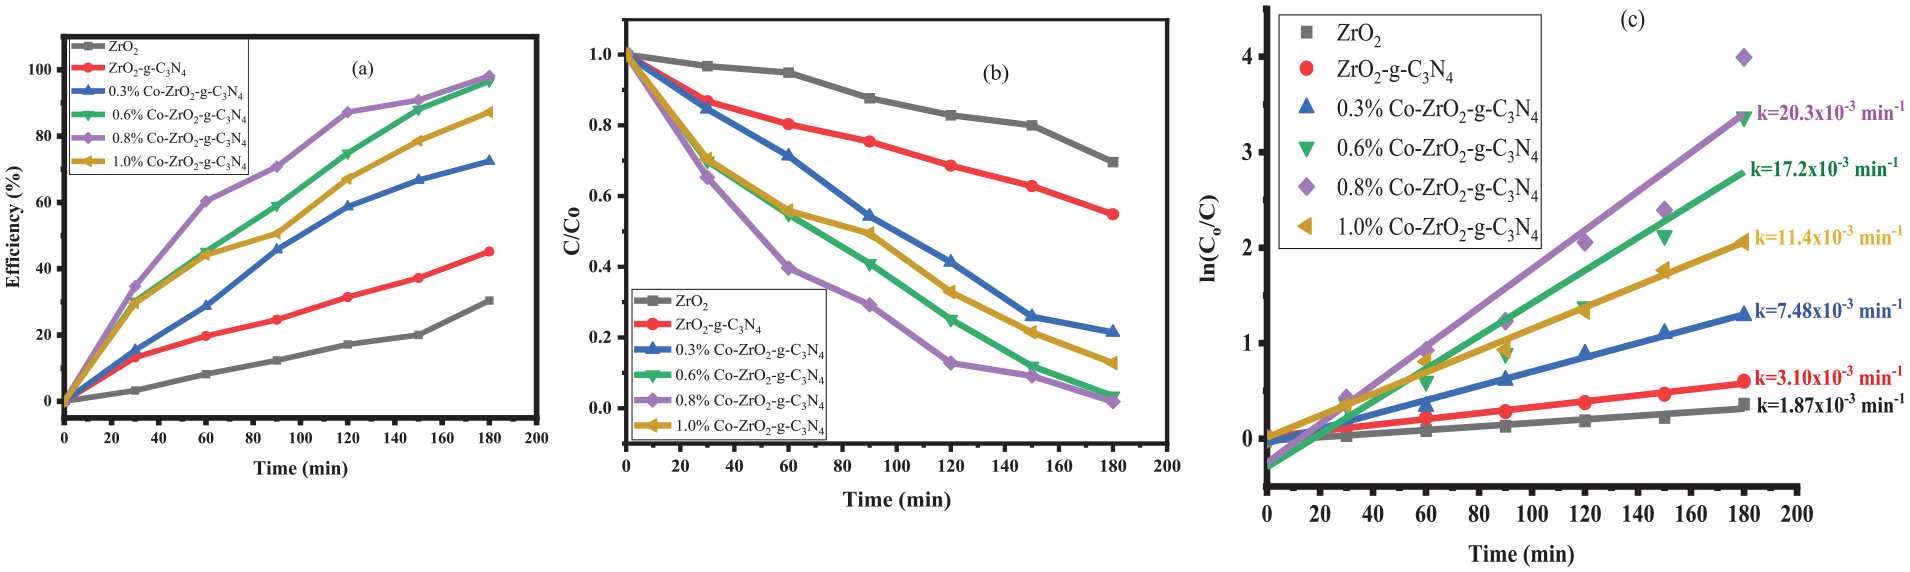
(a) Degradation efficiency, (b) degradation profile and (c) kinetic studies of ZrO2, ZrO2/g-C3N4 and Co/g-C3N4 co-doped ZrO2 with different Co concentrations.
The findings of the research that the photoactivity of the ZrO2 nanomaterial was enhanced by the incorporation of the Co and g-C3N4, as the degradation efficiency of the bare ZrO2 was increased by about threefolds. The increasing order of photocatalytic performance of the nanomaterials was ZrO2, ZrO2/g-C3N4, 0.3% Co-ZrO2/g-C3N4, 0.6% Co-ZrO2/g-C3N4, 1.0% Co-ZrO2/g-C3N4 and 0.8% Co-ZrO2/g-C3N4, respectively. Furthermore, as dopant concentration increased, the degradation efficiency also increased up to a maximum (98.2%) before decreasing slightly to 87.3%. The relatively poor performance of the bare ZrO2 (30.4%) may be attributed to its wide bandgap of 3.82 eV and high rate of charge carrier recombination. Besides, when the ZrO2/g-C3N4 was used, the decomposition efficiency increased to 45.2%. The degradation efficiencies for all the photocatalysts synthesized in this work are given in Table 1. These results compare favourably with up to the 93% in 120 min observed in the work by Wang et al.
46
who applied g-C3N4/Ni-doped ZrO2 for the decomposition of RhB. Vattikuti et al.
57
also reported up to 97% efficiency within 140 min using g-C3N4/ZrO2 against a mixture of RhB and CV. Detailed comparative studies between the current work and similar others in the literature have been given in Table 2. The performance of the heterostructure in this paper compares well with the reported values, suggesting it is a feasible agent for removing dyes. The observed degradation patterns indicated that the photodegradation of EY conforms to a pseudo-first-order kinetic model. Therefore, the rate constant (k) was estimated using Equation 2 and plotting ln(C/Co) versus irradiation time, t. That is, the slope of ln(C/Co) versus illumination time, t graph gives the value of k. The results of this plot are given in Figure 8(c) and the k values, with their respective R2 values can be found in Table 1. From the table, k-values for bare ZrO2, ZrO2/g-C3N4, 0.3% Co-ZrO2/g-C3N4, 0.6% Co-ZrO2/g-C3N4, 0.8% Co-ZrO2/g-C3N4% and 1.0% Co-ZrO2/g-C3N4 are, respectively,
Comparison between the current study and previous work.

Proposed mechanism of photocatalytic degradation
A catalyst’s conduction band (CB) and valence band (VB) edge positions influence its photocatalytic activity greatly in photocatalysis. 66 Consequently, by assessing the CB and VB energies of ZrO2 and g-C3N4 catalysts in the Co-ZrO2/g-C3N4 system, one will be able to provide an explanation for the EY dye degradation mechanism. Butler and Ginley model (Equations 5 and 6) were employed to determine VB energy (EVB) and CB energy (ECB) of ZrO2 and g-C3N4 in Co-ZrO2/g-C3N4 heterostructure. 67 The model strongly depends on semi-conductors’ free electron energy (Ee = 4.5 eV), absolute electronegativity (χ) and their bandgaps (Eg):


From literature, 4.72 and 5.91 eV were the electronegativity values of g-C3N4 and ZrO2, respectively.68,69 After substituting the forbidden band energies of ZrO2 (3.82 eV) and g-C3N4 (2.72 eV), their respective electronegativity values and the free-electron energy into Equations 5 and 6, the CB and VB edge positions were estimated to be −0.5 eV and +3.32 eV, and −1.14 eV and +1.58 eV, respectively, for of ZrO2 and g-C3N4.
Usually, lower reduction and oxidation potentials favour photogenerated charge carriers. Under these current experimental conditions, e–h separation primarily occurs at g-C4N4 when the composites under consideration are exposed to simulated solar light. This is because g-C3N4 has a lower bandgap of 2.72 eV as compared with 3.82 for ZrO2. 67 It was important to highlight that since the CB of g-C3N4 is more negative than the CB of ZrO2 (−0.5 eV), the light-induced electrons are transported straight into the CB of ZrO2. However, because the oxidation potential of O2/*O2− (−0.33 eV) is less negative compared with the CB edge potential of ZrO2 (−0.5 eV), the electrons in the CB of ZrO2 readily react with the surrounding O2 molecules to form *O2- which in turn attack the dye molecules to cause degradation.
Furthermore, the light-induced h+ is kept in the VB of g-C3N4 because the VB of ZrO2 is more positive than that of g-C3N4. The degradation of EY molecules into CO2 and H2O is directly facilitated by these holes in the VB of g-C3N4. The holes are not able to cause the formation of hydroxide radicals because the reduction potential of –OH (+2.38 eV) and H2O (2.71 eV) are more positive than the VB edge potential of g-C3N4 (1.58 eV).29,67,70,71
More importantly, the addition of metal ions (such as Co) into a semiconducting material is believed to result in the creation of a Schottky barrier at the metal–semiconductor interface, 72 which is said to enhance the degradation activities by serving as electron traps to capture the electrons at the surface of the semiconductor. 70 When the concentration of Co ions in ZrO2/g-C3N4 is carefully controlled, the e–h pair recombination rate is hindered by capturing the electrons into their empty d-orbitals and hence increasing e–h separation time. 73 As a result, the enhanced photocatalytic activity in the visible light region by the Co-ZrO2/g-C3N4 photocatalyst might be attributed to the mutually beneficial interaction occurring between Co and g-C3N4 within the ZrO2 framework. Figure 9 is an illustrative depiction of the photodegradation process elaborated in this work.

Proposed photocatalytic degradation mechanism of Co/g-C3N4 co-doped ZrO2 over EY dye.
Conclusion
Co-ZrO2/g-C3N4 nanocomposites were studied for their optical, structural and photocatalytic performance against EY in synthetic water. A simple chemical co-precipitation technique was used to synthesize the nanomaterials. A range of analytical methods such as XRD, SEM and FTIR were employed to confirm the successful synthesis of ZrO2, ZrO2/g-C3N4 and (0.3%–1.0%) Co-ZrO2/g-C3N4 photocatalysts. The structural examination revealed a full transformation from monoclinic to cubic structures in zirconium oxide due to inclusion of Co into ZrO2/g-C3N4 heterostructure. The relatively low PDI of 0.311 observed suggests a narrow or good uniformity in particle size distribution, while the ZP value of −6.38 mV confirms that the particles in the suspension carry a negative charge. The reduced bandgap from 3.82 to 3.11 eV also depicted enhanced optical absorption properties of the Co-doped ZrO2/g-C3N4 resulting in an improved photocatalytic efficiency of the virgin ZrO2 by over threefolds (30.4%–98.2%). The degradation rate constant, k also changed significantly by over 35.6 times; from
Limitations of the study
This work is limited to the synthesis and impact of Co-dopant concentration on the optical, structural and photocatalytic properties of Co-doped ZrO2/g-C3N4 against EY dye in artificial wastewater.
Footnotes
Acknowledgements
The authors thank the Department of Physics, Department of Chemistry, all at the Kwame Nkrumah University of Science and Technology (KNUST), Kumasi-Ghana and the Department of Chemical Sciences, University of Energy and Natural Resources, Sunyani-Ghana.
Author contributions
C.K.B. contributed to formal analysis, visualization and writing – original draft; C.K.B., P.O., M.H. and D.A.P. involved in investigation; M.H., D.A.P., B.Y.D., E.S.A., F.K.A. and R.K.N. participated in writing – review & editing; E.S.A. contributed to conceptualization; A.T. participated in data curation; D.A.P., E.S.A., F.K.A. and R.K.N. performed supervision.
Consent to participate
This paper has no human participants and informed consent is not required.
Consent for publication
The authors declare that they have no known competing financial interests or personal relationships that may affect the work reported in this paper.
Data availability
Data will be made available on request from the corresponding author.
Declaration of conflicting interests
The author(s) declared no potential conflicts of interest with respect to the research, authorship, and/or publication of this paper.
Ethical considerations
This paper does not contain any studies with human or animal participants.
Funding
The author(s) received no financial support for the research, authorship, and/or publication of this paper.