Two glyco-probes, GFP and GFN, which are derived from the condensation of 3-acetyl-5-C-(2,3-dihydroxy-1,4-anhydro-β-D-erythro-tetrofuranosyl)-2-methylfuran with benzaldehyde and 1-naphthaldehyde, respectively, are designed and synthesized. Of these two probes, GFP displays a selective and sensitive switch-on fluorescence response towards bovine serum albumin in phosphate-buffered saline over a wide pH range. Moreover, the fluorescence of this probe displays a good linear relationship with the bovine serum albumin concentration ranging from 0 to 0.8 mg/mL, and has a limit of detection as low as 3.7 nM. The stoichiometric ratio of bovine serum albumin /GFP is 1:1. This research paves the way for the development of glyco-probes for bovine serum albumin sensing.
The identification and quantification of specific proteins is an important issue in medical and clinical research.1 Serum albumins are one of the major soluble protein components present in the circulatory system that perform numerous physiological functions such as drug binding and the incorporation of fatty acids, bilirubin, steroids, and so on, into blood circulation.2–4 In the family of serum albumins, bovine serum albumin (BSA) is the most extensively studied and is a model protein for deciphering interactions with different small ligand molecules. It possesses 76% sequential analogs with human serum albumin (HSA). BSA is a large globular protein (66400 Da) that is composed of 585 amino acids with an abundance of lysine, arginine, glutamate, and aspartate residues, relatively few tryptophan and methionine molecules, and no carbohydrate units.5,6 The tertiary structure of BSA consists of three domains (I, II and III) and each domain contains two sub-domains (A and B).7 Anomalous levels of BSA are strongly related to numerous diseases and are viewed as diagnostic or analytical markers for various diseases.8 There are many traditional techniques available for BSA detection such as immunoassays, capillary electrophoresis and colorimetry.9,10 Fluorescent probes have been specifically attractive over other traditional protein detection methods, due to strong operability, high selectivity, instantaneous responses, low detection limits and high-throughput. However, the sensitive and selective sensing of BSA in aqueous medium is still a challenging task.
Carbohydrate and glyco-conjugates are abundant and play critical roles in many biological processes including cell–cell interactions, viral and bacterial infections, signal transduction and cell proliferation.11,12 Recently, a large number of glyco-probes have been developed, which have been applied in imaging, as bio/chemosensors, in drug delivery, and so on.13-18 Sugars possess excellent merits such as well-defined stereo-structures, low toxicity and high bioavailability. The rationale by which glyco-probes are designed typically relies on conjugation of a carbohydrate to a hydrophobic fluorescent dye to improve the water solubility, achieving full-aqueous sensing and targeted cell imaging.19 A number of glyco-probes have been developed based on this strategy for detecting BSA with good sensitivity and selectivity.20–23
In continuation of our previous work24,25 on the development of glyco-probe colorimetric chemosensors for ions and proteins, herein we have designed and synthesized two simple, water-compatible and easy to prepare chemosensors GFP and GFN as selective sensors for the BSA protein. Photophysical characterizations were carried out using UV visible absorption (UV-vis) and fluorescence emission spectroscopy. The solvent polarity, pH-dependent interactions and sensing ability of GFP have been thoroughly investigated.
Results and discussion
As illustrated in Scheme 1, the syntheses of GFP and GFN were accomplished in two steps. First, 3-acetyl-5-C-(2,3-dihydroxy-1,4-anhydro-β-D-erythro-tetrofuranosyl)-2-methylfuran (2) was prepared by a one-step Knoevenagel condensation from D-glucose according to the literature.26 Second, 3-acetyl-5-C-(2,3-dihydroxy-1,4-anhydro-β-D-erythro-tetrofuranosyl)-2-methylfuran (2) was condensed with benzaldehyde or 1-naphthaldehyde, via a pyrrolidine-catalysed aldol reaction to give C-glycosylated cinnamoyl furan derivatives GFP and GFN in high yields. Both GFP and GFN are known compounds.
Synthesis of the chemosensors GFP and GFN.
The absorption and emission spectra of GFP in various solvents are given in Figure 1(a) and (b) with a solute concentration of 10 μM. According to the absorption studies, there is no remarkable change in the absorption bands except for phosphate-buffered saline (PBS). However, noticeable changes can be found in the emission spectra with different solvents. As the solvent polarity increases from dichloromethane (DCM) to PBS, a red shift of about 10 nm (λmax, DCM 305 nm, and λmax, PBS 315 nm) was observed, which showed a sharp decrease in the fluorescent intensity. The decrease in fluorescence intensity might be attributed to the radiationless decay caused due to solvent–solute interactions and H-bonding in protic polar solvents.
(a) UV-vis and (b) fluorescence emission spectra of GFP in various solvents. (c) UV-vis and (d) fluorescence emission spectra of GFN in various solvents. The concentrations of GFP and GFN were 10 μM.
The UV-vis spectra of GFN display an absorption band at around 345 nm Figure 1(c). The absorption spectra did not alter much on increasing the solvent polarity. Upon excitation at 360 nm, a weak structured emission was observed at around 456 nm with similar intensity in all solvents except for dimethyl sulfoxide (DMSO) and PBS wherein enhanced intensity was observed (Figure 1(d)).
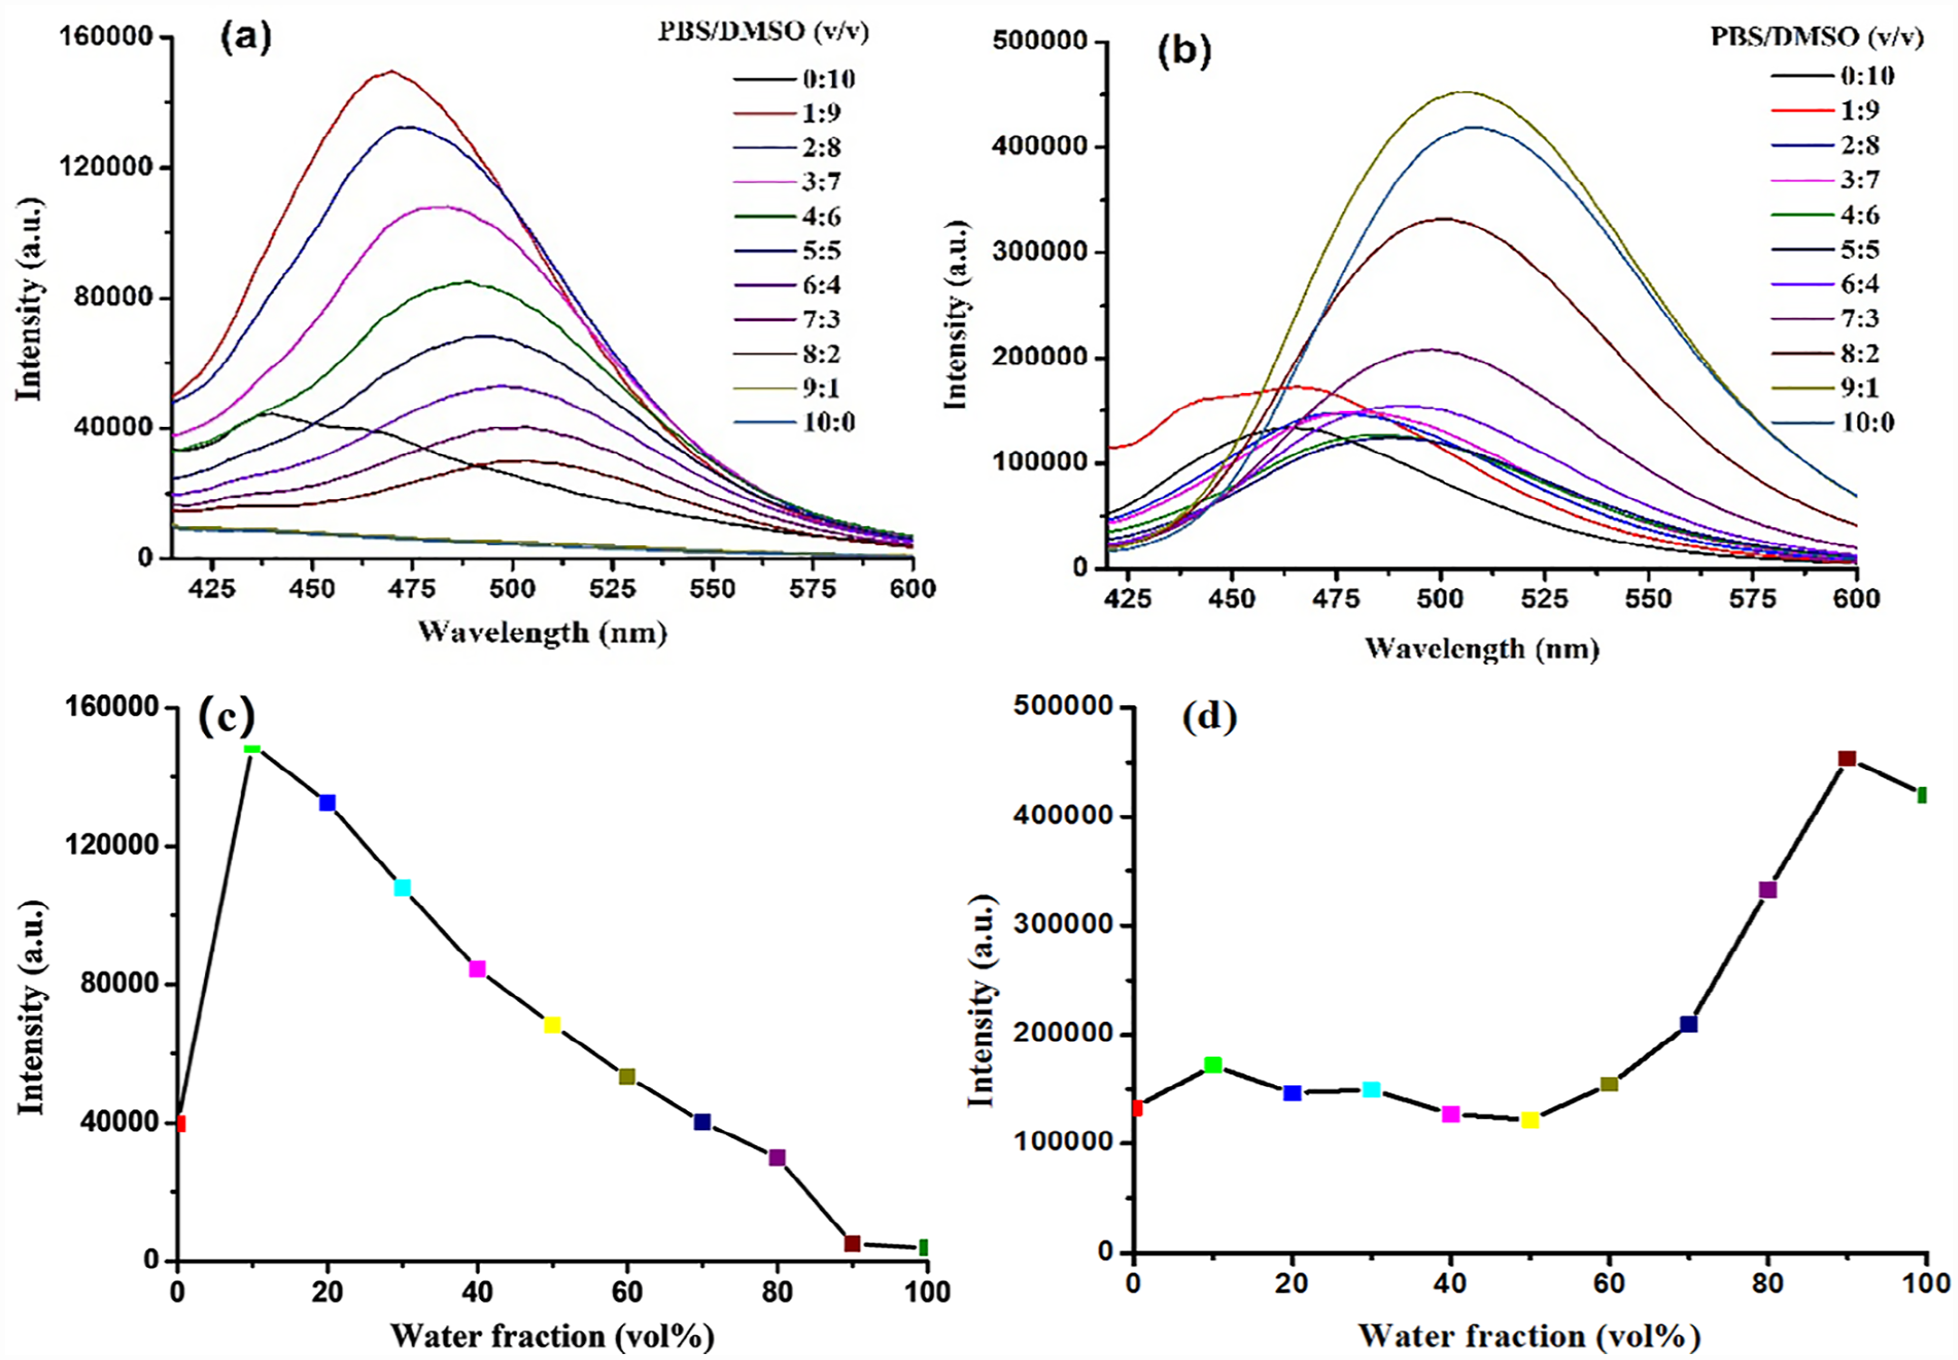
The fluorescent spectra of GFP in mixed solvents consisting of DMSO and PBS with different volume ratios (fw (the volume percentage of PBS in DMSO/PBS mixture) = 0, 10%, 20%, 30%, 40%, 50%, 60%, 70%, 80%, 90%, 100%) were measured and were shown in Figure 2(a) (A plot of the fluorescent intensity versus the PBS fraction is shown in Figure 2(c). The maximum emission intensity appeared when the medium was fw = 10%, and then decreased gradually on increasing the water content ratio. Interestingly, the fluorescence was nearly quenched in 100% PBS medium. The corresponding fluorescent spectra of GFN in different fractions of water were also measured (Figure 2(b)). When the water fractions were in the relatively low range (fw ⩽ 50%), the intensity change was less significant than that observed for GFP. The intensity of GFN was found to increase gradually and was saturated at fw = 90%, and then decreased at fw = 100%.
Effect of the water content on the PBS/DMSO mixed solvent emission spectra of (a) GFP and (b) GFN. Plots of the fluorescent intensities of (c) GFP and (d) GFN versus the compositions of the mixed solvent.
By comparing the fluorescent spectra of the two glyco-probes in DMSO/PBS mixtures, we can easily see that the fluorescent intensity of GFN enhances but decreases with GFP as a general trend. This phenomenon can be explained by the fact that GFN is prone to aggregate which restricts the intramolecular rotations of GFN and enhances fluorescence via aggregation-induced emission (AIE).
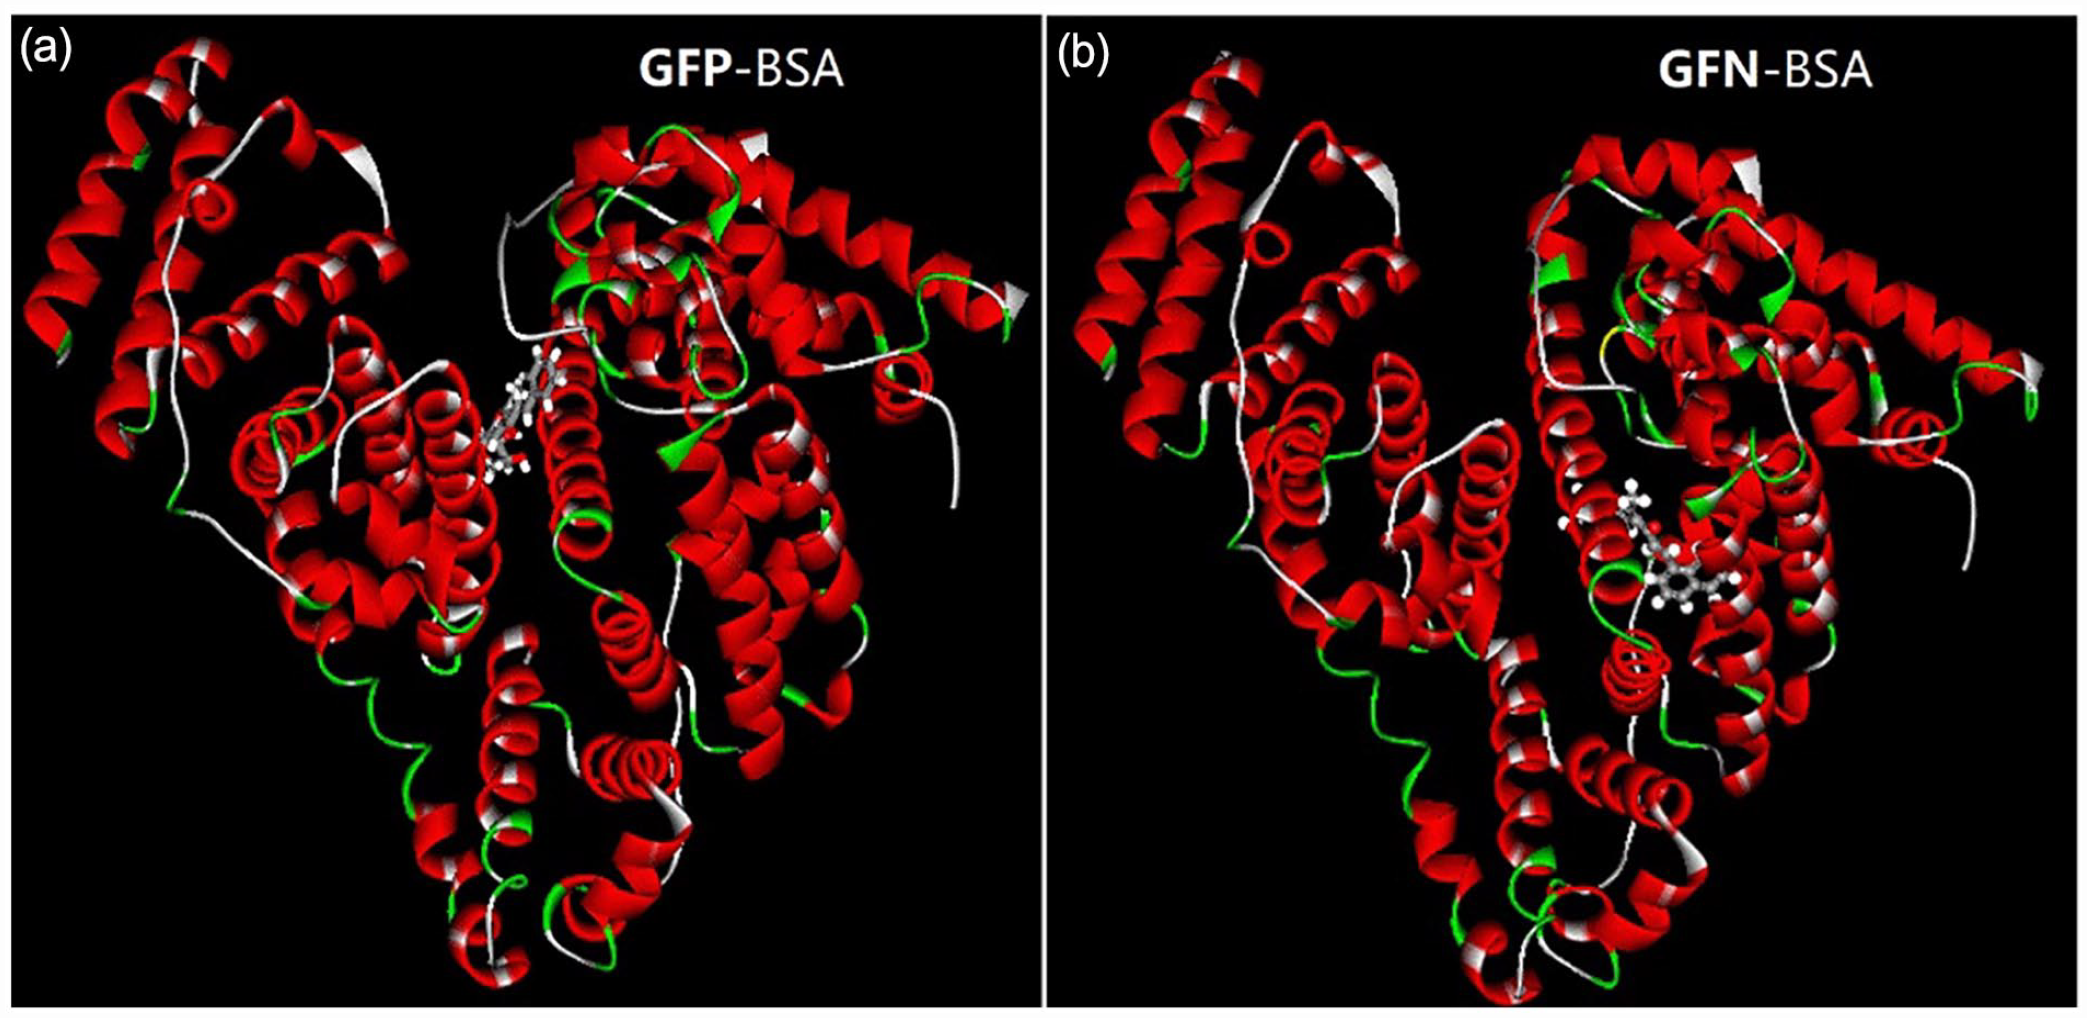
Discovery Studio (DS)27 is a professional life science molecular simulation software. The main functions of DS include ligand-protein interactions. Molecular docking was performed using the Discovery Studio 2.5 (DS 2.5) software package (Accelrys). The crystal structure of the three-dimensional structure of BSA used in the calculations was obtained from the protein data bank (PDB code: 4F5S, https://www.rcsb.org/). For docking studies, the DFT/B3LYP method with the 6-31G (d, p) basis set was employed to perform geometry optimizations and vibration analyses of GFP and GFN. The quantum chemistry calculations were carried out using the Gaussian 03 programme package with the default convergence criteria. Flexible docking was carried out with GFP and GFN (with optimized structures) as the ligands and the BSA molecule as a receptor to obtain the ligand, protein energy-minimized docked conformation. During the docking studies, all crystallographic water molecules and heteroatoms were removed from BSA and hydrogen atoms were added. The potential of the 3D structure of the protein was assigned according to the CHARMM force field. The minimum binding energy conformer was searched from 10 different conformers for the docking simulation by considering the values of Libdockscore. GFP and GFN all bind to the IIA domain of BSA; the highest LibDock score obtained for the GFP-BSA interactions was 112.492 (Figure 3). Thus, GFP was selected as a candidate for subsequent sensing test experiments with BSA.
Illustrations of the most stable docking structures of GFP (a, LibDock score is 112.492) and GFN (b, LibDock score is 73.8803) with the BSA molecule.
Steady-state fluorescence spectroscopy is the most effective and valuable technique to decipher the mechanism of the interaction between BSA and the ligand.28 We envisaged that GFP would sense the interaction with BSA via the generation of an enhanced fluorescence signal.29 During fluorescence titrations, the concentration of BSA added to GFP solutions was increased and their fluorescence was measured. Meanwhile, the emission changes of GFP upon addition of BSA were also determined. As shown in Figure 4(a) and (b), the fluorescence intensity of GFP at 554 nm gradually increased upon addition of BSA. We argue that the enhancement of the emission intensity was due to the hydrophobic interactions or hydrogen bonding due to the favourable thermodynamic parameters between GFP and BSA.30 Besides, with the addition of BSA, the maximum fluorescence emission of GFP was also slightly red-shifted by the effects of intramolecular charge transfer (ICT).
(a) Fluorescence response of GFP at 554 nm after adding different concentrations of BSA (0–1.6 mg/mL) in PBS. (b) Effect of concentration of BSA on the fluorescence response of GFP.
The limit of detection of BSA was calculated as three times the standard deviation of the background noise. The linear plot I/I0 vs BSA is shown in Figure 5. Fluorescence titration experiments clearly revealed that there is a linear relationship (R2 = 0.9872) between the emission intensity and the amount of BSA (0.1 mg/mL to 0.8 mg/mL), which is advantageous for quantitative analysis of [BSA], and the detection limit of GFP for BSA was calculated to be 3.7 nM. This indicates that GFP can be utilized for the detection of the BSA in the nanomolar concentration range. All the results above indicate that GFP can detect BSA with high sensitivity through sugar–protein interactions.
Linear fitting curve of the emission ratio I/I0 at 554 nm towards the concentration of BSA from 0.1–0.8 mg/mL.
To verify the wide range of applications of GFP as a sensitive probe for detecting BSA, the fluorescence characteristics of GFP towards BSA were studied with different pH buffers. The fluorescence emission intensities of GFP in the absence and presence of BSA at different pH values (pH = 3, 4, 5, 6, 7, 8, 9, 10, 11) were measured and the results are shown in Figure 6. The results indicate that GFP exhibits good pH stability. In the range of pH 3 to 11, the fluorescent intensity of GFP did not show significant changes. However, the fluorescence intensity of GFP after adding BSA decreased sharply when the pH value was increased to 9. The results imply that GFP-BSA was not stable under strongly alkaline conditions but was stable under relatively strong acidic conditions and weakly alkaline conditions. These results indicate that GFP might be utilized for the detection of BSA over a broad pH range of 3–8.
Effect of pH on the fluorescence intensity of GFP (10 μM) in the absence (black) and presence of BSA (red).
The stoichiometry of binding between GFP and BSA can be determined from the Job plot,31 where the concentration of both the probe and BSA remain fixed, but the mole fraction of both is altered. Here, we plot the fluorescence intensity of the solution, keeping a fixed concentration (2 μM) of probe and BSA. The plot of mole fraction vs fluorescence intensity revealed a single binding mode and an inflection point near 0.5 suggesting 1:1 chelation between GFP and BSA (Figure 7).
Job plots of the fluorescence intensities as a function of BSA.
Conclusions
Two novel BSA fluorescence probes, GFP and GFN, based on carbohydrate have been designed and synthesized. GFP demonstrated a better selectivity and sensitivity for BSA. The results also showed that GFP could recognize BSA with nanomolar limits of detection and can be used to detect BSA in the physiological pH range. The probe is easy to synthesize cheaply and provides a reasonable and extensive application detection system for sensing BSA through sugar-protein interactions.
Experimental
General
All reagents and solvents were commercially available and were used without further purification. Reactions were monitored by thin-layer chromatography using silica gel coated TLC plates and detection was performed by UV absorption (254 nm) where applicable, and by spraying with 50% sulfuric acid in ethanol followed by charring. 1H NMR spectra were recorded on a Bruker Avance III 400 MHz spectrometer (100 MHz for 13C NMR) with CDCl3 as the solvent and tetramethylsilane (TMS) as an internal standard. Fluorescence spectra were obtained by using a Shimadzu RF-5301PC fluorescence spectrometer equipped with a xenon lamp (1.0 cm quartz cells). Absorption spectra were measured with Lambda 35 UV-vis spectrophotometer. Elemental analyses were recorded on a Vario EL III elemental analyzer.
Synthesis of 3-acetyl-5-C-(2,3-dihydroxy-1,4-anhydro-β-D-erythro-tetrofuranosy l)-2-methylfuran (2)
Product 2 was obtained according to the reported literature.25 To a solution of glucose (1) (1.8 g, 10 mmol) and acetylacetone (1.54 mL, 15 mmol) in water (50 mL) was added CoCl2 (10%, 0.13 g) at room temperature. The reaction mixture was stirred at reflux (90 °C) for 8 h. After completion of the reaction as indicated by TLC, the reaction mixture was extracted with ethyl acetate. The organic layer was dried over anhydrous Na2SO4 and evaporated under reduced pressure. The residue was purified by recrystallization using petroleum ether and ethyl acetate to furnish pure compound (1.7 g, 87%). Yellow powder, mp 102.5-103.5 °C (lit.25 102–104 °C). IR form: 3385, 1670 cm-1. 1H NMR (400 MHz, CDCl3): δ = 6.57 (s, 1H), 4.61 (d, J = 6.2 Hz, 1H), 4.32 (t, J = 4.6 Hz, 2H), 4.19 (dd, J = 10.0, 4.3 Hz, 1H), 3.85 (dd, J = 13.0, 3.7 Hz, 2H), 3.76 (s, 1H), 2.52 (s, 3H), 2.34 (s, 3H). 13C NMR (100 MHz, CDCl3): δ = 193.9, 158.2, 149.2, 121.1, 108.4, 75.9, 73.7, 72.1, 70.0, 28.1, 13.6. Anal. Calcd for C11H14O5: C, 58.15; H, 6.43. Found: C, 58.22; H, 6.35.
Synthesis of (E)-1-[5-C-(1,4-Anhydro-β-D-erythrofuranosyl)-2-methylfuran]-3-phenylprop-2-en-1-one (GFP)
GFP was obtained following a literature protocol.32 To a solution of 3-acetyl-5-C-(2,3-dihydroxy-1,4-anhydro-β-D-erythro-tetrofuranosyl)-2-methylfuran (2) (405 mg, 1.80 mmol) in CH2Cl2 (10 mL) were added benzaldehyde (295 mg, 2.78 mmol) and pyrrolidine (30 mol%). After refluxing for 4 h, the reaction mixture was evaporated under reduced pressure and extracted with EtOAc. The EtOAc layer was dried over Na2SO4 and concentrated. The residue was purified by column chromatography. Yield 78%. Yellow powder; mp: 112-114 °C (lit. 111-113 °C). Rf = 0.25 (hexane-EtOAc, 1:2). 1H NMR (400 MHz, CDCl3): δ = 7.74 (d, J = 15.7 Hz, 1H, COCH=CH), 7.62 (m, 2H, Ar-H), 7.46-7.40 (m, 4H, Ar-H), 7.20 (d, J = 15.7 Hz, 1H, COCH=CH), 6.77 (s, 1H, H-4), 4.74 (d, J = 6.0 Hz, 1H, H-1’), 4.43 (m, 2H, H-4’), 4.38-4.24 (m, 2H, H-3’), 3.94 (dd, J = 10.0, 2.2 Hz, 1H, H-2’), 2.66 (s, 3H, CH3). 13C NMR (100 MHz, CDCl3): δ = 185.9, 160.0, 150.3, 143.5, 134.7, 130.5, 128.9, 128.4, 123.8, 122.4, 109.0, 77.2, 74.8, 73.3, 71.0, 14.7. Anal. Calcd for C18H18O5: C, 65.78; H, 5.77. Found: C, 65.46; H, 5.72.
Synthesis of (E)-1-[5-C-(1,4-Anhydro-β-D-erythrofuranosyl)-2-methylfuran]-3-naphthylprop-2-en-1-one (GFN)
To a solution of 1-naphthaldehyde (185 mg) and 3-acetyl-5-C-(2,3-dihydroxy-1,4-anhydro-β-D-erythro-tetrofuranosyl)-2-methylfuran (2) (123 mg) in CH2Cl2 (10 mL) were added pyrrolidine (30 mol%). After refluxing for 4 h, the reaction mixture was evaporated under reduced pressure and extracted with EtOAc. The EtOAc layer was dried over Na2SO4 and concentrated. The residue was purified by column chromatography. Yield 65%. Yellow powder, mp: 122-123 °C (lit.33 122-123 °C). Rf = 0.35 (hexane-EtOAc, 1:3). 1H NMR (400 MHz, CDCl3): δ = 8.62 (d, J = 15.4 Hz, 1H, COCH=CH), 8.29 (d, J = 8.3 Hz, 1H, Ar-H), 8.05-7.76 (m, 2H, Ar-H), 7.74-7.42 (m, 4H, Ar-H), 7.27 (s, 1H, COCH=CH), 6.81 (s, 1H, H-4), 4.77 (d, J = 5.1 Hz, 1H, H-1’), 4.47 (d, J = 3.9 Hz, 2H, H-4’), 4.33 (m, 1H, H-3’), 4.01-3.93 (m, 1H, H-2), 2.71 (s, 3H, CH3). 13C NMR (100 MHz, CDCl3): δ = 185.7, 160.3, 150.1, 140.5, 130.8, 128.8, 127.0, 126.3, 126.2, 125.4, 125.0, 123.4, 109.2, 77.2, 74.8, 73.3, 71.1, 14.7. Anal. Calcd for C22H20O5: C, 72.51; H, 5.53. Found: C, 72.38; H, 5.79.
General procedure for spectroscopic methods
Stock solutions of GFP and GFN were prepared in DMSO. BSA stock solution was prepared by dissolving 40 mg of BSA in 10 mL of isotonic and non-toxic PBS at 20 °C. The PBS was prepared using a mixture of disodium hydrogen phosphate, sodium dihydrogen phosphate and sodium chloride at pH 7.4.34 The ligand concentration of GFP/GFN was maintained at 10 μM during the absorption and fluorescent measurements.
Molecular docking
Molecular docking was performed for intermolecular interactions between GFP/GFN and BSA using the Discovery Studio 2.5 (DS 2.5) software package (Accelerys). The crystal structure of the three-dimensional structure of BSA used in the calculations was obtained from the protein data bank (PDB, code: 4F5S). The quantum chemistry calculations were carried out using Gaussian 03 programme package with default convergence criteria. The flexible docking between GFP/GFN and BSA was carried out with GFP/GFN (optimized structure) as a ligand and BSA as a receptor to obtain the ligand-protein (BSA) energy-minimized docked conformation. During the docking study, all crystallographic water molecules and heteroatoms were removed from BSA and hydrogen atoms were added. The potential of the 3D structure of the protein was assigned according to the CHARMM force field. The candidate ligand was determined for the docking simulations by considering the values of Libdockscore and the corresponding ligand was used for further analysis.
Calculation of limit of detection
The ratio of fluorescent intensity as a function of BSA concentration was plotted in order to for determine of the limit of detection. The LOD was calculated by the equation 3δ/slope (δ is the standard deviation of the measured value of the emission maxima of the blank solution over seven runs).35
Footnotes
Declaration of conflicting interests
The author(s) declared no potential conflicts of interest with respect to the research, authorship, and/or publication of this article.
Funding
The author(s) disclosed receipt of the following financial support for the research, authorship, and/or publication of this article: This work was supported by the Natural Science Foundation of Jiangsu Higher Education Institutions of China (Grant 18KJB150011 and 22KJB150021).
ORCID iD
Xiaomin Gu
References
1.
ZhangJJChaiXZHeXP, et al. Chem Soc Rev2019; 48: 683.
2.
BayraktutanTOnganerY.Dyes Pigm2017; 142: 62.
3.
ChakrabartyAMallickAHaldarB, et al. Biomacromolecules2007; 83: 920.