A novel fluorescent chemosensor containing a coumarin–thiourea unit and a β-N-glycosyl moiety is designed, synthesized, and characterized by 1H NMR, 13C NMR, and elemental analysis. The chemosensor can selectively and efficiently detect Hg2+ in CH3CN with a detection limit of 2.6 μM.
The fabrication and design of new chemosensors capable of selective and sensitive detection of toxic heavy metal ions have attracted considerable attention because of their wide use in biological, analytical, and environmental fields.1,2 Among various heavy metal ions, Hg2+ has been intensively studied owing to its toxic nature and threat to human life and ecosystems.3,4 Mercury pollution has sparked interest in the development of new tactics to monitor Hg2+ in biological and environmental samples.5 The Environmental Protection Agency (EPA) standard for the maximum allowable level of inorganic Hg2+ in drinking water is 2 ppb.6 Thus, chemosensors for the sensitive detection of Hg2+ by effective analytical methods are of high interest. Various techniques are reported for the recognition of Hg2+; however, fluorescence spectroscopy has gained importance over other techniques because of its simplicity, quick response, and high sensitivity.7–10
It is well-known that carbohydrates are very useful in the design of effective chemosensors because of their merits such as high hydrophilicity, flexible stereo-structures, low toxicity and biological compatibility,11,12 and are usually called fluorescent glycoconjugates. Many fluorophores—such as rhodamine,13,14 fluorescein,15 dicyanomethylene 4H-pyran,16 tetraphenylethylene,17 1,8-naphthalimide,18 tetraphenylethylene (TPE),19 and boron-dipyrromethene (BODIPY)20—have been conjugated with carbohydrates, producing structurally and functionally diverse fluorescent glycoclusters, which can recognize different ions or proteins.
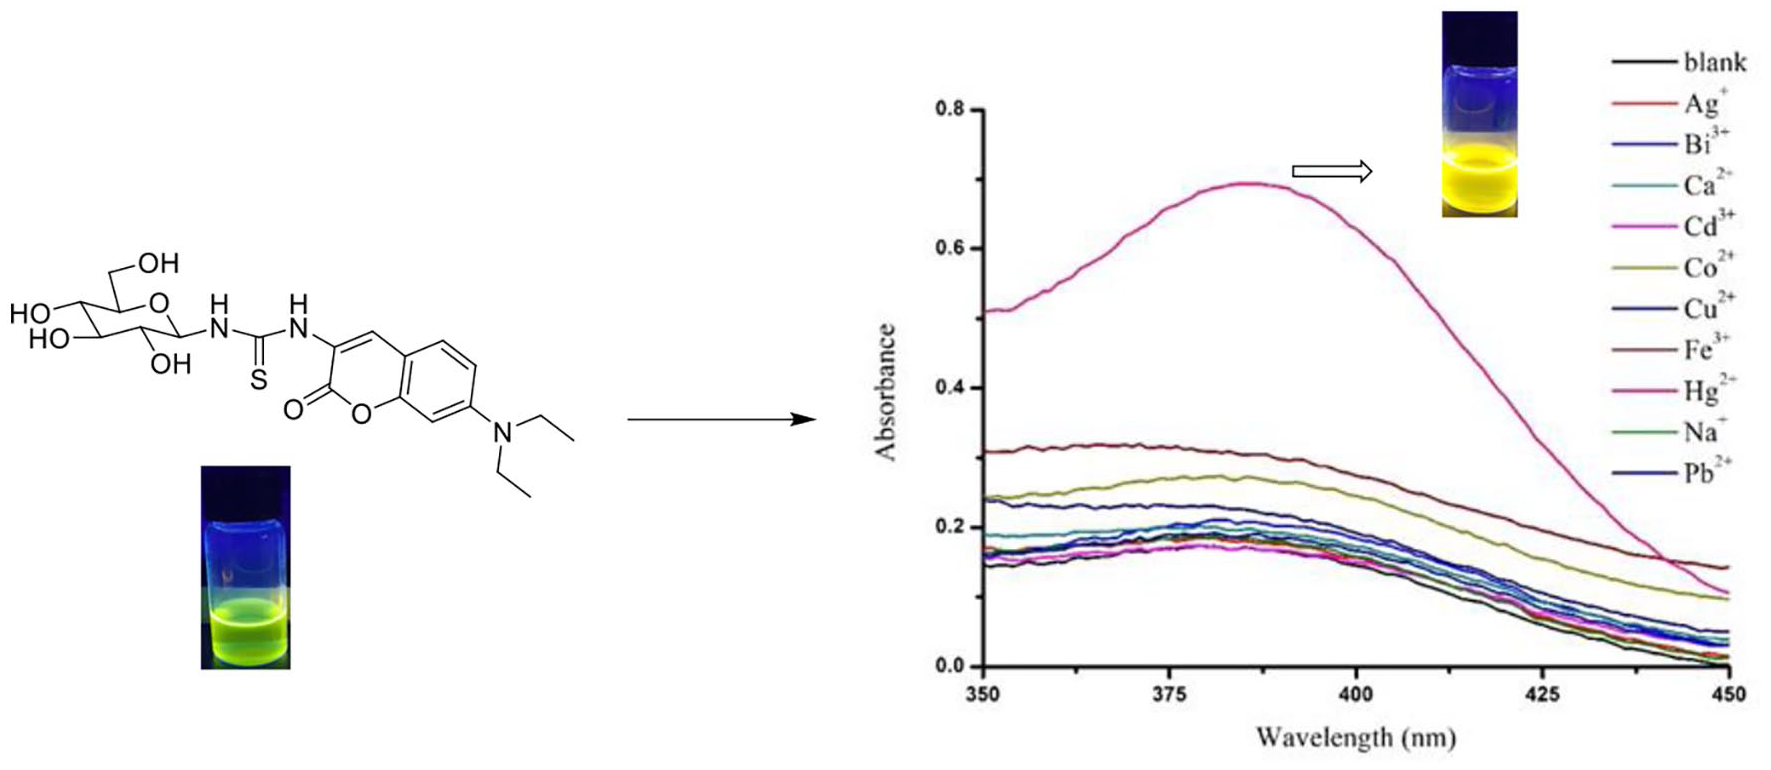
Recently, we reported sugar–rhodamine21 and sugar–coumarin22 fluorescent probes for detecting Hg2+ and bovine serum albumin (BSA), respectively. Investigations revealed that introducing a carbohydrate could significantly improve the hydrophilicity and selectivity. Inspired by these results, we report herein the design of a novel coumarin-based β-N-glycoside (GC1), which is connected by a thiourea group. As the sulfur atom in thiourea showed very good affinity toward mercury recognition,23,24 the sensor was used to detect Hg2+. The UV-Vis and fluorescence spectra were recorded to evaluate the detecting abilities of the chemosensor.
Results and discussion
The strategy undertaken for the synthesis of the target sensor GC1 is shown in Scheme 1 and involves the preparation of precursors 2 and 5. 2,3,4,6-β-O-acetyl-α-d-glucopyranosyl isothiocyanate (2) was synthesized from glucopyranosyl bromide (1).25 3-Amino-7-diethylaminochromene-2-one (5) was synthesized in two steps according to the literature.26GC2 was obtained in 87% yield by the condensation of 2 and 5, finally, cleavage of the acetyl groups in GC2 afforded sensor GC1.
To our delight, the sensor demonstrated comparatively good water solubility due to the polyhydroxy carbohydrate moiety, and it was fully soluble in 100% HEPES buffer solution. We initially examined the fluorescence spectral response of GC1 (50 μM) with and without addition of 10 equiv. of Hg2+ ions (500 μM) in 100% HEPES buffer solution and CH3CN, respectively. No discernible changes in the emission intensities were observed at 648 nm in 100% HEPES buffer (Figure 1(a)). However, a significant increase in the fluorescence at 670 nm occurred in CH3CN with Hg2+ ions, along with a bathochromic shift (625–670 nm) (Figure 1(b)). The good water solubility resulted in a higher background fluorescence intensity in 100% HEPES buffer, and this did not allow detection ion of Hg2+. The changes after adding Hg2+ in CH3CN were accompanied by a striking color change from green to bright yellow, while the color of the solution of GC1 on addition of other ions did not change (see inset, Figure 1(b)).
Fluorescence spectra of GC1 (50 μM) in the absence and presence of Hg2+ (500 μM) in 100% HEPES buffer solution (a) and CH3CN (b). λex: 385 nm and slit width (5, 5).
In order to verify the selectivity of compound GC1 for Hg2+, the UV-Vis spectral responses of GC1 (50 μM) were examined in CH3CN and with various nitrate salts of metal cations, such as Ag+, Bi3+, Cu2+, Co2+, Ca2+, Cd3+, Pb2+, Fe3+, Na+, and Hg2+. Among the metal ions tested, only Hg2+ led to an intense change in the visible range of 300–450 nm (Figure 2). Upon addition of 10 equiv. of Hg2+ (500 μM), a 16-fold absorption enhancement centered at 381 nm was observed.
UV-Vis spectra of GC1 (50 μM) after the addition of 10 equiv. of different metal cations (500 μM): Ag+, Bi3+, Cu2+, Co2+, Ca2+, Cd3+, Pb2+, Fe3+, Na+, and Hg2+ in CH3CN.
The recognition ability of GC1 toward various cations was also investigated by fluorescence spectroscopy (Figure 3). The studies showed that only minor changes were seen in the fluorescence intensity of GC1 (50 μM) upon titration with different metal cations (50 μM), apart from with Fe3+ and Hg2+ ions. The fluorescence emission of GC1 was enhanced on adding Fe3+ and Hg2+ ions, with Hg2+ ions exhibiting the highest fluorescence enhancement and the largest bathochromic shift.
The metal cation sensitivity of sensor GC1 (50 μM) in CH3CN solution was studied via fluorescence spectroscopy by excitation at 385 nm with addition of 10 equiv. of different metal cations (500 μM): Ag+, Bi3+, Cu2+, Co2+, Ca2+, Cd3+, Pb2+, Fe3+, Na+, and Hg2+. Slit width (5, 5).
Furthermore, to investigate the recognition properties with Hg2+, the changes in the fluorescence at different concentration ranges of Hg2+ were recorded upon addition of Hg2+ (0–24 equiv.). As shown in Figure 4(a), upon addition of increasing concentrations of Hg2+, the 625-nm band for GC1 significantly increased and shifted to a longer wavelength. The intensity of GC1 did not change until the amount of Hg2+ added reached 20 equiv. (1.0 mM).
(a) The fluorescence spectra of GC1 (50 μM) in the presence of various concentrations of Hg2+ (0–1.2 mM) in CH3CN, λex: 385 nm, slit width (5, 5). The inset shows the fluorescent intensity enhancement as a function of [Hg2+]. (b) The linear fit plot of the GC1–Hg2+ complex as a function of Hg2+ concentration showing a linear progression coefficient of 0.9987 in the range of 0–400 µM.
At the same time, working on the fluorescence spectra titration data from Figure 4(a), a plot of the fluorescence intensity of GC1 against the concentration of Hg2+ indicated a good linear relationship in the range of 0–400 µM (Figure 4(b)). The linear equation was y = 1.93971E6 + 29,245.5x (R2 = 0.99202); the detection limit was calculated according to the literature27 from this titration experiment, and it was found to be 2.6 μM, which represents a moderate level. Moreover, the fluorescence titration experiment clearly revealed that there is a linear relationship between the emission intensity and the concentration of Hg2+ (up to 4 M), which is advantageous for quantitative analysis of [Hg2+].
As shown in Figure 5, when 10 equiv. of Hg2+ were added, the fluorescence intensity of GC1 in CH3CN was enhanced and reached a maximum within 8 min. Furthermore, the fluorescence intensity of the GC1 solution with Hg2+ ions remained steady over the following 30 min. The rapid signaling of Hg2+ ions by GC1 could well satisfy the requirement of real-time and quick detection.
Time response of GC1 toward 10 equiv. of Hg2+ in CH3CN. [GC1] = 50 μM.
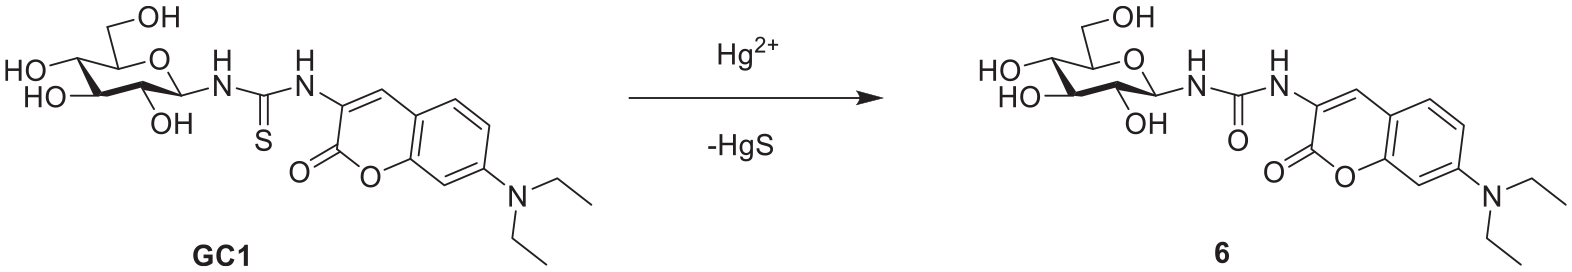
The proposed mechanism for detecting Hg2+ ions requires that the S atom in thiourea binds with thiophilic Hg2+ and promotes an Hg2+-induced desulfurization of the thiocarbonyl moiety, leading to an increase in the intramolecular charge transfer character of the excited-state coumarin moiety, which results in the fluorescent enhancement (Scheme 2). The hydrolytic conversion of thioureas into ureas catalyzed by certain metal ions is known to be very efficient. In the present case, the conversion was efficient exclusively with Hg2+ ions in acetonitrile.
Proposed mercury-sensing mechanism of GC1.
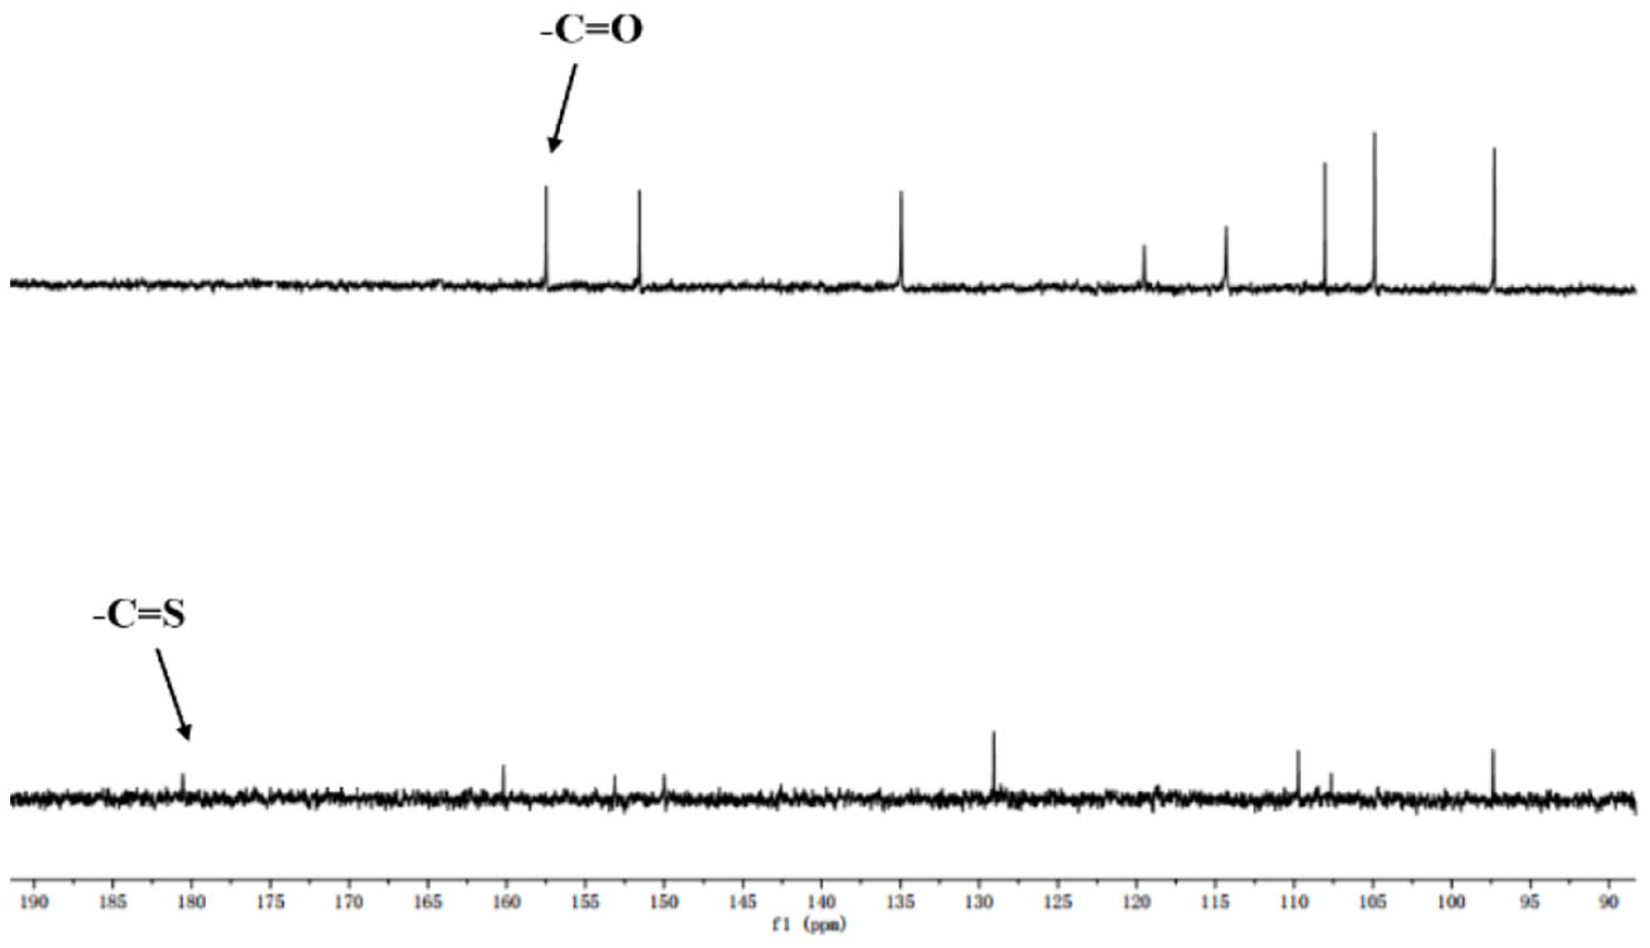
The proposed transformation was confirmed by 13C NMR measurements. On comparing the 13C NMR data of GC1 with that of GC1 in the presence of Hg2+ (Figure 6), we found that the C=S group at 180 ppm had vanished and that the C=O group at 160 ppm was present during the desulfurization process from GC1 to 6.
Partial 13C NMR spectra of GC1 and GC1 with 2 equiv. of Hg2+ in CDCl3.
Conclusion
In summary, we have designed and prepared a novel N-glycosyl coumarin-based fluorescent sensor GC1, which exhibited high selectivity toward Hg2+ over other metal ions. The sensor was based on the thiourea moiety as a binding site and a coumarin moiety as a signaling group. Upon addition of 10 equiv. of Hg2+, the color changed from green fluorescence to bright yellow. The sensor showed a lower detection limit of 2.6 µM, which indicated that it could potentially be useful as a probe for monitoring Hg2+ levels in physiological and environmental systems. This work may contribute to the development of more efficient and more useful Hg2+ probes.
Experimental section
General
All chemicals were of analytical grade and were purchased from commercial sources and used without further purification. Solvents were dried before use over 3 or 4 Å molecular sieves according to standard procedures. Reactions were monitored using thin-layer chromatography on silica gel–coated thin layer chromatography (TLC) plates, and the detection was performed by UV absorption (254 nm) where applicable, and by spraying with 50% sulfuric acid in ethanol followed by charring at 150 °C. Column chromatography was performed on silica gel (200–300 mesh) using petroleum ether (60–80 °C) or petroleum ether–ethyl acetate mixtures as eluents. 1H and 13C NMR spectra were recorded on a Bruker Avance III 400 MHz spectrometer. Elemental analyses were obtained using a Vario EL III elemental analyzer. The UV-Vis absorption and fluorescence spectra were recorded with a TU-1901 spectrophotometer and a Fluoromax-4 spectrofluorometer, respectively.
To a solution of 4 Å molecular sieves in anhydrous CH3CN (50 mL) was added tetrabutylammonium bromide (0.4 g, 1.2 mmol) and KSCN (0.2 g, 2.4 mmol). The mixture was stirred at room temperature (RT) for 2 h. Next, 2,3,4,6-penta-O-acetyl-α-d-glucopyranosyl bromide (0.5 g, 1.2 mmol) was added to the reaction mixture, which was stirred at RT for another 2 h. After completion, the reaction mixture was filtered, the solvent was removed under reduced pressure and the product was purified by silica gel column chromatography to afford 2,3,4,6-penta-O-acetyl-α-d-glucopyranosyl isothiocyanate (2) as a white powder (0.3 g, 60%), m.p. = 111.7–112.5 °C (lit.28 m.p. = 112–113 °C). 1H NMR (400 MHz, CDCl3): δ 6.64 (d, J = 4.0 Hz, 1H), 5.59 (t, J = 9.7 Hz, 1H), 5.19 (s, 1H), 4.87 (dd, J = 10.0, 4.0 Hz, 1H), 4.35 (d, J = 10.8 Hz, 2H), 4.16 (d, J = 10.6 Hz, 1H), 2.13 (s, 3H), 2.12 (s, 3H), 2.08 (s, 3H), 2.06 (s, 3H). 13C NMR (100 MHz, CDCl3): δ 170.50, 170.04, 169.17, 168.99, 144.25, 83.49, 77.20, 74.06, 72.49, 71.89, 67.68, 61.50, 20.64, 20.47. Anal. calcd for C15H19NO9S: C, 46.27; H, 4.92; N, 3.60; S, 8.23; found: C, 46.54; H, 4.89; N, 3.56; S, 8.32.
7-Diethylamino-3-nitrochromene-2-one (4)
A mixture of 4-diethylaminosalicylaldehyde (0.4 g, 2.1 mmol), ethyl nitroacetate (0.3 mL, 3.0 mmol), piperidine (0.1 mL) and glacial acetic acid (0.2 mL) in n-BuOH (20 mL) was refluxed for 9 h. An orange solid formed while cooling which was filtered and washed with n-BuOH (2 × 10 mL) and finally dried under vacuum to give an orange solid (0.5 g, 90%), m.p. = 169.2–169.8 °C (lit.29 m.p. = 170 °C). 1H NMR (400 MHz, CDCl3): δ 8.70 (s), 7.42 (d, 1H, J = 9.0 Hz), 6.68 (dd, 1H, J = 9.2, 2.6 Hz), 6.46 (s, 1H), 3.47 (q, 4H, J = 7.1 Hz), 1.25 (t, 6H, J = 7.2 Hz). 13C NMR (100 MHz, CDCl3): δ 158.80, 156.57, 154.55, 143.21, 138.15, 132.54, 111.12, 106.27, 96.96, 45.50, 12.42. Anal. calcd for C13H14N2O4: C, 59.54; H, 5.38; N, 10.68; found: C, 59.36; H, 5.50; N, 10.58.
3-Amino-7-diethylamino-chromene-2-one (5)
The compound 5 was synthesized according to the literature.30 To a 100-mL round-bottomed flask were added SnCl2 (1.5 g, 7.9 mmol) and 15% HCl (5 mL). 7-Diethylamino-3-nitrochromene-2-one (4) (0.5 g, 1.9 mmol) was added portionwise, and the solution was stirred at RT for 6 h. A 5-M solution of NaOH was added to neutralize the excess acid. The aqueous phase was extracted with ethyl acetate (3 × 15 mL). The combined organic layer was dried over anhydrous Na2SO4, filtered and evaporated to dryness. Purification by column chromatography gave a yellow solid, which was directly used for the next step without characterization.
Synthesis of GC2
To a solution of 3-amino-7-diethylaminochromene-2-one (5) (0.10 g, 0.43 mmol) in THF (10 mL) was added 2,3,4,6-penta-O-acetyl-α-d-glucopyranosyl isothiocyanate (2) (0.15 g, 0.38 mmol), and the reaction resulting mixture was stirred at RT for 2 h. After completion of the reaction, the solvent was removed under reduced pressure and the product was purified by silica gel column chromatography to afford GC2 (0.21 g, 87%), yellow powder, m.p. = 117.6–118.1 °C. 1H NMR (400 MHz, CDCl3): δ 8.97 (s, 1H), 8.58 (s, 1H), 7.32 (d, J = 8.8 Hz, 1H), 7.17 (t, J = 9.0 Hz, 1H), 6.63 (dd, J = 8.9, 2.4 Hz, 1H), 6.52 (d, J = 2.2 Hz, 1H), 5.37 (t, J = 9.4 Hz, 1H), 5.18-5.00 (m, 2H), 4.32 (ddd, J = 21.6, 12.2, 4.4 Hz, 1H), 4.24-4.15 (m, 1H), 3.92 (dd, J = 10.1, 2.2 Hz, 1H), 3.42 (q, J = 7.1 Hz, 4H), 2.09 (s, 3H), 2.08 (s, 3H), 2.04 (s, 3H), 2.02 (s, 3H), 1.60 (t, 6H). 13C NMR (100MHz, CDCl3): δ = 180.57, 171.34, 170.67, 169.86, 169.54, 160.20, 155.46, 152.54, 150.01, 129.0, 109.74, 107.82, 101.38, 97.38, 82.35, 77.25, 73.42, 72.88, 70.59, 68.18, 61.55, 60.37, 44.79, 20.71, 14.18, 12.44. Anal. calcd for C28H35N3O11S: C, 54.10; H, 5.68; N, 6.76; S, 5.16; found: C, 54.33; H, 5.72; N, 6.66; S, 5.07.
Synthesis of GC1
To a solution of sodium methoxide (60 mg, 1.1 mmol) in 20 mL methanol (20 mL) was added GC2 (110 mg, 0.2 mmol), and the resulting mixture was stirred at RT for 2 h. After completion of the reaction, the solvent was removed under reduced pressure and the product was purified by silica gel column chromatography to afford GC1 (0.05 g, 63%), orange powder, m.p. = 105.2–105.7 °C. 1H NMR (400 MHz, MeOD): δ 7.30 (d, J = 8.9 Hz, 1H), 6.75 (s, 1H), 6.37 (dd, J = 8.9, 2.3 Hz, 1H), 6.24 (d, J = 2.2 Hz, 1H), 5.77 (s, 1H), 4.62 (d, J = 6.6 Hz, 1H), 3.99-3.85 (m, 1H), 3.74 (dd, J = 12.2, 5.1 Hz, 1H), 3.55-3.41 (m, 9H), 1.28-1.20 (m, 8H). 13C NMR (100 MHz, MeOD): δ 181.49, 161.57, 157.49, 151.57, 134.93, 119.52, 114.32, 108.04, 104.89, 97.30, 79.65, 77.94, 69.91, 68.33, 61.41, 44.15, 29.33, 11.60. Anal. calcd for C20H27N3O7S: C, 52.97; H, 6.00; N, 9.27; S, 7.07; found: C, 52.71; H, 6.09; N, 9.36; S, 7.14.
General procedure for spectroscopic measurements
Stock solutions (1 M in deionized water) of the aqueous nitrate salt of Ag+, Bi3+, Cu2+, Co2+, Ca2+, Cd3+, Pb2+, Fe3+, Na+, or Hg2+ were prepared in 10 mL volumetric flasks. A high concentration of the stock solution GC1 (1 M in CH3CN) was also prepared. Next, 200 μL of the GC1 stock solution and 200 μL of the metal cations were measured under colorimetric ware. Moreover, diluting to 4 mL with CH3CN gave a final concentration of 50 μM of GC1 and 500 μM of the metal cation. Fluorescence titration studies were performed taking a 3mL solution of GC1 (50 μM) in a cuvette and gradually increasing the concentration of the metal ion (0–1.2 mM). For all the measurements, the concentration of GC1 was 50 μM. After mixing for a few seconds, the UV-Vis and fluorescence spectra were recorded at RT. The fluorescence spectra were measured similarly with a slit width of 5 nm × 5 nm.
Detection limit
The detection limit was calculated on the basis of the fluorescence titration. The fluorescence emission spectrum of GC1 was measured 10 times. To measure the slope, the fluorescence emission was plotted as a function of the concentration of Hg2+ from the titration experiment. The detection limit was then calculated using the following equation: Detection limit = 3σ/k, where σ is the standard deviation of the blank measurement, and k is the slope between the fluorescence emission intensity versus [Hg2+].
Footnotes
Declaration of conflict interests
The author(s) declared no potential conflicts of interest with respect to the research, authorship, and/or publication of this article.
Funding
The author(s) disclosed receipt of the following financial support for the research, authorship, and/or publication of this article: The authors are grateful for the financial support from the Natural Science Foundation of Jiangsu (no. 18KJB150011).
ORCID iD
Xiaomin Gu
References
1.
KimHNRenWXKimJS, et al. Chem Soc Rev2012; 41: 3210–3244.
2.
NolanEMLippardSJ.Chem Rev2008; 108: 3443.
3.
NataleFDLanciaAMolinoA, et al. J Hazard Mater2006; 132: 220.
4.
TuryanIMandlerD.Nature1993; 362: 703.
5.
GuoZQParkSYoonJY, et al. Chem Soc Rev2014; 43: 16.
6.
Mercury Update: Impact on Fish Advisories EPA, Fact Sheet EPA-823-F-01-011.Washington, DC: EPA and Office of Water, 2001.
7.
LakowiczJR. Principles of fluorescence spectroscopy, Chapters 9 and 13, 201.
8.
ZhangXLXiaoYQianXH.Angew Chem Int Ed2008; 120: 8145.
9.
QuangDTKimJS.Chem Rev2010; 110: 6280.
10.
DaiDHYangJWangD.Adv Funct Mater2020; 31: 2006168.
11.
AgrahariAKBosePJaiswalMK, et al. Chem Rev2021; 13: 7638.
12.
ThomasBYanKCHuXL, et al. Chem Soc Rev2020; 49: 593.
13.
ChenZJHuWWangM, et al. Carbohydr Res2016; 429: 81.
14.
LiKBZhangHLZhuB, et al. Dyes Pigments2014; 102: 273.
15.
RajasekarMKhanSMDevarajSN, et al. Carbohydr Res2011; 346: 1776.
16.
JiDKChenGRHeXP, et al. Adv Funct Mater2015; 25: 3483.