
Abstract
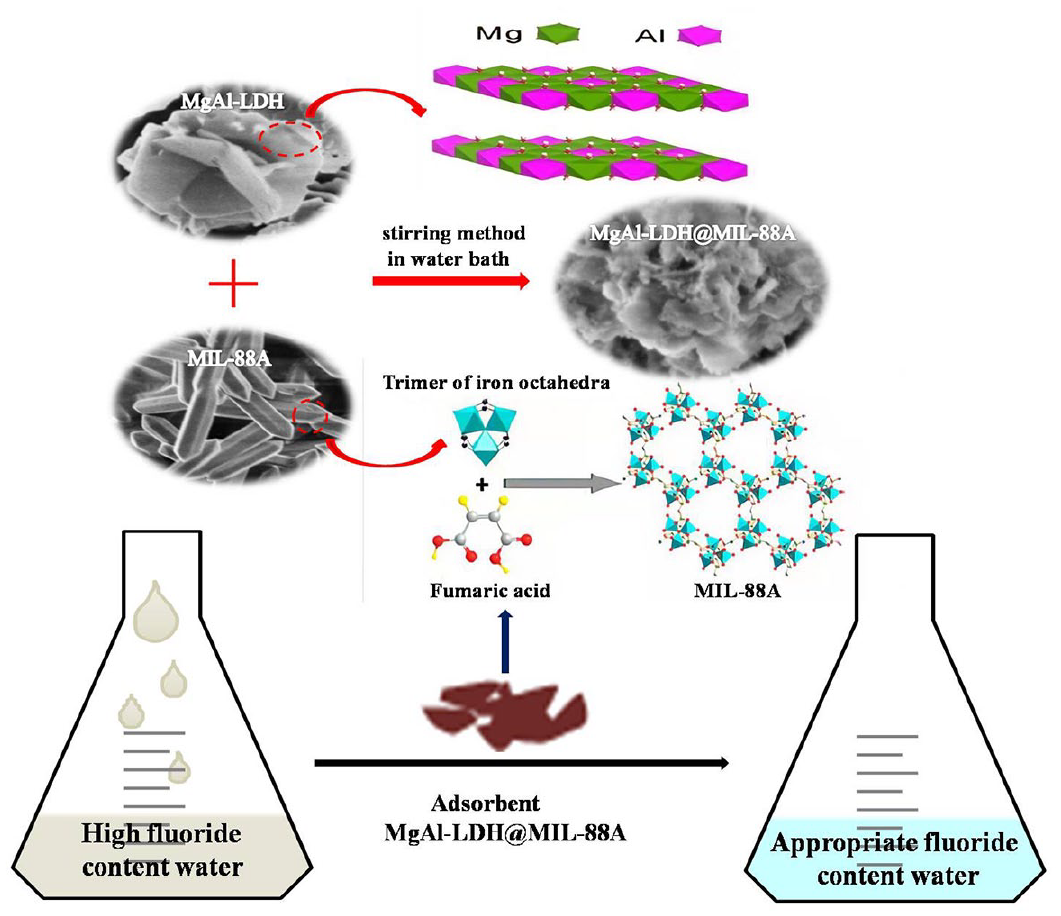
MgAl-LDH@MIL-88A as an effective adsorbent was successfully prepared by a simple stirring method in water bath through loading MIL-88A onto the surface of flowerlike MgAl-LDH, which was synthesized via solvothermal method. Interestingly, the results of characterizations showed that the MIL-88A could still grow, but extrude the brucite-like layers of MgAl-LDH. The influences of initial solution pH, contact time, temperature, and co-existing ions on the adsorption performance of MgAl-LDH@MIL-88A were studied systematically by batch static adsorption experiments. It was found that MgAl-LDH@MIL-88A represented the highest adsorption loading of fluoride (14.00 mg g−1) at initial pH 7.0 in 420 min. The uptake process was described appropriately by the pseudo-second-order, the Temkin and the Freundlich isotherm models. The thermodynamic parameters confirmed the endothermic and spontaneous nature of adsorption. MgAl-LDH@MIL-88A was the green adsorbent as the residual mental contents ([Mg2+] = 1.095 mg L−1, [Fe3+] = 0.007 mg L−1, [Al3+] = 0.076 mg L−1) after adsorption met the Chinese sanitary standard for drinking water (GB 5749-2006). The mechanism of fluoride removal by MgAl-LDH@MIL-88A involved the electrostatic interactions between Fe3+ of MIL-88A and fluoride, and ligand exchange among hydroxyl groups of MgAl-LDH, carboxylate groups of the C4H4O4 and fluoride.
Highlights
MgAl-LDH@MIL-88A was successfully prepared by solvothermal method and stirring method in water bath.
MgAl-LDH@MIL-88A was the green adsorbent.
The adsorption process met the pseudo-second-order, the Temkin, and the Freundlich isotherm models.
Introduction
Fluorine is an essential element in human body, albeit minor, and widely exists in human’s living environment. Fluoride ions can be found in wastewater from the fluoride chemical industry, fertilizer and glass-manufacturing industries, as well as the high-tech industry.1,2 The discharge of such wastewater into the surface water will cause the contamination of groundwater. Groundwater is a major source of human intake of fluoride. 3 The World Health Organization (WHO) had set a maximum concentration level of fluoride in drinking water is 1.5 mg L−1. 4 However, the groundwater with high fluoride content is widely distributed in the world. Long-term drinking of water with high concentration of fluoride will lead to bone disease, mottling of teeth, thyroid disorder, brain damage, even cancer.5–7 There are about more than 200 million people from developed and developing nations that are endemic for fluorosis, particularly in India, China, Pakistan, and Africa. 8 Therefore, eliminating fluoride from drinking water becomes a worldwide hot concern. Until now, there are a mass of proven defluoridation methods, namely, electrochemical separation, 9 electrodialysis, 10 precipitation, 11 ionic exchange, 12 adsorption,13–17 and nanofiltration. 18 Of these, adsorption is still considered to be the most effective one and the most extensively used one in terms of its relatively low cost, cost-effectiveness, simplicity of design, and ease of operation. 19
MOFs, namely are the metal organic frameworks, which are assembled alone by the polyfunctional molecular building blocks and metal ions or metal cluster connecting nodes.20,21 As a new type of porous crystalline materials, MOFs have advantages of easily tailored chemical properties, high surface area, well-distributed, and adjustable pores, which are birthing abundant applications in catalysis, adsorption, gas storage, drug delivery, and so on.22,23 Recently, various studies have confirmed the promise of MOFs in application of adsorption. For example, Chenghong Wang groups synthesized water stable Zr-MOF (UiO-66) and first applied it in arsenic pollutant removal from water; 24 Li et al. 25 reported the use of MOF-808 as an excellent adsorbent for the removal of arsenic, and demonstrated its outstanding chemical stability and reusability; Li et al. 26 prepared ZIF-8 and ZIF-67 using mixed-base ammonium hydroxide and triethylamine (TEA), and compared their adsorption performance for neutral rhodamine B (RB), anionic methyl orange (MO), and cationic methylene blue (MB); Haichao Li et al. 27 fabricated the PCN-222 and studied its adsorption performance for numerous anionic and cationic dyes individually and together in solution. Unlike most of MOFs are prepared using organic solvent, MIL-88A is prepared by the coordination of fumaric acid and FeCl3·6H2O just in the water.28,29 Besides, the large swelling effect of MIL-88A is very favorable for the adsorption of fluoride. That is, the fluoride can be easily adsorbed onto the reaction sites through this large volume swelling.29,30 Nevertheless, free-standing MIL-88A is unstable and prone to agglomeration and deterioration, which causes a serious issue in practical application.31,32 So, it is essential to immobilize MIL-88A on the appropriate support material to enhance the workability of MIL-88A while maintaining its inherent properties. Layered double hydroxides (LDHs), also known as hydrotalcite-like compounds (HTlc), are a class of naturally occurring and synthetic anionic clays. The general formula of LDHs is [M2+ 1-x M3+ x (OH)2]x+(An−) x/n ·mH2O, where M2+ and M3+ are divalent and trivalent metal cations that occupy octahedral sites in the hydroxide layers, An− is an exchangeable anion, and x is the ratio of M3+/(M2+ + M3+) and the layer charge will depend on the M2+/M3+ ratio.33–35 In the past decade, LDHs have drawn great interest due to their relatively large surface areas and high anion-exchange capacities. Because of these properties, LDHs can be an excellent support material for the growth of MIL-88A, especially the flake-like LDHs.36–38
In this work, we present that the synthesis of MgAl-LDH@MIL-88A adsorbent by loading MIL-88A onto the surface of flowerlike MgAl-LDH via stirring method in water bath. Flowerlike MgAl-LDH is consisted of interconnecting LDH nanosheets, prepared by solvothermal method. We study the characterizations of MgAl-LDH@MIL-88A, involving X-ray diffraction (XRD), Fourier transform infrared (FTIR), scanning electron microscopy (SEM), Brunauer–Emmett–Teller (BET) method, and X-ray photoelectron spectroscopy (XPS). Meanwhile, the adsorption performance of fluoride on MgAl-LDH@MIL-88A has been investigated, such as initial solution pH, adsorption kinetics, adsorption isotherms, thermodynamics, and co-existing anions. Also, the adsorption mechanism of MgAl-LDH@MIL-88A is discussed in detail.
Results and discussion
Characterization of adsorbents
The XRD patterns were performed to study the phase structure and crystallinity of the prepared samples, and the results were shown in Figure 1. The pattern of MgAl-LDH showed symmetric reflections for (003), (006), (110), and (113) planes at 2θ of 11.62°, 23.42°, 60.94°, and 62.04°, respectively, and asymmetric peaks for (009), (015), and (018) planes at 2θ of 34.88°, 39.44°, and 46.84°, respectively, which were the characteristics of LDHs (JCPDS card no. 14-0191).39–41 MIL-88A exhibited sharp reflections for (010), (011), (110), (002), and (012) planes, which could be assigned to the MIL-88A standard literature values, 42 and no impurity peaks were observed, indicating the successful formation of MIL-88A.29,43,44 Interestingly, the XRD pattern of MgAl-LDH@MIL-88A showed a series of reflections of MgAl-LDH, because the characteristic diffraction peak was due to the (006) diffraction of MgAl-LDH phase. Meanwhile, the intensity of diffraction peaks of MgAl-LDH@MIL-88A were much weaker than that before loading MIL-88A by comparing the XRD patterns of MgAl-LDH@MIL-88A and MgAl-LDH, which could be attributed to the growth of the MIL-88A made the cover and extrusion of MgAl-LDH. 43 However, there were no reflections of MIL-88A in the XRD pattern of MgAl-LDH@MIL-88A, might be caused by the lower content of MIL-88A. 36
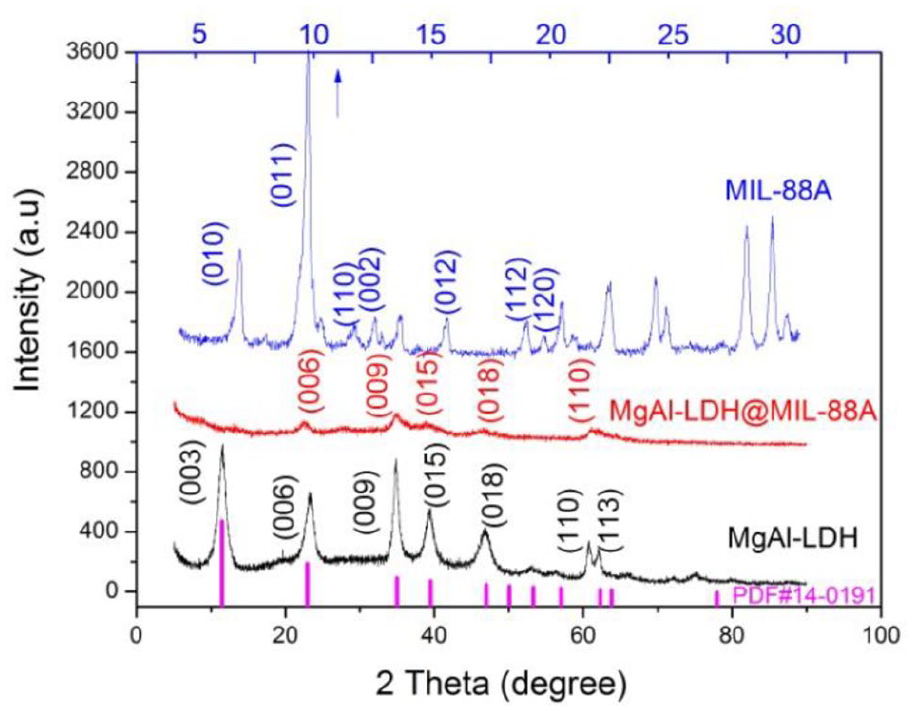
XRD figures of MgAl-LDH, MIL-88A, and MgAl-LDH@MIL-88A.
As shown in Figure 2, all the samples presented broad peaks between 3300 and 3500 cm−1, which attributed to the stretching vibration of hydroxyl groups in the layers and H2O between the layers.45,46 MgAl-LDH (Figure 2(a)) had the characteristic peaks of hydrotalcite. The band at 1654 cm−1 was assigned to the deformation mode of metal hydroxyl groups (M–OH). The asymmetric stretching vibrations of interlayer CO32− appeared at 1358 and 1493 cm−1. Besides, the bands at 1059, 782, and 680 cm−1 were corresponded to the vibrations of metal-OH and/or metal-O.47,48 In the spectrum of Figure 2(b), the band at 567 cm−1 was due to the vibration of Fe–O bonds in MIL-88A. The strong bands at 1599 and 1392 cm−1 were the asymmetric and symmetric stretching vibrations of carboxylate groups in fumaric acid.43,49 As can be seen in Figure 2(c), there were the asymmetric vibration of carboxy (1576 cm−1), the asymmetric stretching vibration of CO32− (1384 cm−1), and also the vibration of metal-O (675 cm−1), showing the MgAl-LDH@MIL-88A was successfully obtained. Besides, the intensities of adsorption bands were weaken in MgAl-LDH@MIL-88A compared to MgAl-LDH, showing that the MIL-88A might cause the extrusion of MgAl-LDH.
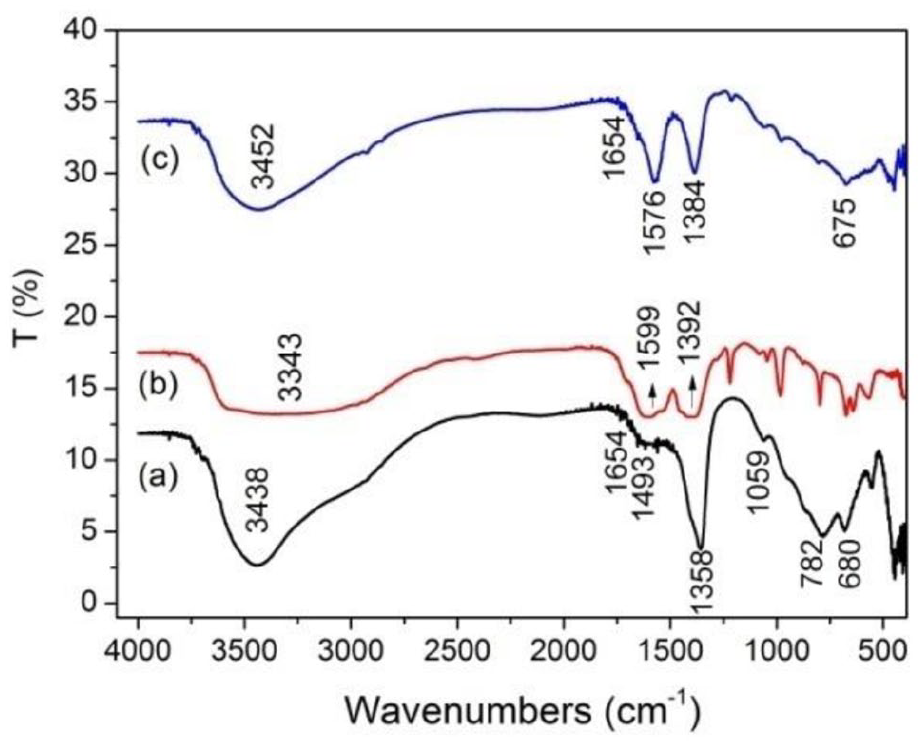
FTIR spectra of (a) MgAl-LDH, (b) MIL-88A, and (c) MgAl-LDH@MIL-88A.
The SEM image in Figure 3(a) shows that MgAl-LDH presented flowerlike morphology with hierarchical structure assembled from interconnected nanosheets (about 50 nm in thickness). As shown in Figure 3(b), MIL-88A presented well-crystallized spindle shape of 2.5 µm length and 0.5 µm in width with a uniform size distribution.28,29 Figure 3(c) demonstrates that the original flowerlike morphology of MgAl-LDH was well-maintained after MIL-88A anchoring, but the surface of nanosheets became rough partially. It implied that MgAl-LDH could not inhibit the constitution of the MIL-88A unit, but could cause distortion of the lattice structure of MIL-88A owing to the strong dispersive force between MgAl-LDH and MIL-88A, then affected the morphology of MIL-88A. 43 The above analyses about Figure 3(c) were consistent with the XRD results. The energy-dispersive X-ray spectroscopy (EDS) spectra in Figure 4 confirm the five elements of Mg, Fe, Al, C, and O existed evenly on the surface of MgAl-LDH@MIL-88A, showing that MIL-88A distributed equally on the surface of flowerlike MgAl-LDH.

SEM images of (a) MgAl-LDH, (b) MIL-88A, and (c) MgAl-LDH@MIL-88A.

EDS elemental mappings of MgAl-LDH@MIL-88A.
N2 adsorption–desorption isotherms and the associated pore-size distributions of the prepared samples are shown in Figures 5 and 6. MgAl-LDH, MIL-88A, and MgAl-LDH@MIL-88A followed the type IV isotherms with a H4, H3, and H3-type hysteresis loop according to the International Union of Pure and Applied Chemistry (IUPAC) classification, respectively. The calculated BET surface areas of MgAl-LDH, MIL-88A, and MgAl-LDH@MIL-88A were 21.321, 20.432, and 129.756 m2 g−1, respectively. The increased surface area of MgAl-LDH@MIL-88A might be caused by emerging mesopores and micropores created at the interface between the MgAl-LDH and MIL-88A, as evidenced by the N2 isotherms and pore-size distributions.43,50 It can be observed from Figure 6, MgAl-LDH possessed little mesopores and abundant macropores with sizes of 5–50 and 50–300 nm, respectively, and the average pore diameter was 3.490 nm. Besides, MIL-88A had plentiful mesopores with size of 3–30 nm and the average pore width was 3.223 nm. MgAl-LDH@MIL-88A owned few micropores and lots of mesopores with sizes of 1.0–1.5 and 5–32 nm, respectively, and the average pore diameter was 7.795 nm.
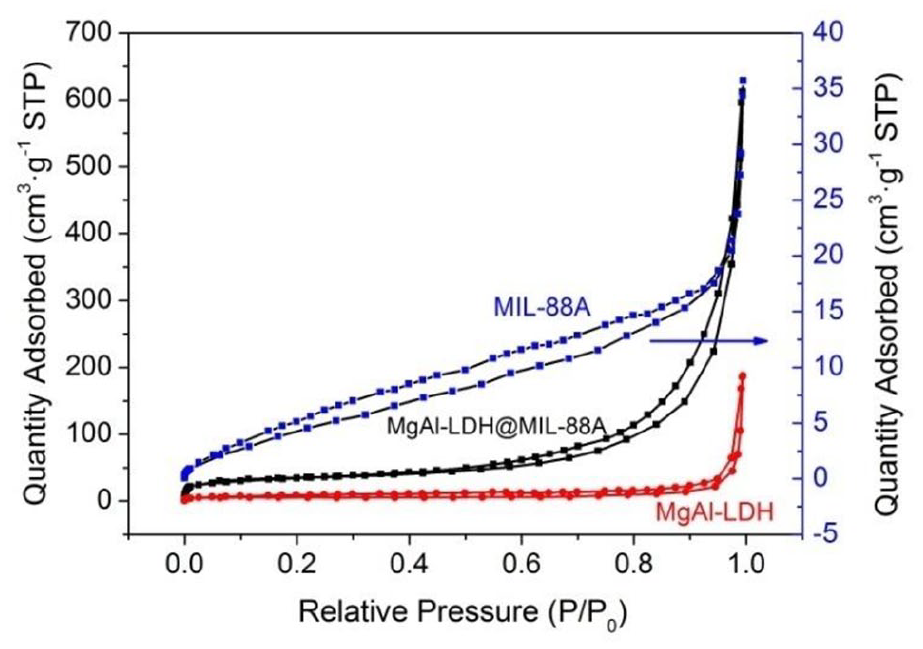
N2 adsorption and desorption isotherms of MgAl-LDH, MIL-88A, and MgAl-LDH@MIL-88A.

Pore-size distributions of (a) MgAl-LDH, (b) MIL-88A, and (c) MgAl-LDH@MIL-88A.
The full-scale XPS spectra (Figure 7(a)) illustrate that MgAl-LDH@MIL-88A was mainly consisted of Mg, Al, Fe, C, and O elements. Figure 7(b) shows the high-resolution XPS spectrum of Fe 2p in MIL-88A, which could be deconvoluted into the Fe 2p3/2 (711.80 eV) and the Fe 2p1/2 (725.36 eV) with a satellite signal at 717.03 eV. The peak distance was about 13.56 eV between the Fe 2p3/2 and the Fe 2p1/2, which was highly similar to those reported references for Fe 2p in Fe2O3, and the three peaks were characteristic of Fe3+ in MIL-88A.43,44 Of note, the binding energy of Fe 2p3/2 and Fe 2p1/2 for MgAl-LDH@MIL-88A reduced to 711.72 and 725.24 eV, respectively, which could be due to an intimate interfacial contact between MIL-88A and MgAl-LDH.51,52 Moreover, this phenomenon testified the perfect synthesis of MgAl-LDH@MIL-88A. Figure 7(c) depicts the high-resolution spectrum of O 1s matched by three peaks at 533.99, 532.59, and 531.27 eV, which were attributed to C–O, carboxylate groups of the C4H4O4 and M–OH of MgAl-LDH. 36

XPS spectra of (a) MIL-88A, MgAl-LDH, and MgAl-LDH@MIL-88A; (b) high-resolution XPS spectra of Fe 2p, and (c) O 1s.
Adsorption property
Effect of initial pH
Generally, the initial solution pH is an important factor for adsorption performance, which is concerned with the stability and surface charge of adsorbent. Therefore, the adsorption of fluoride on the MgAl-LDH@MIL-88A was studied with different pH values ranging from 4.0 to 12.0. It is evident from Figure 8 that the fluoride adsorption loading increased sharply from pH 4.0–7.0, and decreased dramatically from pH 7.0–12.0, which might be related to pHpzc of MgAl-LDH@MIL-88A. The pHpzc of adsorbent was determined as 7.6. When the initial solution pH was lower than the pHpzc of adsorbent, the adsorbent surface was positively charged, which was beneficial for the adsorption of fluoride. At lower pH 4.0, the lower adsorption capacity was likely owing to the partial dissolution of adsorbent. 2 At the optimal pH of 7.0, the adsorption loading of MgAl-LDH@MIL-88A (14.00 mg g−1) was higher than that of MgAl-LDH (3.80 mg g−1) and MIL-88A (10.02 mg g−1), probably due to the following two reasons. One was the electrostatic interactions between F− and the Fe3+ of MIL-88A, another was the ligand exchange between F− and hydroxyl groups of MgAl-LDH. At pH in the range of 7.0–12.0, there was the electrostatic repulsion between the adsorbent and fluoride due to the negative charged surface of adsorbent. Moreover, the increase of competing anions OH− also resulted in the reduction of adsorption efficiency of fluoride. 1 The adsorbent was appropriate for actual water treatment based on its optimal pH (7.0) for fluoride removal, which was close to the pH value of natural water.

The effect of initial pH on the adsorption of MgAl-LDH@MIL-88A for fluoride, adsorbent dose = 0.5 g L−1, [F−]0 = 50 mg L−1, T = 298 K.
Adsorption kinetics
The adsorption kinetics of fluoride onto the adsorbent is of great importance for its practical application. Hence, the pseudo-first- (equation (1)) and pseudo-second-order (equation (2)) kinetic models are used to investigate the adsorption kinetics which can be, respectively, expressed as follows53,54


where qt (mg g−1) and qe (mg g−1) are the amount of fluoride ions adsorbed on the adsorbent at any time t and at equilibrium, respectively. k1 (min−1) and k2 (g mg−1 min−1) are the pseudo-first-order and pseudo-second-order kinetic models for adsorption, respectively.
The kinetic results of fitting experimental data are presented in Figure 9 and Table 1. As shown in Figure 9, the removal rate increased significantly during the first 120 min and reached equilibrium in approximately 420 min. From Table 1, the correlation coefficient R2 (0.919) of the pseudo-second-order model was higher than that of the pseudo-first-order (0.534), which indicated that the pseudo-second-order model was fitted for describing the uptake of fluoride by MgAl-LDH@MIL-88A. The experimental qe,exp value (15.90 mg g−1) was in better agreement with the calculated ones qe,cal (15.05 mg g−1) gained from the pseudo-second-order model. The above results showed the adsorption of fluoride on MgAl-LDH@MIL-88A was a chemisorption mechanism being the rate-determining step.

Adsorption kinetic fitting curves of MgAl-LDH@MIL-88A for fluoride adsorption, adsorbent dose = 0.5 g L−1, [F−]0 = 50 mg L−1, T = 298 K.
Adsorption kinetic parameters for fluoride adsorption on MgAl-LDH@MIL-88A.

Adsorption isotherms
In isotherms study, the operating temperatures were varied from 298 to 318 K, and the contact time was 12 h to ensure the adsorption was in equilibrium. Four general-purpose isotherms models are used to fit the experimental data: Langmuir, Freundlich, Temkin, and Dubinin–Radushkevich (D-R) isotherms models.55–57
The Langmuir isotherm model assumes all active sites on the adsorbent surface have the same energy, and once an adsorbate occupies a site, no further adsorption can occur on that site The nonlinear form of the Langmuir isotherm model is described in equation (4)

where qe (mg g−1) and qm (mg g−1) are the equilibrium and the maximum adsorption capacity, respectively, Ce (mg·L−1) is the concentration of F− under equilibrium condition, KL (L·mg−1) is a Langmuir constant related to the affinity between an adsorbent and adsorbate.
The Freundlich isotherm model describes the adsorption characteristics for a heterogeneous surface. It assumes that each adsorption site has specific bond energy. The nonlinear form of Freundlich equation is expressed as shown in equation (5)

where qe (mg g−1) is the equilibrium adsorption capacity, Ce (mg L−1) is the adsorbate concentration at equilibrium, KF (mg g−1)(L mg−1)1/n is the Freundlich constant, and n is the Freundlich intensity parameter, which indicates the magnitude of the adsorption driving force or the surface heterogeneity.
The Temkin isotherm model considers the interaction of adsorbate and adsorbent on binding process. However, the occupation of high energetic sites would be taken into account first. In general, Temkin isotherm model is developed based on two assumptions where the heat of adsorption would decrease linearly with the increase of surface coverage and uniform distribution of binding energies up to some maximum binding energy. The Temkin equation is given as follows


where AT (L·g−1) is the Temkin isotherm equilibrium binding constant corresponding to the maximum binding energy, B and bT (J·mol−1) are the constants that are related to the heat of adsorption, 1/bT represents the adsorption potential of the adsorbent, R is the gas constant (8.314 J mol−1 K−1), and T is the temperature in Kelvin.
The D-R equation accounts for the effect of the porous structure of an adsorbent and the predominant adsorption type as physical or chemical adsorption. The linear form of D-R equation is defined as follows


where qDR (mg g−1) is the adsorption capacity, KDR (mol2 kJ−2) is a constant related to the sorption energy, ɛ is the Polanyi potential, EDR (kJ mol−1) is the mean adsorption energy. The parameters qDR and KDR can be estimated from slope and intercept of a plot of ln qe against R2T 2 ln 2 (1+1/Ce).
The curve fitting results are presented in Figure 10 and related parameters are given in Table 2. It is evident that the Temkin (Figure 10(b)) and Freundlich (Figure 10(a)) isotherms were better models than the Langmuir (Figure 10(a)) and the D-R (Figure 10(c)) isotherms on the basis of the R2 values, showing that the adsorption process was multilayer sorption and the surface sites of the adsorbent were heterogeneous. The value of bT (< 40 kJ mol−1) indicated the adsorption process involved physical adsorption. The 1/n values were all in the range of 0.1–0.5 showing a favorable removal process. Meanwhile, the n values increased with increasing temperatures from 298 to 323 K, implying that the interaction between F− and adsorbent was endothermic in nature. 43 The qm values from Langmuir isotherm at 298, 303, and 323 K were 21.00, 25.85, and 29.71 mg g−1, respectively. As shown in Table 3, the fluoride adsorption capacity of the MgAl-LDH@MIL-88A was much higher than others, which indicated a potential application in the actual treatment systems.
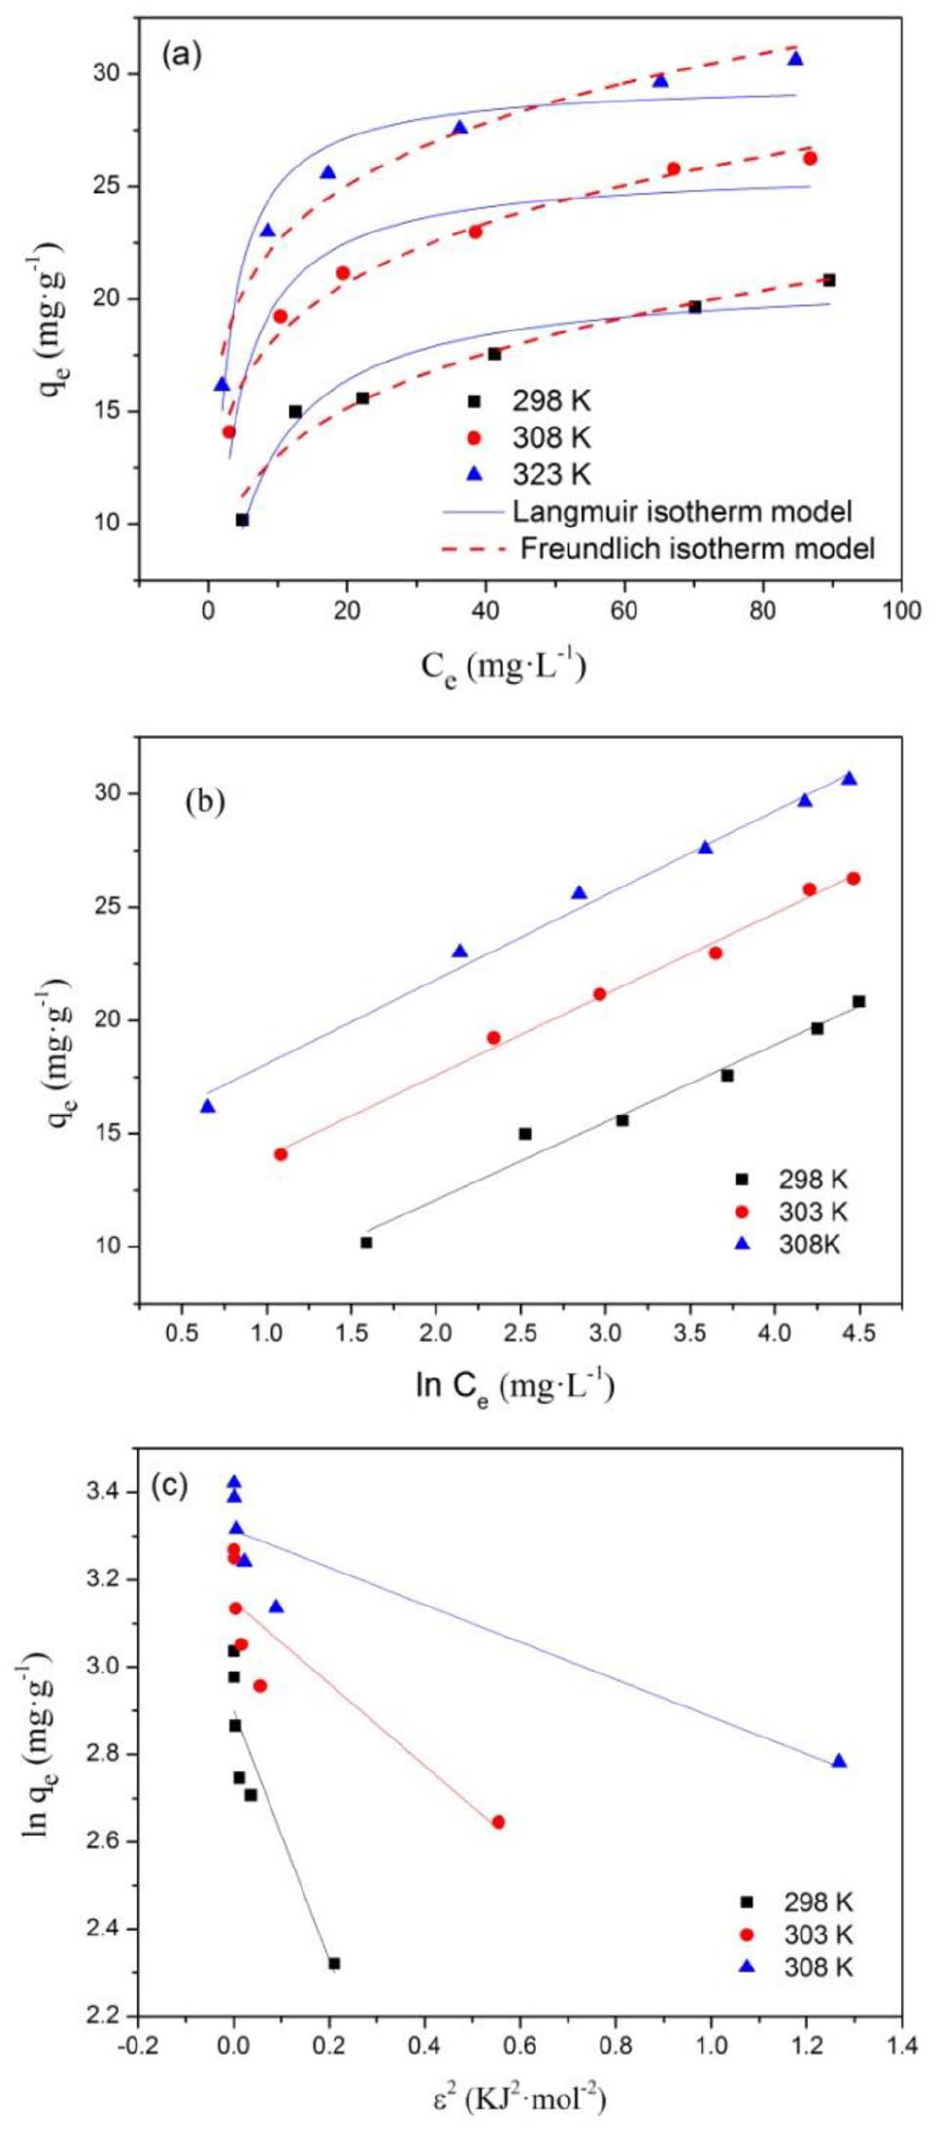
Adsorption isotherm fitting curves of MgAl-LDH@MIL-88A for fluoride adsorption, adsorbent dose = 0.5 g L−1, contact time = 12 h. (a) Fitting curve of the Langmuir and Freundlich isotherms. (b) Fitting curve of the Temkin isotherm. (c) Fitting curve of the D-R isotherm.
Adsorption isotherm parameters for fluoride adsorption on MgAl-LDH@MIL-88A.

Fluoride adsorption capacity of MgAl-LDH@MIL-88A compared with other adsorbents.

Thermodynamic study
To shed light on the F- adsorption over MgAl-LDH@MIL-88A, thermodynamic parameters of Gibbs free energy (ΔG0), standard enthalpy change (ΔH0), and standard entropy change (ΔS0) were calculated using the following equations 46


where KL is the Langmuir constant (L mg−1), ∆G0, ∆S0, and ∆H0 denote the free energy change (kJ mol−1), entropy change (J mol−1 K−1), and enthalpy change (kJ mol−1), respectively, T (K) is the temperature in Kelvin, and R is the universal gas constant (8.314 J mol−1 K−1).
The thermodynamic parameters are listed in Table 4. The negative values of ∆G0 were helpful for spontaneous adsorption of F−. What is more, the value of ∆G0 decreased with increasing temperature, displaying higher temperature was favorable for adsorption. ∆H0 and ∆S0 were calculated from the slope and intercept of the Van ’t Hoff plot of ln KL versus 1/T (Figure 11). The positive value of ∆H0 confirmed the endothermic nature of adsorption, which has been predicted earlier from the isotherm study. At the same time, lower values of ∆H0 revealed the removal was accompanied by physisorption. The positive value of ∆S0 suggested the increased randomness at the solid–solution interface during the removal of fluoride on MgAl-LDH@MIL-88A. 48
Thermodynamics parameters for fluoride adsorption onto MgAl-LDH@MIL-88A.


The figure of ln KL versus 1/T plots for fluoride adsorption on MgAl-LDH@MIL-88A, adsorbent dose = 0.5 g L−1, contact time = 12 h.
Effect of co-existing anions
The fluoride-contaminated water contains several other anions that can equally compete in the adsorption process in reality. The effects of potential co-existing anions (Cl−, NO3-, SO42−, and CO32−) on the adsorption of fluoride at varying concentrations from 10 to 80 mg L−1 are shown in Figure 12. Evidently, all the anions showed an inhibiting effect on adsorption of fluoride. When the concentrations of other anions increased to 20 mg L−1, the adsorption of fluoride by MgAl-LDH@MIL-88A remained almost unchanged, and thereafter decreased sharply. Besides, Cl−, NO3-, and CO32− exhibited similar and little effect on fluoride removal with increasing concentration. Whereas, the adsorption capacity of fluoride decreased by a stronger extent in the case of SO42−, which was due to the fact that MgAl-LDH@MIL-88A had greater affinities for multivalent anions than monovalent anions.1,28 In conclusion, the adsorbent possessed a high selectivity to fluoride when the concentrations of Cl−, NO3-, SO42−, and CO32− were less than 20 mg L−1.
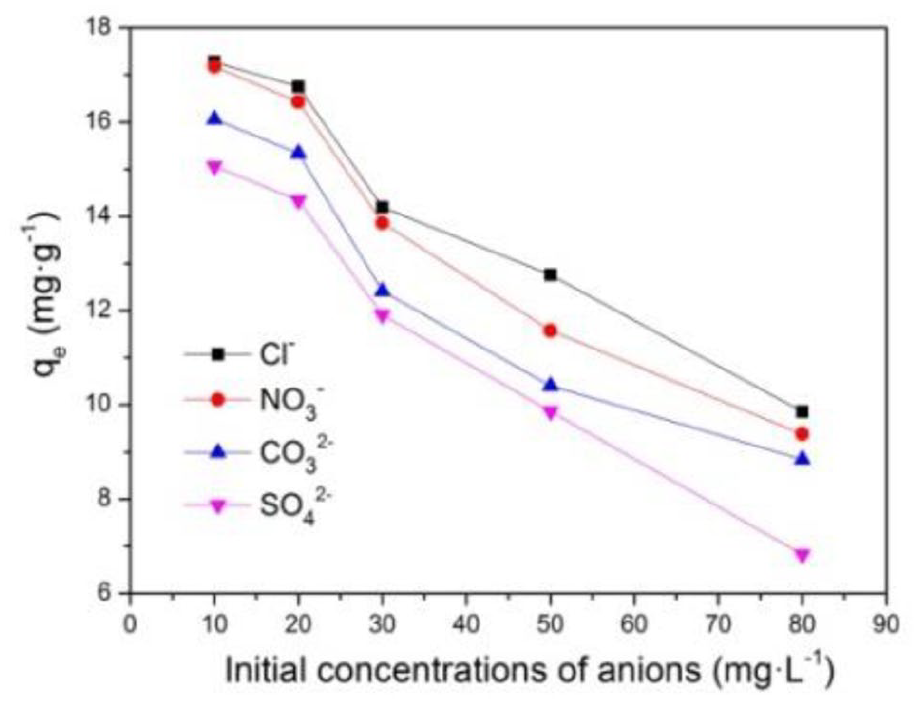
The effect of competitive anions for fluoride adsorption by MgAl-LDH@MIL-88A, adsorbent dose = 0.5 g L−1, [F−]0 = 50 mg L−1, T = 298 K.
Reusability and safety of adsorbent
Reusability is a significant parameter to assess the possibility of the adsorbent in practical applications, so we investigate the reuse of MgAl-LDH@MIL-88A. Regeneration of MgAl-LDH@MIL-88A adsorbent was performed using 0.1 M Na2CO3. As shown in Figure 13, there was no obvious decline of the adsorption performance after five recycles, showing that the MgAl-LDH@MIL-88A had good reusability and potential value for practical application. Recently, there is a growing attention to green and environment-friendly adsorbents, which will not cause secondary pollution in actual water treatment. In our study, the mental contents in the solution after absorption of fluoride are detected by inductively coupled plasma mass spectrometry (ICP-MS) and the results are shown in Table 5. The leaching of Mg, Fe, and Al ions was 1.095, 0.007, and 0.076 mg L−1, respectively. The Chinese sanitary standard for drinking water (GB 5749-2006) specifies the limiting values of total hardness, Fe and Al ions in drinking water were 450, 0.3, and 0.2 mg L−1. 64 The residual mental contents were matched with the above standard, indicating that the practical application of MgAl-LDH@MIL-88A was safe.

The reusability of MgAl-LDH@MIL-88A for the adsorption of fluoride, adsorbent dose = 0.5 g L−1, [F−]0 = 50 mg L−1, T = 298 K.
The concentrations of each metal ions in solution.

Possible removal mechanism
Figure 14 shows the FTIR spectra of MgAl-LDH@MIL-88A and fluoride-uptake over MgAl-LDH@MIL-88A (F-MgAl-LDH@MIL-88A). In the front of adsorbent characterization, the band at 1654 cm−1 in MgAl-LDH@MIL-88A was ascribed to the bending vibration of M–OH, and the band at 1576 cm−1 was the asymmetric vibration of carboxy (Figure 14(a)). It can be seen that the intensities of absorption bands at 1654 and 1576 cm−1 were decreased after adsorption of fluoride (Figure 14(b)), demonstrating the surface hydroxyl groups (M–OH) of MgAl-LDH, synergic with carboxy of MIL-88A, removed fluoride. 51

FTIR spectra of (a) MgAl-LDH@MIL-88A and (b) F-MgAl-LDH@MIL-88A.
The SEM images of MgAl-LDH@MIL-88A and F-MgAl-LDH@MIL-88A are given in Figure 15. As described in the “Characterization of adsorbents” section, MgAl-LDH@MIL-88A maintained the flowerlike morphology with the rough nanosheets. Significantly, the flowerlike morphology was hardly noticeable after adsorption of fluoride, and the agglomeration occurred in the F-MgAl-LDH@MIL-88A. Moreover, it can be observed that the rough nanosheets sticked to each other. The EDS spectrum in Figure 16 shows the elements of Mg, Fe, Al, O, and F existed evenly on the surface of F-MgAl-LDH@MIL-88A.

SEM images of (a) MgAl-LDH@MIL-88A and (b) F-MgAl-LDH@MIL-88A.

EDS elemental mappings of MgAl-LDH@MIL-88A and F-MgAl-LDH@MIL-88A.
Figure 17(a) shows the full-scale XPS spectrum of F-MgAl-LDH@MIL-88A, and the existence of F element in the XPS spectrum of Figure 17(c) proved the fluoride was effectively taken up by the adsorbent. As shown in Figure 17(b), the peaks at ~711.72 and 725.24 eV of MgAl-LDH@MIL-88A were assigned to the Fe 2p3/2 and Fe 2p1/2, respectively. After adsorption of fluoride, the XPS characteristics of the Fe 2p doublet (Fe 2p3/2 and Fe 2p1/2) shifted to the higher binding energy (711.94 and 725.60 eV). That was corresponded to the reaction between Fe3+ of MIL-88A with F−, which led to a decrease in electronic cloud density and an increase in binding energy. 52 In Figure 17(c), the binding energy of F 1s was 686.10 eV, higher than that reported in literature (684.5 eV), indicating Fe3+ in MIL-88A reacted with F−.28,54 In Figure 17(d), the O 1s spectrum of F-MgAl-LDH@MIL-88A resolved into three different peaks at 533.99 (C–O), 532.59 (carboxylate groups of the C4H4O4), and 531.27 eV (M–OH of MgAl-LDH). 36 In comparison with the O 1s spectrum of MgAl-LDH@MIL-88A, the relative areas for the peaks assigned to M–OH of MgAl-LDH and carboxylate groups of the C4H4O4 dramatically decreased from 21.46% to 17.60% and from 40.48% to 35.18%, indicating that both M–OH and carboxylate groups played their roles in the F− removal mechanism, which was in good agreement with the FTIR results.65–68 Hence, the possible adsorption mechanism of MgAl-LDH@MIL-88A was proposed and presented in Scheme 1.

XPS spectra of (a) F-MgAl-LDH@MIL-88A; (b) high-resolution XPS spectra of Fe 2p, (c) F 1s, and (d) O 1s.

Schematic illustrations of the possible adsorption mechanism for fluoride by MgAl-LDH@MIL-88A.
Conclusion
MgAl-LDH@MIL-88A was successfully synthesized by loading MIL-88A into flowerlike MgAl-LDH support, and through stirring method in the water bath. MIL-88A was adhered to the surface of flowerlike MgAl-LDH, which was confirmed by the analyses of SEM, FTIR, XRD, and XPS. Despite there was a strong dispersive force between MgAl-LDH and MIL-88A, which had an impact on the lattice structure of MIL-88A, the MIL-88A was still formed. At the same time, the brucite-like layers of MgAl-LDH were covered and extruded because of the growth of the MIL-88A. The fluoride adsorption property of MgAl-LDH@MIL-88A was studied and the maximum removal of fluoride occurred at initial pH 7.0 in 420 min with an initial concentration of 50 mg L−1. Defluoridation by MgAl-LDH@MIL-88A followed the pseudo-second-order model, which was controlled by reaction of the fluoride with the adsorbent. The adsorption process could be well described by the Temkin and Freundlich isotherm models. The maximum adsorbed fluoride was 29.71 mg g−1, obtained from equilibrium data fitted with Langmuir isotherm model. Besides, the thermodynamic parameters indicated that the adsorption was an endothermic and spontaneous process. In addition, MgAl-LDH@MIL-88A had a synergistic effect on the adsorption of fluoride, including the electrostatic interactions between F− and the Fe3+ of MIL-88A, and the ligand exchange among hydroxyl groups of MgAl-LDH, carboxylate groups of the C4H4O4 and fluoride. The adsorbent preparation procedure was simple, and the adsorbent was green. In conclusion, MgAl-LDH@MIL-88A was a promising material for fluoride removal in water treatment.
Experimental
Materials
Mg(NO3)2·6H2O, Al(NO3)3·9H2O, methanol (CH3OH), urea (H2NCONH2), FeCl3·6H2O, fumaric acid (C4H4O4), and NaF were analytical grade and used as received without purification. Deionized water was used throughout the whole experiment. The fluoride aqueous solution used in this study was a synthetic wastewater.
Preparation of flowerlike MgAl-LDH@MIL-88A
Flowerlike MgAl-LDH support was obtained by solvothermal method using urea as precipitating agent. Mg(NO3)2·6H2O (7.6923 g, 3 mmol), Al(NO3)3·9H2O (3.7513 g, 1 mmol) and urea (7 mmol) were dissolved in 30 mL of methanol to get clear solution. The mixture was transferred into a 50 mL autoclave after stirring for 2 h, and then held at 150°C for 10 h. The precipitate was centrifuged, washed thoroughly with deionized water and ethanol, and dried at 60°C for 12 h.
Fumaric acid (0.0290 g) was dissolved in deionized water (15 mL) to obtain solution (a). Flowerlike MgAl-LDH (0.1000 g) was ultrasonically dispersed in deionized water (15 mL) to obtain homogeneous suspension (b). The suspension (b) was slowly dropped into the solution (a) with a stirring speed of 600 rpm under water bath (65°C), then FeCl3·6H2O (0.0676 g) was added, and stirred vigorously for 8 h. The obtained deep yellow product (flowerlike MgAl-LDH@MIL-88A) was washed with deionized water and ethanol several times, finally dried at 60°C for 12 h.
Characterization
FTIR spectra (iS50, Thermo Nicolet, Waltham, MA) were collected in the range of 4000–400 cm−1. Surface area and pore-size distribution were measured by N2 adsorption–desorption method at 77 K and evaluated by the multiple point BET method, Barrett–Joyner–Halenda (BJH) model, and density functional theory (DFT) (Quantachrome Instruments, Dr Boynton Beach, FL, autosorb-iQ). The morphologies and compositions of the adsorbents were determined by SEM (KYKYEM3200, KYKY Technology Co., Ltd, Beijing, China) equipped with EDS (Hitachi S-4300, Tokyo, Japan). XRD patterns were performed using a Shimadzu diffractometer (Model 6000, Shimadzu, Kyoto, Japan) with Cu Ka radiation (40 kV and 30 mA) at a scanning rate of 2°/min from 5° to 90°. XPS was taken using PHI Quantera SXM (ULVAC-PHI) with 300 W Al Ka radiations. The pHpzc of the adsorbent was detected by Zetasizer (Nano-ZS) from Malvern Instruments.
Adsorption experiments
All adsorption experiments were carried out in a series of 250 mL airtight conical flasks in a thermostatic shaker at a constant speed of 180 r min−1. The dose of adsorbent was 0.5 g L−1 and volume of fluoride wastewater was 40 mL. All experiments were carried out in duplicate and the average data were used to evaluate the adsorption performance. After adsorption, the concentration of residual fluoride was measured with ion chromatography (792 Basic IC, Metrohm). The fluoride loading qe (in mg per unit mass of adsorbent, mg g−1) was used to mainly evaluate the adsorption performance of different adsorbents and was described as follows

where C0 and Ce are the initial and equilibrium concentrations in mg L−1, respectively, V is the solution volume in liter, and m is the mass of the adsorbent in gram.
Footnotes
Acknowledgements
The authors are thankful to Prof. Xiaodong Lei (Beijing University of Chemical Technology) and Dr Yiping Wang (Beijing University of Chemical Technology) for their constructive suggestions.
Declaration of conflicting interests
The author(s) declared no potential conflicts of interest with respect to the research, authorship, and/or publication of this article.
Funding
The author(s) disclosed receipt of the following financial support for the research, authorship, and/or publication of this article: This project was financially supported by the National Natural Science Foundation of China (21667024) and the Natural Science Foundation of QingHai Science & Technology Department (2016-ZJ-912).