
Abstract
Layered double hydroxides are very promising catalysts for water splitting, in particular NiFe-layered double hydroxide, which has attracted significant attention due to its excellent catalytic activity in oxygen evolution reactions using alkaline electrolytes. In this work, samples with different molar ratios of Ni to Fe are prepared by a typical hydrothermal method to study the effect of iron on the catalytic properties of NiFe-layered double hydroxide. All the NiFe-layered double hydroxides exhibit much better oxygen evolution reaction activity than NiOOH, while increasing the iron content slightly affects the activity, which implies that only Fe ions at some specific site contribute to the oxygen evolution reaction activity. The NiFe-layered double hydroxide with a 4:1 molar ratio of Ni to Fe shows the best oxygen evolution reaction catalytic performance, and requires only an overpotential of 176 mV to afford a current of 10 mA cm−2 in 1.0 M KOH, and exhibits a much lower Tafel slope (51 mV dec−1). This work also studies the effect of iron on the electronic structure of nickel and reveals the mechanism behind the excellent oxygen evolution reaction catalytic properties of NiFe-layered double hydroxide.

Introduction
In recent years, coal, oil, natural gas, and other conventional energy sources are increasingly becoming exhausted and the resulting environmental pollution and greenhouse effect are serious problems. Hence, the development of clean new energy has gradually become the focus of attention. Electrochemical water splitting is an important strategy to produce oxygen and hydrogen, which is driven by direct current electricity and the carbon emission during the process is zero. However, the efficiency of water electrolysis remains low and the cost is high, while efficient water electrolysis catalytic materials can greatly reduce the overpotential and improve the decomposition efficiency of water. Therefore, electrocatalytic materials have good application prospects and high research value, especially the development of efficient non-noble metal catalysts under alkaline conditions. 1
According to previous studies, layered double hydroxides (LDHs) exhibit excellent performance and are easy to control, which allows promising research on electrocatalytic materials. The structures of LDHs can be described by the formula [M2+1 – xM3+ x (OH)2][(An−) x/n ·mH2O], where M2+ and M3+ constitute the main layer, and A n− is the interlayer anion. 2 The transition-metal compositions are easy to tune and are low-cost. Transition metals can provide empty d-orbitals or lone pair electrons in oxygen evolution reactions (OERs) to form intermediate products and reduce the reaction activation energy. 3 LDHs not only have high Faraday’s efficiency but also have the advantages of good stability, among which NiFe LDH exhibits the best catalytic performance in an alkaline environment.4–6 Previous researchers have accomplished significant modification research to further improve the electrocatalytic properties of NiFe LDH. The incorporation of foreign metal ions can improve catalytic performance through the electron transfer from NiFe LDH laminates to the doping metals. For example, Wen et al. 7 used Ce to dope NiFe LDH and then coupled it with MXene; the hybrid catalyst delivered a low overpotential of 260 mV at a current density of 10 mA cm−2. Zhou et al. 8 introduced a series of transition and main group metal atoms into the NiFe LDH host layers, demonstrating that V, Co, and Cr dopants largely promote the intrinsic activity of NiFe LDH. Moreover, introducing vacancies could also efficiently modify the electrocatalytic properties by tuning the surface electronic structure. Wang et al. 9 synthesized NiFe LDHs-VFe and NiFe LDHs-VNi electrocatalysts that showed excellent activity in OERs. In addition, tailoring active sites is considered another effective strategy to improve electrocatalytic properties. Zheng et al. 10 anchored active sites using Pt2FeNi alloy nanoparticles and created additional active sites for NiFe LDH. Despite the numerous studies that have explored methods to modify NiFe LDHs, the influence of the existence of iron on its properties and the reasons have rarely been studied. Therefore, systematically studying the effect of iron on its catalytic performance fills the gap of previous research and can also help better understand the mechanism behind the excellent catalytic performance of NiFe LDHs.
In this work, a series of samples with different iron contents was synthesized on nickel foam (NF) as the substrate and the samples were used as electrocatalysts for s. The electrocatalytic properties increase first and then decrease with the increment of iron content. As a result, there is an optimum performance when the molar ratio of Ni to Fe is 4:1, requiring only 176 mV of overpotential to drive a current of 10 mA cm−2 in 1.0 M KOH; this is far superior to most previously reported LDH-based electrocatalysts (see Table S1 in the Supporting Information). This is due to the sample exhibiting perfect nanoflower-like morphology with good crystallinity and a larger reaction surface area, which improves catalytic performance effectively. When no iron is added, however, the sample exhibits very poor electrocatalytic properties. The detailed experiments reveal the existence of low-valent Ni and O species which are unfavorable for OERs. This paper emphasizes the important role of the Fe ion in NiFe LDH catalysts. By comparing with iron-free samples, it was found that the presence of iron can eliminate the low-valent substances that are not conducive to OER. When the iron content in the sample reaches a certain level, the catalytic performance does not change much, indicating that only Fe ions at specific positions contribute to the OER activity. These conclusions can help us further understand the NiFe LDH catalytic mechanism and is significant for developing highly efficient water oxidation electrocatalysts.
Results and discussion
Materials characterization
In this work, NiFe LDH on NF samples was prepared by a typical hydrothermal reaction (see “Experimental section”). Figure 1 shows the X-ray diffraction patterns of NiFe LDHs, NiOOH, and bare NF. The peaks located at 2θ = 44.5°, 51.8°, and 76.4° can be assigned to the (111), (200), and (220) planes of Ni (PDF #04-0850), while the peaks at 2θ = 11.4°, 22.9°, 33.5°, 38.9°, 59.9°, and 61.2° are consistent with the (003), (006), (101), (015), (110), and (113) planes of NiFe LDH (PDF #40-0215), respectively. The peaks at 2θ = 12.8° belong to the (003) plane of NiOOH (PDF #06-0075). The X-ray diffraction (XRD) patterns prove that NiOOH and NiFe LDH with different iron contents were successfully synthesized. According to XRD data, the main peak (015) shifts at a large angle and changes the NiFe LDH lattice constant on increasing the Fe doping concentration, thereby implying successful doping with Fe. On increasing the iron content, the height and width of the diffraction peak (003) increase first and then decrease. 8 This indicates a change in the crystallization of the sample, which may affect the OER catalytic properties of the sample. When the iron content is too high, some peaks related to iron-based phases gradually appear.
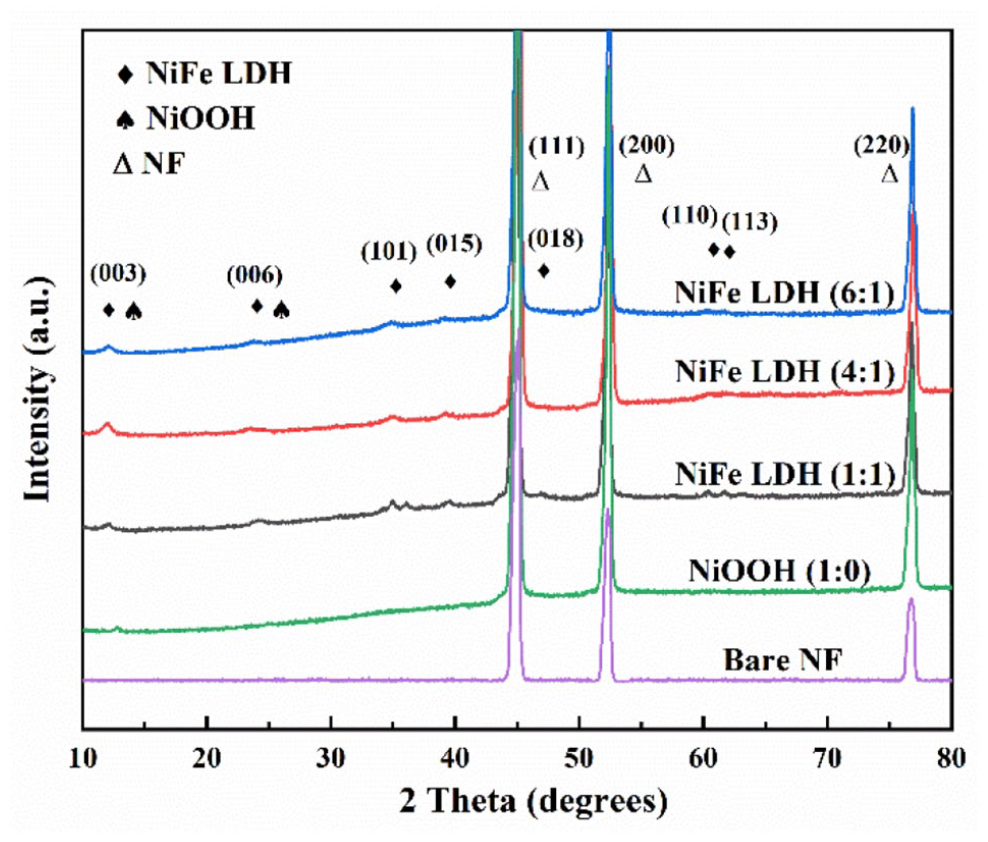
XRD patterns of samples with different molar ratios of Ni to Fe on NF and bare NF.
Figure 2(a)–(c) shows scanning electron microscope (SEM) morphologies of NiFe LDH with different ratios of Ni to Fe. As shown in Figure 2(a), a uniform layer of NiFe LDH nanosheets with a size of 1–2 μm has grown on the surface of the NF. When the ratio increases to 4:1, large nanoflowers with a cluster size of 2–5 μm are formed on the nanosheet layer, which is composed of nanosheets (Figure 2(b)). When the iron content increases further, the nanosheets no longer aggregate and scatter on the underlying nanosheet layer, as shown in Figure 2(c). Meanwhile, the morphology of NiOOH (Figure 2(d)) exhibits a flocculent structure, which illustrates poor crystallinity and is consistent with XRD results. The formation of nanoflowers is affected by many factors. Under alkaline conditions, nitrate and sulfate solutions tend to coordinate with OH−, controlling the reaction process and leading to nucleation, through the interaction of van der Waals force and hydrogen bonds, and the nanoflower structure is gradually formed. When the raw material composition is different, the pH of the solution is also different, which affects the reaction rate and leads to the formation of diverse morphologies.11,12 The N2 adsorption–desorption isotherms and pore volume curves of different samples are shown in Figure S1 (see the Supporting Information). All the samples show type IV isotherms and confirm the presence of mesopores.13,14 The tendency of the specific Brunauer–Emmett–Teller (BET) surface area is NiOOH (1:0) > NiFe LDH (4:1) > NiFe LDH (6:1) > NiFe LDH (1:1). The NiOOH with a flocculent structure exhibits a larger BET surface area than all the NiFe LDHs. The BET surface area of NiFe LDH (4:1) is the largest among the NiFe LDHs, which is consistent with SEM results, and the three-dimensional (3D) nanoflower structure contributes to the increment of the surface area. The corresponding pore diameters of the different samples are between 3.5 and 3.8 nm and do not change significantly.
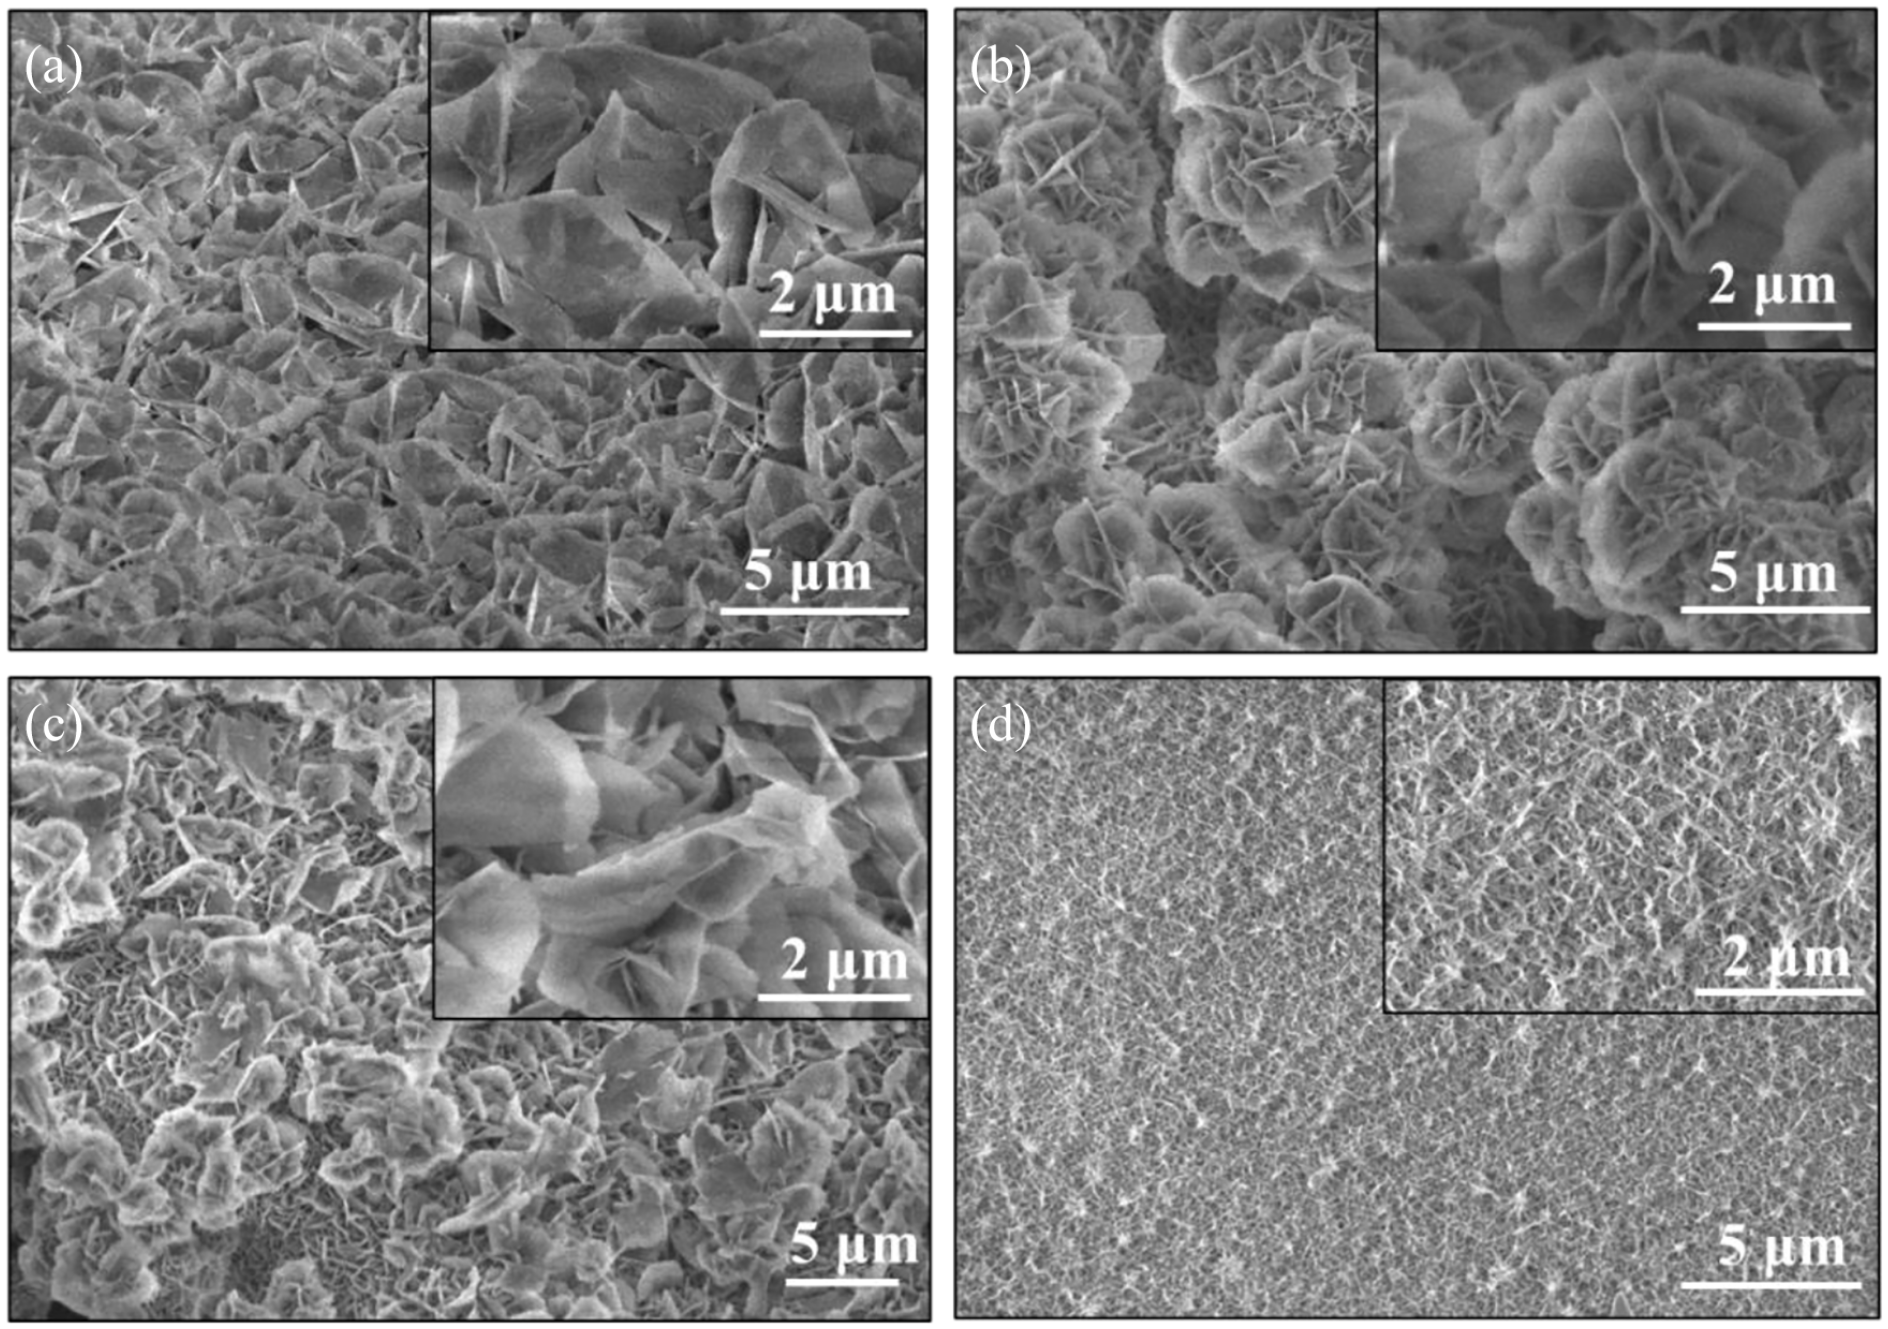
SEM images of samples with different molar ratios of Ni to Fe on NF: (a) 1:1, (b) 4:1, (c) 6:1, and (d) 1:0.
To further clarify the microstructure of the sample with a 4:1 molar ratio of Ni to Fe, transmission electron microscopy (TEM) and high-resolution transmission electron microscopy (HRTEM) measurements were performed. As shown in Figure 3(a) and (b), the nanosheets are composed of smaller ultra-thin nanoflakes. The size of these ultra-thin LDH nanoflakes is about 200 nm, which increases the reaction surface area and contributes to the improvement of catalytic capacity. The NiFe LDH nanoflakes exhibit apparent lattice spacings of 0.234 and 0.205 nm (Figure 3(c)), which are consistent with the (015) and (018) planes of the LDH phase (PDF #40-0215), respectively. The selected area diffraction (SEAD) shown in Figure 3(d) further confirms the existence of the LDH phase and is consistent with the main peak from the XRD. 15 The element mapping in Figure 3(e) reveals the uniform distribution of the elements Ni, Fe, O, and the homogeneous chemical composition of the NiFe LDH.
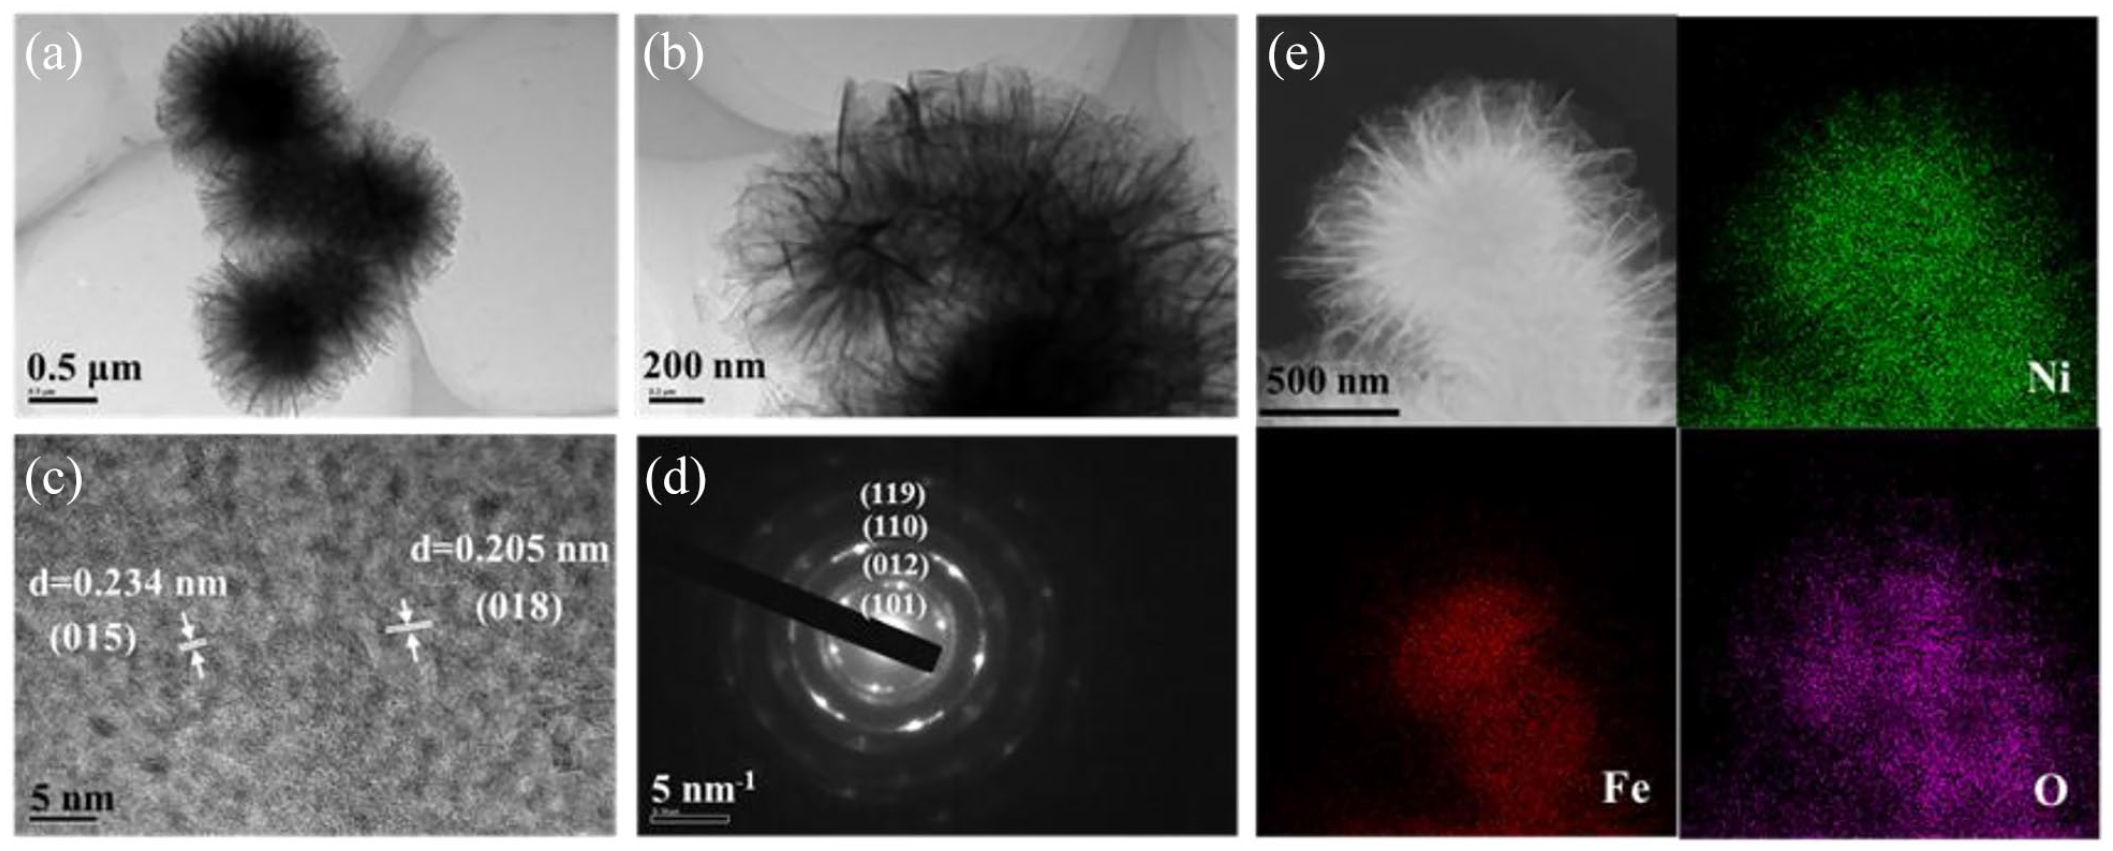
(a and b) TEM images, (c) HRTEM image, (d) SEAD pattern, and (e) EDS element mapping images of NiFe LDH with a 4:1 molar ratio of Ni to Fe.
X-ray photoelectron spectroscopy (XPS) was performed to analyze the electronic structures of the samples. The XPS survey spectra of NiFe LDH in Figure S2(a) (see the Supporting Information) prove the presence of the Ni, Fe, and O elements. The Ni 2p XPS spectra are shown in Figure 4 and Figure S2(b) in the Supporting Information. The characteristic peak shifts to a slightly higher binding energy as the ratio of Ni to Fe increases (Figure S2(b) in the Supporting Information), suggesting the iron content affects the nickel in the sample. 9 Figure 4(a)–(c) shows the Ni 2p3/2 XPS spectra of NiFe LDHs. As shown in Figure 4(b), the Ni 2p3/2 XPS spectra can be divided into four peaks, with the peaks at 855.8 and 856.8 eV assigned to Ni2+ and Ni3+ (Figure 4(b)), respectively. The peaks at 861.6 and 863.6 eV can be considered as satellite peaks of Ni2+ and Ni3+. The proportion of Ni3+ in the NiFe LDHs was calculated to observe the valence changes of nickel; the Ni3+ ratio can reach 50.1% when the molar ratio of Ni to Fe is 4:1, which is higher than the other two NiFe LDH samples (Table 1). High-valent Ni3+ contributes to the formation and deprotonation of OOH, the active intermediate of OER, which is beneficial to improve the intrinsic electrocatalytic activity. 16 Figure 4(d) exhibits the Ni 2p3/2 peaks of NiOOH, and the peak at 852.5 eV is related to low-valent Ni species. As shown in Figure S2(d) in the Supporting Information, there is an obvious peak corresponding to Ni-OH at 529.6 eV. Low-valent Ni and O species are not conducive to the formation of OER intermediates.11,17 Therefore, the OER performance of NiOOH is far inferior to that of NiFe LDH, which was proved in subsequent electrochemical measurements. The slight positive shifts for Fe 2p and O 1s can be observed in Figure S2(c) and (d) in the Supporting Information. In the Fe 2p3/2 spectra (Figure S3(a) in the Supporting Information), the peaks at 712.3 and 714.8 eV are assigned to Fe3+, indicating the presence of iron oxide species. 18 In the O 1s spectra (Figure S3(b) in the Supporting Information), the main peak can be divided into three peaks, with the peaks at 531.0 and 532.6 eV being attributed to typical metal–oxygen bonds and absorbed water (H2Oads), respectively. The peak at 531.6 eV was assigned to oxygen in the hydroxy groups present in the sample. 19 The above XPS results reveal that iron significantly influences the valance state of nickel and promotes the formation of OER intermediates. The results obtained from the Raman spectra further prove the synthesis of the LDH phase (Figure S4 in the Supporting Information). When the molar ratio of Ni to Fe is 4:1, the bands at 454 and 525 cm−1 correspond to the linkage bonds of M3+–O–M2+ and M3+–O–M3+ in the hydrotalcite structure. Furthermore, when the iron content in the sample is zero, the peaks recorded at 465 cm−1 are attributed to the Ni–O stretching vibration. 8

The Ni 2p3/2 XPS spectra of samples with different molar ratios of Ni to Fe on NF: (a) 1:1, (b) 4:1, (c) 6:1, and (d) 1:0.
Summary of the ratio of Ni3+ in NiFe LDHs with different molar ratios of Ni to Fe on NF.

Electrochemical measurements
Electrochemical measurements were carried out on the prepared catalysts in 1 M KOH using a standard three-electrode system. Linear sweep voltammetry (LSV) curves of the samples with different molar ratios of Ni to Fe on NF are shown in Figure 5(a). The NiOOH sample has poor OER performance, with an overpotential of about 337 mV to obtain a current density of 10 mA cm−2. From the previous XPS analysis, the existence of low-valent Ni and O species is not conducive to the formation of OER intermediates and accounts for poor catalytic properties. With the addition of iron, the OER performance of the other samples is significantly improved. As shown in Figure 5(a), the overpotential shows a tendency to decrease first and then to increase with an increase in the ratio of Ni to Fe. The sample with a 4:1 molar ratio of Ni to Fe shows the best OER performance, which requires only 176 mV of overpotential to achieve a current density of 10 mA cm−2. There is an oxidation peak in the LSV curve, because the electrocatalytic material undergoes a redox reaction. The oxidation peak around 1.35–1.4 V is the oxidation peak of nickel, which leads to electron transfer and an increase in the current density. 6 The Tafel curves of the polarization curves can be derived from Figure 5(a) to explore the reaction mechanism. As shown in Figure 5(b), the sample with a 4:1 molar ratio of Ni to Fe exhibits a much lower Tafel slope (51 mV dec−1) than the other samples. This result proves that it has faster OER kinetics and a low electrocatalytic surface energy barrier. This can be attributed to the larger surface area and greater proportion of high-valent nickel. Figure 5(c) shows the relationship between sample composition and electrochemical performance (overpotential, Rp). It is intuitive that the electrocatalytic performance first becomes better and then worse on increasing the iron content. The sample with a 4:1 molar ratio of Ni to Fe possesses the optimal composition. 20

Electrocatalytic performance of samples with different molar ratios of Ni to Fe on NF: (a) LSV curves at a scan rate of 5 mV s−1, (b) Tafel plots, (c) relationship between composition and catalytic performance, and (d) the stability of NiFe LDH with a 4:1 molar ratio of Ni to Fe.
In practical applications, the stability of the catalyst is an important index. Hence, the stability of the sample with a 4:1 molar ratio of Ni to Fe was tested by chronoamperometry. As shown in Figure 5(d), the measurements were performed continuously at η = 0.28, 0.40, and 0.53 V, and the corresponding current densities are 10, 30, and 50 mA cm−2, respectively. The stability was tested under three different current densities: low, medium and high, in which manner the stability can be evaluated more comprehensively. The current density has little attenuation at lower overpotential, and when η = 0.53 V, the current density even has a slight upward trend. This phenomenon has been reported in previous articles, and it can be inferred that the structure of the NiFe LDH has partly changed into a more stable oxide phase and forms a mixed-phase under high voltage. This structure is conducive to the activity and stability of the sample.21,22
We also used electrochemical impedance spectroscopy (EIS) to evaluate the charge transferability in different samples. As shown in Figure S5(a) in the Supporting Information, Rs is the electrolyte resistance, Rp is the charge-transfer resistance, and CPE is a constant-phase element. The EIS results are listed in Table S2 in the Supporting Information. The Rp value of the sample without iron is much greater than the others, and NiFe LDH (4:1) has the smallest Rp value (0.577 Ω) among all the samples indicating a faster charge transfer and favorable reaction kinetics in NiFe LDH (4:1). As shown in Figure S5(b) in the Supporting Information, the Cdl value of NiFe LDH (4:1) is 2.71 mF cm−2, which is higher than other samples, indicating that NiFe LDH (4:1) has a larger electrochemically active surface area (ECSA), which is conducive to the OER. Figure S6 in the Supporting Information shows SEM image of NiFe LDH with a 4:1 molar ratio of Ni to Fe after stability test. The sample retains the basic structure and the edges become blurred. Figure S7 in the Supporting Information shows the XPS after OER. A slight negative shift for Fe 2p and O 1s spectra can be observed, but the change is not obvious. It can be inferred that the valence state of Ni and O decreases a little and the catalytic performance decreases slightly after OER.
Conclusion
In summary, NiFe LDHs with different compositions and NiOOH have been synthesized by a simple hydrothermal method. The electrocatalytic properties of NiFe LDHs are much better than those of NiOOH. It was found that the low-valent Ni and O species in NiOOH are unfavorable for OERs. These low-valent species disappear after adding iron, leading to a boost of the catalytic performance. By adjusting the molar ratio of Ni to Fe, the relationship between the composition and the electrocatalytic performance of NiFe LDHs was studied. The iron content significantly affects the crystal structure and the valence of nickel. The NiFe LDH with a 4:1 ratio of Ni to Fe exhibits a perfect nanoflower-like morphology with good crystallinity and possesses more high-valent nickel. It requires only 176 mV of overpotential to achieve a current density of 10 mA cm−2, and exhibits a much lower Tafel slope (51 mV dec−1).
Experimental section
Materials and chemicals
ACS Reagent grade FeSO4·7H2O, Ni(NO3)2·6H2O, and CO(NH2)2 were purchased from Sinopharm Chemical Reagent Co., Ltd. (Shanghai, China). All chemical reagents were of analytical grade and were used without further purification. NF with a thickness of 1.6 mm was purchased from Sigma-Aldrich (St. Louis, MO, USA) and used as the substrate.
Preparation of NiFe LDH on NF
NiFe LDH on NF samples was prepared by a simple hydrothermal reaction. In a typical process, 2.25 mmol of Ni(NO3)2·6H2O, 3.75 mmol of urea, and different amounts of FeSO4·7H2O (2.25, 0.5625, 0.375 mmol) were dissolved in 70 mL of water under vigorous stirring for 10 min in order to obtain a clear solution. This solution was then transferred to a Teflon-lined stainless-steel autoclave along with a piece of Ni foam (1 cm × 2 cm) soaked in the solution. The NF was previously cleaned with acetone, ethanol, 1 M HCl solution, and pure water under ultrasonication for 10 min each. The autoclave was heated to 120 °C and kept at this temperature for 10 h. After cooling the autoclave to room temperature, the sample was washed with water and ethanol, and then dried at room temperature. NiFe LDH samples with different molar ratios of Ni to Fe (1:1, 4:1, and 6:1) on NF were successfully obtained. For comparison, NiOOH (1:0) was also grown on NF via a similar process, but no iron was added to the solution.
Characterization
The crystal structures of the samples were analyzed by Ultima IV X-ray diffractometer (Rigaku, Japan, λ = 0.154 nm), with a scan rate of 8 min−1 and a scan range between 10° and 80°. The morphologies were investigated using an SEM (JSM-6700F) with an accelerating voltage of 15 kV, combined with energy-dispersive X-ray spectroscopy (EDS) to verify the element distribution of the samples. HRTEM (JEM-2010, 200 kV) and mapping images were further applied to characterize the morphologies. XPS measurements were performed on an ESCALAB 250 X-ray photoelectron spectrometer with Al–Kα irradiation. The Raman measurements were carried out using a confocal Raman microspectrometer (Renishaw, UK), with excitation at 532 nm. The specific surface area was evaluated through N2 adsorption isotherm measurements (Tristar II 3020M).
Electrochemical measurements
All electrochemical measurements were conducted using a CHI 660E electrochemical workstation (Shanghai Chenhua Instrument Co., China) in a 1.0-M KOH electrolyte solution with a typical three-electrode configuration. Pt wire and Ag/AgCl were used as the counter and reference electrodes, respectively. An electrode holder was used to clamp the sample as the working electrode. The electrolyte was purged with high-purity oxygen for 30 min to keep the solution saturated with oxygen before electrochemical measurements. The working electrodes were pretreated using 20 cycles of cyclic voltammetry scans from 0 to 1.0 V versus Ag/AgCl at 100 mV s−1 in 1 M KOH. LSV was carried out at a sweep rate of 5 mV s−1 between 0 and 0.8 V for the polarization curves. The Tafel slope was obtained according to the Tafel equation: log(i) = log(i0) + η/b, in which η is the overpotential, i is the anodic current density, i0 is the exchange current density, and b is the Tafel slope. The EIS measurements were recorded at 0.45 V versus Ag/AgCl for the OER, with a frequency range from 100 kHz to 0.1 Hz and an amplitude of 5 mV. The cycling stability curve was measured by chronoamperometry at overpotentials of 0.28, 0.40, and 0.53 V versus Ag/AgCl for 30 h continuously. The cyclic voltammetry curves were measured at different scan rates from 0.01 to 0.11 V versus Ag/AgCl. Double-layer capacitance (Cdl) was estimated by plotting the relationship between the scan rate and the current density difference at 0.06 V (vs Ag/AgCl). The scan rates were 0.02, 0.04, 0.06, 0.08, and 0.1 mV/s.
All potentials reported in this study were converted into the corresponding potentials versus the reversible hydrogen electrode (RHE) using the equation ERHE = EAg/AgCl + 0.197 + 0.059 × pH. All polarization curves were corrected for iR drop throughout the system, EiR corrected = ERHE − iRs, where i is the current, and Rs is the uncompensated ohmic solution resistance resolved from the Nyquist plots.
Supplemental Material
sj-docx-1-chl-10.1177_17475198221103519 – Supplemental material for Exploring the mechanism of the excellent catalytic activity of NiFe-layered double hydroxides in oxygen evolution reactions by modifying the iron content
Supplemental material, sj-docx-1-chl-10.1177_17475198221103519 for Exploring the mechanism of the excellent catalytic activity of NiFe-layered double hydroxides in oxygen evolution reactions by modifying the iron content by Ying Liu, Xueyan Lei, Bing Xiong, Jifang Chen, Wei Zou, Zhengping Fu and Yalin Lu in Journal of Chemical Research
Footnotes
Author contributions
Z.F., Y.L., and Y.L. contributed to the conception of the project. Y.L. performed the experiments. X.L., B.X., and J.C. contributed significantly to data analysis and manuscript preparation. W.Z. offered some useful advice on characterization. Z.F. and Y.L. wrote the manuscript.
Declaration of conflicting interests
The author(s) declared no potential conflicts of interest with respect to the research, authorship, and/or publication of this article.
Funding
The author(s) disclosed receipt of the following financial support for the research, authorship, and/or publication of this article: The authors acknowledge the financial support of the National Natural Science Foundation of China (U2032154), the Key Research and Development Program of Anhui (202004a05020072), the Anhui Initiative in Quantum Information Technologies (AHY100000), and the Anhui Provincial Natural Science Foundation (1908085ME119).
Supplemental material
Supplemental material for this article is available online.
References
Supplementary Material
Please find the following supplemental material available below.
For Open Access articles published under a Creative Commons License, all supplemental material carries the same license as the article it is associated with.
For non-Open Access articles published, all supplemental material carries a non-exclusive license, and permission requests for re-use of supplemental material or any part of supplemental material shall be sent directly to the copyright owner as specified in the copyright notice associated with the article.