Folate (FA) plays a key role in the biosynthesis of amino acids, purines, and pyrimidines in the human body, and intracellular folate metabolism has become an attractive target of tumor chemotherapy. In this work, an inclusion interaction was found between FA and cucurbit[7]uril (CB[7]), and the formation of a CB[7]-FA 2:1 supramolecular inclusion complex was confirmed by fluorescence spectra, UV-Vis absorption spectroscopy, 1H NMR, and molecular modeling calculations. In addition, FA is generally determined through the indirect fluorescent method because it shows weak fluorescence in aqueous solution. Therefore, a simple, direct fluorescence probe method for rapidly measuring FA was investigated, and the linear equation of FA was ΔF = 14.691C + 37.366 within the concentration ranges of 0.82 ~ 18.31 µg mL–1. The proposed direct fluorescence method was applied to the determination of spiked plasma. We demonstrated that this method could provide an experimental basis for the targeted administration of the CB[7]-FA complex, and it could be extended as a promising fluorescence detection method for drugs in vivo.
The supramolecular inclusion interaction was found between cucurbit[7]uril (CB[7]) and folate (FA), and the formation of a CB[7]-FA 2:1 inclusion complex was confirmed by fluorescence spectra, UV-Vis, 1H NMR, and molecular modeling calculation. The direct fluorescence method was successfully used for determining FA in plasma.
Introduction
In 1905, German chemist Behrend et al.1 prepared cucurbit[n]uril (CB[n], n = 5–8) macrocyclic compounds for the first time by a condensation reaction of formaldehyde and glycerol under strongly acidic conditions. Due to its two identical carbonyl fringed portals and hydrophobic cavity, CB[n] can use direct encapsulation and release of guest molecules through cavity encapsulation or portal ion-dipole interaction.2,3 With their unique molecular recognition properties, CB[n] and its derivatives have played a crucial role in material chemistry and supramolecular chemistry.4–6 Compared with other CB[n] members, CB[7] (Figure 1) has become a new favorite in recent years because of its remarkable capabilities. For example, CB[7] has a better solubility than CB[6] and CB[8] in aqueous solution. In contrast to CB[5], which is also soluble in water, CB[7] can form host–guest inclusion complexes with more organic compounds due to its larger cavity.7–9 Therefore, CB[7] has potential application value in fluorescent assays due to its unique combination of good water solubility, high chemical stability, and low biological toxicity.10–13
The structure of Cucurbit[7]uril (CB[7]), Berberine (BER), and Folate (FA).
Folate (FA) (Figure 1) is an important carrier of the one-carbon unit involved in the biosynthesis of amino acids, purines, and pyrimidines in human cells. Many studies have reported that a lack of FA is directly related to neural tube defects, megaloblastic anemia, tumors, and other diseases.14,15 Therefore, some anti-FA agents can block the purine and pyrimidine nucleotides required for DNA biosynthesis, leading to the death of tumor cells.16,17 Due to its unique structural properties, CB[7] inclusion complex has shown a promising potential of controlled release and targeted delivery of pharmaceutical agents.18–21 To our knowledge, no relevant study on inclusion of FA and CB[7] has previously been reported.
In this work, the formation of a CB[7]-FA inclusion complex was confirmed by fluorescence spectra, UV-Vis absorption spectroscopy, 1H NMR, and molecular modeling calculations. We report our investigation of the competitive interaction between fluorescent probes (berberine) and FA to occupy the CB[7] cavity. And a simple, direct, and rapid fluorescence probe method was established to detect FA in spiked plasma.
Results and discussion
Fluorescence spectral characteristics
The CB[7] solution alone had undetectable fluorescence emission, while berberine (BER) only had weak fluorescence in aqueous solution. However, the fluorescence intensity of the BER solution increased significantly with the addition of CB[7]. And the kinetics and thermodynamics of BER inclusion in CB[7] have also been studied by stopped-flow method, fluorescence titrations, and isothermal calorimetry in neat water.22,23 Interestingly, the fluorescence intensities of the CB[7]/BER complexes decreased obviously and gradually with increasing FA addition. This should be attributed to the introduction of FA, which competitively squeezes the BER molecule out of the CB[7] cavity. The fluorescence spectra of the CB[7]/BER complex in the presence of different concentrations of FA are shown in Figure 2. As can be seen from Figure 2, a new peak appears at 440 nm, which is the fluorescence spectrum peak of CB[7]/FA complexes. However, its wavelength is smaller than the probe peak, and its intensity is low, which does not affect the determination of probe method.
The fluorescence spectra of CB[7]/BER in different concentrations of FA in aqueous solution with λex 342 nm. The concentrations of FA (µg mL–1): (a) 0, (b) 3, (c) 5, (d) 7.5, (e) 10, (f) 15, (g) 18, and (h) 20. CCB[7] = CBER = 0.7 × 10⁻⁶ mol L–1.
Detection of stoichiometry between CB[7] and FA
UV spectrophotometry was applied to determine the stoichiometry of CB[7] and FA. Figure 3(a) shows the change in the UV spectrum after adding CB[7] to FA. In the range of 240 to 400 nm, the absorbance of the drug solution reached a maximum at 284 nm, which is the characteristic peak of FA. With an increasing CB[7] concentration, the absorption intensity of the system decreases. When the molar concentration of CB[7] is greater than twice that of FA, the absorbance almost no longer decreases, which indicates the interaction between CB[7] and FA. The data curves in Figure 3(b) show the absorbance versus the mole ratio of the host CB[7] and guest FA (NCB[7]/NFA), which also demonstrates the CB[7]-FA inclusion complex fit a 2:1 interaction model. The stoichiometry was also verified by Job’s curve (the embedded graph). The binding constant (K) of the CB[7]-FA complex was measured using the Benesi–Hildebrand (BH) method.
(a) Absorption spectra of different concentration of CB[7] (from 0 to 2.3 × 10⁻⁵ mol L–1) added to FA (5.7 × 10⁻⁶ mol L–1). (b) Absorbance versus NCB[7]/NFA curve, ΔA versus [NFA / (NCB[7] + NFA)] curve (embedded figure).
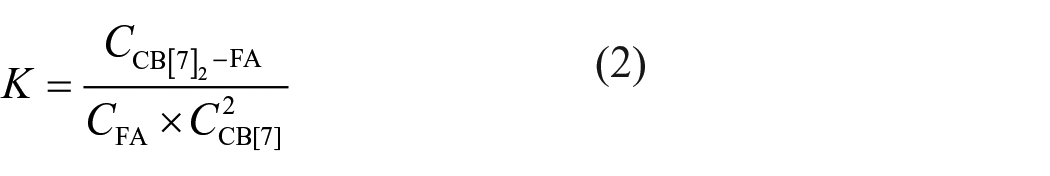
If the composition of the CB[7]-FA complex is 2:1, the expression is as follows
The inclusion constant (K) of the inclusion compound was calculated by the following formula
The binding constant (K) of the inclusion compound can be given according to the BH equation
where K is the inclusion constant; CCB[7]2-FA, CFA, and CCB[7] are the equilibrium concentrations; A0 and ε0 are the absorbance and molar absorptivity of FA without CB[7], respectively; and A and ε are the absorbance and molar absorptivity of FA in the presence of CB[7], respectively.
An excellent linear relationship was obtainable for as the abscissa (x) and as the ordinate (y), which gives the correlation coefficients (R2) = 0.9991 (shown in Figure 4). The inclusion constant of this 2:1 complex can be calculated as 5.40 × 10¹⁰ L2 mol–2.
The curve of versus . Experimental conditions, CFA: 4.758 × 10⁻⁶ mol L–1; CCB[7]: (C × 10–6 mol L–1).
Fluorescence quenching mechanism and 1H NMR spectroscopy
The isoquinoline ring and the substituted benzene ring of BER were connected by a six-ring structure. There was no conjugation system due to the two rings not being in the same plane, which results in weak fluorescence emission of BER. When CB[7] was added to the BER solution, the methoxy group of BER drilled into the CB[7] cavity, leading to electrostatic attraction between the positive charge of the nitrogen atom on the isoquinoline ring and the high-density electron cloud of the carbonyl oxygen in the CB[7] cavity. Finally, the isoquinoline ring and substituted benzene ring of BER formed a conjugated system, which resulted in fluorescence enhancement. At the same time, the decrease in the degree of freedom of the BER molecules in the CB[7] cavity was beneficial to the enhancement of fluorescence.24,25 When FA was added to the CB[7]/BER inclusion complex, FA competed with BER to occupy the CB[7] cavity, thus squeezing part of the BER out of the CB[7] cavity. At this time, the local microenvironment of the BER molecules changed, which seriously affected their photochemical properties, resulting in fluorescence quenching of the whole complex.
The formation of the CB[7]/FA complex was monitored by 1H NMR spectroscopy at 20 °C, and deuterated water was used as the solvent, shown in Figure 5. Assignments for FA and CB[7] are as follows: FA (D2O, ppm), 2.01 (m, H, Hβ1), 2.17 (m, H, Hβ2), 2.42 (t, 2H, Hγ), 4.47 (s, H, Hα), 4.83 (m, 2H, H9), 7.05 (d, 2H, H3' and H5'), 7.64 (d, 2H, H2' and H6'), 8.68 (s, 1H, H7). CB[7] (D2O, ppm), 4.08 (d, 14H, CH2), 5.38 (s, 14H, CH), 5.65 (d, 14H, CH2).22 When CB[7] was added to the FA aqueous solution, the chemical shift of the FA protons in the complex system changed. Compared with pure FA, the resonance peaks of the pteridine aromatic hydrogen protons (H7) in the complex system significantly shifted to higher fields, while the benzene ring hydrogen protons H3', H5' and H2', H6' show significant downfield shifts, so multiple peaks appeared at δ 7.98. With the increase in the stoichiometric ratio of CB[7]-FA, the height of the in situ peaks of the five protons decreased. After the stoichiometric ratio reached 2:1, the in situ peaks of the five protons disappeared. Based on the above phenomena, we speculated that CB[7] and FA form a 2:1 complex, and part of the methotrexate ring in the FA molecule is fixed in CB[7], while the heterocyclic nitrogen is near the carbonyl group on CB[7].
1H NMR spectra of FA (0.5 mmol L−1) with CB[7] in D2O containing: (a) 0.0 equiv., (b) 0.5 equiv., (c) 1.0 equiv., (d) 1.5 equiv., (e) 2.0 equiv., and (f) 3.0 equiv. of CB[7].
Molecular modeling calculation
The molecular models of 2:1 inclusion complex between CB[7] and FA are shown in Figure 6, and geometric optimizations and vibration analysis were carried out at the B3LYP/6-31G(d) level with the Gaussian 09 program. Including thermal correction to enthalpy at 298.15 K, the binding energy was calculated to be 40.0 kcal mol–1 for the CB[7]-FA complex. The pteridine ring part of FA was embedded in one CB[7] hydrophobic cavity, and the carboxyl part of FA was located inside another CB[7] cavity. This is consistent with the results of the 1H NMR experiments. FA is comprised of pteridine, p-aminobenzoic acid, and glutamic acid. FA bound to CB[7] at two binding sites (the pteridine ring and the carboxyl group). Due to the formation of ion-dipole and hydrogen-bond interactions between N–H and the carbonyl-laced portal of CB[7], the pteridine ring is enclosed in the CB[7] cavity. The carboxyl group of FA also forms hydrogen bonds with the carbonyl group of CB[7] so that the carboxyl group is fixed in the CB[7] cavity.
Optimized geometries of CB[7]-FA complex at the B3LYP/6-31G(d) level. (FA was drawn in ball and stick model, CB[7] was drawn in wireframe model.)
Optimization of the experimental conditions
The mixing time and solution pH have a significant influence on the fluorescence absorption intensity of the inclusion complex. Thus, the mixing time (0–30 min) and pH value (1.0–12.0) were investigated in this test. The fluorescence absorption value had its maximum change after the reagent was added and stirred for 10 min. Moreover, the fluorescence quenching values of all inclusion complexes reached a maximum and were the most stable at pH 2.0; therefore, the reactions in the follow-up experiments were conducted at pH 2.0 and stirred for 10 min.
Method validation and application
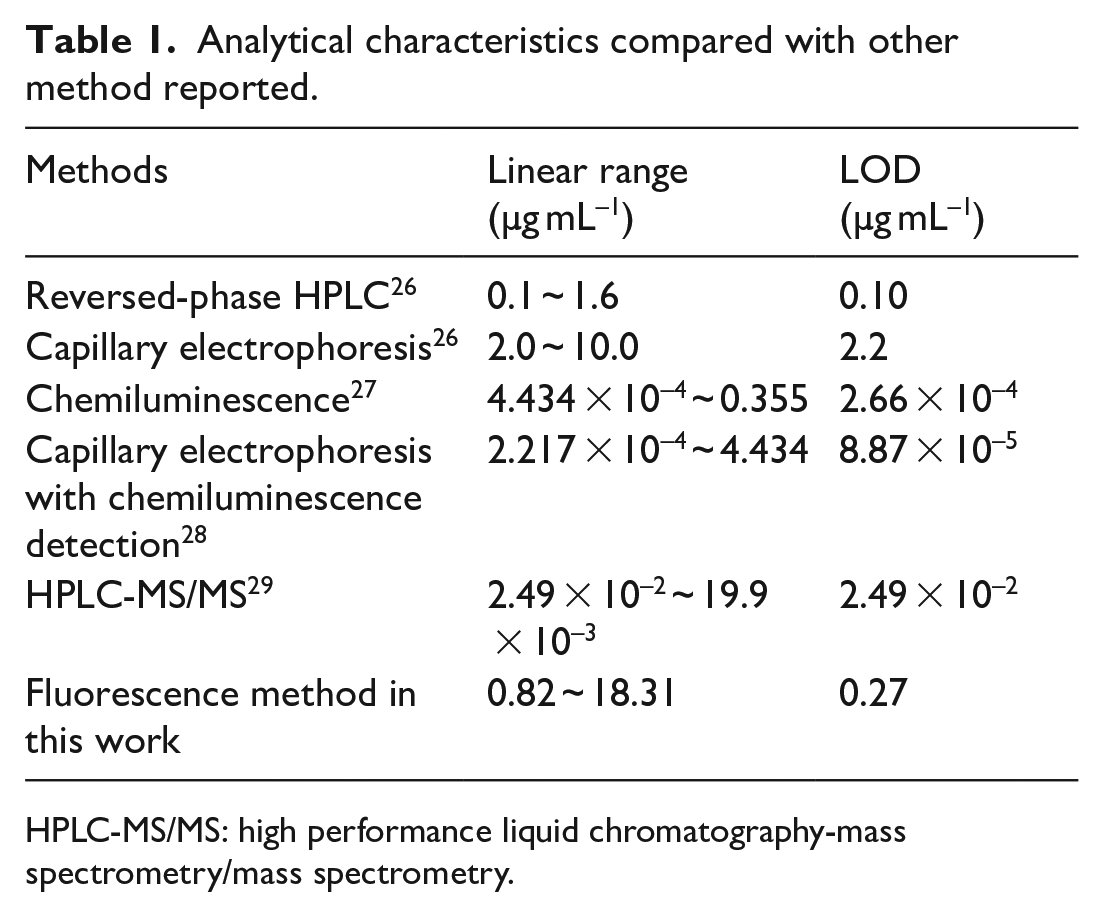
When CB[7]/BER was used as a fluorescent probe, linear regression equations were developed correlating the concentration (C) of FA as the abscissa (x) and the fluorescence quenching values (ΔF) as the ordinate (y). The linear regression equation was ΔF = 14.691C + 37.366 within the test range of 0.82 ~ 18.31 µg mL–1, and the correlation coefficient was 0.9991. The limit of determination was less than 0.27 µg mL−1. And according to the relevant data in the literature (shown in Table 1), the sensitivity of the fluorescence method presented here was higher than that of capillary electrophoresis, lower than that of reversed-phase high-performance liquid chromatography and chemiluminescence. Nonetheless, the optimized method established in this work should aid in the development of rapid and simple fluorescence approach for detecting FA.
Analytical characteristics compared with other method reported.
HPLC-MS/MS: high performance liquid chromatography-mass spectrometry/mass spectrometry.
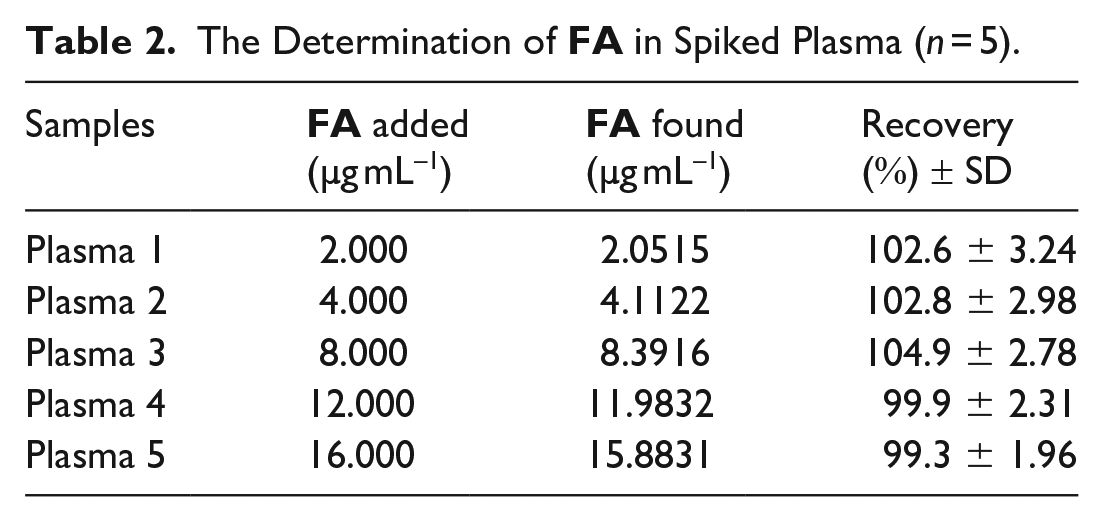
In our experiment, the direct fluorescence method was also applied to detect FA in human plasma under the selected optimum conditions (Table 2). Due to the influence of protein in plasma on the assay, we used an appropriate amount of methanol to deproteinize the plasma and thus eliminate the interference. The standard deviations were less than 5%, and the recoveries ranged from 99.3% to 104.9%. These results suggested that the optimized analytical method could be used to detect FA in biological fluids with good precision and accuracy.
In our experiment, the interaction mechanism between drugs and CB[7] was confirmed by fluorescence spectra, 1H NMR, and molecular modeling calculations. The direct fluorescence method was successfully used for detecting FA in biological fluids, and this fluorescence assay has advantages in terms of simplicity and rapidity for determining FA. In addition, the formation of the CB[7]-FA inclusion complex might provide an experimental basis for the targeted administration of FA antagonists.
Experimental
Reagents and chemicals
Phosphoric acid, boric acid, sodium hydroxide, and FA were supplied by Aladdin Reagent Co., Ltd. (Shanghai, China). BER was purchased from the China Institute for the Verification of Pharmaceutical and Biological Products (Beijing, China). CB[7] was synthesized according to the method described in previous reports.19,30
Equal amount of NaOH solution was added to dissolve the FA due to its poor water solubility and then diluted to the 100 µg mL–1FA stock solution with deionized water. Stock solutions of CB[7] and BER were prepared by adding deionized water to a final concentration of 1.0 × 10⁻⁴ mol L–1, respectively. All stock solutions were stored in the refrigerator at 4 °C for a long time. Triacid buffer was prepared with 0.04 mol L–1 boric acid, acetic acid, and phosphoric acid, and then adjusted to pH 2 with 0.2 mol L–1 sodium hydroxide or hydrochloric acid solution. All other reagents were of analytical reagent grade.
Instruments
Fluorescence detection was performed using a Perkin Elmer LS-45 spectrofluorometer Perkin Elmer Instrument Co., Ltd., USA. The slit widths of both the excitation and emission monochromators were 10 nm. Fluorescence spectra were acquired at a scanning rate of 1200 nm min–1. The absorption spectra analyses were analyzed by a U-3010 UV-Vis spectrophotometer (Hitachi Ltd. Japan).1 H NMR spectra were obtained in D2O buffer using a Bruker Avance III-HD 600 MHz spectrometer Bruker Co., Ltd., Switzerland).
Experimental procedure
First, 0.7 mL of 1.0 × 10⁻⁴ mol L–1CB[7] solution, 0.7 mL of 1.0 × 10⁻⁴ mol L–1 molecular probe solution (BER), 0.7 mL of pH = 2 triacid buffer, and variable amounts of FA solution were sequentially added into a series of 10-mL flasks. The mixture was diluted with deionized water and shaken for 10 min at room temperature. The fluorescence intensity of the sample solutions (FBER-CB[7]-FA) was analyzed at 342/495 nm, and the blank solutions (FBER-CB[7]) were analyzed under the same conditions. Then, the fluorescence quenching value (ΔF = FBER-CB[7]–FBER-CB[7]-FA) was measured.
The process of the preparation of spiked plasma is as follows. Two milliliters of plasma sample were mixed with 0.1 mL of FA standard solution. Plasma samples were removed from the protein by three washes with methanol and centrifuged at 4000×g for 20 min at room temperature. Then, the supernatant was used for the above spectral measurement.
Footnotes
Authors’ Note
This manuscript is original research, has not been previously published, and has not been submitted for publication elsewhere while under consideration. Each listed author on the manuscript is aware of and agrees to the contents of the manuscript, including the authorship. None of the listed authors has any financial or other interests that could be construed as a conflict.
Declaration of conflicting interests
The author(s) declared no potential conflicts of interest with respect to the research, authorship, and/or publication of this article.
Funding
The author(s) disclosed receipt of the following financial support for the research, authorship, and/or publication of this article: This work was supported by the National Natural Science Foundation of China (No. 81402895), the doctoral research initiation fund of Shanxi University of Chinese Medicine (No. 2020BK01 and No. 2020BK13), and the construction of a Chinese medicine discipline at Shanxi University of Chinese Medicine (No. 1008Z3).