
Abstract
(+)-Demethoxyaspidospermine was synthesized via the acylation of aspidospermidine with acetic anhydride, and the structure was determined by elemental analysis and Fourier-transform infrared and nuclear magnetic resonance spectroscopic tools and was supported by the simulated spectroscopic studies. Next, the stable geometries obtained by the conformational analysis performed at the B3LYP/6-31G(d, p) level were used for further investigations carried out in B3LYP and M06-2X functionals, and Hartree–Fock (HF) method, employed by the 6-311++G(d, p) basis set. Also, the natural bond orbital analysis revealed that the most contribution to the lowering of the stabilization energy came from n → π* and π → π* interactions. Moreover, the non-linear optic analysis has shown that the title compound can be a useful agent in the optoelectronic devices because of the optical properties. Also, the chemical reactivity tendency for nucleophilic or electrophilic attack reactions on the compound was evaluated by frontier molecular orbital analysis, and the reactive sites of the compound was shown by highest molecular orbital and lowest unoccupied orbital amplitudes and molecular electrostatic potential diagrams.
Keywords

Introduction
The unique structure of demethoxyaspidospermine and the diverse bioactivities of Aspidosperma alkaloids have long been of interest and have attracted much attention and extensive research by the synthetic community for more than 40 years, which continues to the present day. Aspidosperma-type alkaloids with a pentacyclic framework have been isolated from a range of plant sources, including the stem bark of Aspidosperma pyrifolium Mart, which contains the following alkaloids: vincadifformine, vallesine, demethoxyaspidospermine, and aspidospermidine. Aspidosperma species have a long history of medicinal applications, including the treatment of malaria and fever in South American countries.1–3 The unique molecular architecture and the vast array of important biological activities
4
,
5
characterizing many of these alkaloids have generated intense research interest over the years.
6
,
7
Although alkaloids with complex structures that belong to the Aspidosperma family have been the subject of growing interest, investigations of their synthesis have been limited to several alkaloids and related compounds that comprise their basic skeleton.8–10 The core structure of Aspidosperma alkaloids is typically a pentacyclic
For this reason, we decided to investigate the structure, electronic, and spectroscopic properties of demethoxyaspidospermine because the results might provide useful information for synthetic chemists. In this paper, we selected aspidospermidine as our starting material
20
,
21
and then performed the acylation of compound
Results and discussion
Conformational analysis and molecular geometry
The conformational analysis of the title compound illustrated in Figure 1 has been performed with the dihedral angles that are τ1 (C40–C39–C15–C14), τ2 (O48–C47–N13–C8), and τ3 (C49–C47–N13–C8) changing in steps of 10° from 0° to 360°. The conformational analysis curves for the dihedral angles τ1 and τ2 are given in Figure 2 because the stable conformers obtained from the dihedral angles τ2 and τ3 according to rotation of the acetyl group around the rings A, B, and C (RA, RB, and RC) are found to be similar to each other. Also, the total and relative energies as a function of each torsion angle during the PES scan of demethoxyaspidospermine are given in Supplemental Table S1 (see the Supporting Information).

The chemical structure with the dihedral angles defined as τ1 (C40–C39–C15–C14), τ2 (O48–C47–N13–C8), and τ3 (C49–C47–N13–C8) and optimized structure of demethoxyaspidospermine (given in Scheme 1).

The synthesis of (+)-demethoxyaspidospermine.
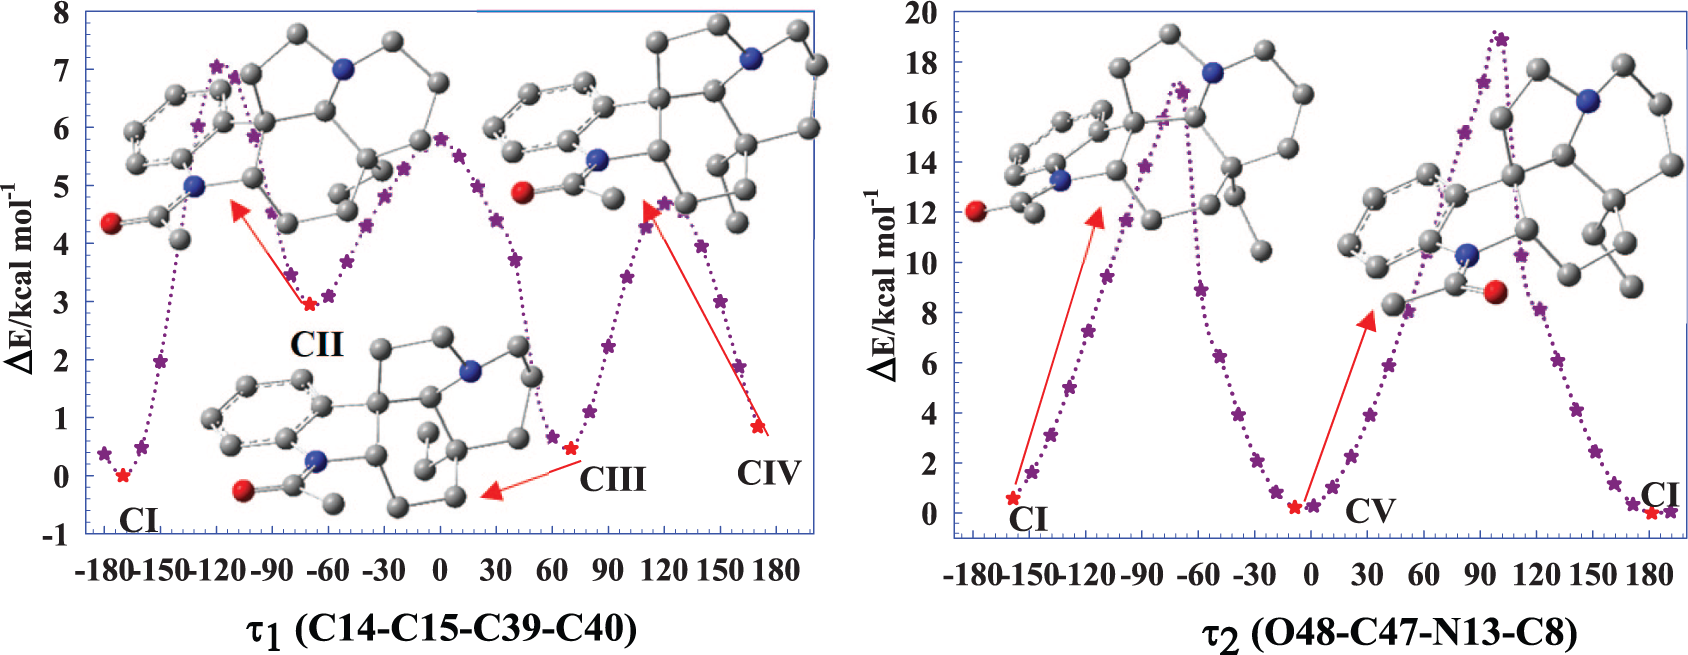
The PES curves and stable conformers of demethoxyaspidospermine at the B3LYP/6-31G(d, p) level in the gas phase.
From Figure 2, the five stable conformers have been determined by the PES analysis according to the acetyl and ethyl group orientation around the ring system of the title compound. These stable conformers have been re-optimized by the M06-2X level, B3LYP level, and HF method of the 6-311++G(d, p) basis set. According to Supplemental Table S1, the relative energies of five stable conformers have been determined in the chloroform phase as 0.0 and 3.34 kcal mol−1 by the B3LYP level, 0.0–3.84 kcal mol−1 by the M06-2X level, and 0.0–4.39 kcal mol−1 by the HF method. From Supplemental Table S1,
Table 1 shows the optimized geometric parameters of the five stable conformers for demethoxyaspidospermine; full data have been given in Supplemental Table S2. We have compared selected parameters for the title compound with structurally related indole derivatives
22
,
23
because of no experimental and computational data. It is clear that the bond lengths are very similar to each other. As expected, the aromatic C–C bond lengths for
Selected optimized parameters of the demethoxyaspidospermine in the chloroform phase.

Also, it is worth discussing the dihedral angles of all conformers. It should be noted that the C40–C39–C15–C14 dihedral angle for
NBO analysis
NBO analysis using the second-order perturbative theory results provide the useful information of the hybridization and covalency effects in the polyatomic wave function as a chemical phenomenon being important in terms of the prediction of the intramolecular and intermolecular interactions such as the intramolecular charge transfer, H-bonding tendency, and conjugative interactions.
24
,
25
Weinhold et al.
24
,
25
have defined the second-order perturbative energy lowering for a specific molecular system due to the electron delocalization or electron density transfer from the filled bonding orbital (or lone pairs) of the “Lewis base” into the unfilled antibonding orbital “Lewis acid.” The stabilization energy
The important intramolecular interactions contributing to the lowering of the molecular stabilization energy for each of the stable conformers are given in Supplemental Table S3. We have calculated that the strong electron delocalization from the donor π (C1–C2) orbital to the acceptor π* (C3–C4) and π* (C5–C6) orbitals has been predicted for each stable conformer as follows: 20.71 and 19.06 kcal mol−1 (ED
i
= 1.65012e) for
NLO properties
The organic aromatic compounds having strong intramolecular charge transfer or electron density transfer between the donor and acceptor couple have been commonly studied since the invention of lasers in the 1960s because they can serve as optical materials used in electro-optic modulation, optical memory, telecommunications, and optical interconnections. 26
Table 2 shows the μ, α0, Δα, and β tensors for all the methods in the chloroform phase calculated at the B3LYP level; the gas phase values are given in Supplemental Table S4. It is clear that the static dipole moment has changed with the conformational structure as well as the solvent dielectric constant, that is, the μ values of all conformers (B3LYP) have been predicted as 4.437 (
The NLO analysis results for demethoxyaspidospermine in the chloroform phase.

NLO: non-linear optic.
From Table 2 and Supplemental Table S4, it can be seen that the β tensors determined by the B3LYP level are nearly twice as high as those of the HF method, in both phases. Also, the calculated first-order hyperpolarizability (β) for
Chemical reactivity descriptors, FMO analysis, MEP diagrams
The highest molecular orbital (HOMO), the lowest unoccupied orbital (LUMO), and the HOMO–LUMO gap energy (ΔE = ELUMO−EHOMO) have been used to evaluate the kinetic stability and chemical reactivity of a specific molecular system. 28 , 29
The calculated quantum chemical parameters computed in the chloroform phase are given in Table 3; all data are provided in Supplemental Table S5. Accordingly, the energy gap ranking has been calculated as follows:
The calculated quantum chemical and physicochemical parameters of the five stable conformers of demethoxyaspidospermine in the chloroform phase.

HOMO: highest molecular orbital; LUMO: lowest unoccupied orbital.
ΔE (energy gap), χ, η, ω, and ΔNmax are in electronvolt; HOMO and LUMO energies are in atomic units.
The HOMO and LUMO amplitudes for all conformers are given in Figure 3; the HOMO and LUMO amplitudes for the M06-2X level of the theory and the HF method are given in Supplemental Figure S1. It can be noted from Figure 3 that the HOMO density for

HOMO, LUMO (iso value: 0.02), and MEP (iso value: 0.0004) pilots of the five stable conformers for the demethoxyaspidospermine by using the B3LYP/6-311++G(d, p) level of the theory in the chloroform phase.
MEP diagrams are used to predict the chemical reactivity tendency and intermolecular or intramolecular interactions that occur in a specific molecular system. MEP diagrams are represented by a color scheme expressing the electrostatic potential change with respect to the order: red (electron-rich region) < orange < yellow < green < light blue < blue (electron-poor region). Figure 3 also shows the MEP graphs for all conformers by the B3LYP level in the chloroform phase; the MEP diagrams for the M06-2X level of theory and the HF method have been given as Supporting Information in Supplemental Figure S1. Accordingly, the electron density for all conformers from the red to blue have changed as
Vibrational analysis
The selected vibrational modes of the title compound are given in Supplemental Table S6; the simulated frequencies for the compound have been scaled down by using the scaling factor 0.960 32 for B3LYP/6-311++G(d, p), 0.9489 33 for M06-2X/6-311++G(d, p), and 0.9050 34 for HF, in order to make the calculated results compatible with the experimental results. Full potential energy distribution (PED) assignments and the vibrational frequencies of the most stable conformer can be seen from Supplemental Table S6. Figure 4 shows the observed and simulated infrared (IR) spectra. Also, the simulated IR spectra of each stable conformer have been given in Supplemental Figure S2.

Experimental by FTIR and simulated IR spectra of demethoxyaspidospermine in the chloroform phase.
Recently, the C=O vibration 35 was recorded by FTIR spectroscopy at 1725 and 1654 cm−1 and simulated by the B3LYP/6-311++G(d, p) level in the range 1789–1654 cm−1. 35 , 36 Here, the C=O stretching signal occurred at 1672 cm−1 and simulated for the most stable conformer at 1623 (B3LYP), 1653 (M06-2X), and 1672 cm−1 (HF).
In the past, the aromatic C-C stretching modes for the imine oxime derivative were recorded at 1582 and 1579 cm−1 and simulated by the B3LYP/6-311++G(d, p) level at 1594 and 1577 cm−1. 37 Also, Kanaani et al. 38 recorded the aromatic C-H stretching signals for the phenyl rings of a heterocyclic imidazole compound in the range 3182–2929 cm−1 by FTIR spectroscopy and simulated them in the range 3048–3086 cm−1 by the B3LYP/6-311++G(d, p) level of the theory. Moreover, they 38 observed in-the-plane (IPB) and out-of-the-plane (OPB) HCC bending modes in the range of 1334–1012 cm−1 and 926–560 cm−1, respectively. Also, these bending modes for the imine oximes were calculated 37 in the range 1470–1040 cm−1 and 963–511 cm−1 by the B3LYP/6-311++G(d, p) level, respectively. Moreover, the symmetric CH3 (νCH3) and asymmetric CH3 (νasCH3) stretching modes for the heterocyclic imidazole derivatives were calculated by DFT at 3031–3015 cm−1 and 2944 cm−1 and were recorded at 2895 and 2845 cm−1 in the IR spectrum, respectively. 38
In this work, we have observed the C-C stretching bands for the aromatic part of the title compound at 1647 and 1594 cm−1 and simulated them at 1576, 1572, and 1011 cm−1 by the B3LYP level, whereas this mode has been assigned as 1592, 1583, and 1009 cm−1 by the M06-2X level and 1610, 1601, and 1005 cm−1 by the HF method. Also, the C-C stretching modes contaminated with the in-plane C-H bending (IPB HCC) modes have been calculated at 1453, 1436, 1259, 1141, 1075, and 1015 cm−1 by the B3LYP level and recorded at 1461 cm−1. It can also be seen from Supplemental Table S6 that the other IPB HCC bending vibrational modes for the aromatic ring (R
Here, the asymmetric and symmetric stretching modes for the methylene group (νC39H2) have been calculated at 2948 (78%) and 2920 cm−1 (79%) by the B3LYP level, 2919 (91%) and 2885 cm−1 (85%) by the M06-2X level, and 2895 (67%) and 2861 cm−1 (74%) by the HF method. In addition, the symmetric stretching mode for the C40-H3 and C49-H3 groups of the title compound have been simulated by the B3LYP level at 2926 (83%)–2927 cm−1 (84%) and 2944 cm−1 (85%), respectively. Moreover, the symmetric bending vibration for the methyl groups has been assigned at 1370 and 1362 cm−1 for the C40-H3 group and 1373, 1346, 1343, 1340, and 1336 cm−1 for the C49-H3 group, at the B3LYP level. From Supplemental Table S6, the bending modes for the non-aromatic rings (R
The C-N stretching modes have generally appeared in the region of the IR spectra containing the mixed vibrational modes. 19 , 27 , 39 Recently, the νNC stretching modes were observed at 1594, 1341, 942, and 875 cm−1 by FTIR spectroscopy and at 1602, 1345, and 937 cm−1 by FT-Raman spectroscopy, also calculated 27 at 1596, 1343, 960, and 868 cm−1 by the B3LYP level. In this work, the νN13-C stretching modes for CI have been calculated by the B3LYP level at 1453, 1373, 1146, 1105, and 917 cm−1, whereas the νN26-C vibrations have been simulated at 1157, 1146, 1133, 1116, 1098, and 877 cm−1 (as not mixed). In addition, the νN13-C and νN26-C modes have given signals in the IR spectrum at 1461, and 1379, 903 and, 1124 and 878 cm−1, respectively.
13C and 1H NMR spectral analyses
All computed data, including the B3LYP and M06-2X levels of the DFT method and HF method, can be seen in Supplemental Table S7a–7c. Also, the regression graphics and the correlation equations to show the agreement between the observed and simulated 1H and 13C NMR shifts have been given in Supplemental Figure S3 and Supplemental Table S8. Also, the observed 1H and 13C NMR spectra of the title compound are given in Supplemental Figure S4.
From Supplemental Table S8, the recorded chemical shifts are more compatible with those calculated by the DFT method than the HF method. In this work, the best correlation between the experimental and simulated 13C NMR shifts were found for
In the past, 13C NMR chemical shifts for the aromatic rings were observed in the range 116.3–150.1 ppm in CDCl3 and simulated by the MPW1PW91 level in the range of 114.76–148.22 ppm in the gas phase.
40
In literature, non-aromatic ring 13C isotropic chemical shifts for the dithiocarbamate derivatives were observed by Arslan et al.
41
in the range 25.0–47.90 ppm in DMSO and also predicted at 25.95–55.67 ppm by the B3LYP level. From Supplemental Table S7, the NMR signal for the C47 atom attached to the O48 atom has significantly shifted to high frequency; the 13C chemical shift for the C47 atom has been recorded at 169.2 ppm and calculated at 175.9 ppm (
In recent work, the 1H NMR chemical shifts of the aromatic ring for a carbazole derivative were observed
43
in the range 7.24–7.78 ppm and simulated by the DFT method at 6.35–7.76 ppm, whereas the non-aromatic shifts were recorded at 1.78–2.94 ppm and calculated at 1.99–3.21 ppm. In this study, the aromatic ring proton signals for the studied compound have been observed at 6.97–8.51 ppm. In addition, the simulated signals are in the range of 7.31–8.47 ppm for
Conclusion
In this paper, we have highlighted the importance of investigation of Aspidosperma-type alkaloids, considering their widespread application in the traditional medicine and their vast array of potential biomedical applications. We then demonstrated a one-step method for synthesizing demethoxyaspidospermine, which is well known as an Aspidosperma-type alkaloid. The development of synthetic organic chemistry approaches to obtain these substances can make their future extraction from natural sources unnecessary.
In addition, the conformational analysis has revealed the five stable structures, the relative free energies of which have changed from 0.0 to 3.34 kcal mol−1 by using the B3LYP level in chloroform. NBO analysis has shown that the resonance interactions (π → π*) have been mainly responsible for the stabilization energy lowering for all stable conformers, but also the hyperconjugative interactions (σ → π*) for
Experimental
Reagents to synthesize of the title compound were purchased from Sigma and used as received. The reaction was monitored by thin-layer chromatography (silica gel 60 F254), and the melting point of the compound was determined using a capillary tube on a GallenKamp apparatus and uncorrected. 1H NMR (400 MHz) and 13C NMR (100 MHz) spectra were recorded in CDCl3 mixed with DMSO on a Bruker instrument DPX-400 MHz (high-performance digital FT–NMR spectrometer). The recorded chemical shifts are referenced to tetramethylsilane (TMS), and the δ coupling values are expressed in per million (ppm) and in Hertz (Hz), respectively. The FTIR spectrum of the title compound was recorded using a Mattson 1000 FTIR spectrometer using the KBr pellet method between 4000 and 400 cm−1 wave numbers (128 scans to get 4.0-cm−1 resolution). The mass spectrum was obtained using an Agilent 5973 gas chromatograph-mass spectrometer (GC-MS). A Costech ECS 4010 analyzer was used to perform the elemental analyses.
Synthesis of (+)-demethoxyaspidospermine
Computational details
The stable conformational structures of demethoxyaspidospermine were determined with the PES scan analysis by using the B3LYP/6-31G(d, p) level of the theory 45 , 46 in the gas phase. Then, the five stable conformers obtained from the conformational analysis scan were re-optimized with 6-311++G(d, p) basis set by using the B3LYP and M06-2X 47 levels and HF method. The second-order perturbation analysis in the NBO (NBO basis) 24 , 25 was employed to search the intramolecular charge transfer between the donor and acceptor orbitals, being important in terms of the biological or pharmaceutical importance of each stable conformer. In addition, the optical properties of each stable conformer were determined with NLO analysis. The Gauge-Independent Atomic Orbital (GIAO) 48 , 49 approach was used to predict the 1H and 1C NMR chemical shifts of each stable conformer of demethoxyaspidospermine by subtracting the shielding constants of TMS. The polarized continuum model (PCM) 50 , 51 was used to simulate the chloroform environment. All calculations of the title compound were conducted with Gaussian 09W. 52 GaussView 6.0 53 was used to verify the vibrational modes of the title compound as well as to give the pictorial representations of the FMO and MEP diagrams. The VEDA package 54 was used to assign the vibrational frequencies of the title compound via the PED analysis.
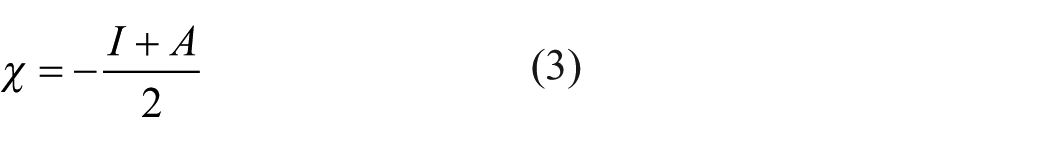
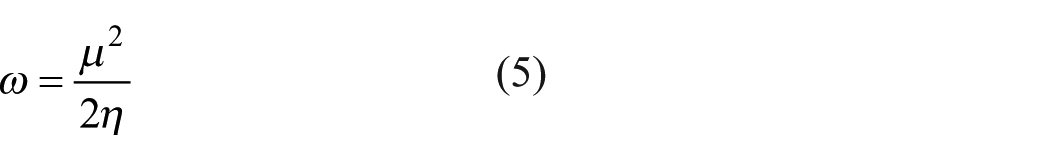
By Koopmans’ theorem for the HF method and by Janak’s theorem for DFT functionals, the ionization energy (I) and electron affinity (A) based on the FMO energies have been calculated with the equations (1) and (2). 55 , 56 Also, the global reactivity descriptors, including the electronic chemical potential (χ), global hardness (η), electrophilicity (ω), and the maximum charge transfer index (ΔNmax),57–59 are given in equations (3)–(6)


The static dipole moment (μ), the mean polarizability (α0), the anisotropy of the polarizability (Δα), and the frequency-independent first-order hyperpolarizability (β) tensors used in predicting the NLO properties of the title compound were calculated from the equations given below 60 , 61


where


Supplemental Material
Revised_Supplementary_Material – Supplemental material for The synthesis and spectroscopic characterization of (+)-demethoxyaspidospermine: Density functional theory calculations of the structural, electronic, and non-linear optic and spectroscopic properties
Supplemental material, Revised_Supplementary_Material for The synthesis and spectroscopic characterization of (+)-demethoxyaspidospermine: Density functional theory calculations of the structural, electronic, and non-linear optic and spectroscopic properties by Goncagül Serdaroğlu and Nesimi Uludağ in Journal of Chemical Research
Footnotes
Declaration of conflicting interests
The author(s) declared no potential conflicts of interest with respect to the research, authorship, and/or publication of this article.
Funding
The author(s) disclosed receipt of the following financial support for the research, authorship, and/or publication of this article: This work was supported by the Scientific and Technological Research Council of Turkey (TUBITAK, Project No. 112T503) and Sivas Cumhuriyet University, Scientific Research Projects Department (Grant number: CUBAP: EĞT-072). All calculations were carried out at TUBITAK ULAKBIM, High Performance, and Grid Computing Center (TR-Grid e-Infrastructure).
Supplemental material
Supplemental material for this article is available online.
References
Supplementary Material
Please find the following supplemental material available below.
For Open Access articles published under a Creative Commons License, all supplemental material carries the same license as the article it is associated with.
For non-Open Access articles published, all supplemental material carries a non-exclusive license, and permission requests for re-use of supplemental material or any part of supplemental material shall be sent directly to the copyright owner as specified in the copyright notice associated with the article.