
Abstract
Background:
Functional limitations play a critical role in shaping overall health and quality of life. Among women, functional difficulties are influenced by a variety of factors, which may vary across difference life stages.
Objectives:
This study examined the association between self-reported walking/communication difficulty and individual-level characteristics among women at three different life stages.
Design:
Cross-sectional data from the National Health and Nutrition Examination Survey 2021–2023 wave included women aged 18 and above (N = 3475 unweighted).
Methods:
Binary dependent variable analysis evaluated the association between demographic characteristics, income, and health status and walking/communication difficulties. A sensitivity analysis estimated these relationships within three different age groups: 18–45, 46–64, and 65 years and older.
Results:
High income (communication β = −0.40, p = 0.03; walking β = −0.60, p = 0.00) and having at least a college education (communication β = −0.30, p = 0.01; walking β = −0.32, p = 0.00) were associated with lower marginal likelihood of communication and walking difficulty. However, being out of the labor force had higher likelihood of communication (β = 0.36, p = 0.00) and walking difficulty (β = 0.30, p = 0.00). Among young adults, Hispanics demonstrated lower marginal likelihood of walking difficulty relative to their non-Hispanic White counterparts (β = −0.31, p = 0.05). Among middle-aged adults, Blacks had higher marginal likelihood of walking difficulty (β = 0.23, p = 0.02) relative to Whites while Hispanics has lower marginal likelihoods of communication difficulty (β = −0.36, p = 0.04).
Conclusion:
Individual characteristics were significantly associated with both types of functional difficulties in women, but these relationships differed between age groups. Understanding differences in functional difficulty will require understanding of how risk and protective factors vary throughout the lifespan.
Introduction
Functional difficulties, including challenges with communication and mobility, represent critical indicators of health and quality of life, particularly among women. As women age, their risk of developing such impairments increases, often due to a combination of biological, social, and environmental factors. 1 However, the onset and progression of functional limitations can vary significantly across the life course. While functional impairments are frequently associated with older adulthood, younger and middle-aged women are not immune to these challenges. 2 These impairments can stem from chronic health conditions, mental health issues, caregiving burdens, and broader socioeconomic stressors—all of which can manifest differently depending on age. 3
The number of individuals aged 65 and older in the United States is currently 57.8 million (~17.3% of the population) and is expected to continue to increase to more than 78 million by 2040, comprising 22% of the population. 4 The racial/ethnic diversity of the US population is also projected to shift. By 2050, 60% of the older adult population is expected to be Non-Hispanic White, a shift from 75%. Aging is associated with a wide array of adverse health outcomes, including chronic diseases, and many report more cognitive and physical difficulty, making a wide array of activities, such as making the bed, grocery shopping, and/or cooking meals, more challenging. 5 Functional limitations are associated with reduced community participation and quality of life, increasing overall health risk.
There are notable demographic differences in functional limitations. Women across the life course experience higher rates of functional limitations than their male counterparts6,7 despite having longer life expectancies and generally better health. 8 Social determinants are consistently associated with functional limitations. For example, lower socioeconomic status and less education are associated with more functional difficulty. 9 Subsequently, reduced social advantages, such as lower income, partially explain more functional limitations in women. Furthermore, among women, higher rates of functional limitations are associated with certain disease conditions and higher stress of paying for things.6,10 Racial/ethnic disparities in functional limitations are also observed. Black adults experience more functional limitations at younger ages. 11 Furthermore, Black women tend to experience higher health risks and worse health outcomes than their White counterparts 12 and their Black men counterparts. 13 These observed differences in functional limitations demonstrate that there is an interacting relationship between demographic characteristics, social determinants, and functional limitations. Figure 1 provides a framework for the different interactions between these factors. Social and structural systemic factors are impacted by demographic characteristics and impact social determinants. These intersecting demographic and social factors impact functional limitations. In turn, functional limitations influence social determinants. Lastly, these complex relationships occur in the setting of changing function and life experiences.

Theoretical framework of the relationship between demographic characteristics, social determinants, and functional limitations.
Despite recent work suggesting interventions at midlife could reduce long-term functional disability, 14 few studies have examined the association between social determinants and functional difficulty across different stages of life. Furthermore, although women experience higher rates of functional difficulties, women’s health is understudied.15,16 The National Institutes of Health Office of Research on Women’s Health developed research recommendations in 2021 to reduce observed research gaps. These recommendations included conducting research examining how social and structural determinants influence chronic conditions among women. 17 Using a nationally representative study, the National Health and Nutrition Examination Survey (NHANES), this study assessed the association between demographic characteristics and self-reported walking and communication difficulty among women. This study further examined these relationships within young adults, middle-aged adults, and older adults to determine variation in relationships by age groups. Understanding the relationships between demographic characteristics and functional limitations will provide insight into effective intervention targets across the life course.
Methods
Data
This study utilized data from NHANES—a nationally representative survey administered by the National Center for Health Statistics released every 2 years assessing the health and nutrition of US population through a series of demographic, nutrition, health, income, and behavioral questionnaires—a cross-sectional survey utilizing a complex, multistage probability sampling design to ensure generalizability to the non-institutionalized US population. NHANES combines in-home interviews with physical examinations conducted in mobile examination centers (MECs) and collects a wide array of health-related information, including medical, demographic, dietary, and laboratory data. NHANES acquires written informed consent from respondents prior to both the interview and the medical examination. NHANES is publicly available data and institutional review board approval is not required.
This analysis used NHANES questionnaire data from the August 2021 to August 2023 cycle. Given data collection disruptions during the COVID-19 pandemic, this cycle represents a continuous 2-year cycle with adjusted sampling weights for pooled analysis. The questionnaire files included variables related to functional limitations, self-reported medical conditions, health insurance coverage, employment and income, household composition, and demographic characteristics such as age, sex, race/ethnicity, and education level. Additionally, many studies using NHANES combine waves for more robust sample sizes. However, due to the significant variation in this cycle from previous cycles, across both recruitment and questionnaires, only this cycle was used. This study followed The Strengthening the Reporting of Observational Studies in Epidemiology for cross-sectional studies guidelines. 18
Sample
The sample was limited to respondents aged 18 years and above, who identified as female, completed the household interview component of NHANES, and provided valid responses to key functional questionnaire items relevant to the study. Respondents with missing values on primary functional variables of interest were excluded from the sample. After applying inclusion and exclusion criteria, the final weighted sample size represented approximately 100,241,330 (N = 3475 unweighted) females in the US population. Sample weights, strata, and primary sampling units were applied to account for the complex survey design and to ensure nationally representative estimates.
Key variables
Function
The NHANES functioning questionnaire provides respondent-level interview data on difficulties across a series of basic functional domains. The questions are part of a standard set of measures developed, tested, and endorsed by the Washington Group on Disability Statistics (WG) known as the Short Set on Functioning (WG-SS), 19 comprised of six questions. WG-SS questions ask about the adult’s level of difficulty (no difficulty, some difficulty, a lot of difficulty, or cannot do at all) to identify people who are at greater risk than the general population for experiencing restrictions in participation because of difficulties doing certain universal, basic actions. Two of the six items were used in the analysis: difficulty walking and difficulty communicating. To facilitate the interpretation of results and align with published guidance from the Washington Group, 20 answer choices were collapsed into no difficulty/some difficulty/a lot of difficulty, and cannot do at all. 21
Demographic characteristics
Demographic characteristics included in this study include age, race/ethnicity, education, marital status, and labor force participation. During household interviews, respondents provided their age (in years) at the screening time. Individuals aged 80 and over were top-coded at 80 in the publicly available NHANES data files. Three age categories were also created, each containing approximately one third of the sample: age 18–45, 46–64, and 65 and above. Respondents were also asked several questions about their racial and ethnic identities. First, they were asked whether they identified as Hispanic and subsequently asked to select one or more racial categories. Based on these responses, NHANES created a mutually exclusive race/ethnicity variable that classifies individuals as Mexican American, Other Hispanic, Non-Hispanic White, Non-Hispanic Black, Non-Hispanic Asian, and Non-Hispanic Other. In this analysis, Mexican American was combined with Other Hispanic, and Non-Hispanic was combined with Non-Hispanic Other. Respondents indicated the highest level of school or the highest degree they had received. These responses were used to create an indicator for college graduates. They also asked about their marital status, and these responses were used to create an indicator for being married. Finally, respondents indicated whether they usually worked at least 35 h weekly at all jobs or businesses. Those responding affirmatively were in the labor force.
Health status
All respondents indicated whether they were covered by health insurance or another health care plan. Health insurance was defined as obtained through employment or purchased directly, as well as government programs like Medicare and Medicaid that provide medical care or help pay medical bills. To account for potential confounding due to underlying health conditions, this study incorporated a modified version of the Charlson Comorbidity Index (CCI) using self-reported conditions from the Medical Conditions Questionnaire (MCQ). In the MCQ, respondents indicated whether a health care provider had ever diagnosed them with specific medical conditions. This method has been used in prior research to construct a self-reported CCI score, which has demonstrated comparable predictive validity to indices derived from administrative data.22,23 This methodology enables the control of confounding by adjusting for health status differences that may influence exposure and outcome. Although these data are self-reported and may be subject to recall or reporting bias, prior validation studies have shown acceptable concordance between NHANES self-reports and clinical records for major chronic conditions. 24 This index was categorized into two categories: 0–1 comorbidities and 2 or more comorbidities. Finally, respondent body mass index (BMI) was included as an indicator of body composition. 25 BMI, expressed as weight in kilograms divided by height in meters squared (kg/m2), is commonly used to classify weight status. 26 Respondent body measures data were collected, in MEC, by trained health technicians who were assisted by a recorder during the body measures examination. Following analytic convention, the log transformation of BMI was used in regression models. 27
Behavior
Two behaviors—alcohol consumption and smoking—were included to account for respondent heterogeneity. First, an indicator for whether respondents had smoked at least 100 cigarettes in their entire lives was included. Second, a variable indicating whether there was ever a time or times they drank 4/5 or more drinks of any kind of alcoholic beverage almost every day was included.
Income
The respondents were asked to report total family income, received last month in dollars, for themselves and the other family members. Using this reported information, NHANES calculated their family monthly poverty level index by dividing family income by the poverty guidelines, specific to the family size, as well as the appropriate year and state. NHANES poverty categories are allocated from the US Department of Health and Human Services, who develop poverty guidelines based on the US Census Bureau. 28 The index was then grouped into three categories (⩽1.30; <1.30, ⩽1.85; >1.85) and reported in the publicly available data. These categories were chosen because they represented commonly used percentages of the poverty guidelines, by federal programs, in determining eligibility. The higher your number, the farther you are from the poverty level. In other words, if your score is 1.30, you are at 130% of the poverty line. To qualify for most federal programs, you must be at 1.30 or below. In this analysis, the bottom two categories were collapsed, leaving two categories: ⩽1.85, >1.85.
Statistical analysis
Descriptive statistics were first computed to summarize the sample’s key functional, demographic, and health characteristics. Means and proportions were reported with 95% confidence intervals (CIs) using survey-weighted estimation. Bivariate associations between key independent variables (e.g., income, employment, and insurance) and health outcomes (e.g., functional limitations, CCI, and insurance) were examined using Rao-Scott chi-squared tests for categorical variables and survey-adjusted t-tests for continuous variables. Figure 2 demonstrates how the sample size was reached.

Calculation of sample size.
Since communication difficulty and walking difficulty represent distinct but potentially interrelated dimensions of functional impairment that often co-occur in individuals with neurological decline, these domains may share common underlying determinants—such as age-related decline, comorbid chronic diseases, or social disadvantage—as well as unobserved latent factors (e.g. neurodegenerative processes, stroke sequelae, or systemic inflammation) that influence both outcomes simultaneously. Estimating separate univariate probit models may fail to account for correlated error structures between the two outcomes, potentially leading to biased or inefficient estimates. A bivariate probit model was employed to allow for the joint estimation of the probability of having trouble in each domain while accounting for potential correlation in their unobserved determinants. The model’s correlation coefficient (rho) provides a formal test of the extent to which unobserved factors jointly influence the two outcomes, offering greater insight into the nature of functional limitations.
A bivariate probit regression model was estimated using the svy: biprobit command in Stata 18 (StataCorp LLC) to jointly model the two correlated binary outcomes.This approach allows for the simultaneous estimation of the two binary outcomes while accounting for potential correlation between their unobserved determinants. Marginal effects on the predicted probability of each outcome were estimated using predict(pmarg1) for communication difficulty and predict(pmarg2) for walking difficulty. Additional margins were calculated for the underlying linear predictors using predict(xb1) and predict(xb2).
An incremental covariate adjustment strategy was used to evaluate the stability and evolution of associations between predictors and functional outcomes. In Model 1, core sociodemographic variables (age, marital status, race/ethnicity, and health insurance) were included. Model 2 incorporated clinical and financial variables (comorbidities, BMI, and household income). Model 3 extended the model to include labor force participation, behavior, and education, reflecting a broader conceptual model of social determinants of health. All models were estimated with NHANES sampling weights, strata, and primary sampling units to produce nationally representative estimates and correct standard errors. Sample waves accounted for nonresponse bias. 29
Sensitivity analysis
To assess the robustness of the findings and explore potential effect heterogeneity across the life course, a stratified sensitivity analysis was conducted by age group. The full bivariate probit model was reestimated separately for three age strata: young adults (18–45 years), middle-aged adults (46–64 years), and older adults (65 years and older). This stratification allowed for examining whether the associations between sociodemographic, clinical, and socioeconomic factors and functional outcomes varied by age cohort. All models were estimated using NHANES sampling weights and design variables to ensure nationally representative estimates within each age group. Marginal effects were calculated for each subgroup to compare across age strata.
Results
Descriptive statistics
Table 1 provides the descriptive characteristics of the study sample (N = 3475), stratified by age group (18–45, 46–64, and 65+ years). Functional difficulties were common, with 13.9% of the full sample reporting some level of communication difficulty and 36.6% reporting difficulty walking or climbing steps. These difficulties increased with age (see Figure 3). Among adults aged 65 and older, 17.8% reported communication difficulty and 55.4% reported walking difficulty, compared with only 11.7% and 16.5%, respectively, among those aged 18–45 (p < 0.0001 for both outcomes).
Sample characteristics and age disaggregation.
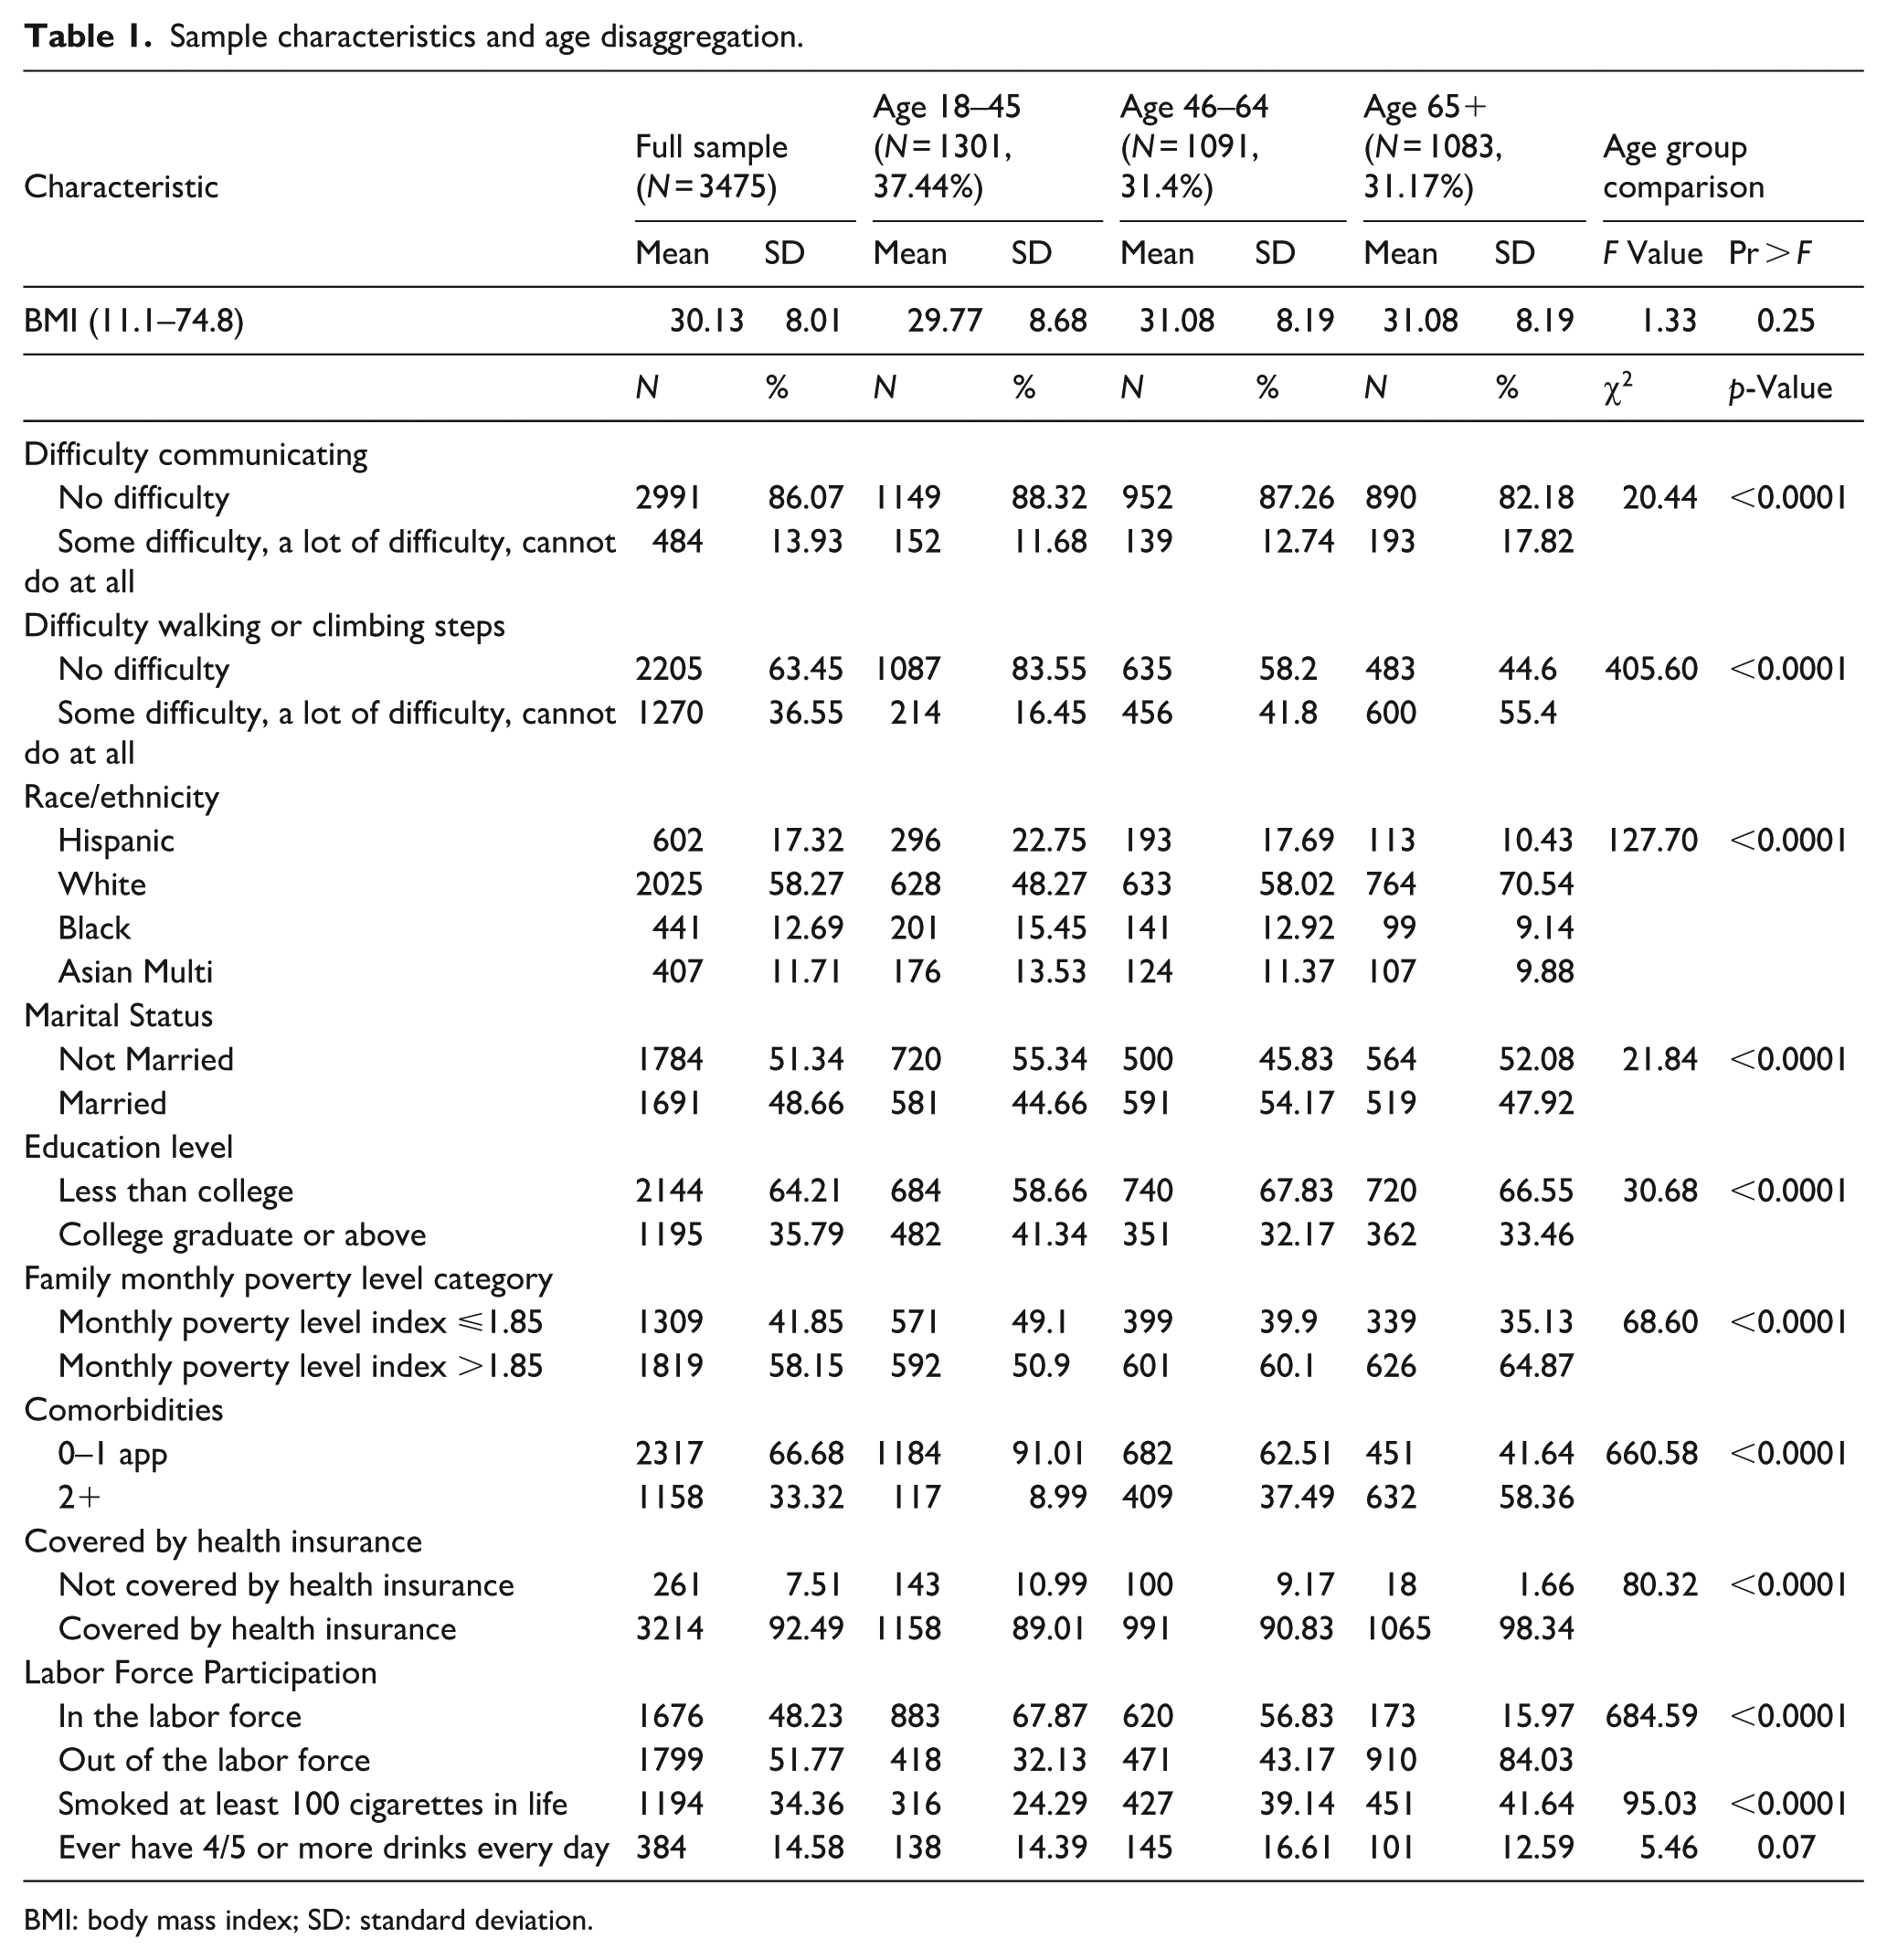
BMI: body mass index; SD: standard deviation.

Difficulty by age.
The sample was predominantly non-Hispanic White (58.3%), followed by Hispanic (17.3%), non-Hispanic Black (12.7%), and Asian or multiracial individuals (11.7%). Racial and ethnic composition varied significantly across age groups (p < 0.0001), with Hispanic and Black individuals more represented among younger adults. Marital status also differed by age, with younger adults more likely to be unmarried (55.3%) than those aged 46–64 (45.8%) or 65+ (52.1%; p < 0.0001).
Educational attainment and socioeconomic status showed significant variation. Overall, 64.2% of respondents had less than a college degree, with higher educational attainment more common among younger adults (41.3% of 18- to 45-year-olds had a college degree or higher, compared with 33.5% of adults aged 65+; p < 0.0001). Nearly 42% of the sample fell below 185% of the federal poverty level, with the highest proportion among the youngest group (49.1%) and the lowest among older adults (35.1%; p < 0.0001).
The comorbidity burden increased sharply with age. While 91.0% of adults aged 18–45 reported 0–1 comorbidity, over half (58.4%) of those aged 65 and older reported having two or more (p < 0.0001). Health insurance coverage was high overall (92.5%) but nearly universal among older adults (98.3%), compared with 89.0% among the youngest group (p < 0.0001). Labor force participation declined steeply with age. Among adults aged 18–45, 67.9% were in the labor force compared with only 16.0% of those aged 65 and older (p < 0.0001), reflecting expected life course transitions into retirement. Lastly, approximately 34% of the sample has smoked at least 100 cigarettes throughout their life and 15% drinks four or more drinks a day. Significantly-more adults aged 65 and older smoked 100 or more cigarettes in their life at 42% than young adults at 24%. Overall, statistically-significant differences (p < 0.0001) were observed across nearly all demographic, socioeconomic, and health variables by age group, underscoring the importance of accounting for age-related heterogeneity in modeling functional outcomes.
Regression analysis
Table 2 presents the results of the first increment in the bivariate probit model estimating the association between sociodemographic characteristics and the likelihood of reporting communication and walking difficulty. Older age was associated with increased odds of reporting communication difficulty. Adults aged 65 and older had significantly higher predicted probabilities than the reference group (ages 18–45), with a coefficient of 0.31 (95% CI: 0.18, 0.44; p < 0.001). Adults aged 46–64 did not differ significantly from the youngest group (p = 0.23). Being married had a significantly lower likelihood of reporting communication difficulty (β = −0.26; 95% CI: −0.34, −0.17; p < 0.001). No significant differences in communication difficulty were observed by race/ethnicity or insurance status in this initial model. Stronger associations were observed in the walking difficulty equation. Adults aged 46–64 and 65+ were significantly more likely to report walking difficulty than the youngest group (β = 0.79, 95% CI: 0.66, 0.92 and β = 1.13, 95% CI: 1.01, 1.25, respectively; p < 0.001 for both). Marriage was again protective, with married individuals significantly less likely to report difficulty walking (β = −0.19; 95% CI: −0.28, −0.11; p < 0.001).
Functional difficulty increment 1.

SE: standard error; CI: confidence interval.
Reference Group: Race/ethnicity (White), Age (18–45), Marital status (not married), Insurance (not covered by health insurance). Dependent Variables: Communication difficulty (0.1), Walking difficulty (0.1). Estimates reflect the relative likelihood of reporting communication/walking difficulty. Bold denotes significance at 95%.
Table 3 presents results from the second increment in the bivariate probit model, which extends the baseline specification by adding indicators for comorbidity burden (two or more chronic conditions), household income (categorized as high income versus ⩽185% of the federal poverty level), and BMI. Age 65+ remained a significant predictor with communication difficulty in this specification (β = 0.31, 95% CI: 0.13, 0.49, p = 0.00). Being married remained significantly protective (β = −0.15; 95% CI: −0.942, −0.267; p < 0.01). High income was independently associated with a lower likelihood of communication difficulty (β = −0.37; 95% CI: −0.52, −0.022; p = 0.00), suggesting a possible buffering effect of socioeconomic advantage. Although respondents with two or more comorbidities were more likely to report communication difficulty (β = 0.11), this association did not reach statistical significance (p = 0.07). No meaningful differences were observed in terms of race/ethnicity or health insurance status in this model. Associations with walking difficulty remained strong and statistically significant for older adults. Compared to those aged 18–45, adults aged 46–64 (β = 0.72) and 65+ (β = 1.07) were significantly more likely to report walking difficulty (p < 0.001 for both). The effect of being married was attenuated and no longer significant in this specification (β = −0.08; p = 0.12). Two or more comorbidities emerged as a significant risk factor (β = 0.52; 95% CI: 0.00, 0.39; p < 0.001), indicating substantial health-related functional limitations. High income was again strongly protective (β = −0.47; 95% CI: −0.59, −0.35; p < 0.001), consistent with the communication difficulty findings. High BMI was significantly associated with a higher likelihood of walking difficulty (β = 1.67; 95% CI: −7.36, −5.27; p < 0.001). Racial and ethnic differences, as well as insurance coverage, remained nonsignificant.
Functional difficulty increment 2.

BMI: body mass index; SE: standard error; CI: confidence interval; FPL: federal poverty level.
Reference Group: Race/ethnicity (White), Age (18–45), Marital status (not married), Insurance (not covered by health insurance), Comorbidities (0–1 Comorbidities), Income (income ⩽ 1.85 FPL). Dependent Variables: Communication difficulty (0.1), Walking difficulty (0.1). Estimates reflect the relative likelihood of reporting communication/walking difficulty. Bold denotes significance at 95%.
Table 4 shows results from the fully adjusted bivariate probit model (Increment 3). Age was no longer a significant predictor of communication difficulty. As in prior models, marriage remained significantly protective (β = −0.14; 95% CI: −0.27, −0.02; p = 0.03). High income continued to be associated with reduced odds of communication difficulty (β = −0.23; 95% CI: −0.39, −0.06; p = 0.01), and two new variables emerged as significant. Respondents who were out of the labor force had significantly higher odds of reporting communication difficulty (β = 0.35; 95% CI: 0.18, 0.52; p = 0.00), while those with a college education or higher had significantly lower odds (β = −0.28; 95% CI: −0.52, −0.04; p = 0.03). Comorbidity burden remained positively associated with communication difficulty, though not statistically significant (β = 0.06; p = 0.32). No statistically significant differences in race/ethnicity, insurance coverage, and smoking or alcohol consumption status were observed in this final model. Findings for walking difficulty remained robust and broadly consistent with prior increments. Older adults had markedly higher odds of walking difficulty than those aged 1845 (46–64: β = 0.66; 65+: β = 0.90; p < 0.001 for both). High comorbidity burden remained a strong predictor (β = 0.47; 95% CI: 0.34, 0.60; p < 0.001), and high income was again protective (β = −0.33; 95% CI: −0.45, −0.21; p < 0.001). Being out of the labor force (β = 0.31; 95% CI: 0.15, 0.48, p < 0.01) and having lower educational attainment (β = −0.21; 95% CI: −0.35, −0.07; p = 0.01) were both significantly associated with a higher likelihood of walking difficulty. Marital status was no longer statistically significant in this final model (p = 0.25). Hispanic ethnicity was marginally associated with lower odds of walking difficulty (β = −0.18; p = 0.05), but did not reach conventional significance levels. Alcohol consumption and smoking status were not significantly associated with walking difficulty.
Functional difficulty increment 3.

BMI; body mass index; SE: standard error; CI: confidence interval; FPL: federal poverty level.
Reference Group: Race/ethnicity (White), Age (18–45), Marital status (not married), Insurance (not covered by health insurance), Comorbidities (0–1 Comorbidities), Income (Income ⩽ 1.85 FPL), Labor force participation (in the labor force), Education (less than college graduation), Smoking (never smoked 100 cigarettes in life), Drinking (never had 4/5 or more drinks every day). Dependent Variables: Communication difficulty (0.1), Walking difficulty (0.1). Estimates reflect the relative likelihood of reporting communication/walking difficulty. Bold denotes significance at 95%.
Sensitivity analysis
To evaluate whether associations between sociodemographic, clinical, and economic factors and functional difficulty varied across the life course, models were stratified by age group: 18–45, 46–64, and 65 and older (Table A1 in Appendix A). Overall, the direction and magnitude of associations differed substantially by age, suggesting significant age-related heterogeneity.
Among females aged 18–45, higher income was significantly associated with reduced odds of both communication (β = −0.22, p = 0.090) and walking difficulty (β = −0.32, p = 0.009). Additionally, the presence of two or more comorbidities was strongly associated with walking difficulty (β = 0.78, p < 0.001), and Hispanic females in this age group had significantly lower odds of walking difficulty than their non-Hispanic White counterparts (β = −0.31, p = 0.045). No significant associations were found for race/ethnicity or insurance status with communication difficulty in this group. Among females aged 46–64, high income remained a significant protective factor for both communication (β = −0.60, p < 0.001) and walking difficulty (β = −0.65, p < 0.001). Comorbidity burden was again significantly associated with walking difficulty (β = 0.76, p < .001), while Black race emerged as a significant risk factor in this age group (β = 0.23, p = 0.019). Hispanic ethnicity was also significantly associated with lower odds of communication difficulty (β = −0.36, p = 0.04), although not with walking difficulty. Other covariates, including marital status and insurance, were not significantly associated with either outcome. Among females 65 and older, the associations with functional difficulty were more limited. High income remained consistently protective for both communication (β = −0.39, p = 0.003) and walking difficulty (β = −0.389, p = 0.003). Notably, no other covariates—including comorbidities, race/ethnicity, or insurance status—were significantly associated with either outcome in this oldest age group. Marriage was marginally protective for both outcomes (p = 0.06).
Discussion
This study examining functional difficulty among women in young, middle-aged, and older adulthood demonstrated that higher education, higher income, and having a job were significantly associated with reduced communication and walking difficulty. Additionally, being married was associated with reduced odds of having communication difficulties. Comorbidity burden and older ages were associated with a higher likelihood of having walking difficulties. Notably, we observed variation in associations between age groups. Although high income was associated with reduced likelihood of functional difficulty across all age groups, comorbidities were only associated with functional difficulty among women aged 18–45 and 46–64. Furthermore, race/ethnicity was only associated with functional difficulty among women aged 46–64. This study revealed that functional difficulty may be impacted by varying demographic characteristics at different ages.
Risk and protective factors
Demographic characteristics such as race/ethnicity, sex, and income act as protective or risk factors in health. Participating in the community as an older adult is a protective factor. 30 Higher income across the life span is associated with better health-related quality of life and is also a protective factor. 31 However, the strength and protectiveness of these characteristics may shift throughout the lifespan and through shifts in societal norms. Marriage has often been found to be a protective factor for health outcomes. 32 While there was an association between marriage and functional difficulty in this study, it was not as strong or consistent as expected. This may partially reflect the social shifts in cohabitation and more women not marrying and living alone. 33 Improving functional limitations will most likely require policies that consider the fluctuating nature of demographic characteristics and their impact throughout the life course.
Workforce participation and functional difficulty
The labor force participation variable emerged as an essential correlate of functional status, particularly in predicting communication difficulty. Being out of the labor force was associated with increased odds of functional limitation, possibly reflecting both a cause and a consequence of poor health. 34 This reciprocal relationship has been noted in previous work documenting the bidirectional associations between disability and employment. 35 Taken together, these findings highlight the multifactorial nature of functional decline and suggest that policies aimed at reducing functional limitations in women, particularly younger and middle-aged adults, should extend beyond clinical interventions to address broader socioeconomic conditions. Investments in income support, education, and chronic disease prevention may offer pathways to preserve function and independence across the life course.
Age and functional difficulty
The observed variation between demographic characteristics and functional difficulty across age groups is exciting. In line with the full sample, income is strongly associated with functional difficulty. Interestingly, race/ethnicity was only associated with functional difficulty in middle-aged adults. Previous explanations for more functional limitations are a higher number of condition-related disabilities such as diabetes and hypertension among Black adults. 11 However, the nonsignificant findings within young females and older females suggest that the racial/ethnic gap notably widens in middle-aged women. 36 This supports the need for earlier targeted interventions to improve functional outcomes later in life. Of note, comorbidities were not associated with functional difficulty in older females. The lack of racial/ethnic variation in older females may be partially due to survivor bias. Black women experience higher rates of chronic health conditions and disabilities than White women and at earlier ages. 12 The findings within the older female group may have captured primarily healthy individuals who lived to older adulthood. Ultimately, these findings demonstrate a need to examine functional limitations across the life course, specifically within young and middle-aged adults. This exploration will, in turn, improve functional limitations in aging adults.
Income and functional difficulty
Income emerged as a robust and consistent protective factor across models. Higher income was associated with significantly lower odds of both communication and walking difficulty across all age groups, thereby reinforcing the well-documented relationship between income and health functioning.37,38 Educational attainment also played a protective role, particularly in the final adjusted model, where college education was associated with lower odds of functional limitation. These findings underscore the value of investment in educational and economic opportunities as strategies to mitigate functional decline, especially among working-age adults. Studies have shown that higher education was one of several independent factors associated with higher health-related quality of life among elderly adults. 39
Limitations
The findings from this study should be interpreted under the following limitations. First, NHANES is a cross-sectional study, and therefore, a change in functional difficulty over time is not possible. However, we may see variations in trajectories not captured in a cross-sectional picture. Second, functional difficulty is represented by two self-report questions. Self-report is susceptible to biases such as recall bias. Furthermore, perception of difficulty is subjective, and variation in an individual’s perception of difficulty may have impacted findings. Although only two questions were used, a strength of this study was examining communication difficulty. Communication difficulty is often not specifically discussed despite its impact on quality of life. 40 Additionally, our findings demonstrated differences in associations of demographic characteristics, depending on physical or communication difficulty. Third, many of these factors most likely intersect to impact functional difficulty. For example, an increase in comorbidities most likely impact the likelihood of being in the labor force and income. Additionally, our analysis did not account for residual confounders such as environmental barriers. Future research should continue to examine how these factors may interact to impact individual adults differentially. Fourth, gender is intertwined with the social experience. While NHANES asks sex on a binary, it is important to consider gender as a social construct when evaluating differences in health among women. Future research examining functional difficulty and overall health in women should assess the role of gender as it impacts life experience and stress.
Conclusions
This study supports previous findings demonstrating that income level, either low or high, was a significant risk or protective factor, respectively, for functional difficulty in women across the life course. This study further contributes to the literature by revealing variation in associations between demographic characteristics at varying ages. Of particular interest was racial/ethnic association only within middle-aged women and the number of comorbidities associated only with walking difficulty in young and middle-aged women. Effective and appropriate intervention targets aimed at functional limitations may vary at different stages of life.
Supplemental Material
sj-docx-1-whe-10.1177_17455057251379618 – Supplemental material for Exploring age-related physical and cognitive decline in a nationally representative sample of US women
Supplemental material, sj-docx-1-whe-10.1177_17455057251379618 for Exploring age-related physical and cognitive decline in a nationally representative sample of US women by Elizabeth Evans and Molly Jacobs in Women's Health
Footnotes
Appendix A
Functional difficulty in women by age.

| Characteristic | Coefficient | SE | t-Statistic | p > |t| | 95% CI | Marginal likelihood | 95% CI |
|---|---|---|---|---|---|---|---|
| Age 18–45 | |||||||
| Communication difficulty | |||||||
| Married | −0.19 | 0.10 | −1.82 | 0.09 | −0.41, 0.03 | −0.03 | −0.07, 0.01 |
| Hispanic | −0.11 | 0.19 | −0.56 | 0.59 | −0.51, 0.30 | −0.02 | −0.09, 0.05 |
| Black | −0.14 | 0.18 | −0.79 | 0.44 | −0.51, 0.24 | −0.02 | −0.09, 0.04 |
| Asian/Other/Multi | −0.17 | 0.19 | −0.88 | 0.39 | −0.58, 0.24 | −0.03 | −0.09, 0.04 |
| Insurance | −0.11 | 0.19 | −0.58 | 0.57 | −0.51, 0.29 | −0.02 | −0.10, 0.06 |
| 2+ Comorbidities | 0.20 | 0.16 | 1.22 | 0.24 | −0.15, 0.55 | 0.04 | −0.04, 0.11 |
| High income | −0.22 | 0.12 | −1.81 | 0.09 | −0.48, 0.04 | −0.04 | −0.09, 0.01 |
| Intercept | − |
0.206 | −4.5 | 0 | −1.364, −0.487 | ||
| Walking difficulty | |||||||
| Married | 0.09 | 0.10 | 0.95 | 0.36 | −0.12, 0.30 | 0.02 | −0.03, 0.08 |
| Hispanic | −0.31 | 0.14 | −2.19 | 0.05 | −0.61, −0.01 | −0.07 | −0.14, −0.01 |
| Black | −0.01 | 0.13 | −0.11 | 0.92 | −0.30, 0.27 | 0.00 | −0.08, 0.07 |
| Asian/Other/Multi | −0.16 | 0.12 | −1.37 | 0.19 | −0.42, 0.09 | −0.04 | −0.10, 0.02 |
| Insurance | −0.07 | 0.23 | −0.30 | 0.77 | −0.57, 0.43 | −0.02 | −0.15, 0.11 |
| 2+ Comorbidities |
|
0.15 | 5.29 | 0.00 | 0.47, 1.09 | 0.23 | 0.12, 0.33 |
| High income | − |
0.11 | −3.00 | 0.01 | −0.55, −0.09 | −0.09 | −0.15, −0.02 |
| Intercept | − |
0.27 | −3.19 | 0.01 | −1.44, −0.29 | ||
| Age 46–64 | |||||||
| Communication difficulty | |||||||
| Married | −0.09 | 0.16 | −0.60 | 0.56 | −0.42, 0.24 | −0.02 | −0.08, 0.05 |
| Hispanic | − |
0.16 | −2.31 | 0.04 | −0.70, −0.03 | −0.06 | −0.11, −0.01 |
| Black | −0.08 | 0.19 | −0.39 | 0.70 | −0.48, 0.33 | −0.01 | −0.09, 0.06 |
| Asian/Other/Multi | −0.13 | 0.16 | −0.82 | 0.42 | −0.48, 0.21 | −0.02 | −0.08, 0.04 |
| Insurance | −0.18 | 0.26 | −0.66 | 0.52 | −0.73, 0.39 | −0.04 | −0.16, 0.09 |
| 2+ Comorbidities | 0.15 | 0.11 | 1.37 | 0.19 | −0.08, 0.38 | 0.03 | −0.02, 0.08 |
| High income | − |
0.11 | −5.37 | 0.00 | −0.84, −0.36 | −0.12 | −0.18, −0.07 |
| Intercept | − |
0.25 | −2.43 | 0.03 | −1.14, −0.07 | ||
| Walking difficulty | |||||||
| Married | −0.14 | 0.10 | −1.46 | 0.17 | −0.35 |
−0.05 | −0.12, 0.02 |
| Hispanic | −0.06 | 0.12 | −0.53 | 0.60 | −0.32, 0.19 | −0.02 | −0.11, 0.06 |
| Black | 0.23 | 0.09 | 2.62 | 0.02 | 0.04, 0.41 | 0.08 | 0.02, 0.14 |
| Asian/Other/Multi | −0.19 | 0.14 | −1.40 | 0.18 | −0.48, 0.10 | −0.06 | −0.16, 0.03 |
| Insurance | −0.21 | 0.41 | −0.52 | 0.61 | −1.09, 0.66 | −0.07 | −0.39, 0.24 |
| 2+ Comorbidities |
|
0.08 | 9.32 | 0.00 | 0.59, 0.94 | 0.28 | 0.21, 0.34 |
| High Income | − |
0.10 | −6.44 | 0.00 | −0.86, –0.43 | −0.23 | −0.31, –0.15 |
| Intercept | 0.18 | 0.35 | 0.49 | 0.63 | −0.58, 0.93 | ||
| Age 65+ | |||||||
| Communication difficulty | |||||||
| Married | −0.19 | 0.09 | −2.07 | 0.06 | −0.39, 0.01 | −0.05 | −0.09, 0.00 |
| Hispanic | 0.08 | 0.18 | 0.44 | 0.67 | −0.31, 0.47 | 0.02 | −0.08, 0.12 |
| Black | −0.03 | 0.16 | −0.16 | 0.88 | −0.37, 0.32 | −0.01 | −0.09, 0.08 |
| Asian/Other/Multi | −0.20 | 0.18 | −1.11 | 0.28 | −0.58, 0.18 | −0.05 | −0.13, 0.04 |
| Insurance | 0.10 | 0.43 | 0.23 | 0.82 | −0.81, 1.01 | 0.02 | −0.19, 0.23 |
| 2+ Comorbidities | 0.04 | 0.11 | 0.35 | 0.73 | −0.19, 0.26 | 0.01 | −0.05, 0.07 |
| High income | − |
0.11 | −3.55 | 0.00 | −0.62, –0.16 | −0.10 | −0.16, –0.04 |
| Intercept | −0.70 | 0.44 | −1.61 | 0.13 | −1.63, 0.23 | ||
| Walking difficulty | |||||||
| Married | −0.19 | 0.09 | −2.07 | 0.06 | −0.39, 0.01 | −0.09 | −0.17, 0.00 |
| Hispanic | 0.08 | 0.18 | 0.44 | 0.67 | −0.31, 0.47 | 0.02 | −0.15, 0.18 |
| Black | −0.03 | 0.16 | −0.16 | 0.88 | −0.37, 0.32 | 0.00 | −0.17, 0.16 |
| Asian/Other/Multi | −0.20 | 0.18 | −1.11 | 0.28 | −0.58, 0.18 | −0.03 | −0.16, 0.09 |
| Insurance | 0.10 | 0.43 | 0.23 | 0.82 | −0.81, 1.01 | −0.12 | −0.43, 0.19 |
| 2+ Comorbidities | 0.04 | 0.11 | 0.35 | 0.73 | −0.19, 0.26 | 0.14 | 0.05, 0.23 |
| High income | − |
0.11 | −3.55 | 0.00 | −0.62, −0.16 | −0.19 | −0.28, −0.10 |
| Intercept | −0.70 | 0.44 | −1.61 | 0.13 | −1.63, 0.23 | ||
SE: standard error; CI: confidence interval; FPL: federal poverty level.
Reference Group: Race/ethnicity (White), Income (⩽1.85 FPL), Insurance (Not covered by health insurance), Comorbidities (0–1 Comorbidities), Marital status (not married). Dependent Variables: Communication difficulty (0.1), Walking difficulty (0.1). Estimates reflect the relative likelihood of reporting communication/walking difficulty. Bold denotes significance as 95%.
Acknowledgements
None.
Ethical considerations
NHANES is publicly available data and institutional review board approval is not required.
Consent to participate
NHANES acquires written informed consent from respondents prior to both the interview and the medical examination.
Consent for publication
Not applicable.
Author contributions
Funding
The authors disclosed receipt of the following financial support for the research, authorship, and/or publication of this article: This work was supported in part by the US National Institutes of Health via predoctoral fellowship funding for first author under grant T32 HD043730.
Declaration of conflicting interests
The authors declared no potential conflicts of interest with respect to the research, authorship, and/or publication of this article.
Supplemental material
Supplemental material for this article is available online.
References
Supplementary Material
Please find the following supplemental material available below.
For Open Access articles published under a Creative Commons License, all supplemental material carries the same license as the article it is associated with.
For non-Open Access articles published, all supplemental material carries a non-exclusive license, and permission requests for re-use of supplemental material or any part of supplemental material shall be sent directly to the copyright owner as specified in the copyright notice associated with the article.