
Abstract
Background:
Patients with end-stage renal disease (ESRD) undergoing haemodialysis (HD) are associated with low quality of life (QoL) and high disease-related symptoms. The patient self-report instruments can assess the burden of physical and psychological symptoms. The Dialysis Symptom Index (DSI) is a specific instrument to evaluate the multidimensional reported symptoms by patients undergoing HD.
Aims:
To translate, validate and assess the psychometric properties of the Portuguese version of the DSI.
Methods:
A cross-cultural adaptation process from English to Portuguese and a validation study (n = 156) were conducted. Reliability, validity and responsiveness were assessed.
Results:
The patients’ most reported symptoms were, nausea (n = 86, 55%), muscle cramps (n = 92, 59%), feeling tired or lack of energy (n = 92, 59%), bone or joint pain (n = 88, 56%) and trouble staying asleep (n = 95, 60%). Cronbach’s alpha of the DSI was 0.87, and intraclass correlation coefficient was 0.868 (95%CI 0.836–0.896). The smallest detectable change was 28.32.
Conclusion:
The Portuguese DSI demonstrates excellent psychometric properties for assessing HD patients’ reported symptoms. It highlights symptom severity and impact, providing valuable insights for healthcare practitioners. Nurses can use the DSI to tailor interventions and enhance patient-centred care.
Keywords
Introduction
Patients with end-stage renal disease (ESRD) in haemodialysis (HD) can suffer from multiple physical or psychological symptoms, such as anorexia, dry mouth, diarrhoea, constipation, nausea-vomiting, swollen legs, muscle cramps, dizziness, drowsiness, restless legs syndrome, dry skin, cough, pruritus, sleep disorders, concentration span, chest and back pains, nervousness, sexual dysfunction and discomfort (Kalantar-Zadeh et al., 2022; Murtagh et al., 2007; Schick-Makaroff et al., 2019; Weisbord et al., 2007).
Despite the pronounced symptomatology, patients often fail to recognise the association of these symptoms with HD treatments. Moreover, the belief among patients that reporting their symptoms to healthcare professionals wastes their time exacerbates the challenge of assessing these symptoms (Schick-Makaroff et al., 2019). These complex symptoms’ burden remains underestimated and underrecognised (Rhee et al., 2022). Regular symptom screening is crucial for symptom identification and management in renal failure care and ensuring patients feel understood, especially given their life-limiting illness (Mehrotra et al., 2023).
Recently, patient-centred care and symptom science have grown to empower self-management. These concepts aim to prioritise patient preferences better and understand their symptom experiences (Kalantar-Zadeh et al., 2022). Standardised instruments such as patient-reported outcome measures (PROM) can contribute to assessing these patient’s symptoms by taking into account their well-being, health-related quality of life (HRQoL), functional status or other psychological and social aspects (Black, 2013; Churruca et al., 2021; Schick-Makaroff et al., 2019).
Existing generic instruments for HD patients, such as the PROMIS-57 (HRQoL), the Memorial Symptom Assessment Scale (physical and emotional symptoms), Rotterdam Symptom Checklist (symptom distress) (Kalantar-Zadeh et al., 2022) and even some specific instruments as the Kidney Disease QoL Questionnaire-Short Form, Version 1.3 by Korevaar et al. (2002) often do not adequately address common symptoms like fatigue, bone and joint pain, or psychological dimensions (Cho et al., 2018; Hays et al., 1994). Several specific instruments designed for assessing HD patients’ symptoms, such as The National Kidney Dialysis and Kidney Transplantation Study symptom checklist (Spiegel et al., 2009), Integrated Palliative Outcome Scale-renal (IPOS-r) (Raj et al., 2018), the Haemodialysis Symptom Distress Scale (HSD-22) (Chen et al., 2021) and the Dialysis Symptom Index (DSI) (Weisbord et al., 2004), often fail to measure the most frequently reported symptoms in ESRD patients comprehensively. A comparative study evaluating the available instruments for symptom assessment in ESRD patients identified the IPOS-r and the DSI as the two most suitable options, considering their psychometric properties (Van Der Willik et al., 2019).
The DSI, developed by Weisbord et al. (2004), is a validated instrument to assess the prevalence, severity and impact of symptoms in HD. It comprised 30 questions, each querying the presence or absence of a specific symptom. Symptom severity scores a four-point Likert scale, ranging from ‘Not at all’ to ‘Very’, and the total score ranges from 0 to 120. Higher scores reveal greater symptom severity (Weisbord et al., 2004).
A systematic review of PROM for assessing symptoms in HD patients identified the DSI as a feasible and acceptable tool, boasting a moderate response rate of 79–88%. It allows the simultaneous assessment of multiple symptoms without overburdening patients during psychometric evaluation (Sousa et al., 2023). Moreover, the DSI incorporation of one free-fill response option is crucial, enabling patients to identify symptoms not covered in the PROM (Mehrotra et al., 2023).
Routine employment of the DSI has demonstrated effective symptom management for ESRD patients, encompassing both physical and emotional domains (You et al., 2022). Also, when compared with other instruments, such as the IPOS-r, it demands less time to complete, offers greater transparency and patient-friendliness and aligns with the content validity established by Consensus-based Standards for the selection of health measurement instruments (COSMIN) (Terwee et al., 2018; Van Der Willik et al., 2019). Furthermore, the DSI surpasses the IPOS-r in certain aspects, including the absence of generalised formulation that can lead to interpretation challenges, a broader spectrum of symptoms, higher patient-reported symptom counts, enhanced specificity, comprehensiveness and straightforwardness in symptom evaluation for ESRD patients (Van Der Willik et al., 2019).
Several prior studies have undertaken the translation and validation of the DSI scale for other languages with good measurement properties, verifying the scale’s validity, reliability and construct validity (Table 1). This studies applied different approaches to assess validity and reliability (Almutary et al., 2015; Cho et al., 2018; Onsoz and Yesilbalkan, 2013; Zamanian and Kharameh, 2015).
Previous studies of Dialysis Symptom Index Scale Translation for other languages.
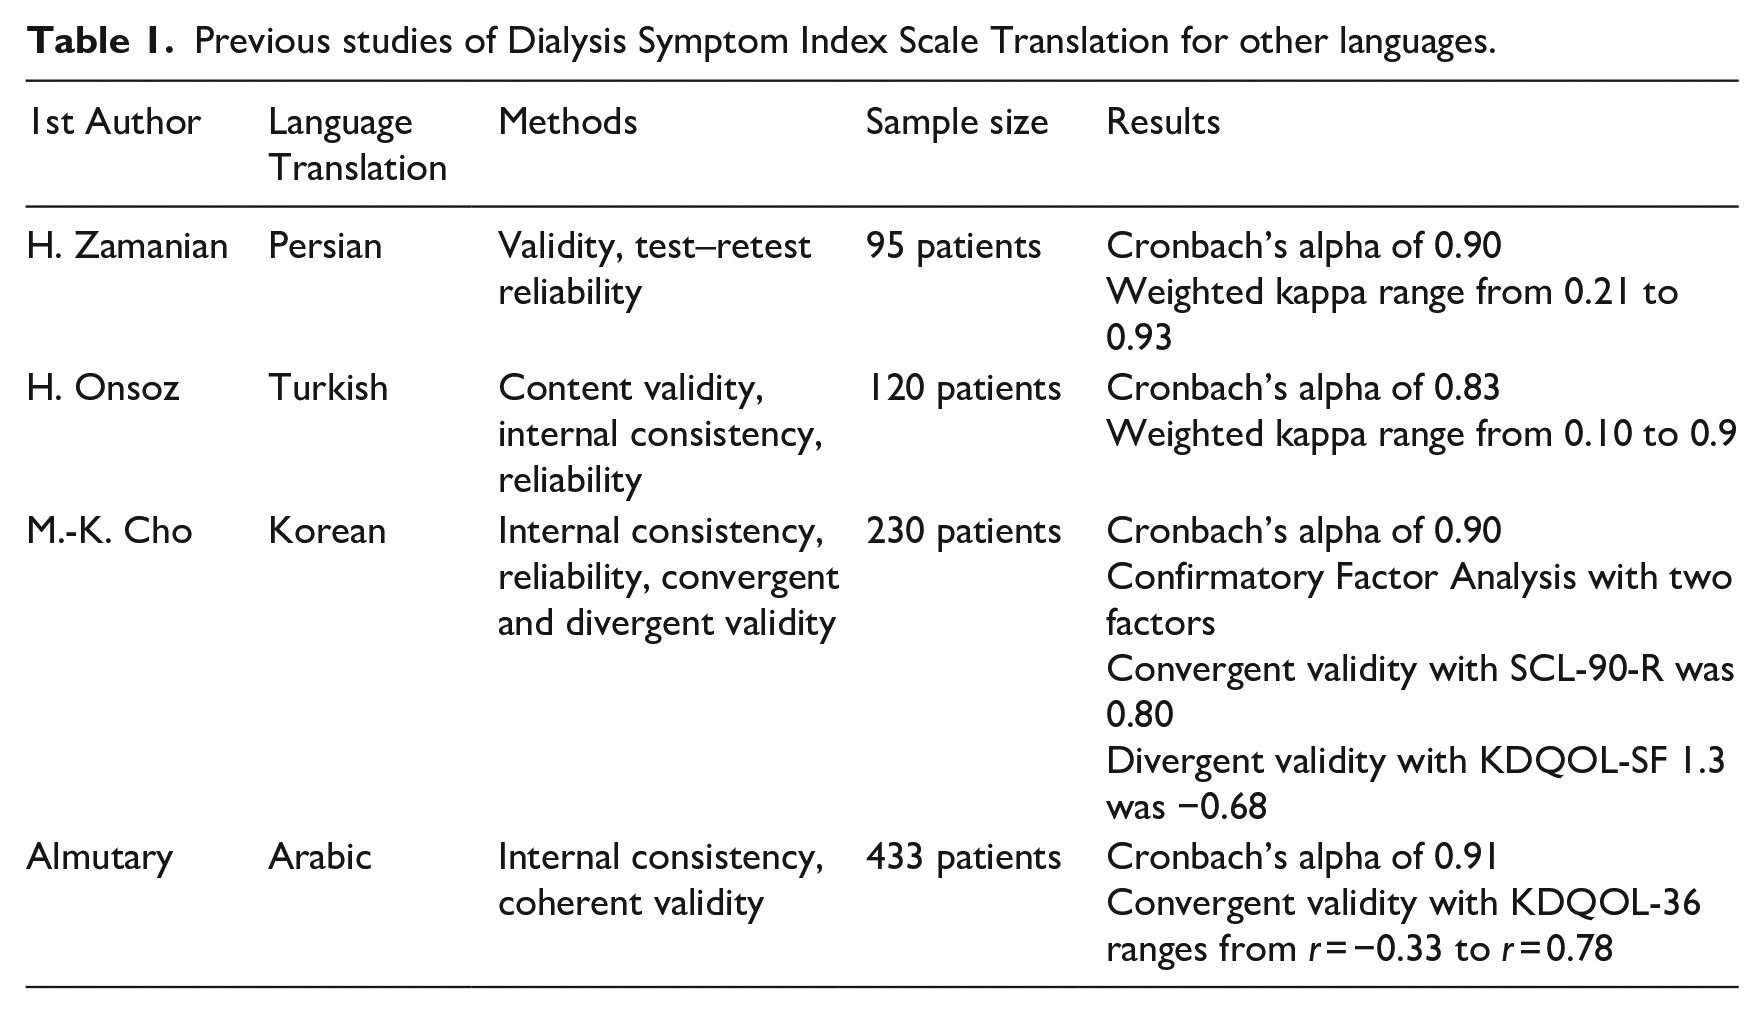
These studies emphasise the importance of an instrument in measuring reported symptoms’ health status and evaluating the psychometric properties, reliability and validity (Portney et al., 2009).
This study aims to translate and assess the validity and reliability of the Portuguese version of the DSI.
Methods
Translation, adaptation and content validity
The forward–backward translation method Beaton et al. (2000) outlined was employed in a five-step process. Two bilingual Portuguese native experts without clinical knowledge translated the original scale from English to Portuguese and assisted an expert group for standard clarification. Then, two native English translators translated the tool back into English to reach a backward translation (Beaton et al., 2000) (Figure 1).
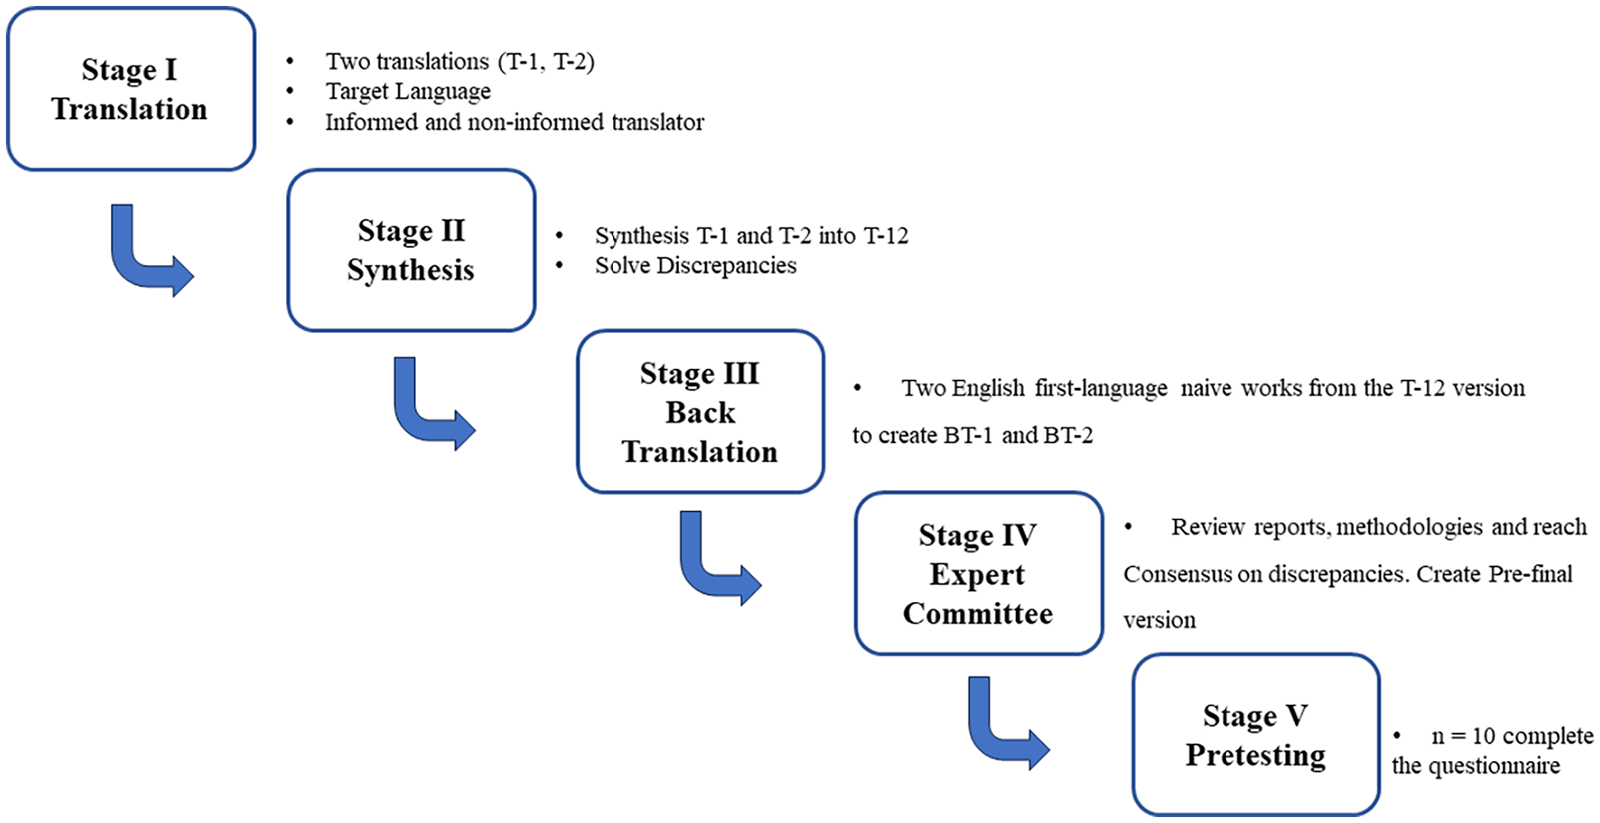
Forward–backward translation procedures.
An expert committee constituted by two nephrologists and three expert nurses with high expertise in HD assessed the content validity, leading to modifications in wording for the questionnaire. Consensus was achieved, prioritising the wording that best facilitated patient interpretation. A final version was administered to ten patients to evaluate its clarity and ease of use, taking approximately 10 minutes to complete all responses. Overall, the instrument was well-received and deemed highly understandable and user-friendly.
Study design, data collection and data analysis
A methodological study with psychometric evaluation was conducted using a convenience sample of ESRD patients. Inclusion criteria were established in patients above 18, under HD for at least 3 months and with no or low cognitive impairment. The 6-item cognitive impairment test (6CIT-P) (Apóstolo et al., 2018) was employed to screen participants’ cognitive ability to respond to the questionnaire. Cognitive impairment can influence the comprehensibility of the instrument items in a population with high cognitive impairment prevalence.
Per the COSMIN guidelines, convergent validity assesses whether the instrument’s score correlates with related instruments, recognising that there is no gold standard for health-related measurement instruments (Mokkink et al., 2010). In this context, the IPOS-r was used to evaluate convergent validity, a short measure of 11 questions covering physical and psychological symptoms, carer anxiety and practical issues (Cicely Saunders Institute 2016, 2016). Participants completed the DSI and IPOS-r scales at two time points, 4 weeks apart. Data were collected during patient visits in two dialysis units. Missing data were handled with multiple imputation (MI) (van Buuren and Groothuis-Oudshoorn, 2011).
The study adhered to the COSMIN recommendations for primary studies of the measurement properties of PROMs. Measurement properties were meticulously assessed using a methodological framework (Gagnier et al., 2021). The scale reliability was calculated using a two-way mixed-effects model (Shultz et al., 2020). Structural validity is the degree to which a questionnaire’s scores adequately reflect the dimensionality of the construct to be measured (Mokkink et al., 2010). This study conducted an Exploratory Factor Analysis (EFA) to extract the factors. The factorable of the data was calculated using Kaiser–Meyer–Olkin test for sampling adequacy and Bartlett’s test for sphericity (Shultz et al., 2020). The number of factors to extract was calculated as a minimum eigenvalue of 1 and determined by parallel analysis. The cut-off for factors loading was established as ⩾0.40. Oblique Promax rotation procedures were used as the factor rotation method because DSI scale factors were assumed to be correlated. After exploring the number of dimensions of the DSI scale, Exploratory Graph Analysis (EGA) was performed to assess the dimensions clustering using the walk trap algorithm weighted networks (Pons and Latapy, 2005). In EGA, each node represents a variable, and the edge represents the correlation between two nodes.
In healthcare, an outcome measure must be able to detect changes over time regarding the follow-up of the patients. This capacity of a tool shows the capacity to measure changes if they happen. This property is defined as responsiveness, which refers to the ability of a questionnaire to detect clinically significant changes over time (Terwee et al., 2007).
The literature suggests two significant aspects of responsiveness: internal, which characterises the ability of a measure to change over a particular prespecified time frame, and external, which reflects the extent to which changes in a measure over a specified time frame related to corresponding changes in a reference measure of health status (Husted et al., 2000).
The responsiveness of the DSI scale was determined using the effect size (ES) and standardised response mean (SRM). The ES was calculated by dividing the mean change score between two time points, in this case, the time at 4 weeks (Angst et al., 2008). The SRM was calculated by dividing the mean change in the score between two times, 4 weeks apart (Angst et al., 2008).
The minimal clinically important difference (MCID) is the smallest change in an outcome score measure perceived as significant for patients (Jaeschke et al., 1989).
The MCID can be calculated using multiple methods, and this study used two different approaches by calculating the difference between the patient’s score change (Wright et al., 2012) and the ESi (Husted et al., 2000).
The first adopted method allows the MCID to be determined using the difference mean score of patients who improved minus the mean score of those who did not (Wright et al., 2012). The difference between the patients can represent those who improve and those who do not.
The ESi is the difference between the measure’s mean baseline and follow-up scores, divided by the standard deviation of baseline scores obtained by ESi = DxSDX.
It was also calculated as the smallest detectable change (SDC), which can be classified as the smallest intra-personal change in score representing a difference above measurement error (Davidson and Keating, 2014). For the SDC calculation, it was first determined that the standard error of measurement (SEM) was by dividing the standard deviation of the mean difference between both measurements (SDchange) by the square root of two (Terwee et al., 2007).
The SDC was calculated as 1.96 × square root of 2 × SEM (herein, SEM = SDchange/square root of 2) (Terwee et al., 2007).
The data were collected in two dialysis centres at two different moments 4 weeks apart. It was analysed using IBM SPSS (IBM Corp. Armonk, NY, USA), Rstudio software (Posit, PBC founded by JJ Allaire Massachusetts, US) and the ‘psych’ and ‘mice’ packages.
Results
Description of participants of the validation study
A sample of 156 patients mean (SD) age of 70.33 (±12.8) years old, and 101 were male (64.7%). The dialysis vintage median is 37 months (Table 2).
Sample description (n = 156).
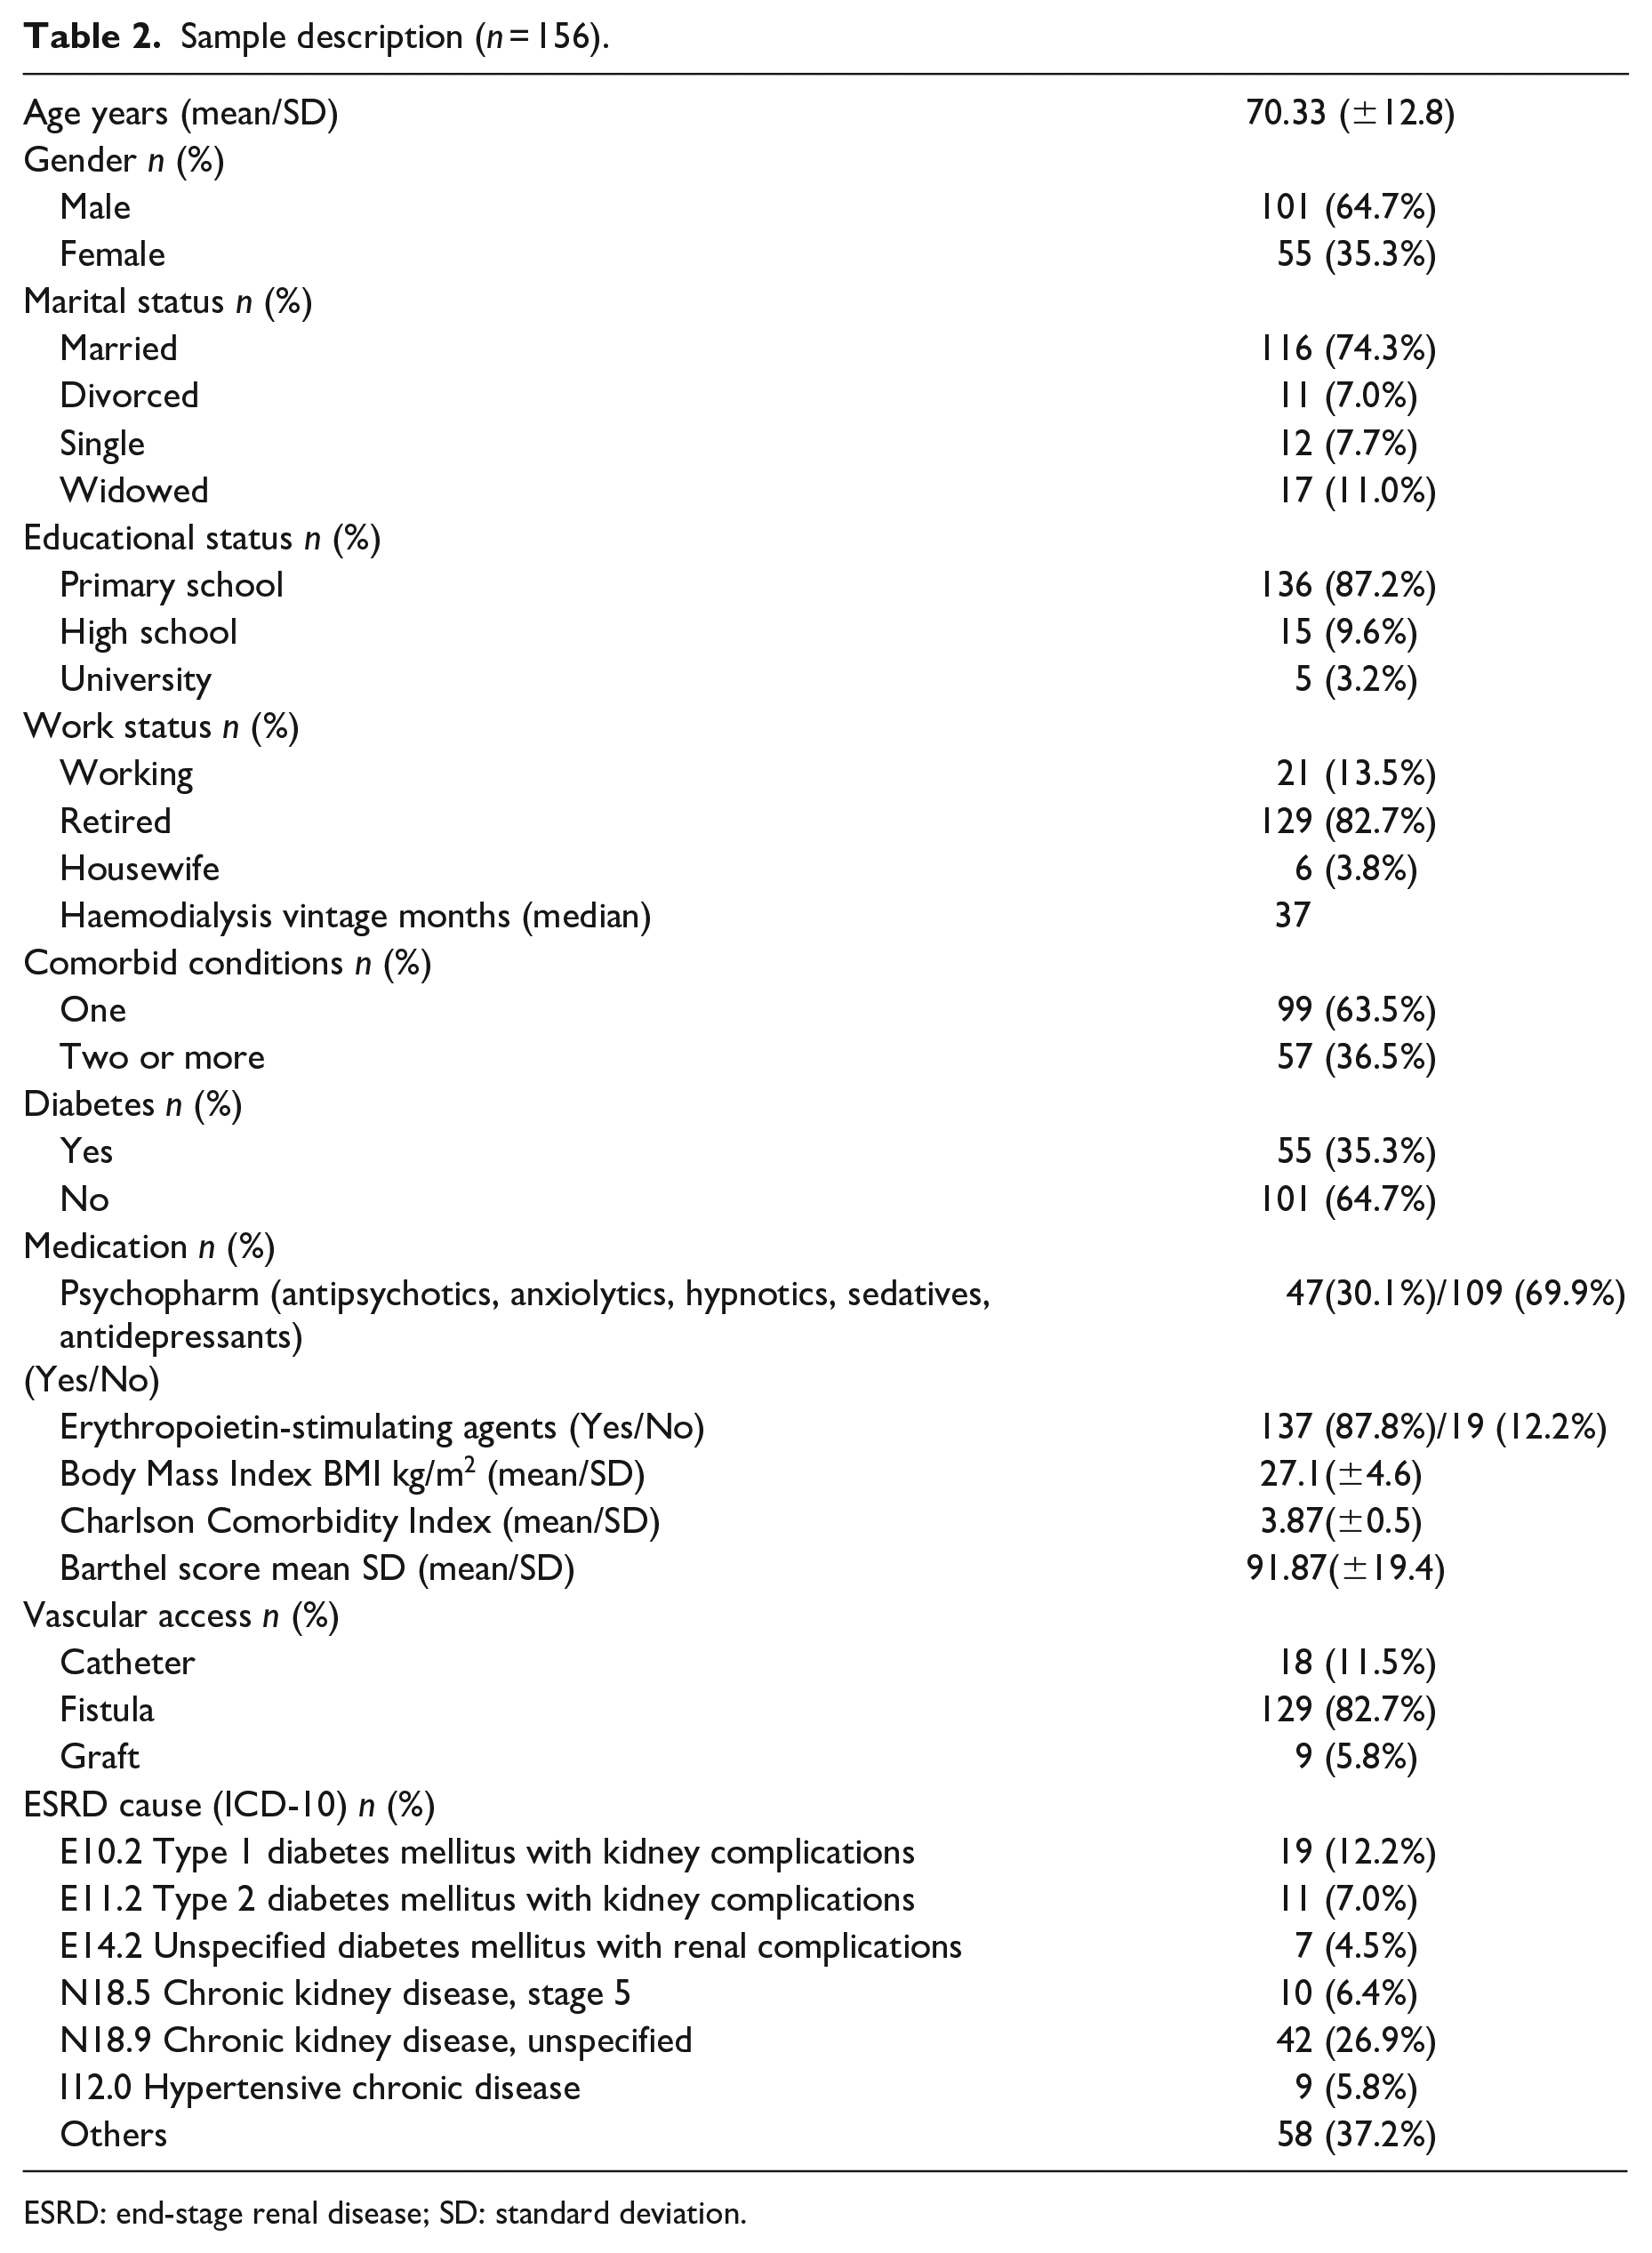
ESRD: end-stage renal disease; SD: standard deviation.
Symptoms prevalence and severity
The patients answered the 30 questions of the DSI on four-point Likert scales (Figure 2).
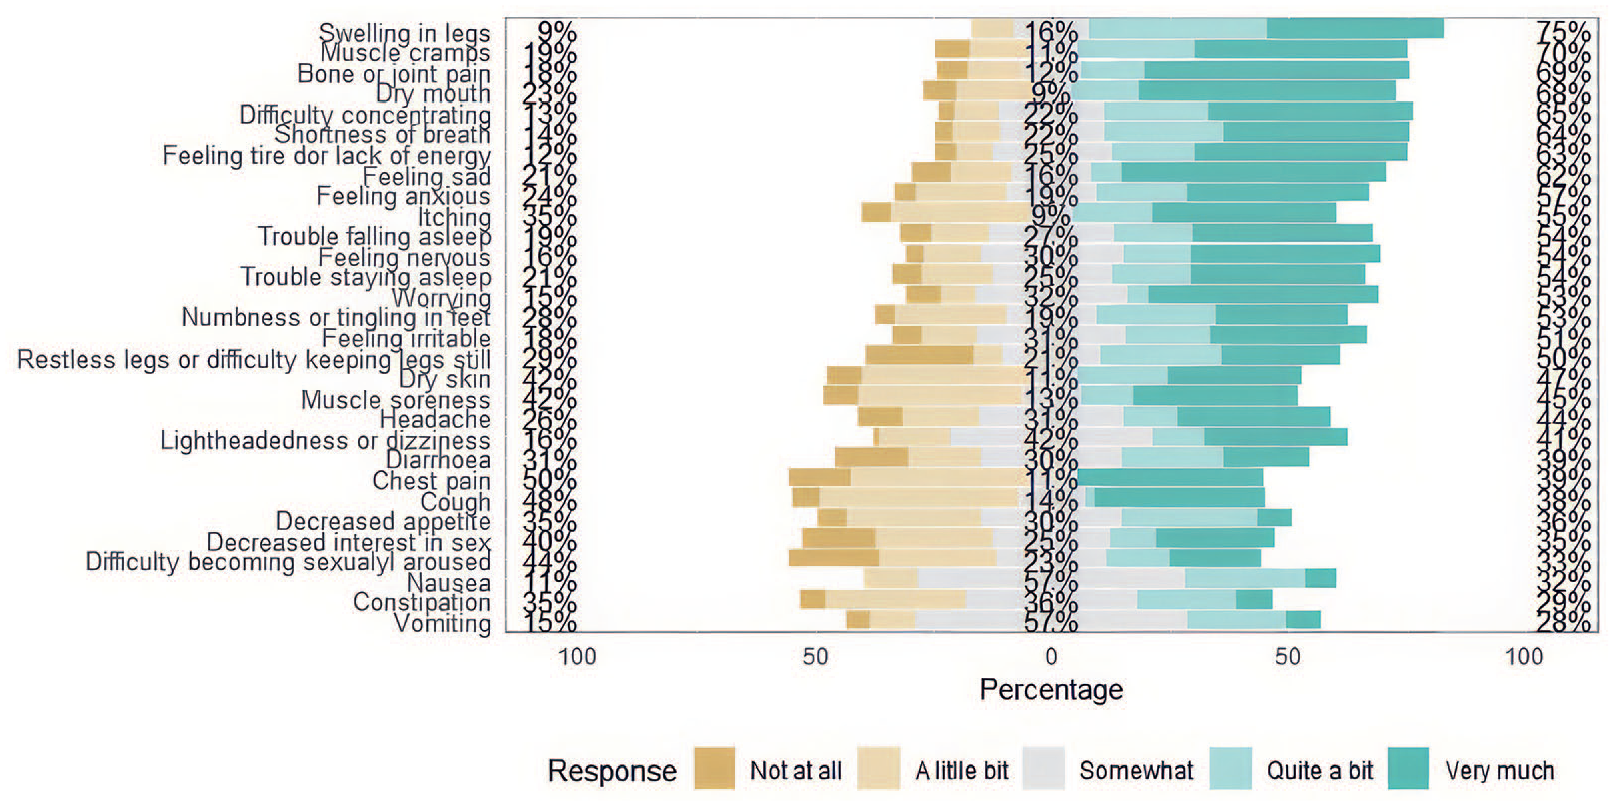
Distribution of the answer options of the Dialysis Symptom Index in the initial evaluation of the participants at the prospective validation study (n = 156).
The DSI results showed that all patients report some symptoms related to ESRD (Table 3). The top five most reported symptoms were, nausea (n = 86, 55%), muscle cramps (n = 92, 59%), feeling tired or lack of energy (n = 92, 59%), bone or joint pain (n = 88, 56.4%) and trouble staying asleep (n = 95, 60%). The most severe symptom reported was muscle cramps (score of 2.31 ± 2.16), numbness or tingling in feet (score of 2.66 ± 1.8), feeling tired or lack of energy (score of 2.28 ± 2.13), bone or joint pain (score of 2.26 ± 2.22), difficulty in becoming sexually aroused (score of 2.88 ± 1.39).
Dialysis Symptoms Index distribution and severity.
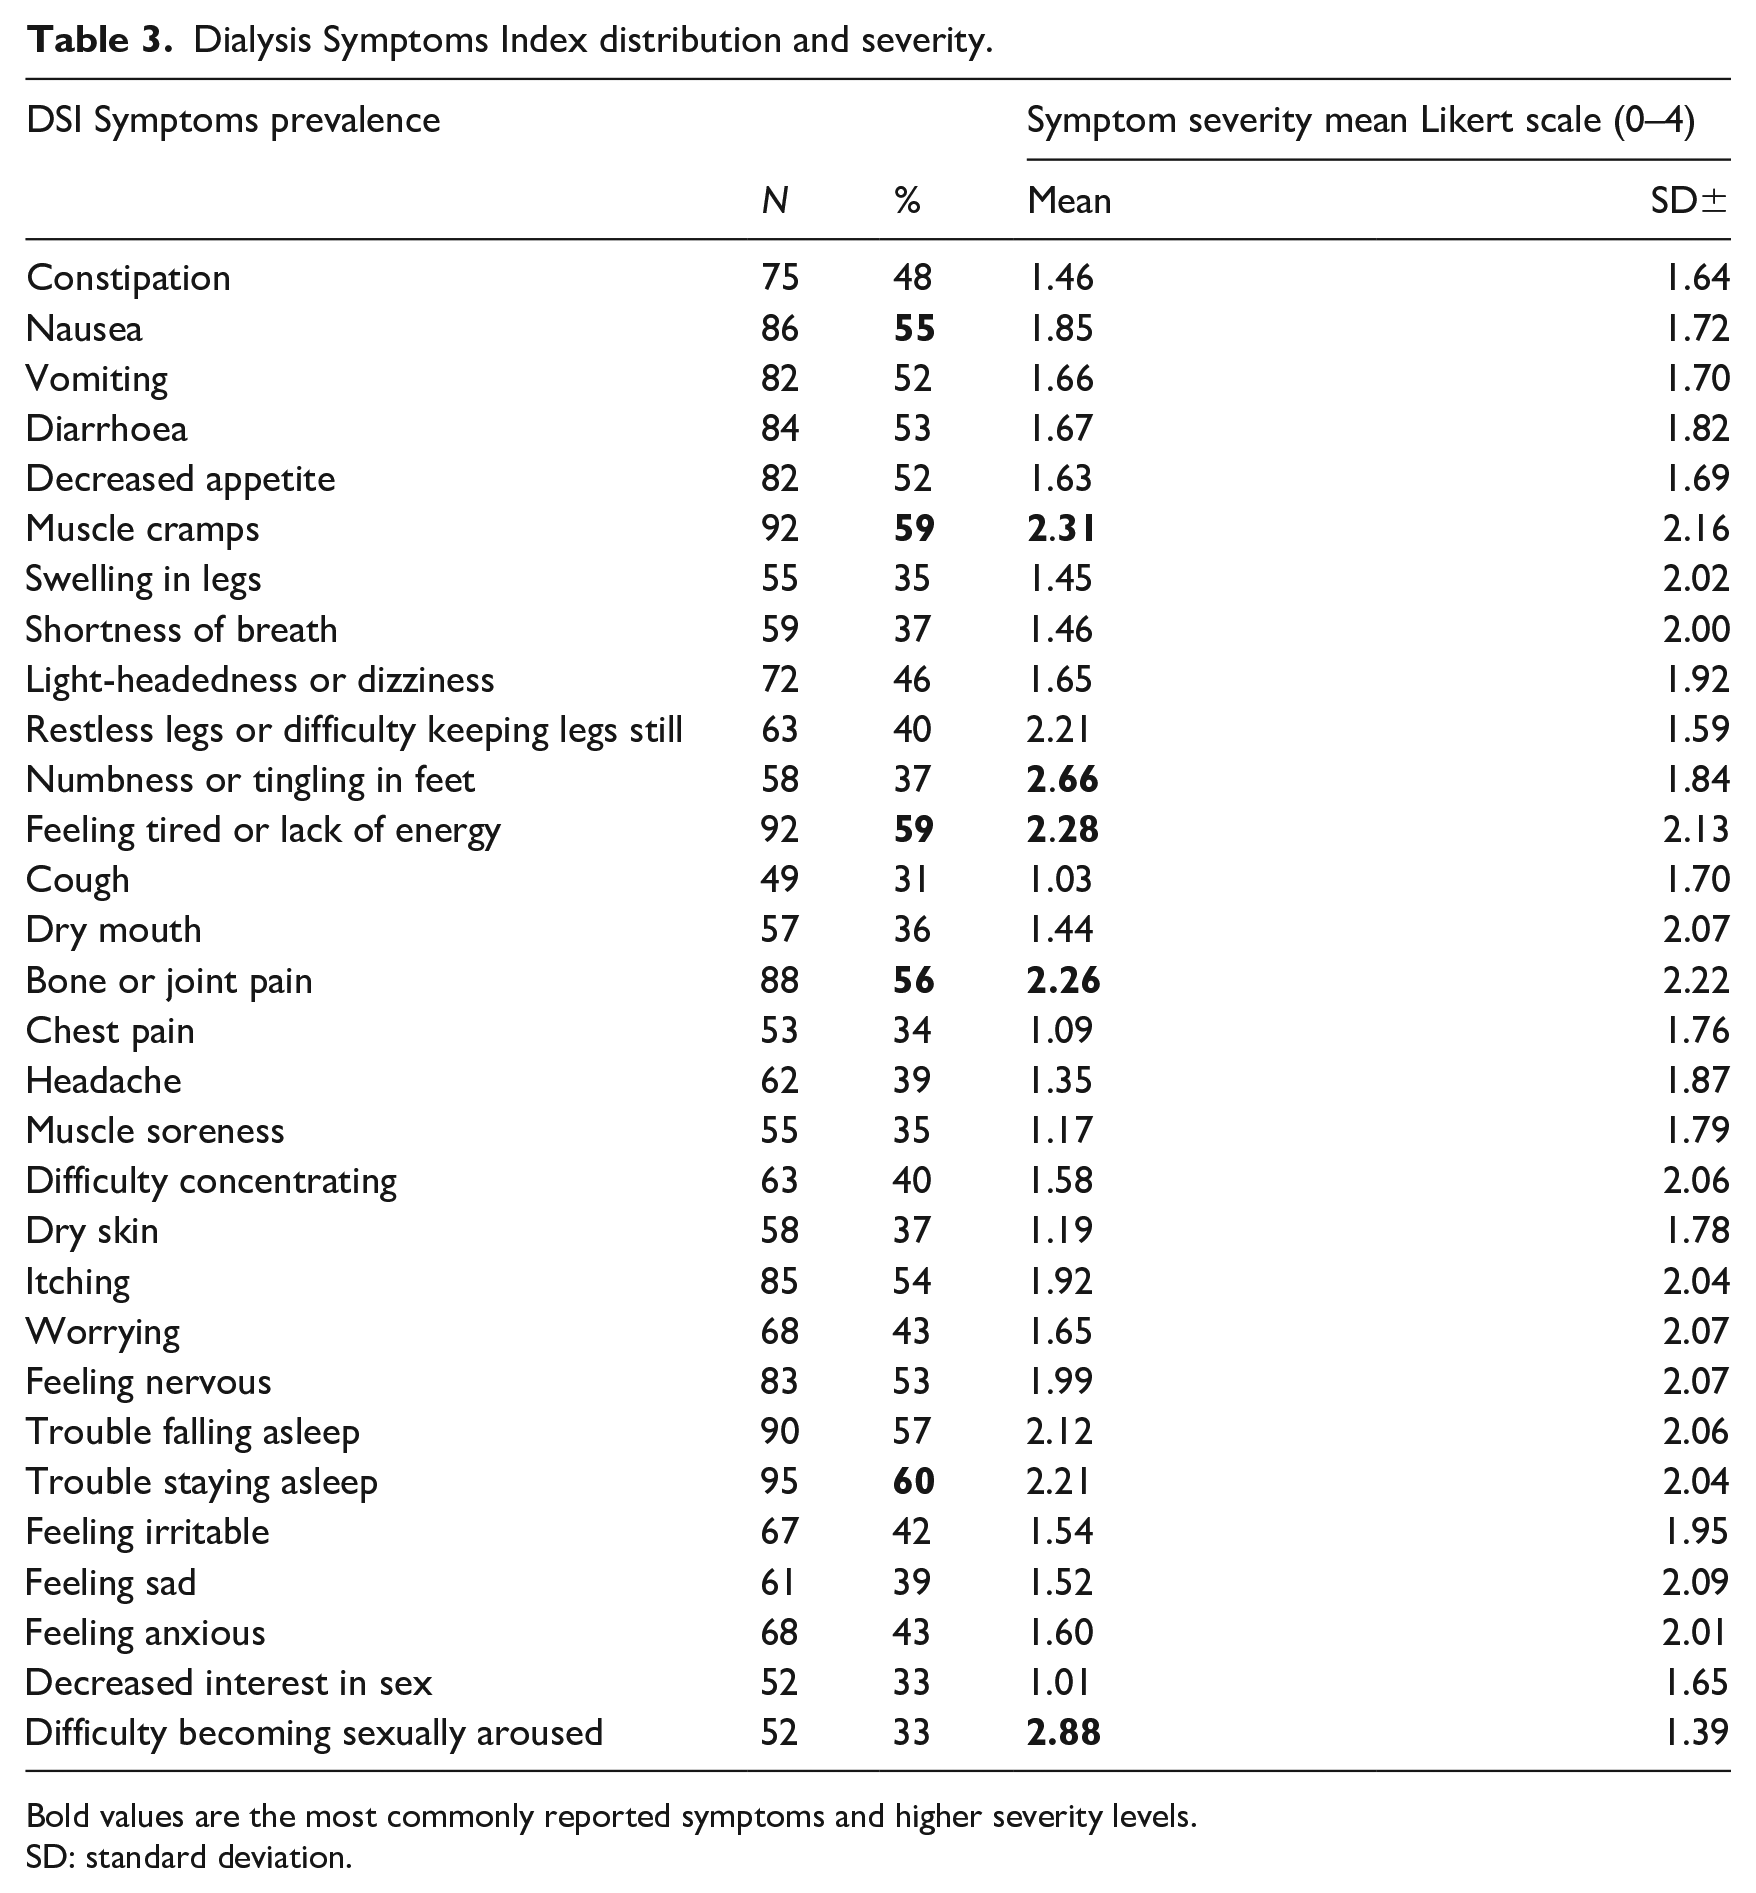
Bold values are the most commonly reported symptoms and higher severity levels.
SD: standard deviation.
Reliability
Internal consistency reliability and test–retest reliability
The internal consistency reliability of the Portuguese version of the DSI was assessed by Cronbach’s alpha with 0.87 for the 30-item scale and ranged between 0.69 and 0.97 for each of the 30 items.
The Intraclass Correlation Coefficient (ICC) was 0.868 (95%CI 0.836–0.896). The weighted kappa assessed the test–retest reliability, with values ranging from 0.498 to 0.920 (Table 4).
Internal consistency reliability and test–retest reliability of the Portuguese version of the Dialysis Symptom Index and original scale kappa values.
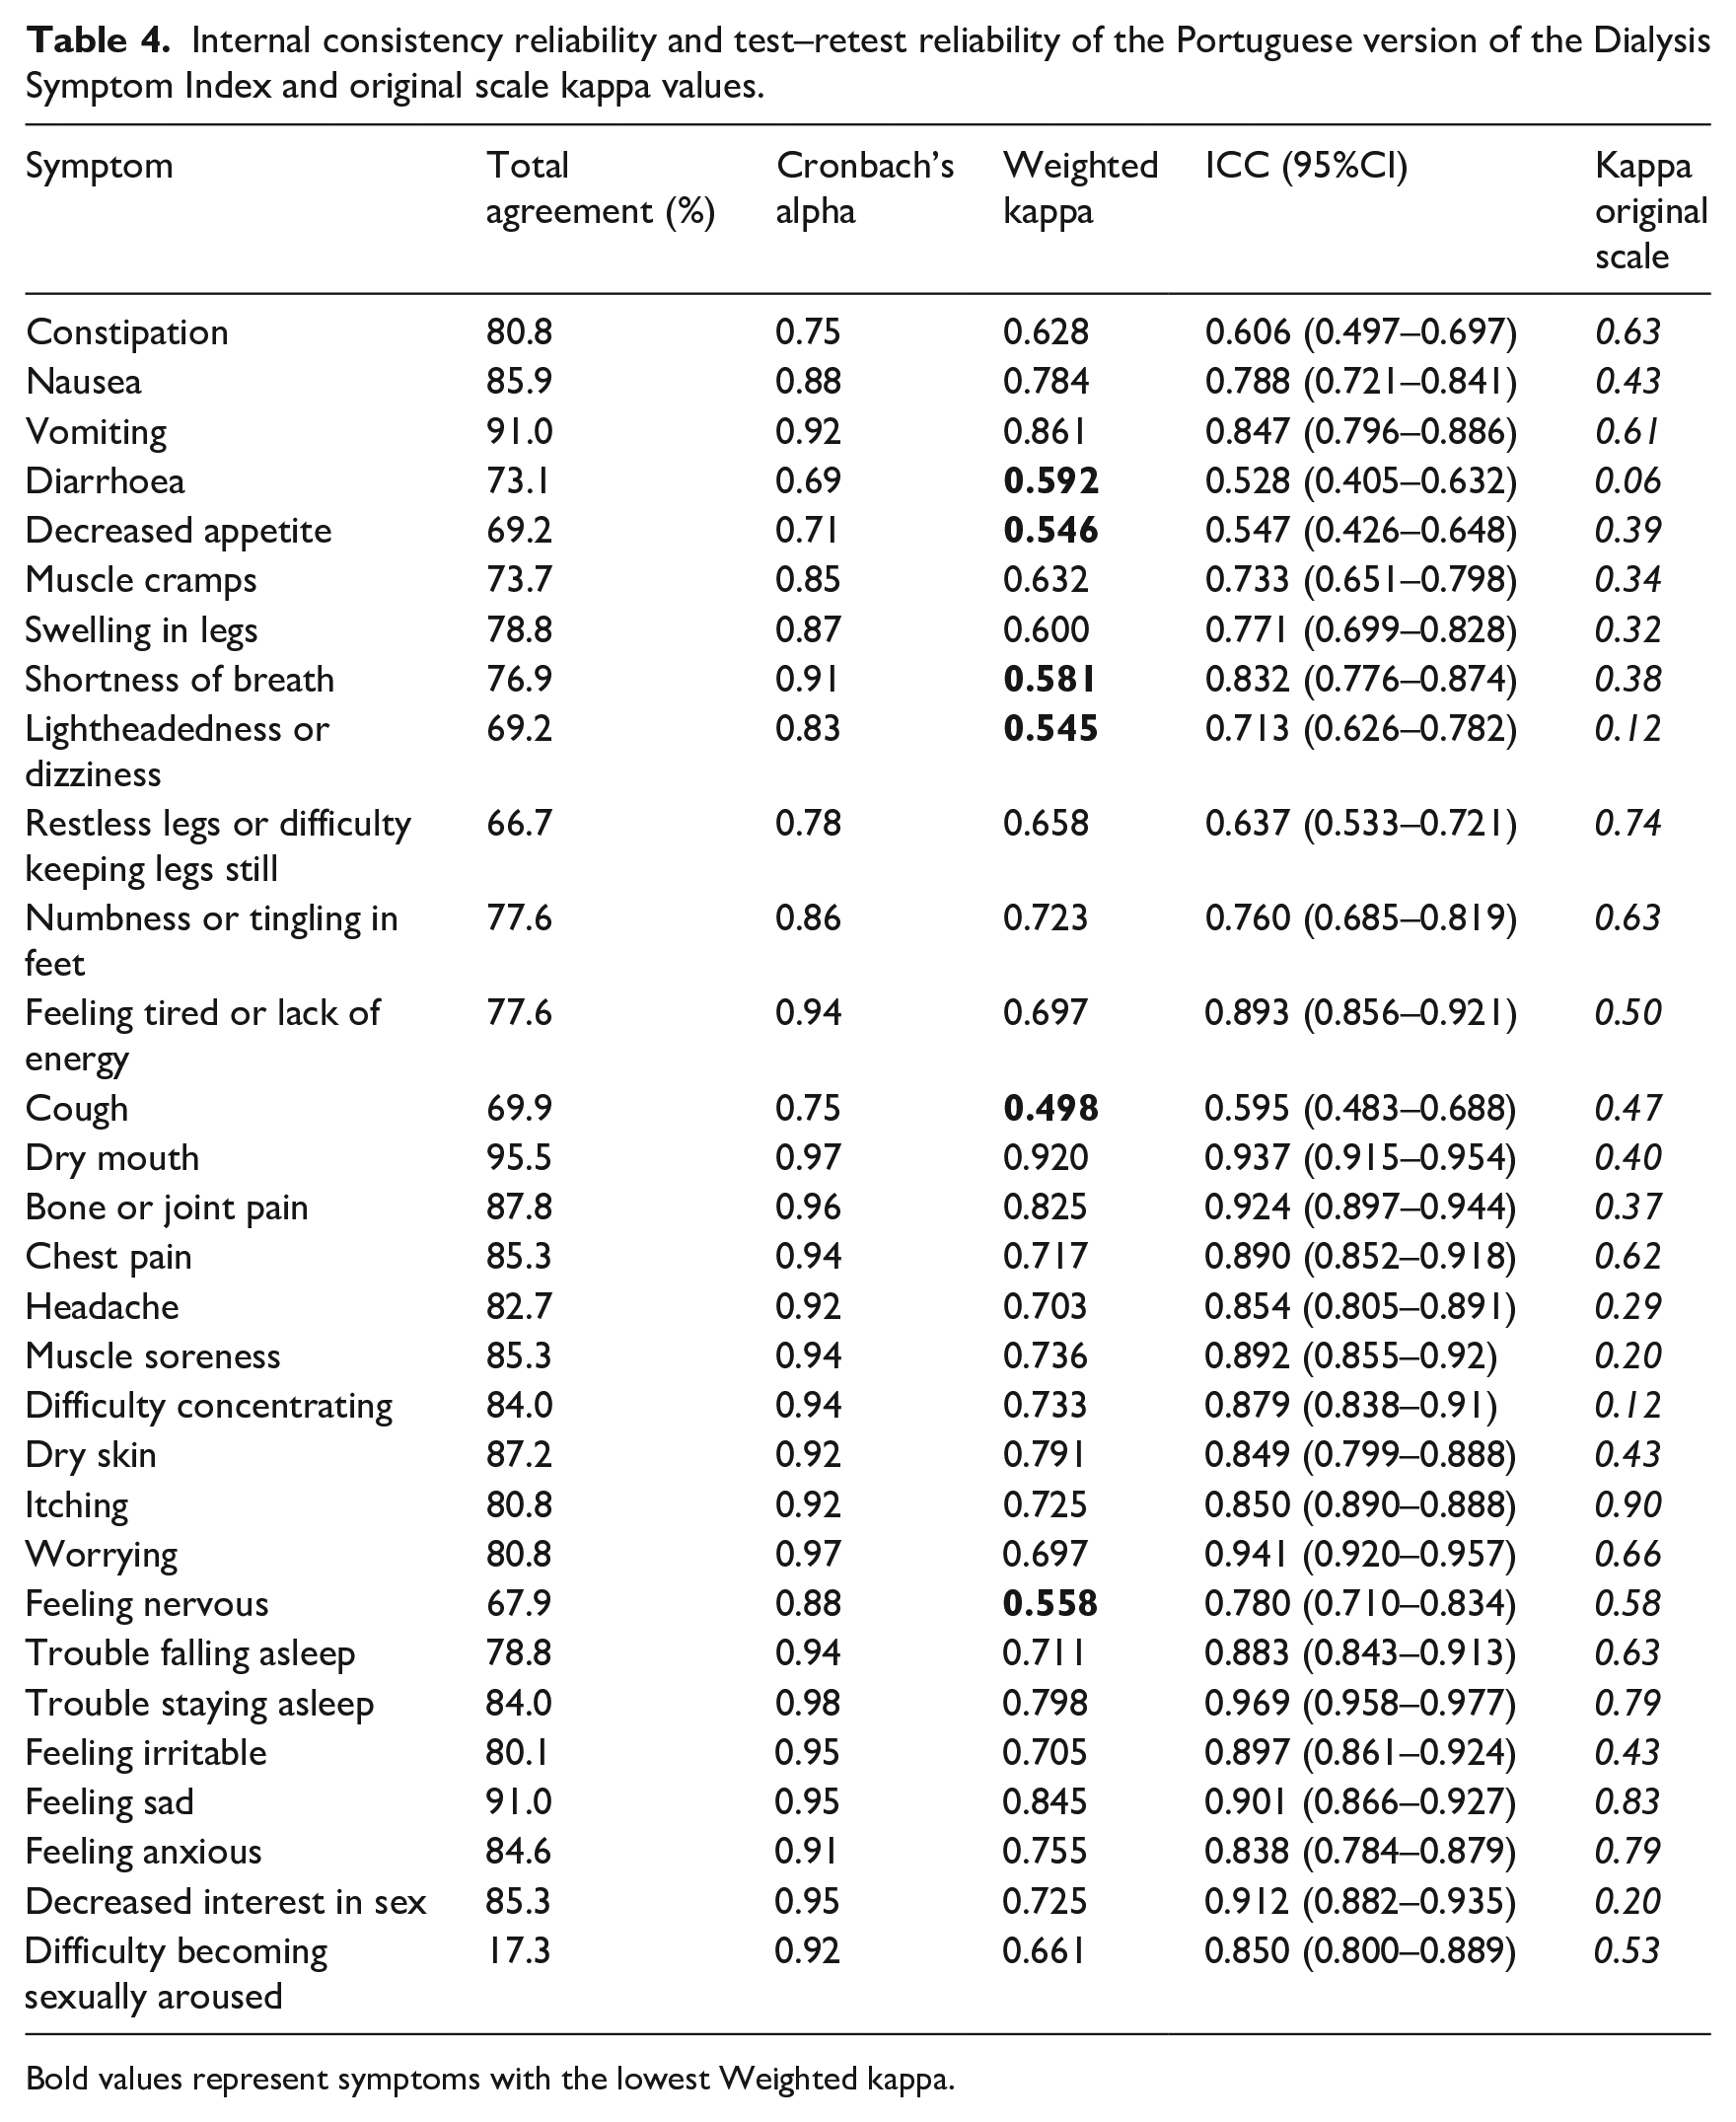
Bold values represent symptoms with the lowest Weighted kappa.
Structural validity
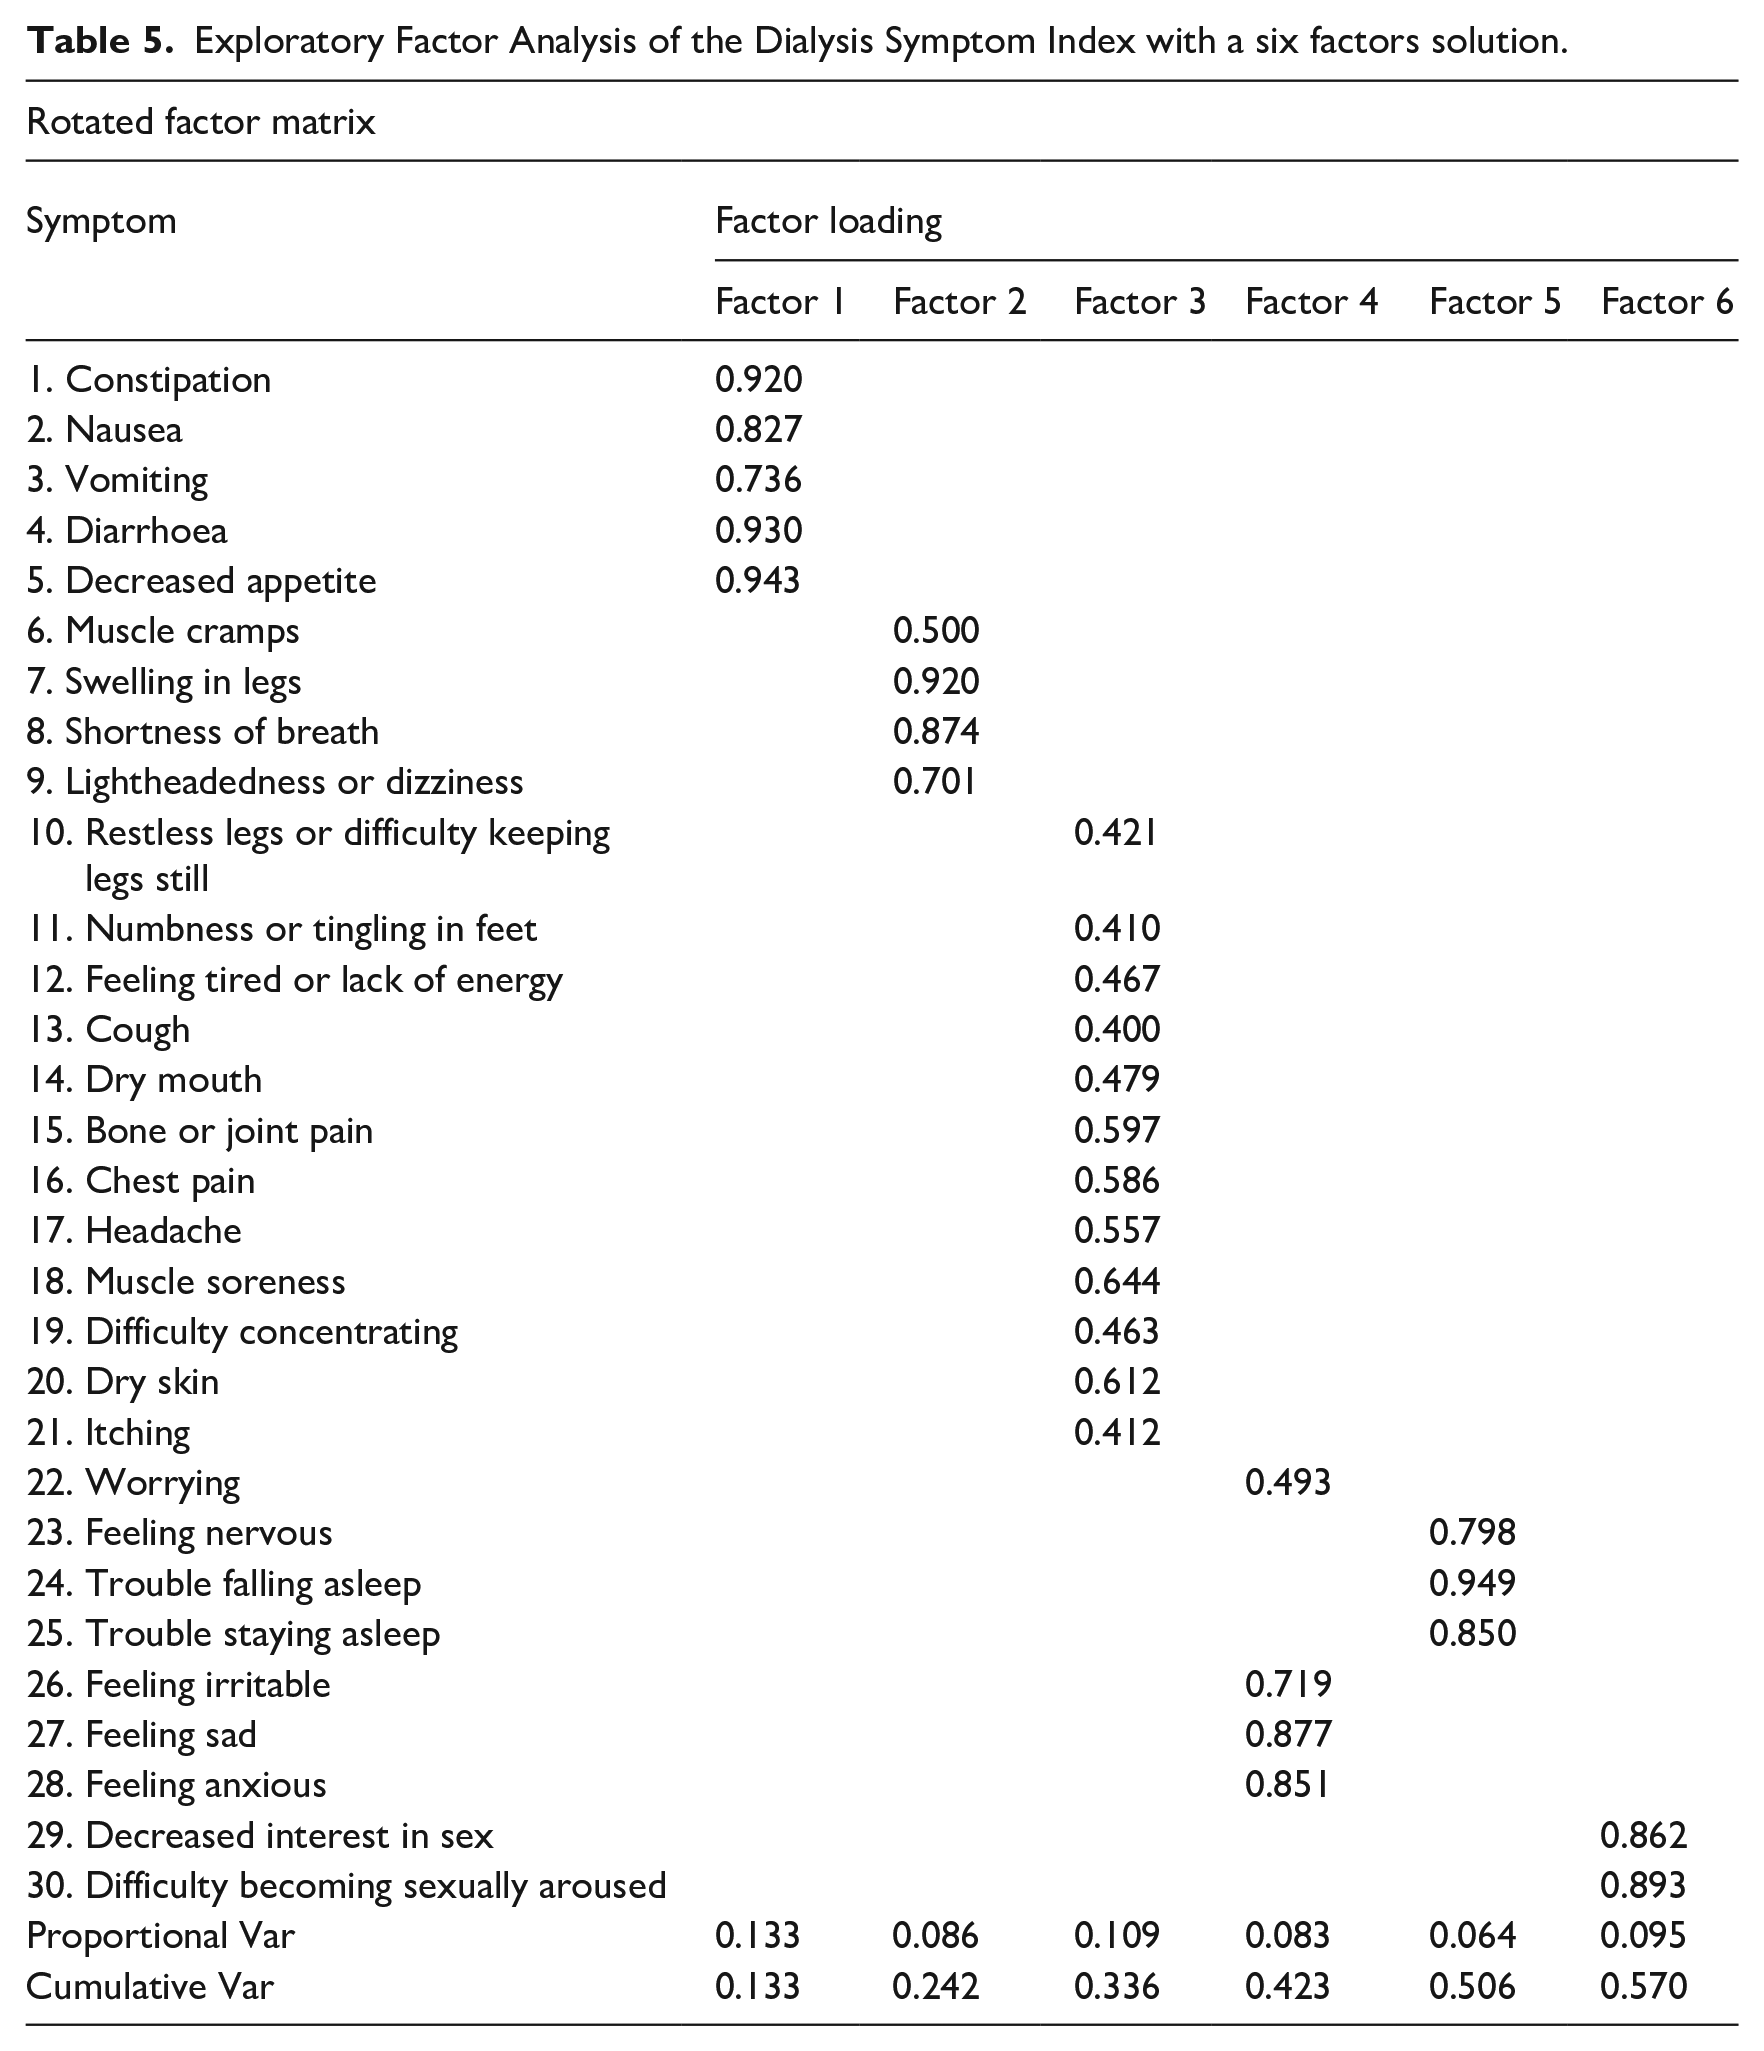
Factor 1 – The symptoms 1–5. This factor related the gastrointestinal symptoms with factor loading ranging from 0.736 to 0.943, accounting for 13.3% of the variance.
Factor 2 – The symptoms 6–9. This factor related the Fluids symptoms with factor loading ranging from 0.500 to 0.701, accounting for 8.6% of the variance.
Factor 3 – The symptoms 10–21. This factor related the musculoskeletal and neurologic symptoms with factor loading ranging from 0.410 to 0.644, accounting for 10.9% of the variance.
Factor 4 – The symptoms 22 and 26–28. This factor related the psychological symptoms with factor loading ranging from 0.493 to 0.877, accounting for 8.3% of the variance.
Factor 5 – The symptoms 23–25. This factor related the sleep symptoms with factor loading ranging from 0.798 to 0.949, accounting for 6.4% of the variance.
Factor 6 – The symptoms 29–30. This factor related the sex symptoms with factor loading ranging from 0.862 to 0.893, accounting for 9.5% of the variance (Table 5).
Exploratory Factor Analysis of the Dialysis Symptom Index with a six factors solution.
EGA is presented in Figure 3.
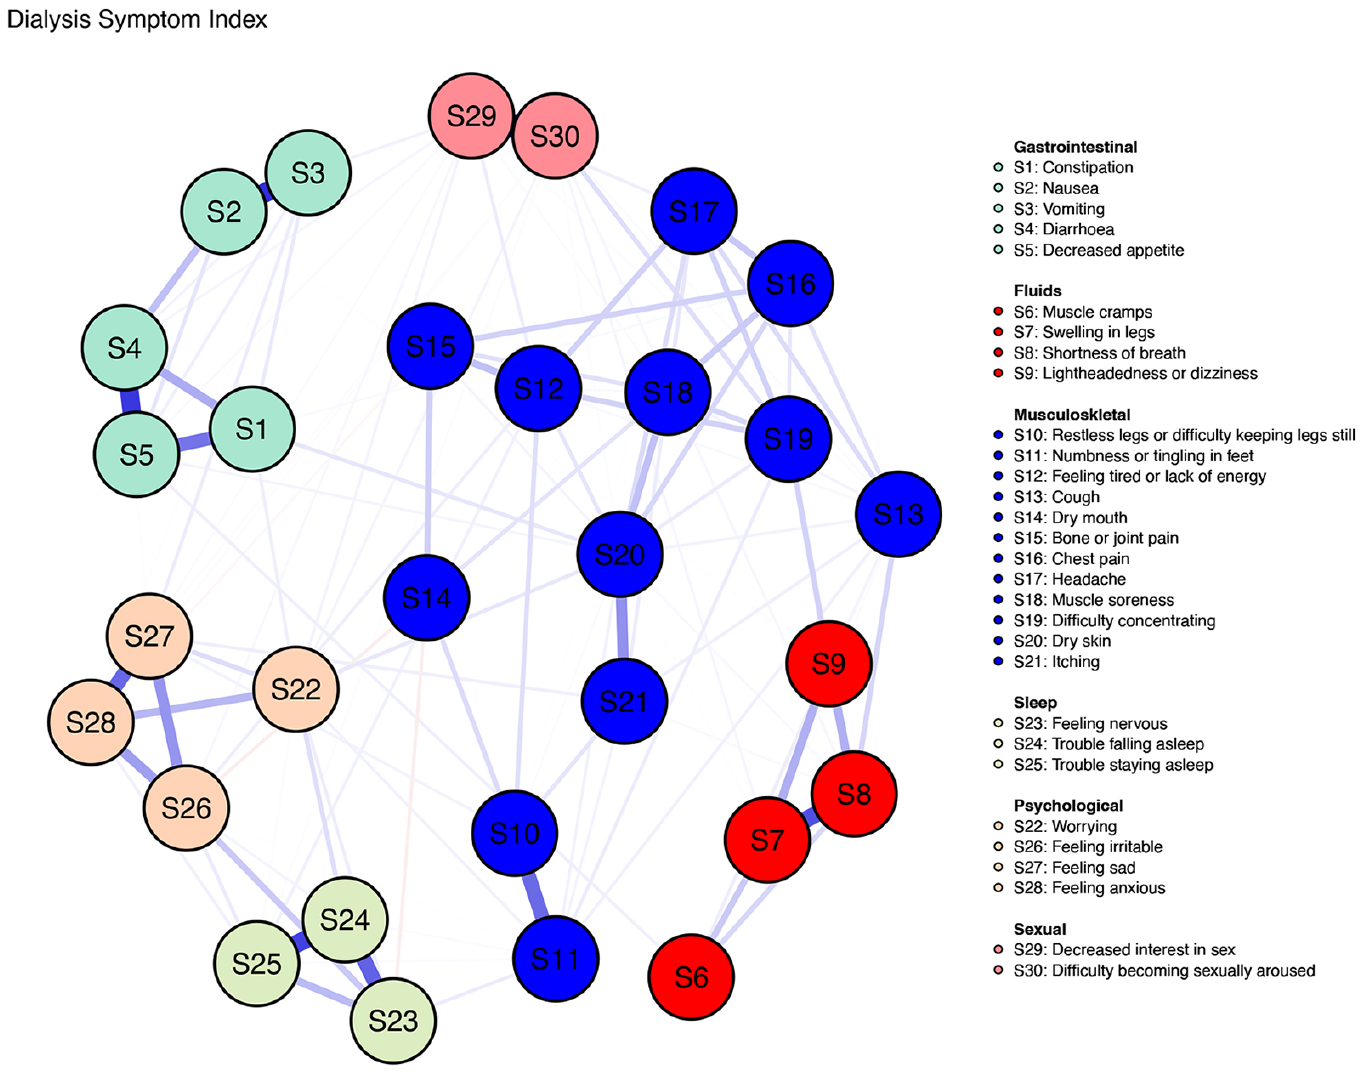
Exploratory graph analysis for Dialysis Symptom Index reported symptoms.
Convergent validity
The convergent validity of the Portuguese version of the DSI scale was verified using the IPOS-r. The results show a high positive correlation coefficient of r = 0.844, which confirms the convergent validity of the Portuguese version of the DSI scale (Table 6).
Convergent validity of the Dialysis Symptom Index correlation with IPOS-renal.
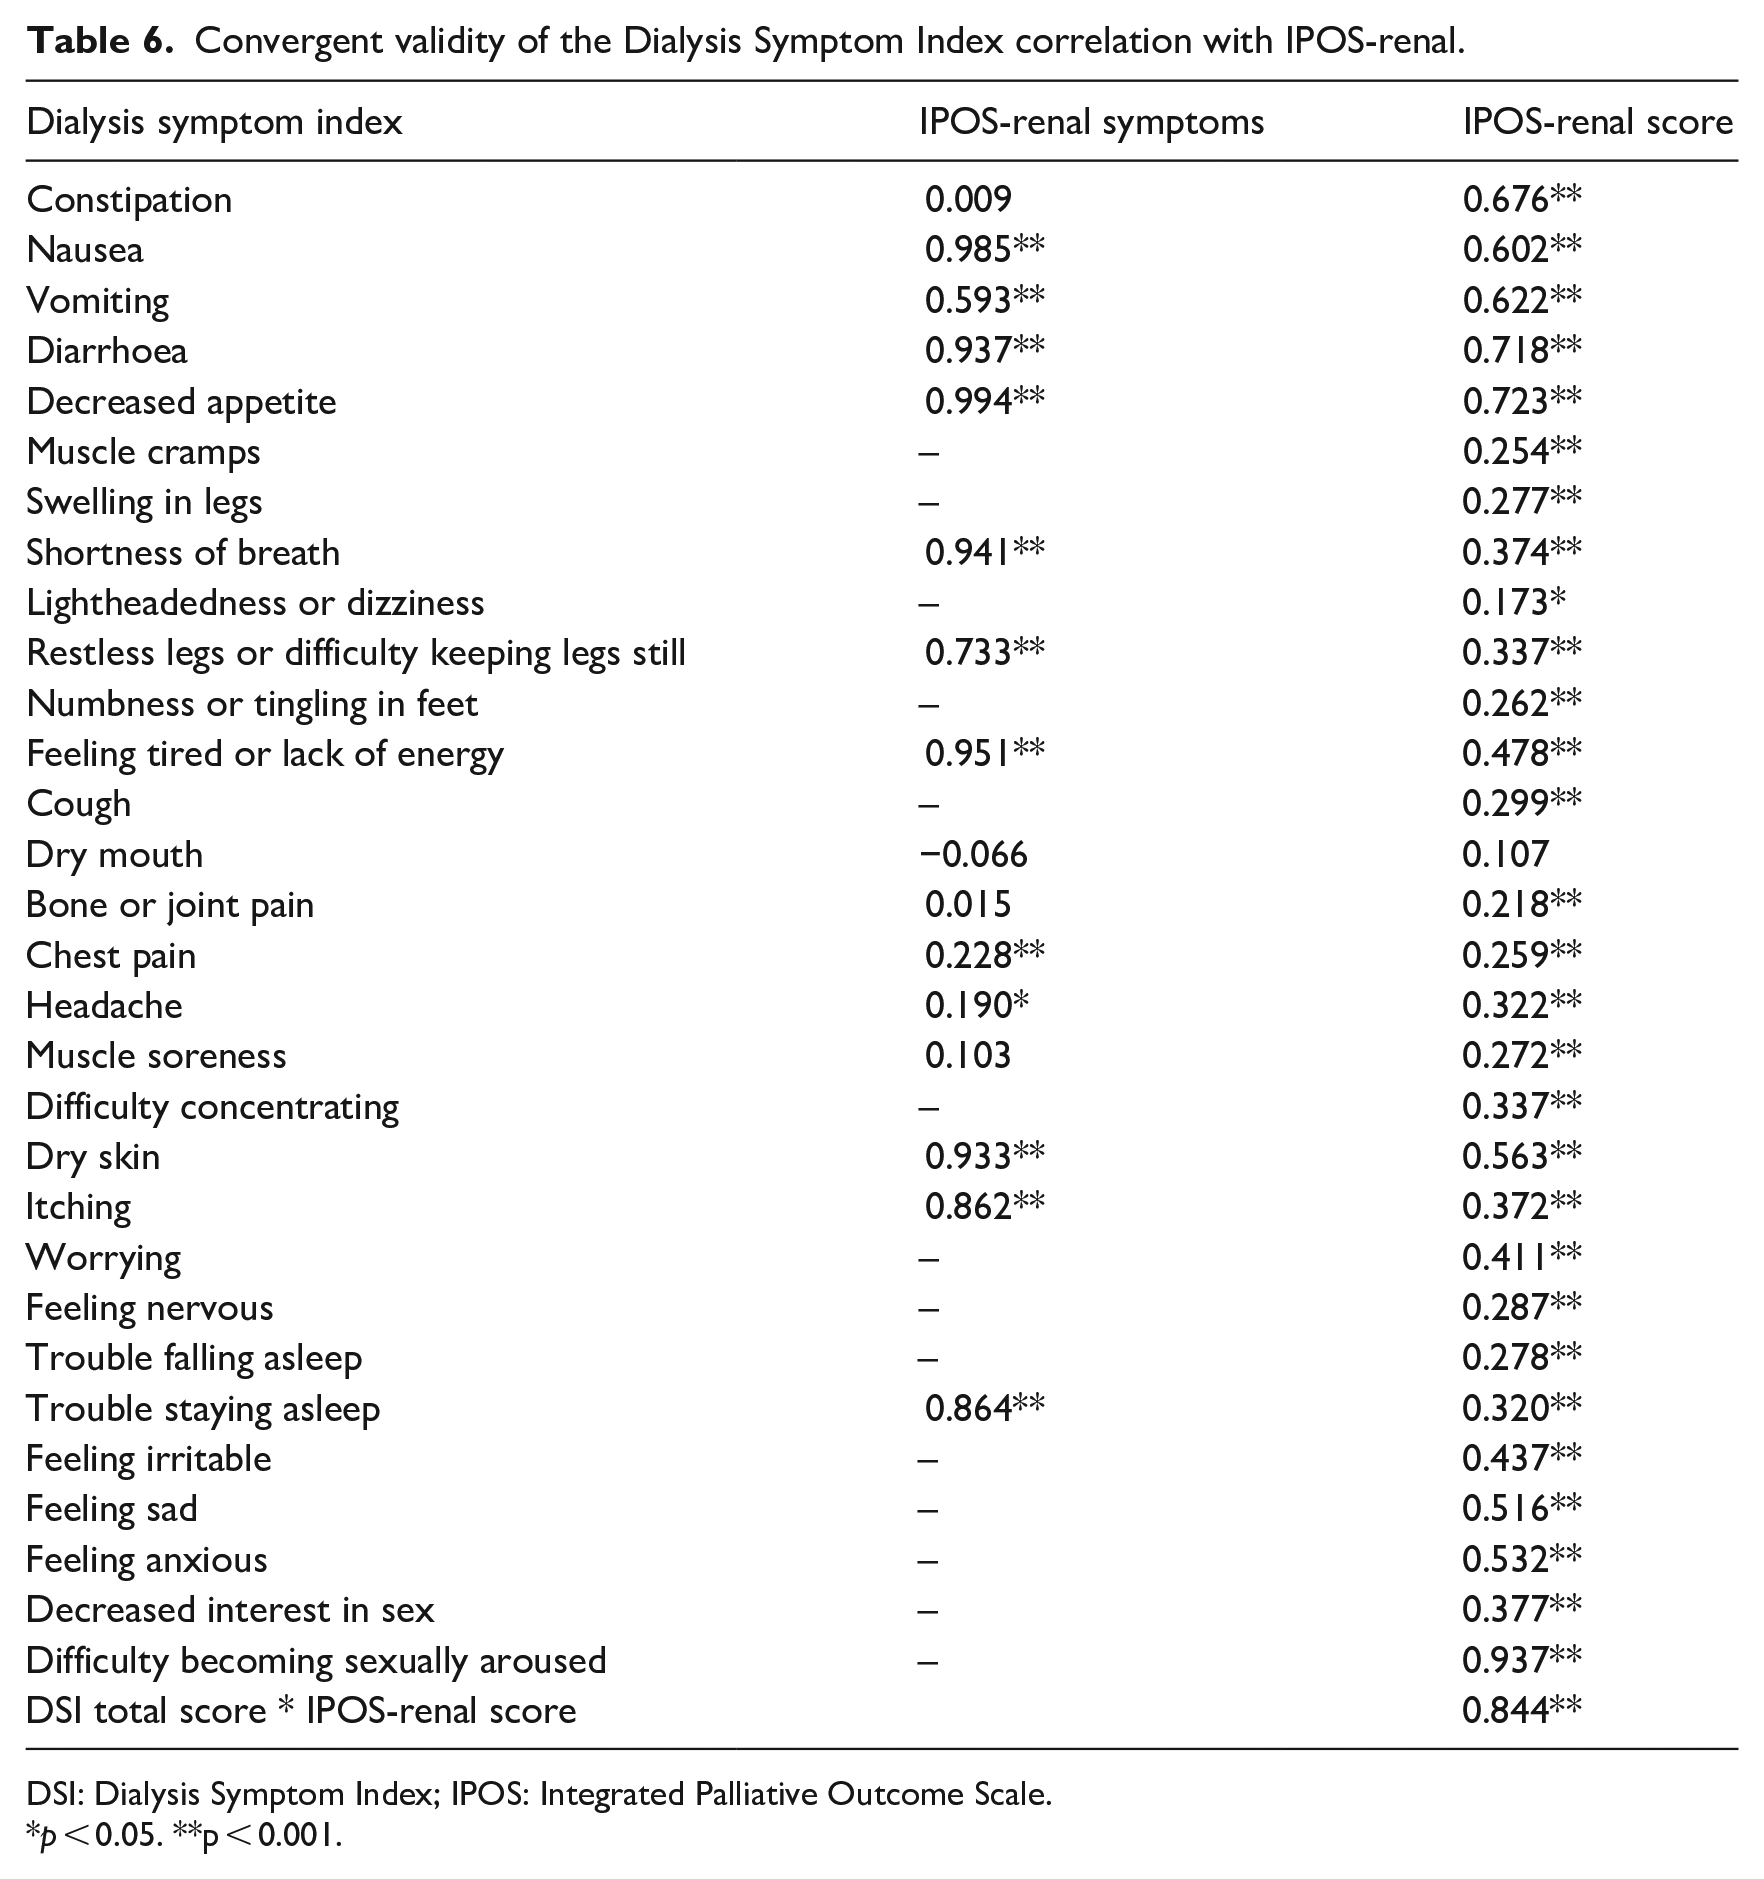
DSI: Dialysis Symptom Index; IPOS: Integrated Palliative Outcome Scale.
p < 0.05. **p < 0.001.
The correlation between DSI symptoms and corresponding items in IPOS-renal values ranged from r = 0.190 to r = 0.985 (Table 6).
Responsiveness
The obtained results for the responsiveness and the MCID are represented in Table 7 and Table 8, respectively. The obtained results for the responsiveness are ES = 0.30 and SRM = 0.54.
Responsiveness of the dialysis symptom scale (n = 156).
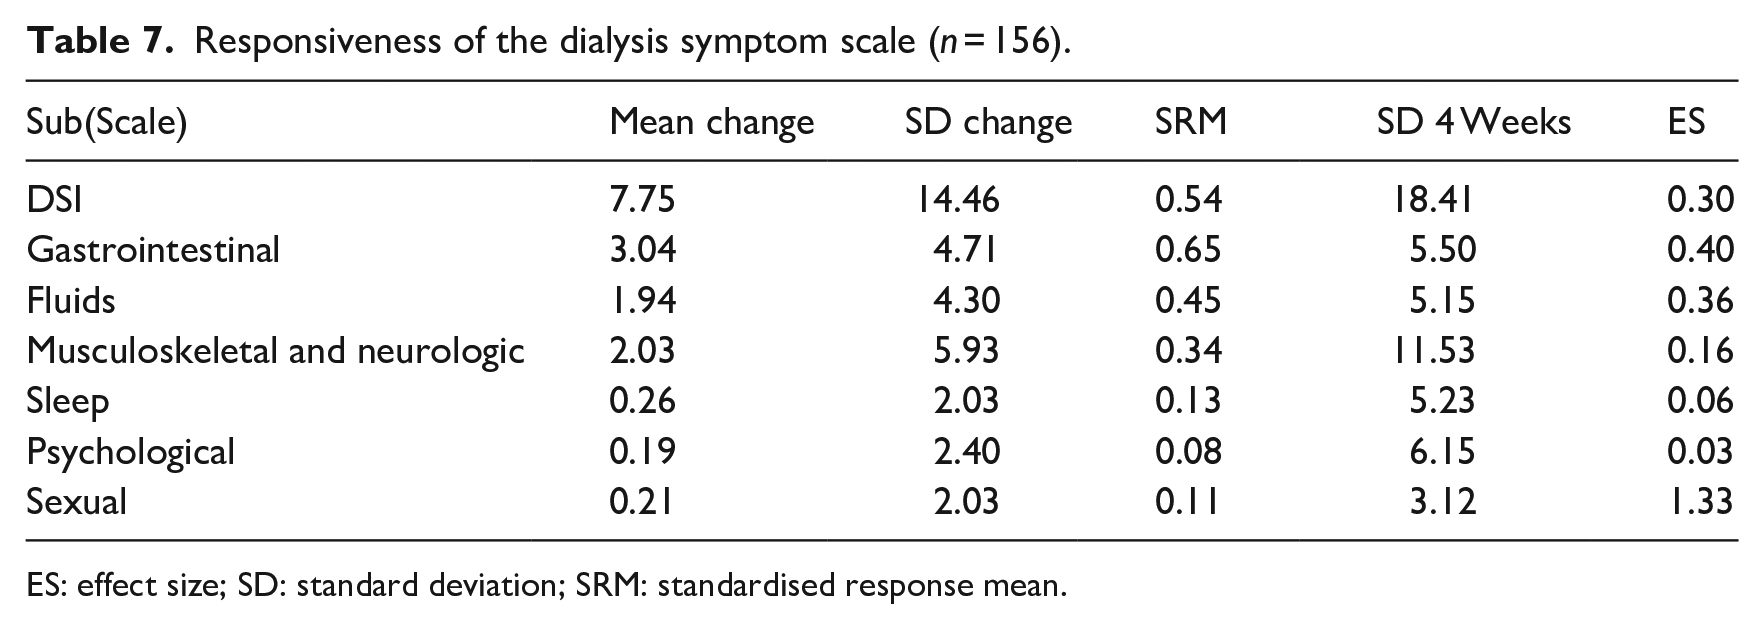
ES: effect size; SD: standard deviation; SRM: standardised response mean.
Minimal clinically important difference and smallest detectable change of the Dialysis Symptom Index scale (n = 156).
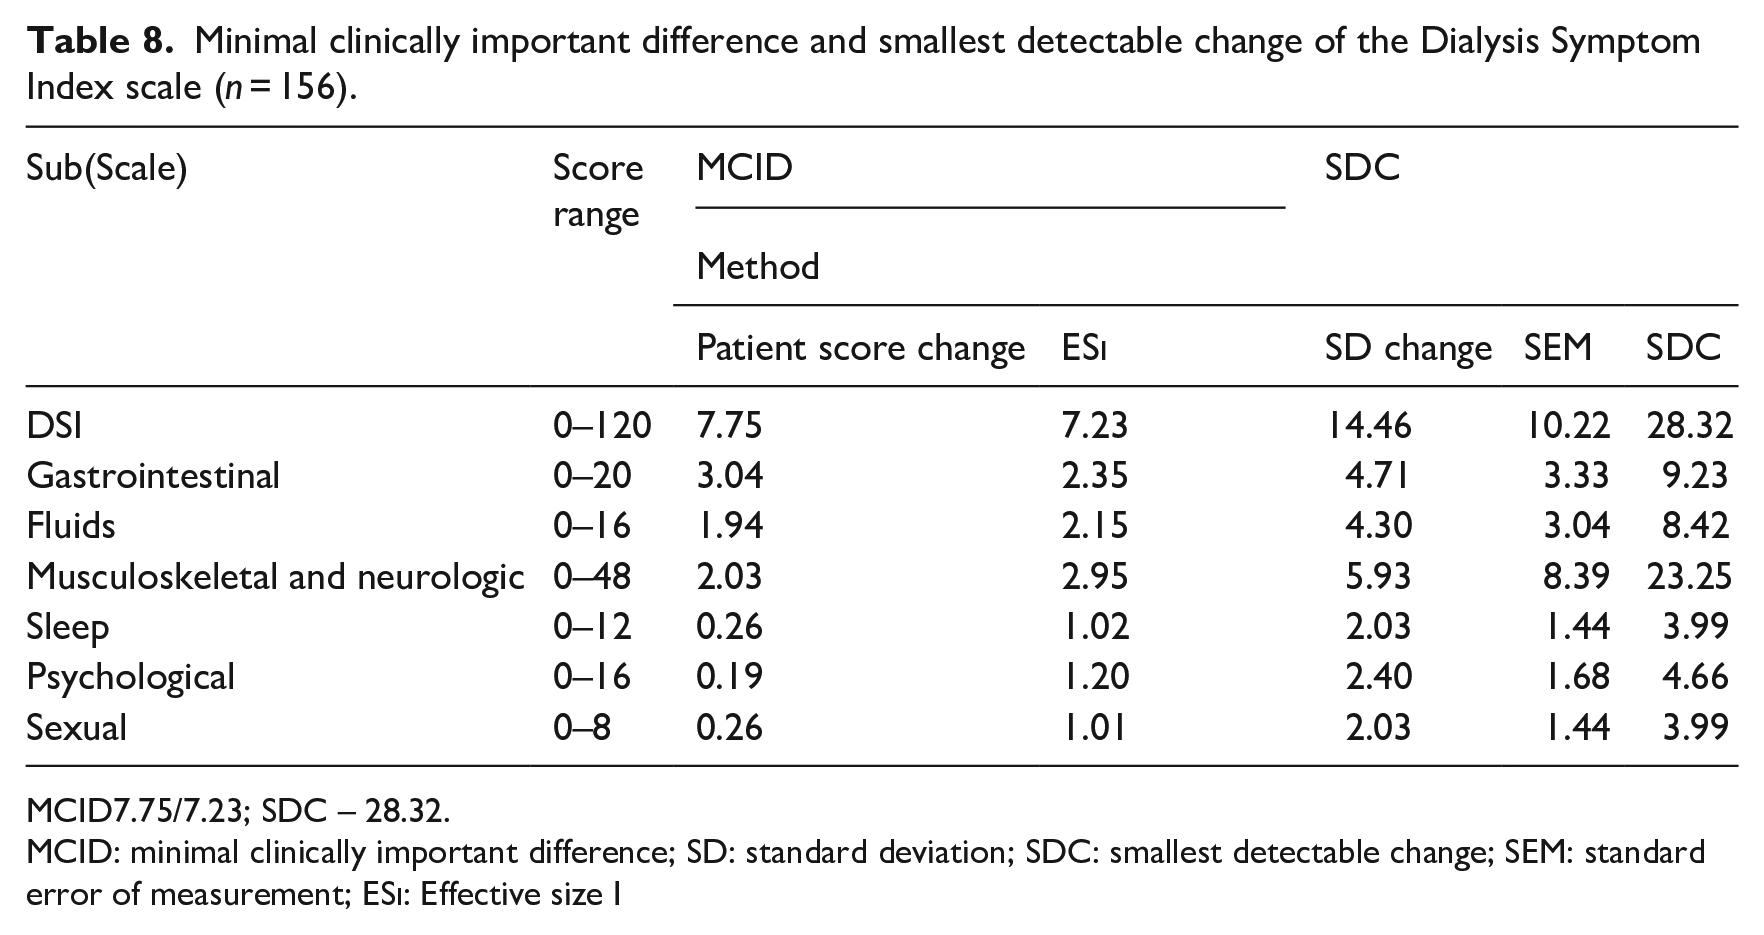
MCID7.75/7.23; SDC – 28.32.
MCID: minimal clinically important difference; SD: standard deviation; SDC: smallest detectable change; SEM: standard error of measurement; ESi: Effective size I
The MCID results are for patient score change = 7.75 and the ESi = 7.23. The SDC results are 28.32.
Floor and ceiling effects were not observed.
Discussion
This study reports the cross-cultural adaptation and validation of the Portuguese version of the DSI scale for assessing symptoms reported by patients undergoing HD.
The sociodemographic and clinical characteristics of the study sample closely mirror those of ESRD patients reported in other studies, affirming the representativeness of our cohort (Cho et al., 2018; Zamanian and Kharameh, 2015).
The original DSI instrument was developed in the United States, making cross-cultural validation a critical step. As per Mokkink et al. (2010) cross-cultural validation is the process of ensuring that the translated or culturally adapted instrument adequately reflects the performance of the items in the original version. This study’s strength lies in its systematic approach, which involves comparing findings, performing cultural adaptations as necessary and creating a valuable instrument for research and clinical care (Brislin, 1986; Mehrotra et al., 2023). Previous studies that translated the DSI into other languages followed similar methodologies for assessing psychometric properties. However, adopting the COSMIN guidelines in this study ensures that the measurement properties of PROMs were rigorously assessed with methodological precision.
The Cronbach’s alpha of 0.87 for the Portuguese version of the DSI was high, indicating good internal consistency reliability (Shultz et al., 2020). Although this figure aligns with similar studies, it does not quite reach the 0.9 threshold (Almutary et al., 2015; Cho et al., 2018; Zamanian and Kharameh, 2015).
The test–retest results show that the weighted kappa coefficient obtained for the DSI symptoms indicates an acceptable range of stability, with values ranging from 0.498 to 0.920, which can be considered as moderate for the symptoms with the lowest score, cough (0.498), diarrhoea (0.592), decreased appetite (0.546), shortness of breath (0.581), lightheadedness or dizziness (0.545) and worrying (0.558) (Shultz et al., 2020). The variation in these values suggests that some symptoms may be transitional and can change between the two measurement times (Weisbord et al., 2004; Zamanian and Kharameh, 2015).
Test–retest reliability obtained an ICC value of 0.868 (95%CI 0.836–0.896). Values between 0.75 and 0.9 indicate good reliability (Portney et al., 2009).
The convergent validity assessment shows a high positive correlation between simultaneous symptoms in the DSI and IPOS-r and the score of both scales. The Pearson r correlation between the score of both scales was a strong positive correlation r = 0.844, confirming the instrument’s convergent validity (Shultz et al., 2020).
The construct validity of the scale was assessed by conducting an EFA. Oblique rotations were conducted since the EFA aims to assess the interrelated factors of the construct to be evaluated (Shultz et al., 2020). Factor analysis attempts to reduce the number of elements by accounting for the patterns of intercorrelations among items. The number of factors to extract was obtained by conducting a parallel analysis generating random data with uncorrelated items (Shultz et al., 2020), leading to the extraction of six factors. This differed from other studies that assessed the DSI construct validity, which revealed varying factor solutions (Chaiviboontham et al., 2020; Cho et al., 2018). The discrepancy in the number of factors extracted can be attributed to sample characteristics. The homogeneity of our sample, with a low prevalence of disability, may have limited heterogeneity and influenced the number of factors retained (Gaskin et al., 2017). The factor loading is a regression between the item score and the underlying latent trait or factor, and in this study, values range from 0.400 to 0.943. Loads are considered as low, medium and high loadings according to 0.4, 0.6 and 0.8, respectively. In this case, the loading with a low score is related to factor 3, representing the musculoskeletal and neurologic symptoms with more associated items. Different entities’ symptoms constitute the six factors, and EGA represents the interaction between symptom clusters. The six factors solution explained 57% of the variance of the result.
The ES calculated the responsiveness twice, t0 (baseline) score and t1 score (4 weeks apart). The obtained results of 0.30 are considered small changes (Husted et al., 2000). The SDC was calculated using ESi and patient score change. The obtained results, where the SDC (28.32) is higher than the MCID (7.23), mean that an individual change in score of 28.32 points or higher may be a clinically relevant change in the DSI-related symptoms.
Our study’s contribution lies in developing the Portuguese version of the DSI, addressing a gap in available tools for assessing HD patients’ symptoms. The results underscore the ability of this instrument to evaluate reported symptoms and its utility as a screening tool, with a convenient administration time of approximately 10 minutes. However, it is essential to mention that determining the best frequency for symptom screening in HD patients is still unclear, especially without overwhelming them (Mehrotra et al., 2023).
Nevertheless, certain limitations of the study should be acknowledged. Using a convenience sample of 156 patients may have introduced selection bias, as those recruited may have exhibited lower symptom scores than the broader HD patient population. Additionally, future studies should adopt a longitudinal approach to investigate symptom changes over time. Furthermore, future investigations should investigate the biological, socioeconomic and genetic factors influencing reported symptoms. Age and clinical history of patients may also influence the reported symptoms, warranting further investigation to provide a comprehensive understanding of these factors and their impact on symptom reports.
Conclusion
The cross-cultural adaptation and validation of the Portuguese version of the DSI scale significantly enhances our capacity to assess and address the symptom burden experienced by HD patients. This research contributes to the growing body of evidence supporting the utility of the DSI in diverse cultural settings. Healthcare professionals must incorporate this instrument into clinical assessments to identify and address the symptoms patients prioritise, ultimately leading to improved care and outcomes.
Key points for policy, practice and/or research
PROMs have the potential to support clinical nursing practice.
Nurses can use the Dialysis Symptom Index (DSI) to assess the condition of the Portuguese population undergoing haemodialysis (HD).
The implementation of the DSI as a routine scanning tool by nurses can reduce the severity and prevalence of disease and treatment side effects, improving patient’s QoL.
Footnotes
Acknowledgements
We thank Steven D. Weisbord for authorising the translation and validation of the Dialysis Symptom Index scale. Also we would like to thank all the participant samples of the study and the two dialysis centres where this research was conducted. A special acknowledgement to HEADS – PhD Programme in Health Data Science.
Correction (April 2024):
Article updated online to list the symptoms in English shown in Figure 3.
Declaration of conflicting interests
The author(s) declared no potential conflicts of interest with respect to the research, authorship, and/or publication of this article.
Funding
The author(s) received no financial support for the research, authorship, and/or publication of this article.
Ethical approval
This study was conducted after the Ethical Committee approval from the two dialysis centres where the study was performed (06/09/2021). All the recruited patients for the study signed a consent form and were informed about the study procedures and data analysis.