
Abstract
Objective:
This study aims to characterize the remodeling of acetylation-related gene expression in knee osteoarthritis (KOA) patients with a marked response to warm-needle acupuncture (WNA) and to identify key genes and underlying immunoregulatory mechanisms.
Methods:
In this prospective self-paired study, 34 KOA patients were recruited, and whole-blood samples were collected before and after WNA treatment for transcriptome sequencing. Differential expression analysis identified acetylation-related genes followed by enrichment and protein–protein interaction analyses. Key genes were extracted via feature selection based on LASSO and SVM-RFE methods and further used to establish and validate a multigene logistic regression model. Consensus clustering was used to identify two acetylation subtypes (ACEcluster A/B), and their immune characteristics were further explored by ssGSEA and immune-cell infiltration profiling.
Results:
After treatment, acetylation-related genes were globally upregulated and were enriched in protein acetylation and acetyltransferase complex pathways. Further, four genes (SPRED1, HDAC3, NSRP1, and DUSP1) exhibited stable performance and were further used to build a nomogram and achieve high discriminative performance (AUC = 0.908 in the training set; 0.810 in the validation set). Subtype B displayed higher acetylation activity and immune-cell infiltration. Co-expression analysis on 452 acetylation-related genes extracted 107 highly co-regulated candidates and further clustered into two groups coinciding with ACEcluster classification.
Conclusion:
WNA markedly remodels the peripheral-blood acetylation-related transcriptomic network in KOA and suggests that stronger acetylation activity is associated with immune-cell activation. The four-gene nomogram provides both mechanistic insights and a potential tool for individualized prediction of WNA efficacy.
Keywords
Introduction
Knee osteoarthritis (KOA) is a prevalent, debilitating, costly, and chronic progressive joint degenerative disease with articular pain, stiffness, and activity restriction, seriously affecting quality of life in middle-aged and elderly individuals. 1 Currently, oral medications, intra-articular injections, and total knee arthroplasty are available for treatment of KOA. However, long-term use of nonsteroidal anti-inflammatory drugs (NSAIDs) can lead to gastrointestinal and cardiovascular adverse effects, while intra-articular injections and surgical interventions are primarily indicated for advanced cases, offering limited efficacy in early to middle stages and carrying risks of trauma and postoperative complications. 2 Many randomized controlled trials have reported that acupuncture can effectively relieve pain and improve joint function in KOA patients with good safety. 3 Warm-needle acupuncture (WNA) integrates needling stimulation and steady heat input. On one hand, it retains the holistic regulatory effects of acupuncture. On the other hand, it enhances the warming and circulation-promoting effects induced by heat stimulation. 4 Warm-needle acupuncture exhibits better analgesic effects and functional recovery effects in clinical application, and is an important complementary therapy for treating KOA. 5 However, the molecular mechanism underlying the therapeutic effect of WNA for knee osteoarthritis is still unclear.
Epigenetic studies have revealed that protein acetylation is involved in inflammation, chondrocyte metabolism, immune regulation, and joint degeneration. 6 Abnormal acetylation can further modulate downstream signaling pathways and target gene expression, and is considered to be an important driving force in the pathogenesis of many osteoarticular diseases, including knee osteoarthritis. 7 Thus, characterizing the acetylation-related transcriptional changes before and after WNA treatment in KOA patients may provide a valuable molecular basis for individualized therapeutic strategies. High throughput transcriptome sequencing combined with machine learning provides powerful approaches to discover biomarkers and construct predictive models. 8 Least absolute shrinkage and selection operator (LASSO) regression and support vector machine–recursive feature elimination (SVM-RFE) have been validated in multiple biomedical fields, including oncology, immune disorders, and metabolic diseases, for their ability to identify stable and biologically meaningful core gene signatures from high-dimensional data. 9 Applying these approaches to knee osteoarthritis patients enables us to discover the molecular patterns closely related to large therapeutic effects in these patients, and lays the foundation for constructing interpretable and clinically integrated predictive models.
Therefore, in this study, we recruited 50 patients with KOA and collected peripheral whole-blood samples before and after WNA treatment. We then evaluated treatment response and selected patients with significant clinical improvement for further analysis. Ultimately, we enrolled 34 patients who showed significant clinical improvement for further systematic transcriptomic analysis. Using differential expression and functional enrichment analysis, unsupervised clustering, immune infiltration profiling, and multiple machine-learning algorithms, we established and validated the acetylation-related molecular signatures and key gene sets with significant WNA response. The objectives of this study were to: (1) characterize the acetylation-related transcriptional landscape modulated by WNA in KOA patients; (2) identify core genes associated with significant therapeutic response and develop a predictive model; (3) provide molecular-level insights to support KOA subtyping and individualized intervention strategies.
Methods
Participants and study design
This study used a prospective self-paired design. A total of 50 patients with a diagnosis of KOA based on ACR criteria were enrolled, 10 and all received a standard WNA treatment protocol.11,12
All patients provided written informed consent for their inclusion in the study. The study protocol was approved by the institutional ethics committees of the following institutions: Shanghai Municipal Hospital of Traditional Chinese Medicine, Shanghai University of Traditional Chinese Medicine (Approval No. 2025SHL-KY-02-02), Guanghua Hospital Affiliated to Shanghai University of Traditional Chinese Medicine (Approval No. 2025-K-32), and Fudan University Shanghai Fifth People’s Hospital (Approval No. 2025-110).
The treatment consisted of two consecutive courses (about 10 days for one course, a 2–3 day interval between the two courses), administered once a day or on alternate days. Peripheral whole-blood samples were collected at baseline (pre-treatment) and on day 22 or 23 after the initiation of treatment. Each treatment course lasted about 20 min. The chosen acupoints were Dubi (ST35), Neixiyan (EX-LE4), Xuehai (SP10), Liangqiu (ST34) and Heding (EX-LE2). WNA was performed with moxa sticks on the needles at Dubi (ST35) and Neixiyan (EX-LE4), and 2 moxa cones were burned at each of these acupoints during each acupuncture session.
Treatment efficacy was assessed by the Western Ontario and McMaster Universities Osteoarthritis Index (WOMAC, total score 96, Likert 4-point version), and a ≥12-point decrease from baseline was defined as a positive response. 13 We excluded non-responders and dropouts by follow-up and finally 34 patients with significant clinical improvement were included for the subsequent analyses. Each patient provided strictly paired blood samples (pre- and post-treatment). In total, 24 patients (48 samples) from Shanghai Municipal Hospital of Traditional Chinese Medicine, Shanghai University of Traditional Chinese Medicine, were used as the training cohort, while 10 patients (20 samples) from Guanghua Hospital Affiliated of Shanghai University to Traditional Chinese Medicine and Fudan University Shanghai Fifth People’s Hospital were used as the validation cohort.
RNA extraction and sequencing
Total RNA was extracted from peripheral whole-blood samples using standard protocols. RNA purity and integrity were further assessed using a NanoDrop spectrophotometer and an Agilent 2100 Bioanalyzer. All samples had RIN >7.0. 14 Strand-specific mRNA libraries were constructed and quality control was carried out at each critical step. Finally, qualified libraries were constructed by Personalbio Co., Ltd. (Shanghai, China) and sequenced on a BGI T7 platform using a paired-end 150 bp strategy. Clean sequencing data (FASTQ format) were obtained, and the sequencing depth and Q30 score were calculated for all samples.
Transcriptomic data processing
Quality control of raw sequencing reads was carried out using fastp (v0.23.2) to remove adapter sequences and low-quality reads to guarantee overall sequencing quality (Q30 ≥90%). The remaining clean reads were then used for alignment to the human reference genome (GRCh38) using HISAT2 (v2.2.1). Next, gene-level raw count matrices were generated using featureCounts (v2.0.1). Then, in an R 4.3.2 environment, the edgeR package was used to calculate normalization factors based on the trimmed mean of M-values (TMM) method, and then the count matrix was converted into logCPM expression values. 15 After that, the limma–voom with quality weights workflow was then used for precision weighting and variance modeling. In addition, Surrogate Variable Analysis (SVA) was used to remove potential batch effects by identifying and correcting them, and then a high-quality expression matrix was obtained for subsequent DEG analysis.
Differential expression analysis
Differential expression analysis was carried out using the edgeR and limma–voom with quality weights pipelines. A paired design was used, in which subject ID was set as a blocking factor to compare the pre-treatment sample group a and the post-treatment sample group b. The threshold for differentially expressed genes (DEGs) was defined as FDR <0.05. The results were visualized using ggplot2 and ComplexHeatmap for volcano and MA plots, and heatmaps visualized the expression profiles and clustering relationships of samples.
Functional enrichment analysis
Acetylation-related gene sets were retrieved from the Molecular Signatures Database (MSigDB) using the keywords “acetylation.” After deduplication and standardization, a total of 452 acetylation-related human genes were obtained and served as the background gene set for subsequent analyses. 16 Differentially expressed acetylation-related genes were extracted based on pre- versus post-treatment comparisons, and functional enrichment analysis was conducted for both the entire background set and the top 50 significantly altered genes.
Functional annotation, including Gene Ontology (GO), Kyoto Encyclopedia of Genes and Genomes (KEGG), and Disease Ontology (DO) analyses, was performed using clusterProfiler (v4.8) with a significance threshold of FDR < 0.05. The results were visualized using enrichplot and GOplot through barplot, dotplot, cnetplot, emapplot, and circos diagrams to comprehensively display enriched biological processes (BP) and network relationships.
Machine-learning–based identification of key acetylation-related genes
Feature selection was performed in the training cohort using two complementary machine-learning approaches. First, LASSO regression (glmnet, family = "binomial", 10-fold cross-validation) was applied, which introduces L1 regularization to minimize prediction error while eliminating redundant variables; stable features were selected at the λ₁se criterion. 17 Second, SVM-RFE (e1071 + caret) with a radial basis function kernel and repeated cross-validation was used to iteratively remove the least-weighted features and identify the optimal gene subset. 18 For both LASSO regression and SVM-RFE analyses, the independent variables were the logCPM expression values of acetylation-related genes in the training cohort, and the dependent variable was the binary treatment status (pre-treatment vs post-treatment).
The intersection of the two algorithms yielded the final set of key acetylation-related gene signatures. These genes were then used as independent variables to construct a multivariable logistic regression model. Model robustness and generalizability were evaluated using leave-one-pair-out cross-validation (LOPO-CV) and the bootstrap .632+ method. Receiver operating characteristic (ROC) curves were generated with the pROC package, and the area under the curve (AUC) and 95% confidence intervals were calculated for both the training and independent validation cohorts. Finally, SHapley Additive exPlanations (SHAP) values were computed using the fastshap package to quantify and interpret the positive and negative contributions of each gene to model prediction, thereby elucidating the underlying decision-making mechanisms of the model.
Sample-level clustering
Based on post-treatment samples, consensus clustering was conducted on the expression matrix of significantly altered genes using ConsensusClusterPlus (algorithm = pam, distance = Euclidean, maxK = 9, resampling = 50 iterations). 19 The optimal number of clusters was determined by CDF and delta area curves as K = 2, which divided all samples into two subtypes, labeled as ACEcluster A and ACEcluster B. The clustering stability and separation were also evaluated by heatmap visualization, principal component analysis (PCA) and boxplots comparison.
Gene-module–level clustering
To identify highly correlated expression modules of acetylation-related genes in the training cohort, we first calculated pairwise Pearson correlation coefficients of expression profiles across all 452 candidate acetylation genes. We retained gene pairs with |r| > 0.95 and after removing redundant pairs, we obtained 107 highly co-expressed genes. Then we applied these 107 genes as input for unsupervised consensus clustering using ConsensusClusterPlus (v1.40) (24). We used the same parameter settings as used in ACEcluster analysis (pam algorithm, euclidean distance, maxK = 9, resampling = 50 iterations, item resampling rate = 80%).20,21 We evaluated the clustering stability by CDF and delta area curves. Finally, two robust gene-module subtypes, labeled as geneCluster A and geneCluster B, were identified as the basis for subsequent cross-level comparative analysis.
Integrated scoring
To quantitatively characterize the overall acetylation activity of each sample, we constructed a single sample gene set enrichment analysis (ssGSEA) model using the 107 highly co-expressed genes identified previously. The standardized enrichment score calculated by this model was defined as the acetylation cluster enrichment score (ACEscore), reflecting the overall acetylation signal of each sample. We compared the enrichment scores of ACEcluster and geneCluster subtypes based on Wilcoxon rank-sum test to evaluate the statistical significance of ACEscore differences between subtypes. 22 This scoring system further validated the biological relevance of the clustering structure at both sample-level and gene-module–level.
Immune infiltration analysis
Then, ssGSEA was implemented on TMM-normalized and batch corrected logCPM expression matrix to calculate the enrichment score of 19 immune cell–specific gene sets, 23 and the enrichment profiles of immune infiltration were analyzed in ACEcluster, geneCluster and groups based on the median expression of four significantly acetylation-related genes. Furthermore, Spearman correlation analysis was used to analyze the relationship between enrichment scores of different immune cells and the expression of different significantly expressed acetylation-related genes. The correlation matrix was constructed based on the correlation between different genes and different immune cells, and then the functional gene–immune module was mined by performing hierarchical clustering based on Euclidean distance and complete linkage method. Correlation heatmaps and boxplots for groups were also generated.
Clinical prediction model
Based on the feature selection and cross-validation results in the training cohort and the independent validation cohort, we combined the results of LASSO and SVM-RFE, and then the stability of the model was evaluated by internal and external validation using four significantly expressed acetylation-related genes. Finally, we identified four significantly expressed acetylation-related genes for model construction. A multivariable logistic regression model was constructed using rms package (v6.3), and the nomogram was generated using the nomogram function. 24 Model discriminative performance was evaluated by receiver operating characteristic (ROC) analysis and then the results were quantified by AUC. The calibration curve was used to assess the agreement between the predicted probabilities and observed outcomes. Decision curve analysis (DCA) and clinical impact curves (CIC) were used to evaluate clinical net benefit and potential clinical utility for the model. 25
Visualization and statistical analysis
All statistical analyses and visualizations were performed in the R 4.3.2 environment, primarily using the ggplot2, pheatmap, and ComplexHeatmap packages. For paired comparisons, the paired t-test or Wilcoxon signed-rank test was applied according to data distribution, while multiple-group comparisons were conducted using the Kruskal–Wallis test. Multiple testing correction was uniformly performed using the Benjamini–Hochberg method (FDR <0.05). AUC values, means, and confidence intervals were all reported to three decimal places.
Results
Quality control
High-throughput sequencing was performed on 68 peripheral blood samples collected before and after treatment. Following quality control with fastp, the overall sequencing data exhibited excellent quality.
First, the average base quality (Phred score) across the 1–150 bp range remained consistently between 36 and 40 for all samples, with Q30 values exceeding 90%. The quality curves for pre-treatment (con, blue) and post-treatment (treat, red) samples were nearly superimposable, indicating no systematic differences (Figure 1(a) and (b)). Second, the nucleotide composition analysis revealed slight fluctuations among the four bases (A, T, C, and G) within the initial 10–15 bp, followed by rapid stabilization, with base proportions maintained between 20% and 30%. The two groups showed highly consistent trends (Figure 1(c)). We also analyzed the average read quality scores and found that the majority of reads were clustered above Q35 and reached a peak at Q37 (Figure 1(d)), suggesting an extremely low error rate and highly overlapping distributions between samples. Finally, we analyzed gene body coverage and found that reads were uniformly distributed along the 5′–3′ regions of transcripts and formed a typical “U-shaped” curve with normalized mid-region coverage approaching 1.0. The two types of samples showed consistent trends, and only slight declines were observed at the 3′ end of a few samples in the post-treatment group—within acceptable limits (Figure 1(e) and (f)).
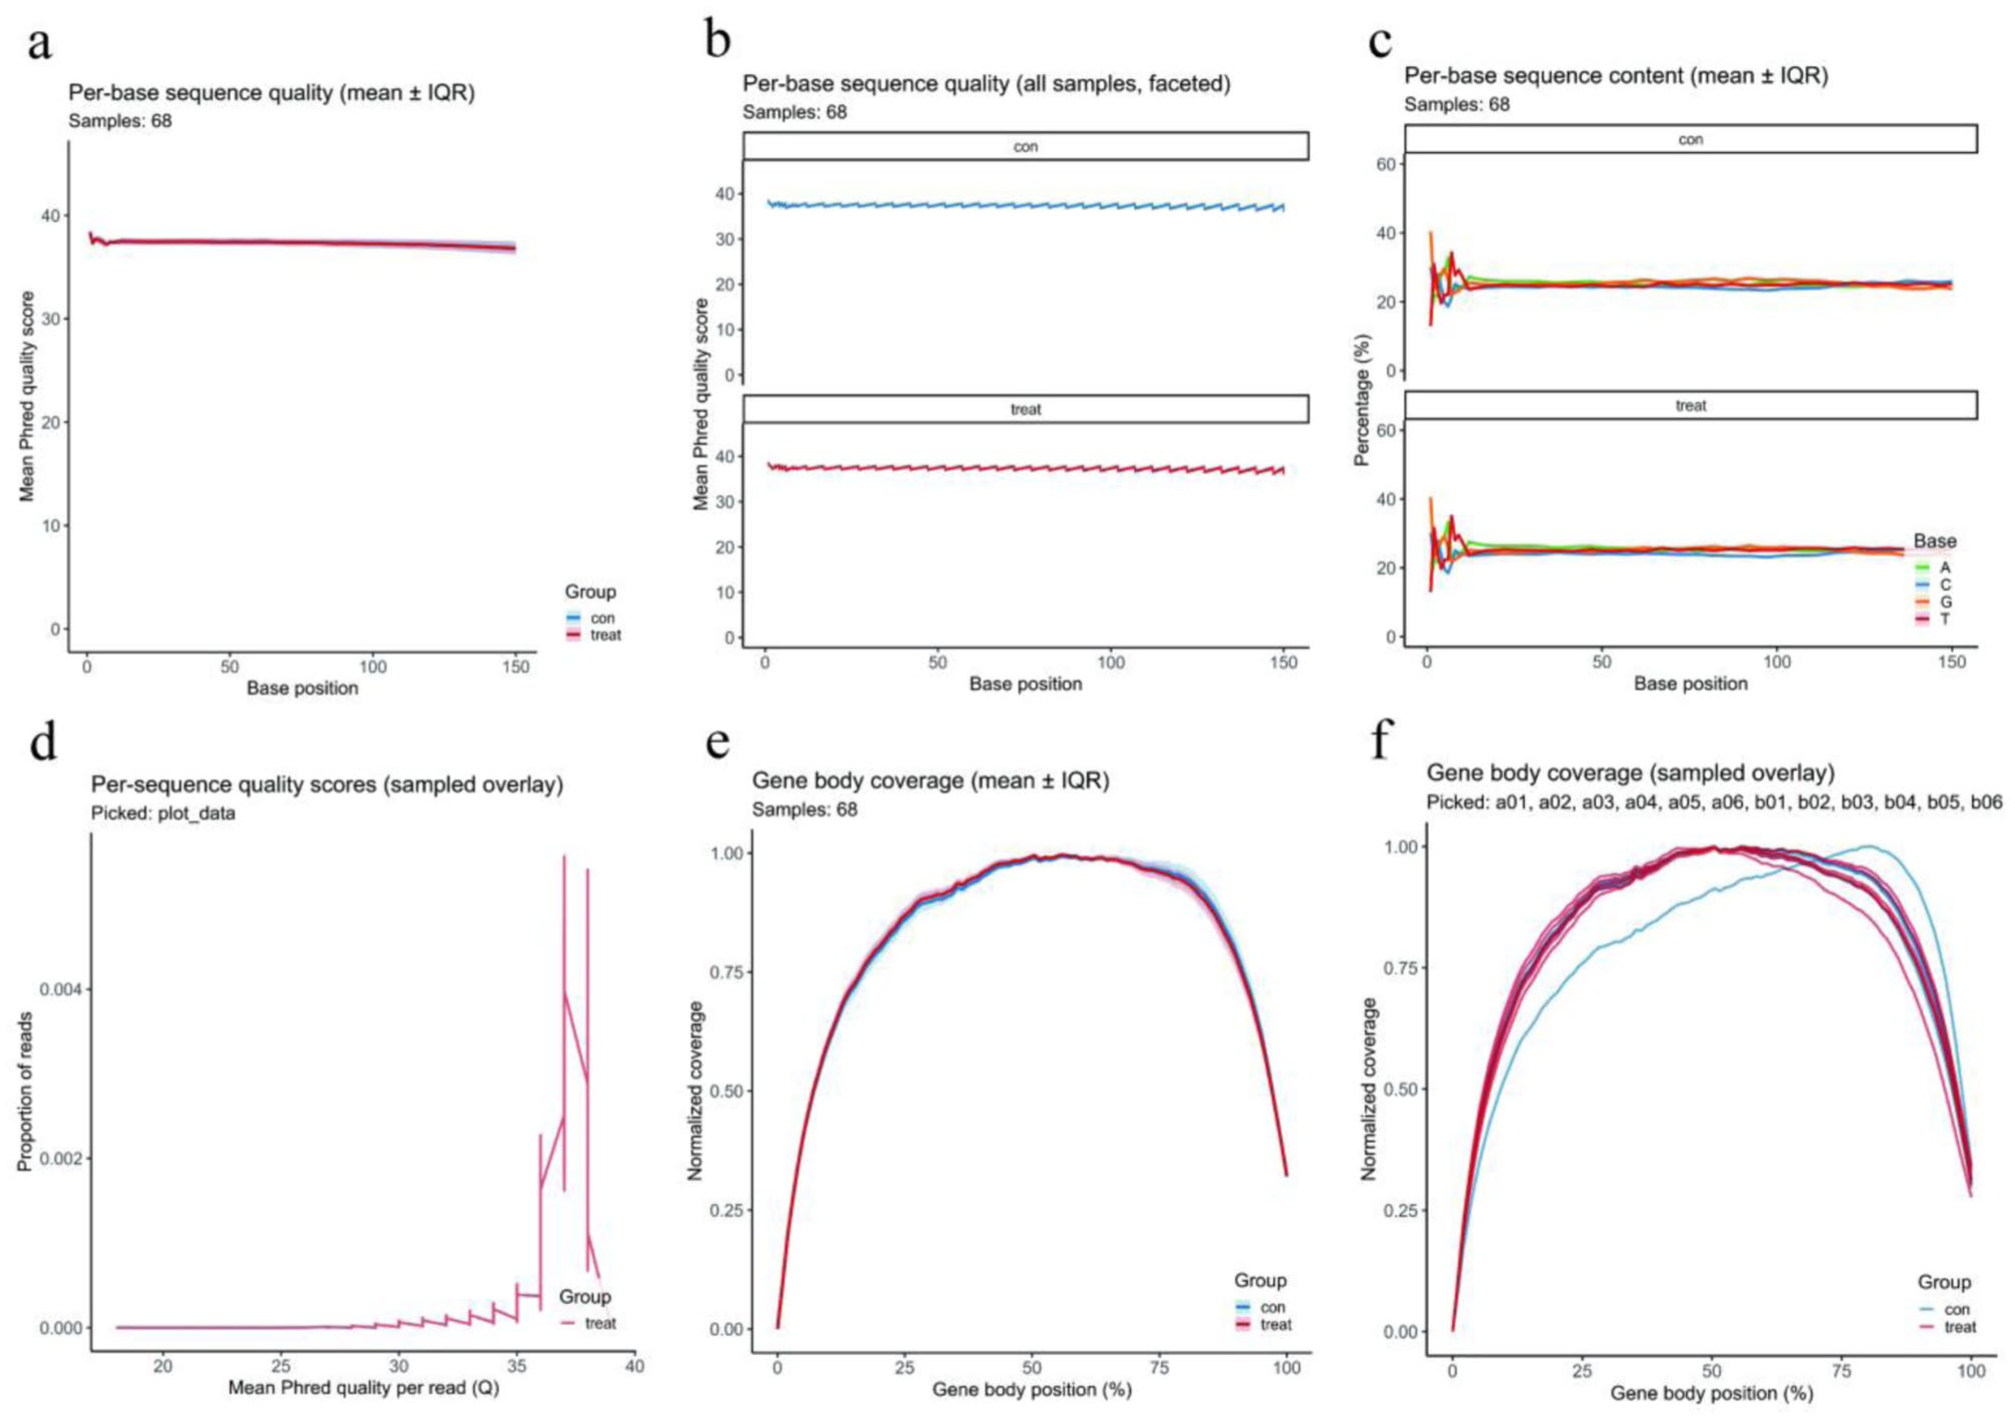
Quality control assessment of transcriptome sequencing data. (a) Average base quality across 68 samples. The Phred score of each base was always maintained between 36 and 40 within the range of 1–150 bp. (b) The base quality of each group. The curves of pre-treatment and post-treatment samples were almost the same, and there were no significant differences between the two groups. (c) The base composition within the initial 10–15 bp showed slight fluctuations among A, T, C, and G and then stabilized. Each base’s proportion was maintained between 20% and 30%. (d) The distribution of mean quality of all reads showed that most of them were above Q35 and there was a peak at Q37. It indicated an extremely low error rate. (e) Overall gene body coverage uniformity between samples. It exhibited a typical “U-shaped” curve, and the normalized mid-region coverage approached 1.0. (f) The gene body coverage of each group. The overall trend between pre- and post-treatment samples was consistent. Only a few samples showed slight declines at the 3′ end, and they were all within the acceptable range.
To address the potential confounding effects of baseline clinical characteristics, we further assessed the comparability between the training and validation cohorts. Key demographic variables, disease duration, baseline pain and functional severity, radiographic grade, comorbidities, and recent medication use showed no significant differences between cohorts, with overall low-to-moderate absolute standardized mean differences (Figure S1). Moreover, all transcriptomic analyses and machine-learning procedures were performed using a strictly paired pre–post design within the same individuals, which is known to effectively control for time-invariant baseline factors such as age, sex, body composition, and long-term disease status, particularly in studies with limited sample size.
Overall, these results demonstrated that the sequencing data were highly consistent and reliable across multiple quality metrics, which formed a solid basis for subsequent differential expression and functional analyses.
Differential expression analysis of acetylation-related genes in the 24-pair KOA training cohort
In the 24 strictly paired cases (total 48 samples) from the training cohort, a total of 74 acetylation-related genes were found to be significantly differentially expressed between pre- and post-treatment samples (FDR <0.05). To visualize the representative expression patterns, we chose the top 50 significantly differentially expressed genes for visualization and downstream enrichment analysis. The heatmap of these genes is shown in Figure 2(a). The overall expression patterns of pre-treatment and post-treatment samples were clearly separated, and the blue–red color contrast reflected downregulated and upregulated genes respectively. When pairing at the individual level was introduced into the heatmap (Figure 2(b)), we found that the overall upregulation trend of gene expression after treatment was consistently presented within the same subject. Paired boxplots of the top 50 DEGs (Figure 2(c)) also validated this finding—most genes were upregulated after treatment (FDR <0.05), indicating a consistent upregulation trend of acetylation-related gene expression at both individual and population levels.

Differential expression analysis of acetylation-related genes in 24 paired KOA samples from the training cohort. (a) Heatmap displaying overall expression patterns of the top 50 differentially expressed acetylation-related genes in the training cohort. Pre-treatment samples and post-treatment samples were clearly globally separated. (b) Paired heatmap displaying within-subject variation of gene expression before and after treatment. Most patients showed an enhanced red signal in the treated group, indicating an overall upregulation trend in most genes. (c) Paired boxplots of top 50 genes illustrating individual-level expression changes. Most genes were significantly upregulated after treatment, and differences were statistically significant (FDR <0.05). (d) Volcano plot of all 452 acetylation-related genes. Red dots represented upregulated genes, blue dots represented downregulated genes and gray dots represented non-significant genes. Overall trend indicated more genes were upregulated. (e) Volcano plot of the top 50 most significantly altered genes (ranked by FDR). Several genes such as SPRED1 and HDAC3 were markedly upregulated after treatment.
At the global scale, the volcano plot of all 452 acetylation-related candidate genes (Figure 2(d)) also showed a predominance of upregulation, that is, more genes were upregulated than downregulated. For the top 50 most significantly altered genes (ranked by FDR) shown in the volcano plot (Figure 2(e)), we found that several genes, such as SPRED1, showed remarkable upregulation after treatment (Figure 2(e)), which may play central roles in the therapeutic effect of WNA.
All these results demonstrated that WNA treatment could significantly remodel the global expression profile of acetylation-related genes in the peripheral blood of KOA patients, that is, there was a consistent upregulation trend at both single-gene and paired-individual levels, which provided strong support for subsequent functional enrichment, clustering and machine-learning–based feature selection analyses.
Network and enrichment analyses of key acetylation-related genes
We performed protein interaction and functional enrichment analyses based on the top 50 differentially expressed acetylation-related genes from 24 paired samples in the training cohort. The protein–protein interaction (PPI) network (Figure 3(a)) suggested that these genes were highly functionally connected into modules (3–5 small modules in the network) around their core regulators (HDAC3 and SIRT7). The different color edges represent different types of interactions, including co-expression, physical interaction, predicted interaction, co-localization, genetic interaction and protein domain interaction. These results suggested that these genes may constitute coordinated regulatory axes involved in transcriptional regulation, chromatin modification and RNA metabolism etc., which are possibly involved in the molecular mechanism of WNA-induced response.

Network and functional enrichment analyses of differentially expressed acetylation-related genes. (a) PPI network of the top 50 differentially expressed acetylation-related genes. Colored edges indicate different types of interactions, such as co-expression, genetic interaction, predicted interaction, co-localization, physical interaction and protein domain interaction. (b) GO enrichment results, indicating significantly enriched terms for BP, CC, and MF. (c) KEGG pathway enrichment analysis, and some significantly enriched pathways were displayed, such as Signaling pathways regulating pluripotency of stem cells and related regulatory cascades. (d) DO enrichment results, indicating that these DEGs were involved in immune regulation network, neural homeostasis network and stress-related disease network. (e) Circos plot for the chromosomal localization and log2 fold-change of the top 50 differentially expressed acetylation-related genes across human chromosomes.
GO enrichment analysis (Figure 3(b)) revealed significant enrichment of these genes in BP terms such as protein acetylation and protein deacetylation. These genes were also significantly enriched in cellular components (CC) such as acetyltransferase complex and histone deacetylase complex, and in molecular functions (MF) such as histone-modifying activity and acetyltransferase activity. Therefore, WNA may mainly regulate the phenotypes by modulating the acetylation/deacetylation process and chromatin remodeling. KEGG pathway analysis (Figure 3(c)) showed that these DEGs were enriched in signaling pathways such as Signaling pathways regulating pluripotency of stem cells which may be involved in epigenetic modification and cellular stress response. DO enrichment (Figure 3(d)) also showed that these differentially expressed genes were mainly enriched in immune regulation, neural homeostasis, tumorigenic signaling, and metabolic stress-related process. In addition, the circos plot (Figure 3(e)) showed the global distribution and expression level of these 50 key differential genes on the chromosomes. These differentially expressed genes were almost distributed in all chromosomes except for chromosome 14, 22, and Y. These genes were relatively clustered in chromosome 1, 3, 12, and 17. Upregulated genes were mainly enriched in chromosome 1, 2, and 11. Downregulated genes were more scattered in other chromosomes, which may indicate that these chromosomes may play a certain regulatory role in the molecular effect of WNA treatment.
Machine-learning identification and expression validation of core acetylation-related genes
Using the 50 acetylation-related candidate genes, we further performed feature selection on the 24 paired cases (48 samples in total) of the training cohort by LASSO with binomial logistic regression after they had been initially identified in the feature selection procedure of WNA response. As shown in Figure 4(a), the coefficient path showed that when the penalty parameter λ increased, most of the gene coefficients were shrunk toward zero and became stable with only a few of them remaining nonzero over a relatively large λ range. The cross-validation curve reached the minimal prediction error at λ_min and the λ_1se criterion selected a more parsimonious model to ensure better generalization performance and lower risk of overfitting. Therefore, LASSO could effectively shrink the redundant variables and select core acetylation-related genes strongly related to the significant therapeutic response to WNA (Figure 4(a) and (b)). Then, we applied SVM-RFE with radial basis function kernel, followed by 10×5-fold cross-validation to evaluate the classification performance with an increasing number of selected features. As shown in Figure 4(c), the misclassification rate gradually decreased with the increase of selected features and reached the minimum when seven genes were selected, and remained stable within one standard error (4–9 genes) compared with the full candidate set. It suggested that, compared with the full candidate set, SVM-RFE could effectively decrease dimensionality without hurting or even improving predictive performance (Figure 4(c)).

Machine-learning–based feature selection and validation of core acetylation-related genes in 24 paired training samples. (a, b) Results of LASSO feature selection: the left panel shows the coefficient path plot, and the right panel presents the 10-fold cross-validation curve indicating λ_min and λ_1se values. (c) SVM-RFE feature elimination curve, where the x-axis represents the number of features and the y-axis indicates the cross-validated misclassification rate. The red dot marks the optimal result obtained with seven genes. (d) Venn diagram showing the intersection of LASSO (λ_1se) and SVM-RFE results, highlighting seven core genes commonly identified by both algorithms. (e, f) SHAP-based model interpretation for the seven core genes: the left panel depicts feature importance ranking, and the right panel illustrates SHAP value distributions across samples. (g–m) Expression validation of the seven core genes in 24 paired samples before and after treatment (blue = pre-treatment; red = post-treatment).
Comparison of the SVM-RFE results with those of LASSO (λ1se) identified seven overlapping genes, i.e., SETDB1, HDAC3, NSRP1, BLZF1, DUSP1, SPRED1, and SIRT7, which showed strong robustness of this core feature set (Figure 4(d)). SHAP analysis could also clarify the contribution of each gene to model prediction: SETDB1, HDAC3, and NSRP1 ranked among the top three, supporting the interpretability of the model (Figure 4(e) and (f)). Expression validation of the seven core genes in the paired training samples showed that NSRP1, BLZF1, and SPRED1 were significantly upregulated after treatment, whereas DUSP1, HDAC3, and SIRT7 were significantly downregulated. These findings suggest that the seven genes constitute a critical acetylation-regulatory network in WNA responders, possessing both stable predictive value and potential mechanistic importance in elucidating how WNA ameliorates knee osteoarthritis (Figure 4(g)–(m)).
Diagnostic performance of key genes and the overall model in the training and validation cohorts
In the training cohort of 24 paired cases (48 samples), all seven key acetylation-related genes exhibited clear discriminative ability (Figure 5(a)). AUC values for single-gene ROC analyses ranged from 0.734 to 0.896, with SPRED1 (AUC = 0.896), HDAC3 (AUC = 0.847), and NSRP1 (AUC = 0.842) exhibiting the greatest predictive ability. When the seven genes were tested as a multigene model by LOPO-CV, the predictive performance improved dramatically (Figure 5(b)). AUC was 0.908 (95% CI: 0.830–0.986), and the composite model could effectively segregate pre- and post-treatment molecular profiles in WNA responders. In the blind validation cohort (10 paired samples), AUC values for the overall discriminative ability of single genes to predict outcomes were moderately decreased (Figure 5(c)), ranging from 0.510 to 0.850. Nonetheless, DUSP1 (AUC = 0.850), SIRT7 (AUC = 0.800), and HDAC3 (AUC = 0.720) maintained good stability. The multigene integrated model showed similar performance in all cohorts (Figure 5(d)), with an AUC of 0.880 (95% CI: 0.721–1.000) in the validation set, indicating its excellent discriminative performance and generalization performance. Therefore, all these results indicated that the seven key acetylation-related genes have excellent diagnostic and predictive performance and could maintain high and stable performance in the training cohort and the independent validation cohort. This supports their feasibility and reliability as potential molecular biomarkers for identifying KOA patients with significant clinical response to WNA.
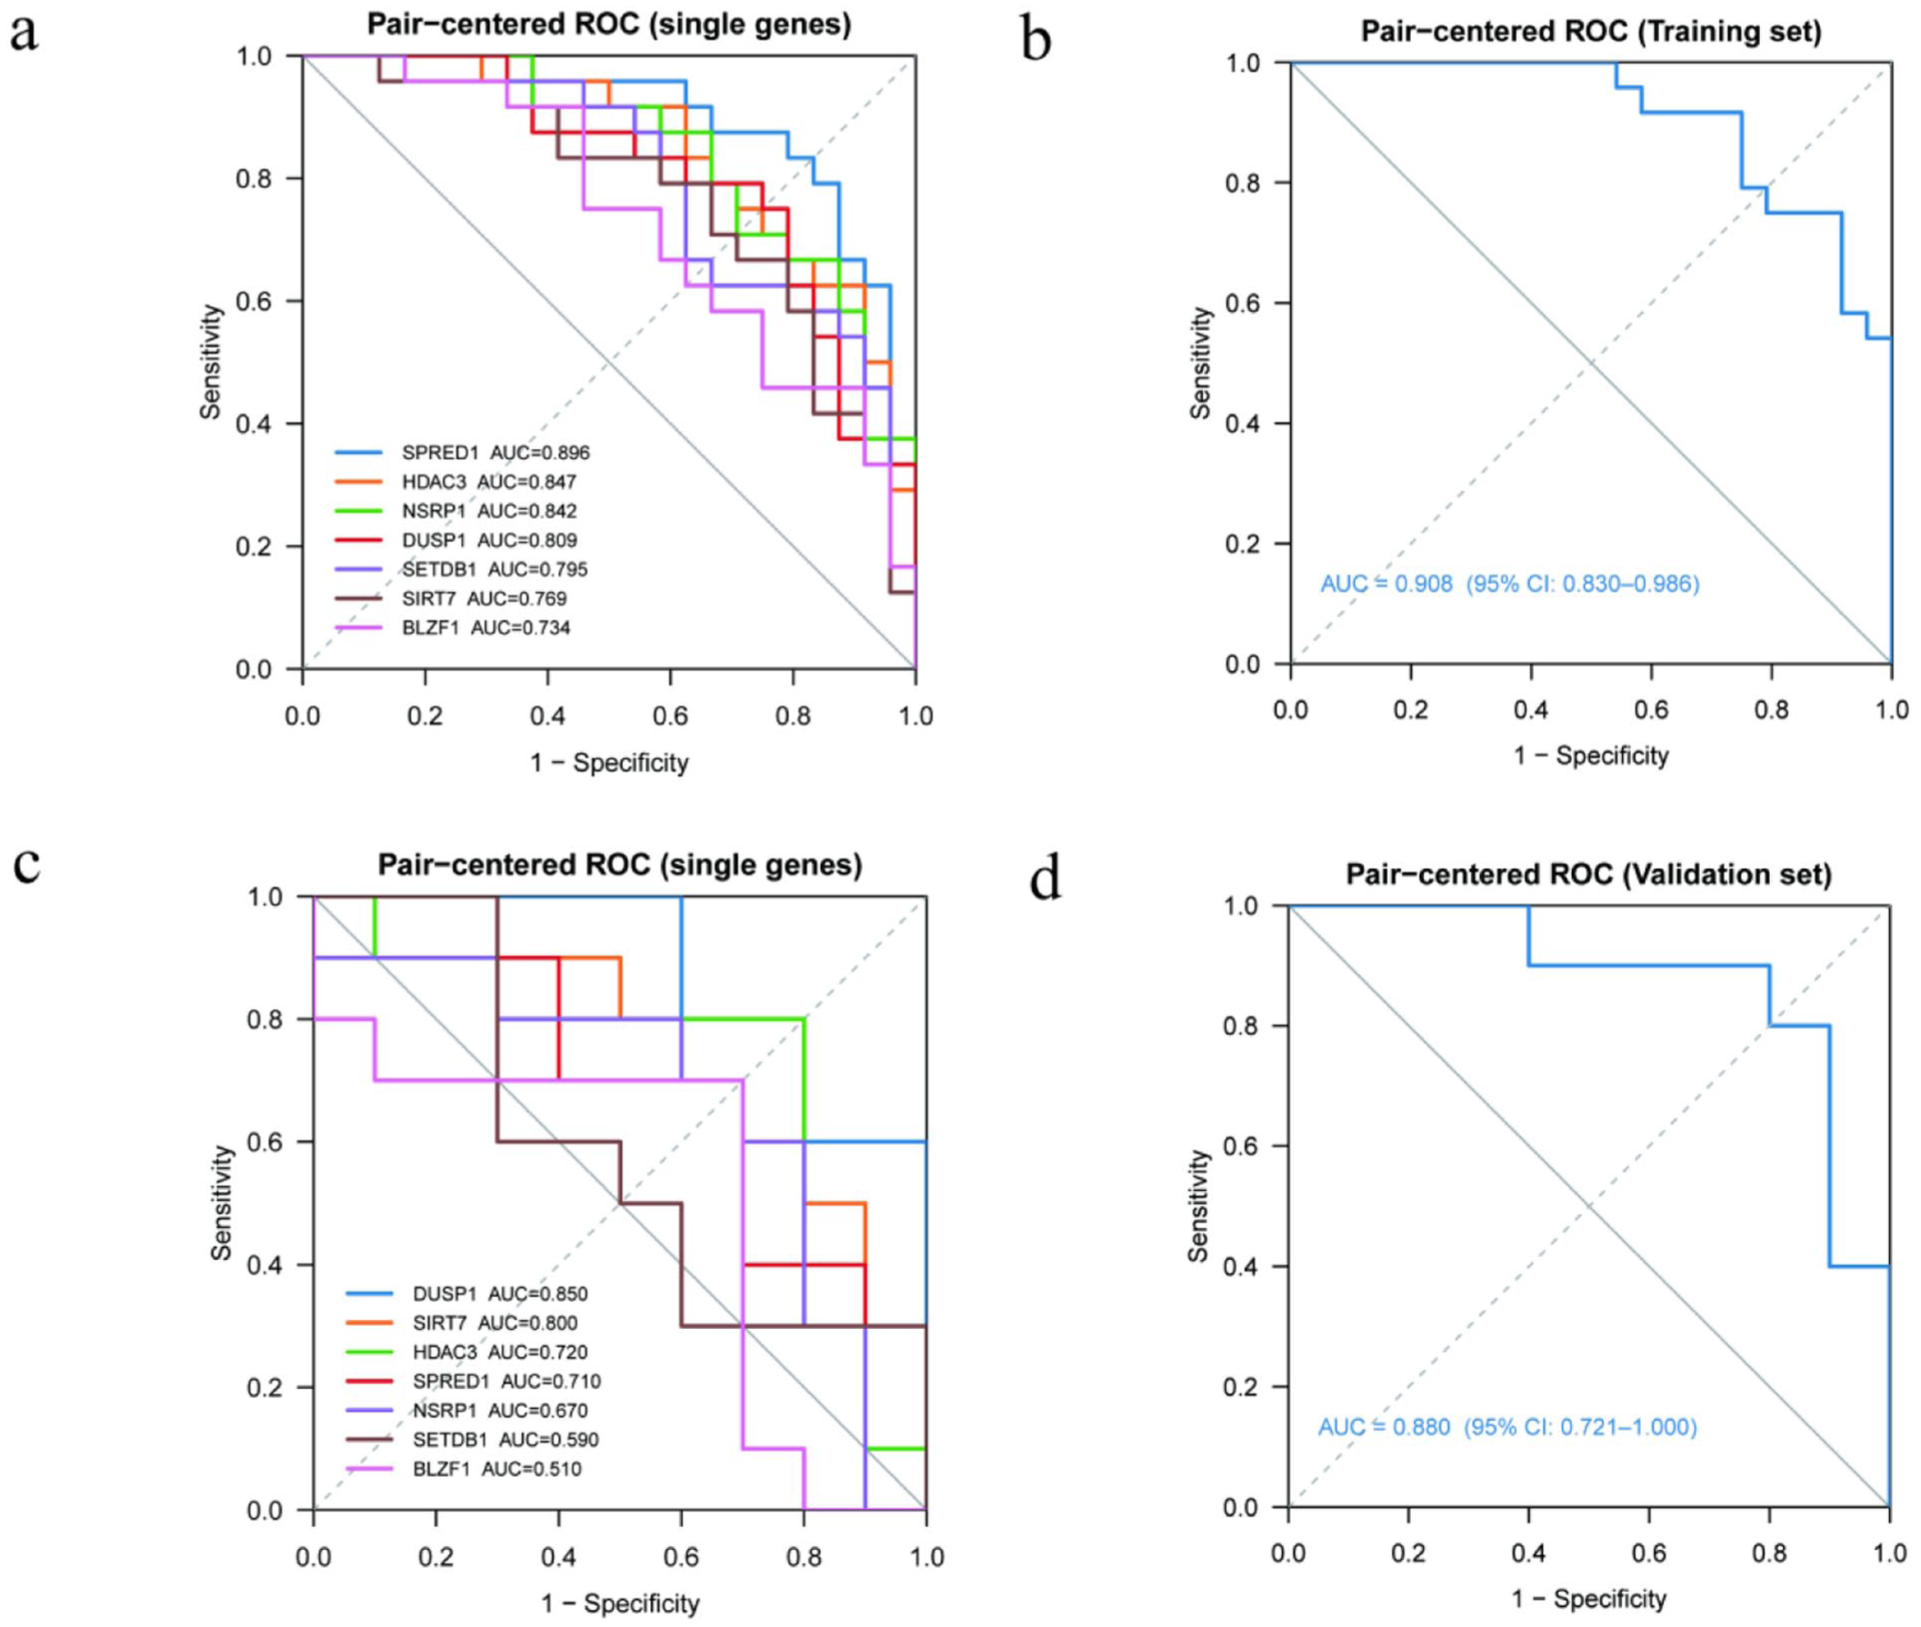
ROC diagnostic performance of key acetylation-related genes and the multigene model in the training and validation cohorts. (a) ROC curves of individual genes in the training cohort. The seven key acetylation-related genes demonstrated discriminative ability in distinguishing pre- and post-treatment samples, with AUC values ranging from 0.734 to 0.896. SPRED1, HDAC3, and NSRP1 exhibited the highest predictive performance. (b) ROC curve of the multigene integrated model in the training cohort. The combined seven-gene model, evaluated using LOPO-CV, achieved an AUC of 0.908 (95% CI: 0.830–0.986). (c) ROC curves of individual genes in the independent validation cohort. The seven key genes showed AUC values ranging from 0.510 to 0.850, with DUSP1, SIRT7, and HDAC3 maintaining good predictive stability. (d) ROC curve of the multigene integrated model in the validation cohort. The combined model achieved an AUC of 0.880 (95% CI: 0.721–1.000), indicating strong generalizability and consistent predictive performance across datasets.
Internal validation and robustness assessment of the four-gene predictive model
For the seven acetylation-related candidate genes, the comparative ROC of seven candidate genes in the training cohort and the validation cohort showed that the AUCs of SPRED1, HDAC3, NSRP1, and DUSP1 were always the highest and most stable. Therefore, we chose these four genes as the optimal gene group to build the model. In the training cohort, compared with the original seven-gene model, the simplified four-gene model attained almost similar discriminative performance, the AUCs were 0.908 (95% CI: 0.819–0.997) and 0.908 (95% CI: 0.830–0.986) for the seven-gene model and the four-gene model, respectively. Therefore, the model could maintain almost the same predictive accuracy while being greatly simplified. So the model would be more interpretable and clinically applicable (Figure 6(a)). In the validation cohort, the four-gene model achieved an AUC of 0.810 (95% CI: 0.602–1.000), slightly lower than that of the seven-gene model (AUC = 0.880, 95% CI: 0.721–1.000), but with substantial overlap in confidence intervals, suggesting no statistically significant difference in discriminative ability (Figure 6(b)).

Nomogram-based four-gene predictive model and its validation. (a) ROC curve in the training cohort. The four-gene model using SPRED1, HDAC3, NSRP1, and DUSP1 exhibited excellent discriminative ability in the training cohort. (b) ROC curve in the validation cohort. The four-gene model exhibited stable prediction performance in an independent validation cohort. (c) Four-gene nomogram combining SPRED1, HDAC3, NSRP1, and DUSP1. A total score could be derived according to the expression of the four genes and used to predict the probability of obtaining a significant therapeutic response. (d) Calibration curve. x-axis: predicted probabilities; y-axis: observed probabilities. The calibration curve was very close to the ideal 45° line. (e) DCA patient distribution plot. The x-axis represented the number of patients classified as high-risk in different threshold probabilities and the y-axis represented the actual clinical benefit. (f) DCA demonstrated that, in the threshold probability range of 0.1–0.6, the four-gene model could achieve a significantly higher net benefit compared with “treat-all” or “treat-none”, which might be clinically applied to treat patients with decision-making.
To further explain why model performance remained stable after reducing the feature set from seven to four genes, we examined the correlation structure among the seven candidate genes based on paired post–pre expression changes. Pearson correlation analysis revealed moderate to strong positive correlations among most gene pairs, indicating partial redundancy in treatment-induced expression changes (Figure S2). This correlated structure suggests that the four-gene subset retained the dominant discriminatory information while reducing overlapping features, which is consistent with the principles of regularized feature selection methods such as LASSO and SVM-RFE.
Additional internal validation analyses were performed in the training cohort to validate the reliability of the four-gene predictive model constructed by SPRED1, HDAC3, NSRP1, and DUSP1. The cross-validation results showed that the four-gene model achieved repeatedly high discriminative ability in resampling validation (AUC was stably high, as shown in Figure 6(c)). And the four-gene model exhibited good agreement between the predicted probabilities and observed outcomes in the training cohort through 1000-time bootstrap resampling calibration analysis almost overlapped with the ideal 45° line (Figure 6(d)). Meanwhile, permutation testing demonstrated that the predictive performance of the four-gene model was significantly better than that of randomly permuted models (p < 0.01), which suggested that the discriminative capacity of the four-gene model reflected the real molecular differences rather than the random variation (Figure 6(e)). Finally, bias correction based on bootstrap-based .632+ method demonstrated that the four-gene model exhibited a high AUC and stable performance after bias correction, which suggested that the four-gene model possessed reliable generalization ability even in small sample situation (Figure 6(f)). All these internal validation results demonstrated that the four-gene model exhibited reliable clinical application performance in predicting therapeutic response to WNA in KOA patients.
Consensus clustering of post-treatment samples and identification of ACEcluster subtypes
In addition, in these 24 post-treatment samples from matched WNA responders, we also conducted the unsupervised consensus clustering according to the expression profiles of the 50 DE-ACG. When the cluster number varied from 2 to 9, if the CDF curve reached the plateau when K = 2, and the delta area curve reached the largest increase from K = 2 to K = 3 and the increase gradually decreased when K ≥ 4, it indicated that K = 2 was the most stable and reasonable cluster number (Figure 7(a) and (b)). Meanwhile, the consensus matrix also supported the conclusion that K = 2 was the most stable cluster number: when K = 2, there were two clear and internally consistent clusters; when K = 3, the third cluster boundary was unclear and the cluster less stable (Figure 7(c) and (d)). After defining these two subtypes, we also used heatmap and boxplot to visualize the molecular phenotypes of ACEcluster A and ACEcluster B, and found that there were systematic expression differences of genes at multiple loci (Figure 7(e) and (f)). PCA also validated the robustness of this classification: ACEcluster A and ACEcluster B were two clearly separated groups located in the first two principal component dimensions (Figure 7(g)).
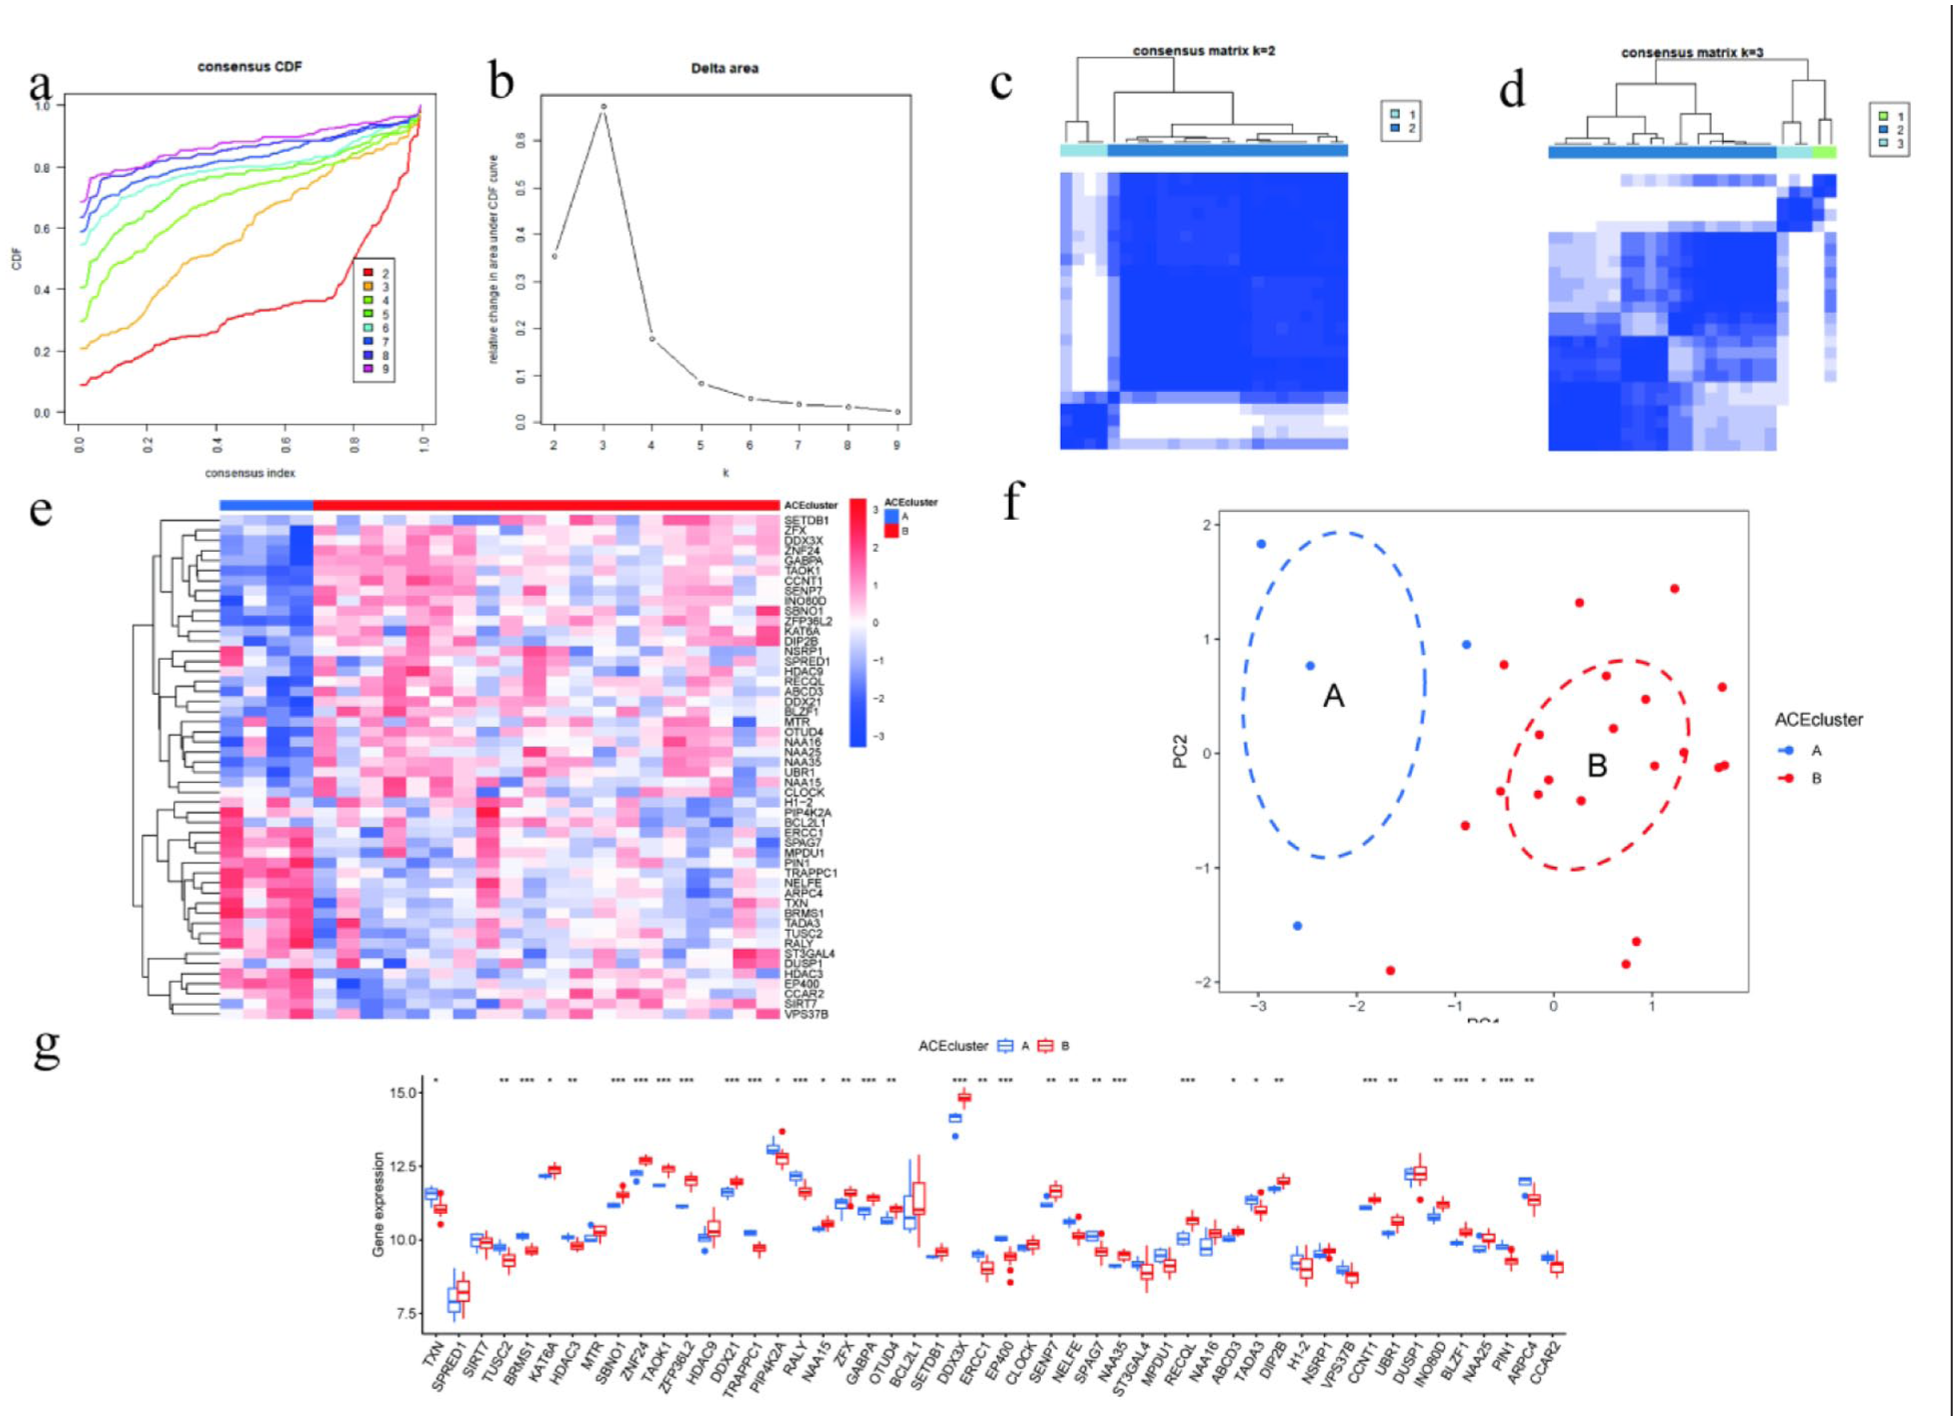
ACEcluster classification and differential characteristics of post-treatment samples. (a, b) Cumulative distribution function (CDF) curve (left) and delta area curve (right) from consensus clustering, indicating that K = 2 represents the optimal number of clusters. (c, d) Consensus matrix heatmaps showing clustering stability for K = 2 and K = 3; clear inter-cluster boundaries are observed at K = 2, whereas stability decreases at K = 3. (e, g) Heatmap and boxplots of 50 acetylation-related genes illustrating systematic expression differences between ACEcluster A and ACEcluster B subtypes. (f) Principal component analysis (PCA) plot showing distinct separation of ACEcluster A and ACEcluster B in the first two principal component dimensions, confirming the stability and biological validity of the two-subtype classification.
Collectively, these findings demonstrate that in post-treatment samples from WNA responders, acetylation-related transcriptional profiles can be stably categorized into two distinct molecular subtypes, providing a reliable molecular basis for subsequent analyses of immune characteristics and clinical correlations.
Association between key acetylation-related genes and immune infiltration characteristics
In the post-treatment samples, we first analyzed the correlations between the 50 key acetylation-related genes and 19 immune cell infiltration signatures. The results showed that most genes were significantly positively correlated with immune cell types such as activated CD8⁺ T cells, macrophages, and plasmacytoid dendritic cells, whereas some genes (e.g., HDAC3, ZNF24) exhibited negative correlations with regulatory T cells and γδ T cells. Two-way hierarchical clustering identified two major functional modules, one strongly enriched for effector T cells and antigen-presenting cells, representing an immune-activation module, and the other strongly correlated with immunosuppressive cell populations (indicating that key events of acetylation may regulate the immune infiltration pattern affecting WNA’s therapeutic effects) (Figure 8(a)). According to the consensus clustering–derived subtypes, we further explored the differences of immune infiltration in ACEcluster A and ACEcluster B. The results indicated that ACEcluster B exhibited significantly higher infiltration levels of activated B cells, γδ T cells, and immature dendritic cells compared to ACEcluster A, while other immune cell types showed consistent but non-significant trends toward higher activation in subtype B. These results indicated that ACEcluster B might represent a more immunologically active microenvironment, and post-treatment molecular subtypes were significantly associated with immune functional states (Figure 8(b)).
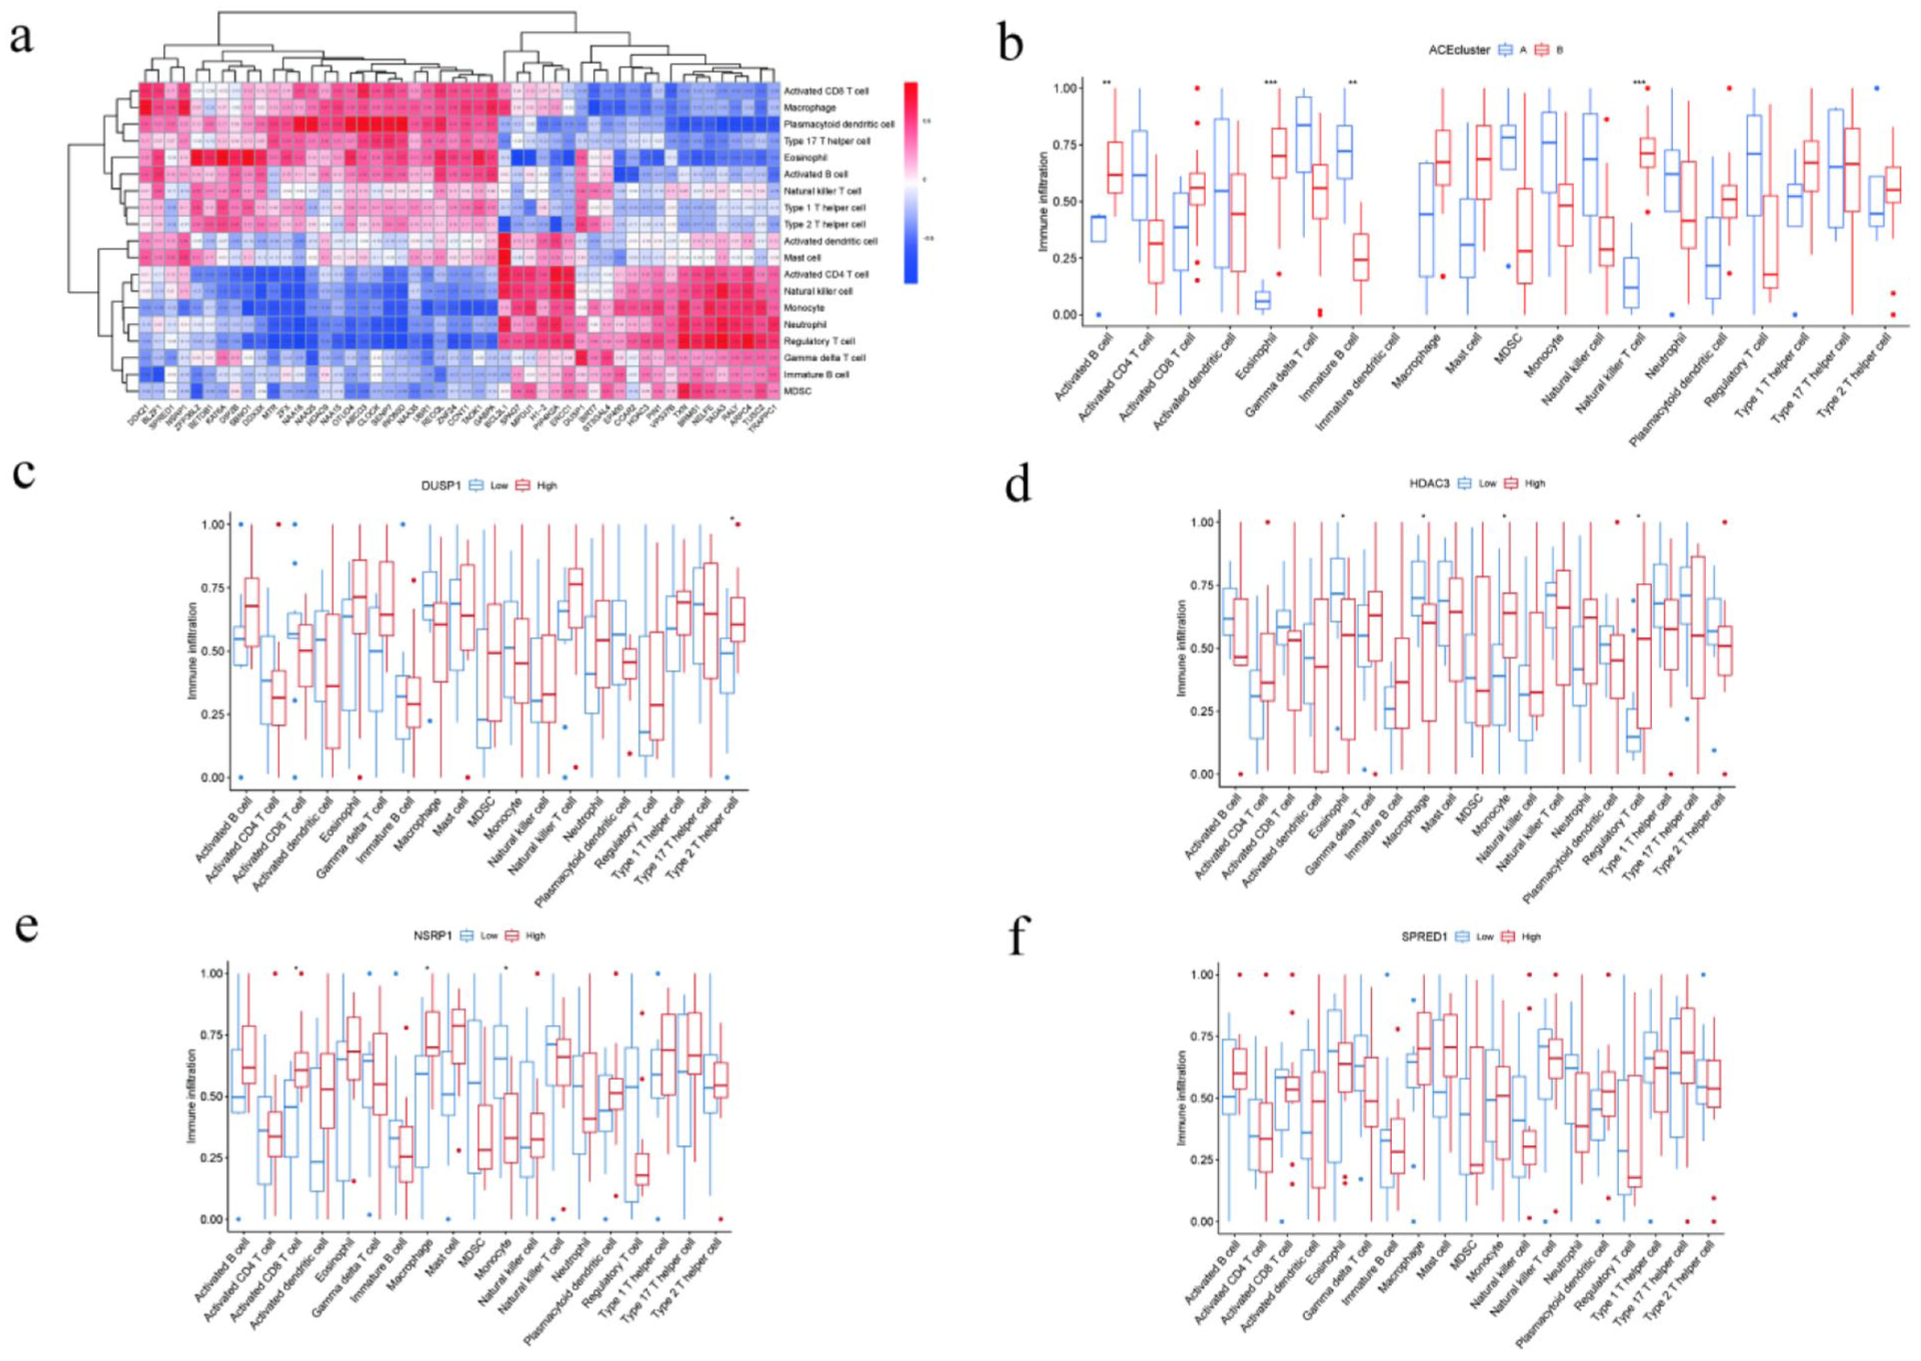
Correlation analysis between key acetylation-related genes and immune cell infiltration. (a) Gene–immune cell correlation heatmap: Spearman correlation matrix showing relationships between 50 key acetylation-related genes and 19 immune cell types. Colors range from red (positive correlation) to blue (negative correlation); numerical values within each cell represent the correlation coefficient (r). (b) Immune infiltration differences based on ACEcluster subtypes: Comparison of infiltration levels of 19 immune cell types between ACEcluster A (blue) and ACEcluster B (red). Statistically significant differences are marked with asterisks (*). (c–f) Associations between the four key genes (DUSP1, HDAC3, SPRED1, NSRP1) and immune infiltration: Samples were divided into high-expression (red) and low-expression (blue) groups for each gene, and infiltration levels of 19 immune cell types were compared accordingly.
We also explored the four core genes (DUSP1, HDAC3, SPRED1, and NSRP1). The expression levels of these four genes were significantly correlated with multiple types of immune cells. High expression levels of DUSP1 were significantly correlated with high infiltrations of type 2 helper T cells. High expression levels of HDAC3 were significantly correlated with high infiltrations of macrophages, mast cells, type 1 helper T cells and type 2 helper T cells. High expression levels of SPRED1 and NSRP1 were significantly correlated with high infiltrations of multiple types of immune cells (Figure 8(c)).
These results suggested that the key acetylation-related genes not only could be potential molecular biomarkers for predicting WNA efficacy but might also be involved in its therapeutic effect through modulating remodeling of peripheral immune microenvironment.
Functional enrichment and clustering analysis of highly correlated gene networks
In the expression matrix of 452 acetylation-related genes from the 24 paired samples in the training cohort, pairwise Pearson correlation coefficients were calculated for all genes to identify co-regulated networks. Using a threshold of |r| ≥ 0.95 and removing redundant pairs, approximately 107 highly correlated candidate genes were identified. Subsequently, these genes were intersected with the original gene set and used for downstream analyses. GO enrichment analysis revealed that these genes were significantly enriched in canonical epigenetic processes such as protein acetylation, histone modification, deacetylation, and related enzyme complexes (Figure 9(a)). At the BP level, enriched terms were mostly protein acetylation and histone modification; at the CC level, enriched categories were mostly acetyltransferase complex and histone deacetylase complex; and at the MF level, enrichment was mostly acetyltransferase activity and histone acetyltransferase activity. In addition, the enrichment significance, gene ratio, and gene counts were integrated into the GO chord plot. Hierarchical relationships among BP, MF, and CC were displayed, and acetylation–deacetylation regulation was found to play a central role (Figure 9(b)). These results indicated that in the WNA-responsive transcriptomic network, co-regulated genes were strongly enriched in acetylation–deacetylation regulation, which provided strong molecular evidence for epigenetic remodeling.
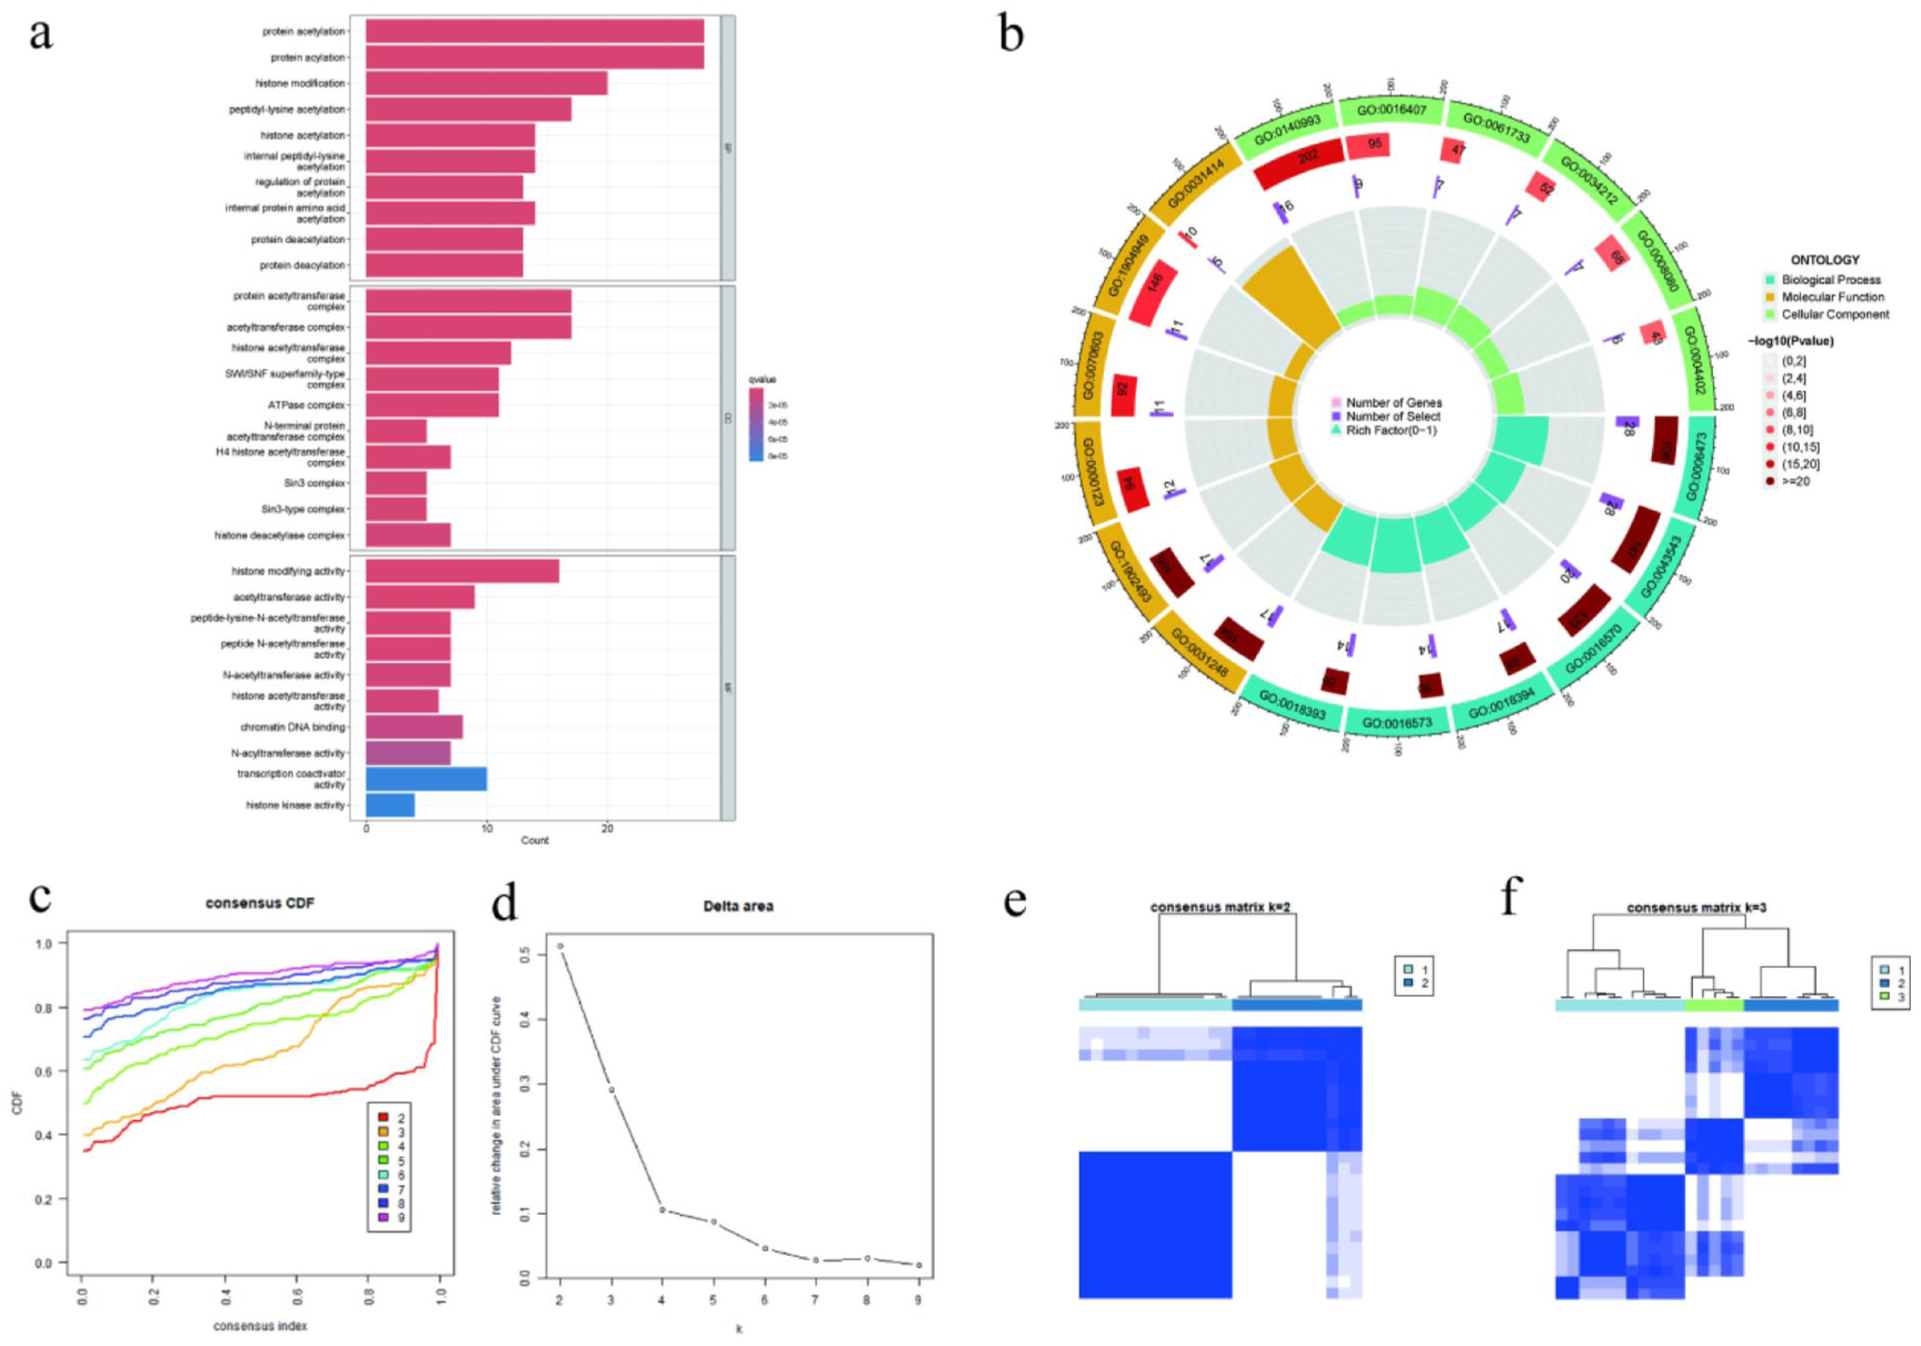
Functional enrichment and consensus clustering based on highly correlated gene pairs. (a) GO enrichment bar plot for significantly enriched terms of the 107 candidate genes in the three GO categories: BP, CC, and MF. (b) GO chord plot for enrichment significance, gene ratio, and gene count, visualizing that the candidate genes are mainly enriched in protein acetylation, histone modification, and their related enzyme complex pathways. (c–f) Results of consensus clustering: (c) consensus CDF curve, (d) delta area curve, (e) consensus matrix for K = 2, and (f) consensus matrix for K = 3. The results suggest that K = 2 is the optimal number of clusters and there are two stable molecular subtypes, that is, geneCluster A and geneCluster B.
We used ConsensusClusterPlus for unsupervised consensus clustering according to expression profiles of 107 candidate genes in 24 post-treatment samples. The CDF and delta area curves suggested the largest increase at K = 2 and marginal increase at K ≥ 3. The consensus matrix for K = 2 showed two relatively distinct and strongly coherent clusters, while at K = 3, the inter-cluster overlap increased and the coherence decreased (Figure 9(c)–(f)). Therefore, we set K = 2 as the optimal cluster number and named the two clusters as geneCluster A and geneCluster B, respectively. The two molecular subtypes showed high concordance with the subtype structure identified from differentially expressed genes (ACEcluster), which provided a reliable and stable reference framework for the subsequent pathway enrichment and immune infiltration analysis.
GeneCluster subtype characteristics and immunological comparison
Based on the gene-level consensus clustering results displayed above, we explored two stable molecular subtypes (geneCluster A and geneCluster B) in post-treatment samples using 107 highly correlated acetylation-related genes. The expression profile of the two molecular subtypes was clearly separated by the heatmap (Figure 10(a)). Interestingly, geneCluster B displayed markedly higher expression of several genes involved in acetylation and epigenetic modification processes, while geneCluster A exhibited relatively lower expression of these genes, suggesting that transcriptional acetylation was significantly different between the two subgroups. In addition, boxplot analyses of the representative top 50 genes also demonstrated the robustness of this molecular classification (Figure 10(c)). The two molecular subgroups exhibited significantly different expression of most representative genes.

Expression-based geneCluster subtypes and their immunological characteristics. (a) Heatmap of 107 candidate genes across 24 post-treatment samples. The blue–white–red gradient represents relative low–medium–high expression levels. The color bar at the top indicates geneCluster subtype assignment (A type: blue; B type: red). (b) Immune infiltration boxplots comparing 19 immune cell populations between the two subtypes. geneCluster B shows significantly higher infiltration levels of activated B cells, activated dendritic cells, macrophages, and type 1/type 2 helper T cells than geneCluster A. (c) Boxplots showing expression differences of 50 key acetylation-related genes between geneCluster A (blue) and geneCluster B (red). Asterisks above the boxes denote statistical significance (p < 0.05, p < 0.01, p < 0.001). (d–e) Comparison of ACEscores across subtypes. (d) ACEcluster A vs B; (e) geneCluster A vs B. In both analyses, subtype B exhibits significantly higher ACEscores, indicating greater acetylation activity and supporting the molecular distinction between subtypes.
At the immunological level, we estimated the infiltration levels of 19 immune cell types using ssGSEA. The results showed that geneCluster B samples had significantly higher infiltration of activated B cells, activated DCs, macrophages, and type 1/type 2 helper T cells compared with geneCluster A (Figure 10(b)). Notably, geneCluster B also had significantly higher infiltration of activated CD4⁺ T cells and natural killer cells (Figure 10(b)). These results suggested that geneCluster B was associated with higher infiltration of immunologically activated cells. Additionally, by integrating the ACEscore calculated from all 452 acetylation-related genes, we found that in both sample-level clustering system ACEcluster (gene-level clustering based on expression of all 452 acetylation-related genes; Figure 10(d) and gene-level clustering system geneCluster (Figure 10(e)), B subtypes showed significantly higher ACEscores (Wilcoxon test p = 0.01 and p = 0.023 for sample-level and gene-level, respectively; Figure 10(d) and (e)). The similar trend in two independent clustering systems suggested that the two subtypes could be distinguished by their ACEscores, that is, post-treatment patients formed a subtype with higher levels of acetylation activity.
In summary, geneCluster B displayed higher acetylation gene expression activity and stronger immune cell infiltration, which suggested that this subtype might be characterized as a high-response phenotype to WNA in KOA patients. This molecular stratification approach laid the basis for further mechanistic study and biomarker exploration for treatment responsiveness.
Discussion
In this study, taking advantage of prospective self-paired design and combining transcriptome sequencing with multilayered machine-learning analyses, we systematically identified the systemic remodeling of acetylation-related molecular networks in peripheral blood of KOA patients with a significant therapeutic response to WNA, and constructed an interpretable set of acetylation-related molecular features with potential predictive value, providing new epigenetic evidence for elucidating the molecular mechanisms underlying the therapeutic effects of WNA.
The rationale for focusing on acetylation-related molecular features was supported by both prior biological evidence and our paired transcriptomic data. Previous studies have demonstrated that warm-needle acupuncture can modulate metabolic–inflammatory signaling pathways closely linked to acetyl-CoA metabolism, a central substrate for protein acetylation. 26 Moreover, dysregulated protein acetylation and deacetylation have been implicated in multiple key pathogenic processes of knee osteoarthritis, including oxidative stress, inflammatory activation, chondrocyte senescence, and disease susceptibility.6,27–29 Consistent with these findings, our paired transcriptomic analysis identified a highly co-expressed gene module entirely composed of acetylation-related genes (107/107), showing an extremely non-random enrichment compared with the whole transcriptome background. This acetylation-related module further served as the molecular basis for downstream clustering, immune association analyses, and machine-learning modeling, supporting acetylation regulation as a central molecular layer underlying WNA-induced transcriptomic remodeling.
For the 24 strictly paired samples, the expression of acetylation-related genes presented a global pattern characterized by overall post-treatment upregulation. As shown in volcano plots, heatmaps, and paired boxplots, global gene set and the top 50 significantly altered genes presented significantly increased transcriptional levels of acetylation-related genes after treatment. Functional enrichment analysis indicated significantly enriched protein acetylation, acetyltransferase complex, and histone deacetylase complex, suggesting that WNA may regulate chromatin structure and transcriptional activity by altering the dynamic balance between acetylation and deacetylation.30,31 Meanwhile, further enrichment analysis using KEGG and DO analyses also suggested that these significantly enriched genes are involved in a large number of networks, which are widely distributed in epigenetic modification, cellular stress response, and signal regulation. Consistently, both genomic Circos plot and PPI network also revealed cross-chromosomal and cross-functional modular coordination, suggesting that WNA induces complex epigenetic regulation on peripheral blood in a system-wide pattern.
Machine-learning–based feature selection algorithm then identified core molecular features frequently associated with the therapeutic response to WNA. By applying two additional algorithms, LASSO and SVM-RFE, and conducting cross-validation within the training cohort, we obtained seven genes, including SETDB1, HDAC3, BLZF1, NSRP1, SPRED1, DUSP1, and SIRT7, which exhibited significantly different expression before and after treatment and possessed strong individual predictive capability, with AUC >0.80 achieved by SPRED1, HDAC3, NSRP1, and DUSP1. The multigene logistic regression model attained an AUC of 0.908 during internal cross-validation and an AUC of 0.880 in the independent validation cohort. The molecular classification framework exhibited strong stability and generalizability. Model interpretation via SHAP further demonstrated that SETDB1, HDAC3, NSRP1, and DUSP1 played the most important roles in prediction, which were consistent with their previous characterization involving acetylation regulation, inflammatory response, and cell survival. Altogether, our results advanced the biological plausibility and mechanistic relevance of the gene signature identified by machine-learning in mediating the therapeutic effects of WNA.
After excluding individual gene-level findings, we found that the consensus clustering analysis also unveiled molecular subtypes in patients after WNA treatment. With post-treatment samples as input, the best clustering stability was reached when K = 2, that is, two subtypes emerged, namely ACEcluster A and ACEcluster B. However, the 50 key genes showed distinct expression profiles between the two clusters, and the cluster B presented higher acetylation activity (ACEscore was up-regulated), suggesting that the clustering results represented a hierarchical remodeling of acetylation pathways induced by WNA treatment. Then, we performed the correlation analysis of the 452 acetylation-related genes. There were 107 highly co-expressed genes (|r| ≥ 0.95) and then a second classification system, geneCluster A/B, was established based on the gene modules. The two classification systems showed strong concordance with each other, suggesting that the subtyping results were stable. Further, immune infiltration analysis showed that both ACEcluster and geneCluster classifications were associated with the activation states of multiple immune cell populations. The heatmap of gene–immune correlation showed that there was an obvious positive correlation and negative correlation. That is to say, acetylation regulation presented a dynamic balance of positive and negative coordination, which suggested that the immune microenvironment was dynamically coordinated during the regulation of acetylation. All these results suggested that WNA may ameliorate the inflammatory environment in KOA by modulating immune remodeling via epigenetic acetylation regulation. 32
Although immune infiltration in the present study was inferred from bulk RNA-seq data, the observed positive association between acetylation activity (ACEscore) and immune infiltration is supported by existing mechanistic evidence. Previous studies have demonstrated that acetylation/deacetylation regulation, particularly involving HDAC3, can modulate the transcription of chemokines such as CXCL9/10/11 and thereby promote immune cell recruitment and immune microenvironment remodeling, providing biological plausibility for the acetylation–immune coupling observed in this study. 33 Moreover, microbial metabolites and short-chain fatty acids acting as endogenous HDAC inhibitors have been shown to broadly regulate innate and adaptive immune responses, further supporting a functional link between acetylation regulation and immune activation or infiltration.34,35
Mechanistically, the four core genes identified in this study may participate in acetylation–immune regulation at distinct regulatory layers. HDAC3 functions as an upstream epigenetic regulator linking acetylation to immune gene transcription,36,37 whereas SPRED1 and DUSP1 mainly act at the signaling execution and negative feedback levels of inflammatory responses, respectively,38–40 and NSRP1 may contribute to post-transcriptional stability through alternative splicing regulation. 41 These layered functional roles are supported by previous experimental studies and provide biological plausibility for the acetylation-related molecular signature identified here.
Notably, all four core molecules identified by machine learning, that is, SPRED1, HDAC3, NSRP1 and DUSP1, were also highly validated in the training and validation cohorts. Next, we integrated these four genes into a multivariable logistic regression–based nomogram model. The nomogram model showed excellent discriminative ability and good calibration in both internal bootstrap validation and the independent external validation set. In addition, DCA and CIC revealed that the model constantly gained a net clinical benefit over all threshold probabilities compared with the treat-all or treat-none strategies. 42 Finally, the nomogram visualization converted the molecular signature into a clinically interpretable model and provided a practical strategy to assess individual efficacy. In summary, this predictive model not only verified the biological relevance of the four candidate genes but also provided a methodologic basis to construct epigenetic biomarker–based predictive models to guide individualized WNA therapy in KOA patients.
Taken together, the integration of differential expression analysis, functional enrichment, interaction network mapping, and machine-learning interpretation emphasizes the key role of acetylation in regulating the therapeutic efficacy of WNA. The strong systemic correlation between acetylation gene modules and activation of immune cells further implies that WNA may ameliorate the chronic inflammatory microenvironment of KOA through a cascade sequence of epigenetic modification, chromatin accessibility and immune activation.43–45 The consistent expression of key genes like SPRED1 and HDAC3 also further validated the pivotal role of the acetylation–immune coupling axis in the molecular response to WNA. Our findings provide not only more mechanistic insights into the epigenetic mechanism underlying the therapeutic efficacy of WNA but also offer more valuable molecular targets for the future functional validation and pharmacological intervention studies.
Methodologically, we used a prospective self-paired design and paired cross-validation to reduce interindividual variability and batch effects to a certain extent and cross-validated the dual-layer clustering framework (ACEcluster and geneCluster) for subtype identification. LASSO and SVM-RFE algorithms could simultaneously achieve feature compression and optimal subset selection, and the nomogram model could convert complicated statistical models into an easily understood clinical application. The multigene model developed based on peripheral blood RNA exhibited strong discriminative performance in the internal and external validation cohorts and offered a feasible solution for precision stratification and individualized prediction of WNA efficacy. However, the clinical utility of our findings should be further evaluated in larger multicenter cohorts and by experimental validation. Limitations: The sample size was limited and the external validation cohort was modest. The confidence intervals were wide. Transcriptomic associations detected in our study represented statistical associations instead of causal relations. The immune infiltration profiles were algorithmically inferred and needed to be validated by flow cytometry or single-cell omics approaches.
Future work should be extended with larger cohorts from multiple centers, including longitudinal follow-up, and integrating proteomic, acetylomic, and functional assays (e.g., HDAC3 knockdown or SPRED1 overexpression experiments) to reveal the mechanistic basis of WNA-induced molecular remodeling. In addition, the predictive and prognostic values of the constructed subtypes and models for long-term treatment outcomes and relapse sensitivity should also be investigated. Furthermore, predicting the therapeutic response to WNA or the assignment of acetylation-related molecular subtypes based on pretreatment peripheral blood transcriptomic features holds important translational potential and warrants further systematic investigation in future studies. Our analyses of the extensive remodeling of the acetylation-related transcriptomic network in the peripheral blood of KOA patients following WNA revealed the acetylation–immune coupling axis as a potential underlying mechanistic pathway.26,46 The seven-gene signature and four-gene predictive model showed consistent performance in different datasets, providing new molecular evidence and translational foundation to explore the epigenetic and mechanistic mechanisms of therapeutic efficacy of WNA in KOA.
In sum, WNA substantially modulates the peripheral blood acetylation-related gene expression profile in KOA patients with a reconstructed epigenetic network focused on acetylation/deacetylation complexes. The enhanced acetylation activity was positively correlated with the degree of immune cell infiltration. The four-gene nomogram model exhibited strong discriminative performance and clinical interpretability in an independent validation cohort as well as providing new insights into the molecular mechanisms and individualized prediction of therapeutic effects of WNA.
Supplemental Material
sj-docx-1-mpx-10.1177_17448069261439615 – Supplemental material for Identification of acetylation-related molecular signatures in knee osteoarthritis patients with significant response to warm-needle acupuncture using machine-learning approaches
Supplemental material, sj-docx-1-mpx-10.1177_17448069261439615 for Identification of acetylation-related molecular signatures in knee osteoarthritis patients with significant response to warm-needle acupuncture using machine-learning approaches by Jiqing Wang, Bo Xu, Da-Eun Yoon, Shifen Xu, Shangjun Xia, Junjie Xu, Xiaoqin Fang, Haiyi Wu, Younbyoung Chae and Yiqun Mi in Molecular Pain
Footnotes
Author contributions
J.W. contributed to writing the manuscript and clinical study implementation. B.X. performed data analysis and contributed to writing the manuscript. D.-E.Y. was responsible for quality control. S.-F.X. provided methodological guidance. S.-J.X., J.-J.X., X.-Q.F., and H.-Y.W. participated in clinical study implementation. Y.C. supervised data quality and experimental procedures. Y.-Q.M. provided overall research supervision and project guidance.
Declaration of conflicting interests
The authors declared no potential conflicts of interest with respect to the research, authorship, and/or publication of this article.
Funding
The authors disclosed receipt of the following financial support for the research, authorship, and/or publication of this article: This work was supported by the Shanghai Key Discipline Construction Project of Traditional Chinese Medicine (Clinical Category, Grant No. shzyyzdxk-2024108); the Three-Year Action Plan for the Inheritance and Innovation of Traditional Chinese Medicine in Shanghai (Grant No. ZY(2025-2027)-3-2-1); the Project of Minhang District Health Commission (Grant No. 2024MW01); and the National Natural Science Foundation of China (General Program, Grant No. 82474619).
Supplemental material
Supplemental material for this article is available online.
References
Supplementary Material
Please find the following supplemental material available below.
For Open Access articles published under a Creative Commons License, all supplemental material carries the same license as the article it is associated with.
For non-Open Access articles published, all supplemental material carries a non-exclusive license, and permission requests for re-use of supplemental material or any part of supplemental material shall be sent directly to the copyright owner as specified in the copyright notice associated with the article.