
Abstract
Pain sensitivity is a significant factor in knee osteoarthritis (KOA), influencing patient outcomes and complicating treatment. Genetic differences, particularly in pain-sensing genes (PSRGs), are known to contribute to the variability in pain experiences among KOA patients. This study aims to systematically analyze PSRGs in KOA to better understand their role and potential as therapeutic targets. We utilized bulk RNA-seq data from the GSE114007 and GSE169077 datasets to identify differentially expressed genes, with 20 genes found to be significantly altered. Key PSRGs, including PENK, NGF, HOXD1, and TRPA1, were identified using LASSO, SVM, and random forest algorithms. Further, KEGG and GO enrichment analyses revealed pathways such as “Neuroactive ligand-receptor interaction” and “ECM-receptor interaction,” which were validated through external datasets. Single-cell RNA-seq analysis from GSE152805, GSE133449, and GSE104782 datasets demonstrated the heterogeneity and dynamic expression of PSRGs across different cell subpopulations in synovium, meniscus, and cartilage samples. UMAP and pseudotime analyses were used to visualize spatial distribution and developmental trajectories of these genes. The findings emphasize the critical roles of PSRGs in KOA, highlighting their potential as therapeutic targets and suggesting that integrating genetic information into clinical practice could significantly improve pain management and treatment strategies for KOA.
Introduction
Pain sensory is a crucial aspect of knee osteoarthritis (KOA) symptoms, significantly influencing clinical outcomes. The variability in pain experience among KOA patients is often due to differences in pain sensitivity, which can result in high pain levels even in patients with low radiographic evidence of KOA.1,2 This discrepancy complicates the management and assessment of pain in clinical settings, where pain severity does not always correlate with structural damage observed through imaging techniques. 3
Clinical guidelines 4 emphasize the importance of pain management in OA treatment, underscoring that effective pain control is essential for improving patient quality of life and functional outcomes. The multifaceted nature of OA pain, involving both peripheral and central sensitization mechanisms, necessitates a comprehensive approach to pain management that includes pharmacological and non-pharmacological strategies. 5 The primary treatments for knee OA, such as nonsteroidal anti-inflammatory drugs (NSAIDs), corticosteroid injections, and physical therapy, are all aimed at managing pain. 6
Pain sensory in KOA is significantly influenced by genetic factors, which contribute to the variability of pain sensitivity among individuals. Genetic variations, particularly in genes involved in inflammatory pathways and pain modulation, play a critical role in determining the severity of pain experienced by OA patients. For instance, polymorphisms in genes such as GDF5, IL-1β, and COX-2 have been linked to increased inflammatory responses and pain sensory in OA patients. 7 Genome-wide association studies (GWAS) have further elucidated the genetic underpinnings of OA pain. Specific single nucleotide polymorphisms (SNPs) in genes like TRPV1, which is associated with pain sensitivity, have been shown to correlate with symptomatic knee OA. 8 This indicates that individuals with certain genetic profiles may experience more intense pain despite similar levels of joint damage observed in radiographic images. 9
These insights into the genetic factors affecting pain sensory in knee OA highlight the importance of integrating genetic information into clinical practice. Personalized medicine approaches, which consider an individual’s genetic makeup, could enhance the effectiveness of pain management and provide more targeted therapeutic options for those suffering from knee osteoarthritis.
In summary, pain sensory is an indispensable aspect of KOA. Genetic research on pain sensory has the potential to significantly improve OA treatment. However, there is currently a lack of systematic studies on the role of these genes in OA, particularly regarding their distribution across different cell types or tissues. Therefore, we believe that an in-depth analysis of pain sensory genes is necessary to advance our understanding and treatment of KOA.
Material and methods
Data sources
We first obtained a dataset of pain-sensing genes (PSRGs) from the Molecular Signatures Database (MSigDB), which included a total of 95 genes (https://www.gsea-msigdb.org/gsea/msigdb/mouse/geneset/GOBP_SENSORY_PERCEPTION_OF_PAIN.html). These genes were then converted from mouse to human homologs. Additionally, we retrieved the GSE114007 dataset from the Gene Expression Omnibus (GEO) database for bulk RNA-seq data analysis and used the GSE169077 dataset for external validation. For single-cell RNA-seq analysis, we utilized the GSE152805, GSE133449, and GSE104782 datasets to investigate the expression and roles of PSRGs in the synovium, meniscus, and cartilage, respectively, during the progression of osteoarthritis (OA).
Transcriptome data analysis
Differential gene expression analysis
We analyzed the GSE114007 dataset, which includes 20 cartilage samples from OA patients and 18 control samples. Differential expression analysis was performed using the R package tidyverse (version 1.3.1) to extract PSRGs, and the R package pheatmap (version 1.0.12) was employed to visualize the expression levels of these genes. Genes with a p-value <0.05 were considered differentially expressed.
Selection of PSRGs
To identify the most important PSRGs, we employed LASSO, Support Vector Machine-Recursive Feature Elimination (SVM-RFE), and random forest algorithms. The LASSO analysis was conducted using the R package glmnet (version 4.1-2). We used 10-fold cross-validation to select the optimal regularization parameter (lambda, λ), which minimized binomial deviance for gene selection. We used 10-fold cross-validation to select the optimal regularization parameter (lambda, λ), which minimized binomial deviance for gene selection. The SVM-RFE analysis, performed using the R package e1071 (version 1.7-9), involved recursively eliminating features based on their importance until the model reached the lowest root mean square error (RMSE). For Random Forest analysis, conducted with the R package randomForest (version 4.6-14), we ranked features by mean decrease in Gini impurity. The results from these methods were intersected using a Venn diagram created with the R package VennDiagram (version 1.6.20) to determine the key PSRGs.
Distinguishing expression patterns of PSRGs
Samples were divided into low and high expression groups based on the median expression levels of the selected PSRGs. A gene expression scoring system was implemented by calculating the average expression levels of the eight selected PSRGs for each sample, assigning a composite score that reflects the overall expression activity of these genes. This scoring method allowed us to group the samples into high and low expression groups based on their composite scores relative to the median value. Principal component analysis (PCA) was performed using the R package FactoMineR (version 2.4) and visualized with the factoextra package (version 1.0.7). Heatmap visualization was conducted using the R package pheatmap (version 1.0.12) to assess the distinct expression patterns of PSRGs between the groups. Additionally, we used the R package clusterProfiler (version 3.18.1) to perform KEGG pathway and GO term enrichment analyses.
External sample validation
To validate the PSRG expression patterns, we analyzed the GSE169077 dataset, which includes 7 cartilage samples from OA patients and 5 control samples. Similar to the previous analyses, we observed the differential expression of key PSRGs using boxplots created with the R package ggplot2 (version 3.3.3), heatmaps with pheatmap (version 1.0.12), and PCA with FactoMineR (version 2.4) and factoextra (version 1.0.7). KEGG pathway and GO term enrichment analyses were also performed on these samples using clusterProfiler (version 3.18.1) to corroborate the findings.
Single-cell RNA sequencing data processing
Cell clustering and feature gene selection
Single-cell RNA sequencing (scRNA-seq) data were processed using the Seurat (version 4.0.3) pipeline. Initial quality control steps included filtering cells with high mitochondrial gene content (>10%) and low gene count (<200 genes per cell). Normalization and scaling of the data were performed, followed by the identification of highly variable genes across cells.
We utilized feature genes to perform cell clustering. Feature genes were selected based on their variability and biological relevance to the dataset originated articles.10–13 Principal component analysis (PCA) was then conducted, and the top principal components were used for downstream clustering analysis using the Louvain method implemented in Seurat.
UMAP visualization
To visualize the high-dimensional scRNA-seq data, we applied Uniform Manifold Approximation and Projection (UMAP). UMAP was implemented using the umap-learn (version 0.5.1) package, with default parameters unless otherwise specified. The resulting UMAP plots allowed us to observe the distinct clustering of cell populations based on their transcriptomic profiles.
Pseudotime trajectory inference
Pseudotime trajectory analysis was performed to study the dynamic changes in gene expression along the differentiation pathway of identified cell subpopulations. Using the Monocle 3 (version 1.0.0) package, cells were ordered along a pseudotime axis representing their progression through cell development. The trajectory was visualized, and branch points were identified to reveal divergent cellular fates.
Visualization of gene expression
Violin plots
To examine the expression of PSRGs across different cell subpopulations, we generated violin plots. Violin plots were created using the Seurat (version 4.0.3) package, displaying the distribution of gene expression levels within each identified cluster. These plots provide insights into the variability and relative abundance of gene expression within and across clusters.
UMAP gene expression overlay
The expression of PSRGs was also visualized on the UMAP plots. Each cell was colored according to its expression level of the target gene, allowing us to spatially observe the distribution of gene expression within the UMAP embedding. This visualization was conducted using the Seurat (version 4.0.3) package.
Pseudotime gene expression analysis
We investigated the expression dynamics of PSRGs along the pseudotime trajectory. The expression levels of these genes were plotted against pseudotime to identify trends and potential regulatory patterns during OA development. This analysis was performed using the Monocle 3 (version 1.0.0) package, providing a temporal context to the gene expression changes.
Data and code availability
The processed data and analysis scripts used in this study are available upon request from the corresponding author.
Results
Differences in pain sensory related genes (PSRGs) expression between OA and normal samples identified by bulk transcriptomic data
Through the analysis of the GSE114007 dataset, we observed a total of 20 genes exhibiting significant differential expression (Figure 1(a)). Among these, genes such as TNF and CXCL12 were significantly upregulated in the cartilage samples from OA patients, while genes like HOXD1 and ACPP showed a marked decrease in expression levels (Figure 1(b)). The complete list of differentially expressed genes includes TNF, OPRL1, CALCA, CXCR4, ACPP, ANO1, GPR171, CXCL12, GRIN2D, CDK5, PTGES, AQP1, TRPA1, MME, HOXD1, GRIN2A, OPRK1, GRM3, NGF, and PENK. To identify the key PSRGs in OA, we employed three different machine learning methods: LASSO, Support Vector Machine-Recursive Feature Elimination (SVM-RFE), and Random Forest. These methods allowed us to rank and select the most significant genes contributing to OA progression. LASSO regression highlighted several key genes significantly associated with OA by identifying the optimal lambda (λ) based on the minimum binomial deviance (Figure 1(c)). SVM-RFE was used to recursively eliminate features, with the model showing the lowest root mean square error (RMSE) when 15 variables were selected, indicating the optimal number of genes for OA classification (Figure 1(f)). Random Forest ranked the importance of each gene based on the mean decrease in Gini impurity, with genes such as TNF, OPRL1, CALCA, and CXCR4 identified as the most significant (Figure 1(e)). The error rate plot showed a stable error rate as the number of trees increased, indicating robust feature selection (Figure 1(d)). The intersection of the results (including PENK, NGF, HOXD1, MME, GRM3, CDK5, TRPA1 and OPRK1) from LASSO, SVM-RFE, and Random Forest methods identified the most critical PSRGs in OA, which are visualized in Figure 1(g). Identifying key pain sensory genes in bulk RNA-seq data (a) Volcano plot illustrating the differential expression of genes in the GSE114007 dataset. Red points indicate upregulated genes, blue points indicate downregulated genes, and grey points indicate non-significant genes. (b) Heatmap showing the expression levels of significantly altered genes between OA patients and control samples. Genes such as TNF, OPRL1, NGF, and PENK are listed, with TNF and CXCL12 being upregulated, while HOXD1 and ACPP are downregulated in OA samples. (c) LASSO regression plot showing the binomial deviance as a function of log(λ). (d) Random Forest error rate plot showing the relationship between the number of trees and the error rate. (e) Random Forest feature importance plot ranking the genes based on the mean decrease in Gini impurity. (f) SVM-RFE plot illustrating the root mean square error (RMSE) from cross-validation against the number of variables. (g) Intersection of key pain-sensing genes identified by LASSO, SVM-RFE, and Random Forest methods.
Expression patterns of PSRGs distinguish different types of cartilage samples
Based on the expression profiles of eight key PSRGs, we conducted PCA and differential gene expression clustering to distinguish between high and low PSRG expression samples in GSE114007 dataset. PCA showed a clear separation between the two groups, indicating distinct transcriptomic signatures associated with PSRG expression levels (Figure 2(a)). The heatmap of differential gene expression highlighted significant differences in gene expression patterns between high and low PSRG expression samples (Figure 2(b)). KEGG pathway enrichment analysis revealed several pathways significantly associated with the differentially expressed genes, including “Neuroactive ligand-receptor interaction,” “Cell adhesion molecules,” “ECM-receptor interaction,” and “Rheumatoid arthritis” (Figure 2(c)). GO enrichment analysis identified numerous biological processes, cellular components, and molecular functions that were enriched among the differentially expressed genes, such as “intermediate filament organization,” “sodium ion transmembrane transport,” and “synapse organization” (Figure 2(d)). Analysis of PSRGs expression pattern in cartilage samples. (a) PCA plot showing the separation between high and low PSRG expression samples. Dim1 accounts for 46.8% of the variance, and Dim2 accounts for 13% of the variance. (b) Heatmap of differential gene expression between high and low PSRG expression samples. The clusters illustrate significant differences in gene expression patterns. (c) KEGG pathway enrichment analysis of differentially expressed genes, highlighting key pathways such as “Neuroactive ligand-receptor interaction” and “Rheumatoid arthritis.” (d) GO enrichment analysis showing significant biological processes, cellular components, and molecular functions, including “intermediate filament organization” and “sodium ion transmembrane transport.”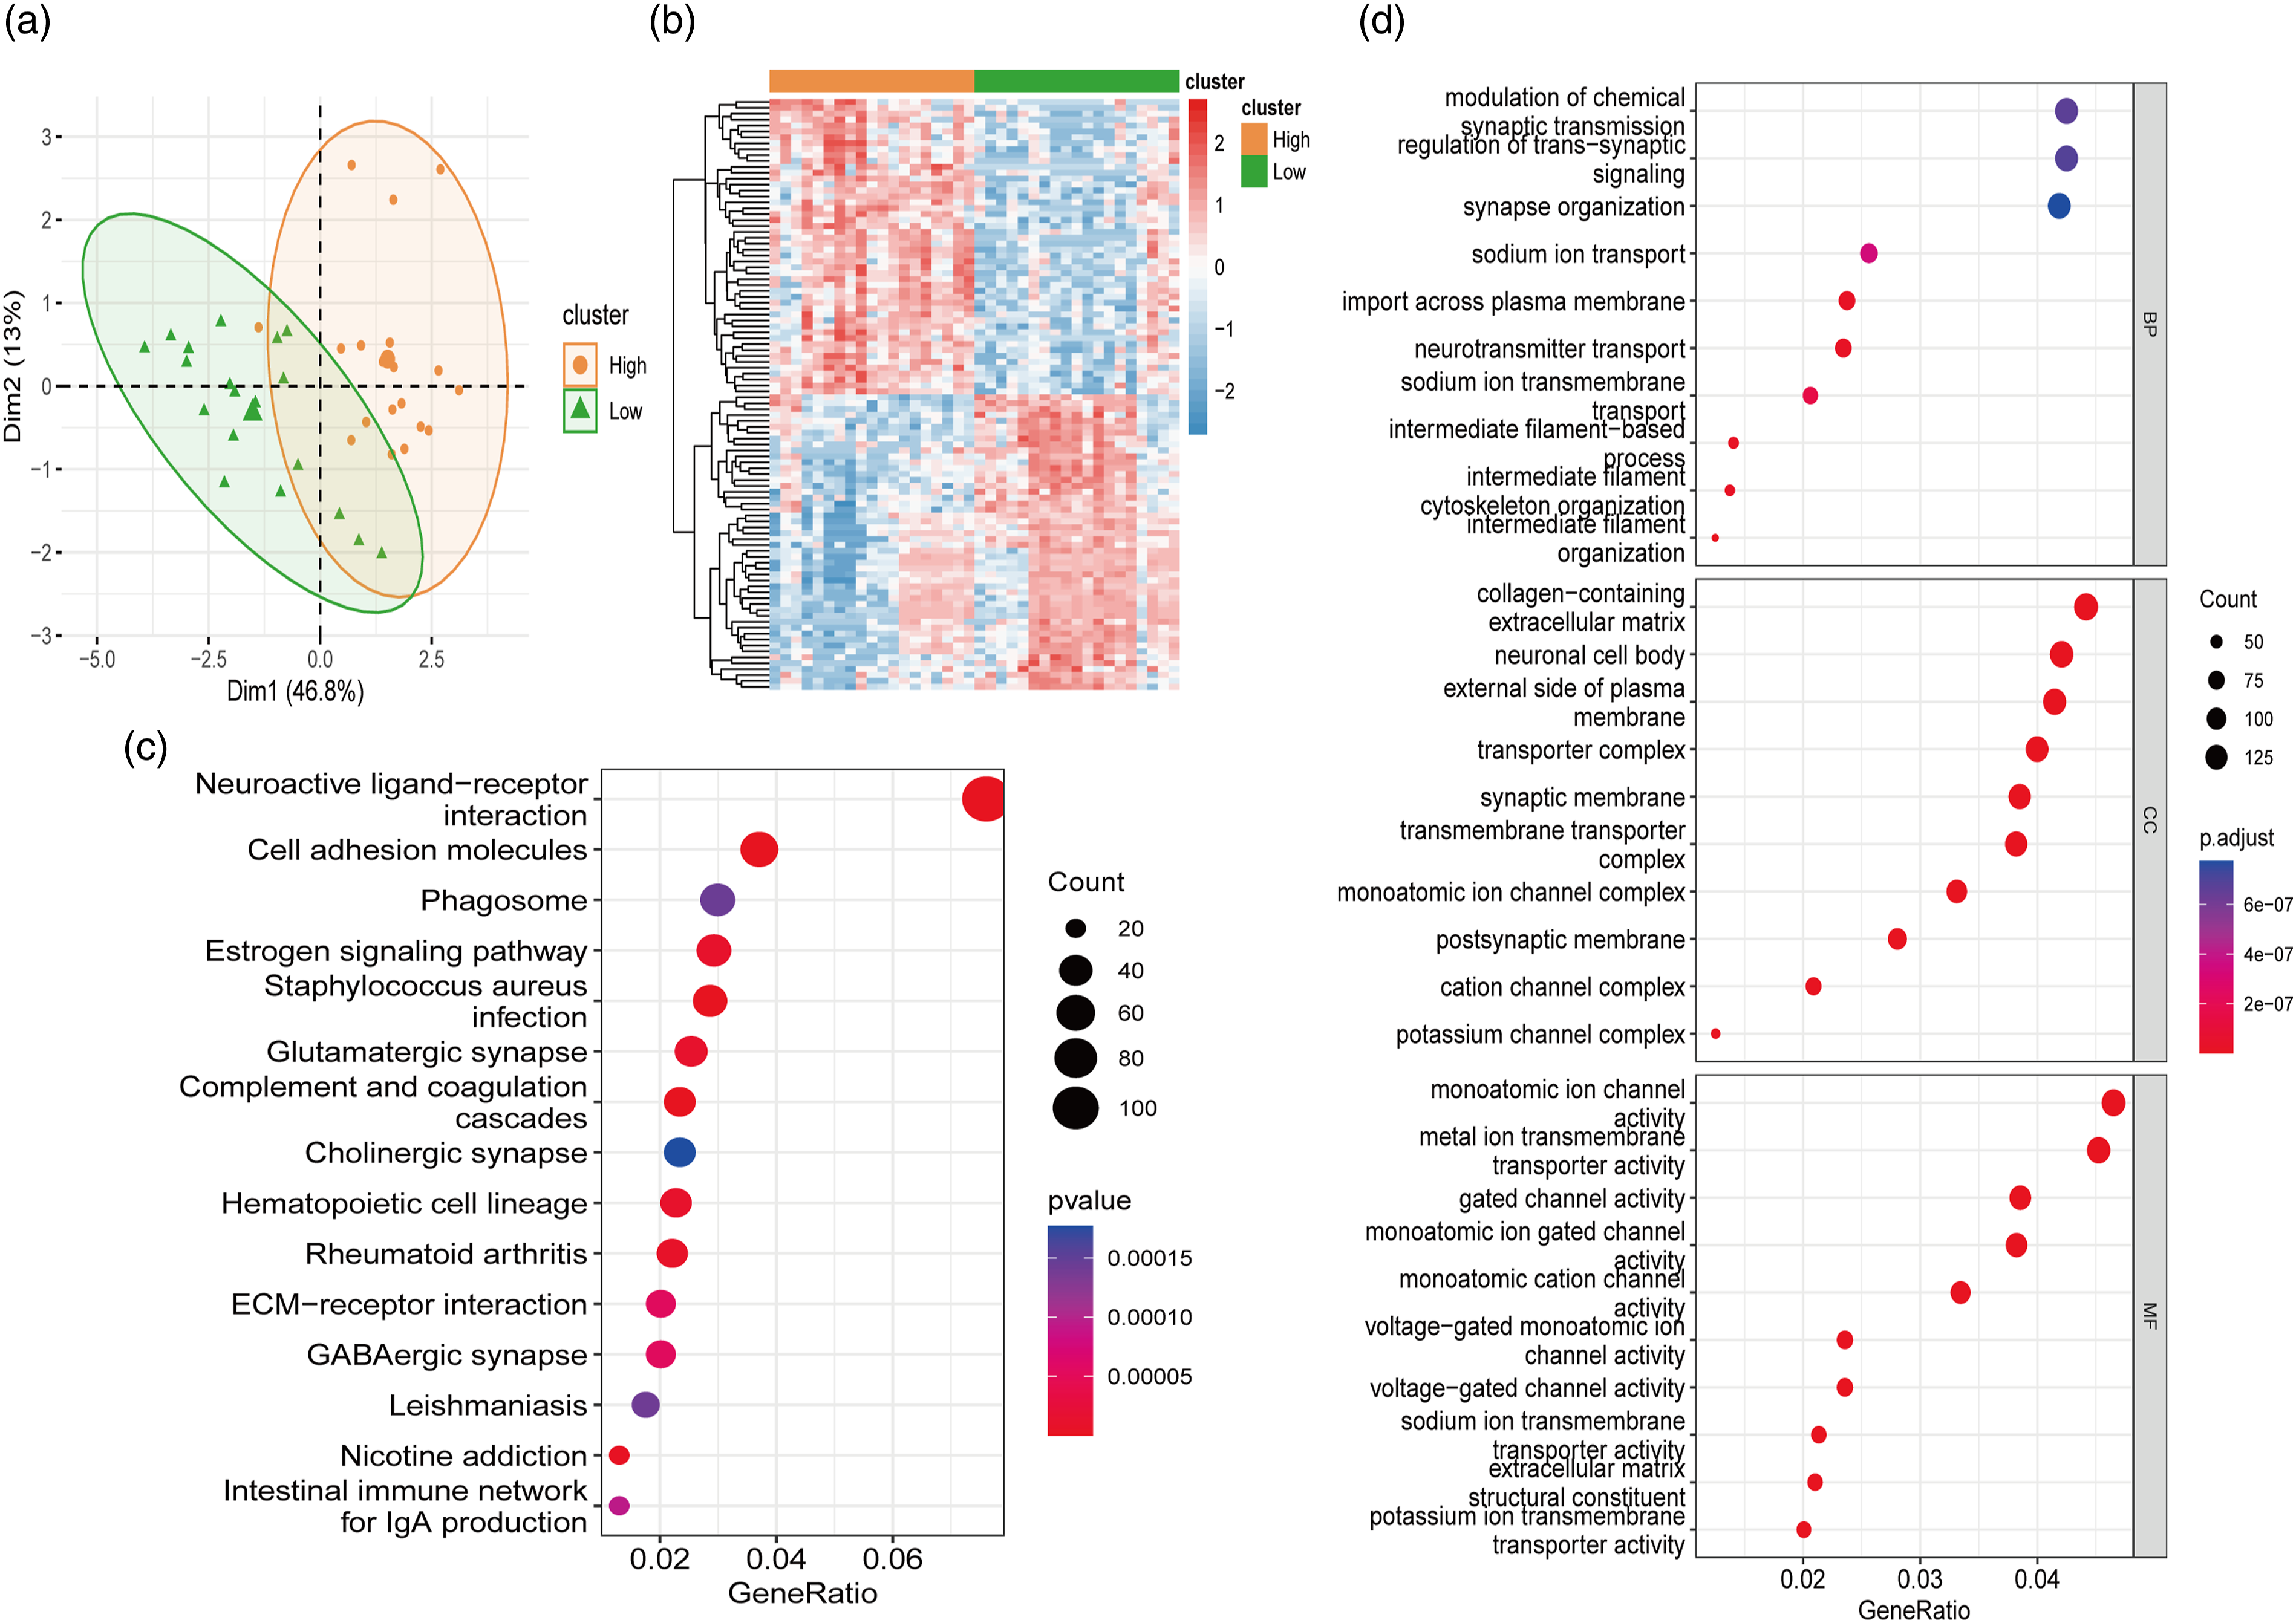
External validation of PSRGs expression patterns
To further validate the differential expression and discriminative power of PSRGs between OA and normal samples, we utilized the GSE169077 dataset for external validation. The boxplot analysis indicated that PSRGs were generally higher in OA samples compared to normal samples, with NGF and PENK showing significant differences (Figure 3(a)). Based on the expression profiles of the eight key PSRGs, PCA analysis demonstrated a clear separation between high and low PSRG expression samples, highlighting distinct transcriptomic signatures associated with these expression levels (Figure 3(b)). Additionally, the heatmap of differential gene expression revealed significant differences in gene expression patterns between high and low PSRG expression samples (Figure 3(c)). KEGG pathway enrichment analysis of the differentially expressed genes identified several significant pathways, including “ECM-receptor interaction,” “Ras signaling pathway,” “PI3K-Akt signaling pathway,” and “Complement and coagulation cascades” (Figure 3(d)). GO enrichment analysis further highlighted enriched biological processes, cellular components, and molecular functions such as “collagen fibril organization,” “extracellular matrix organization,” and “growth factor activity” (Figure 3(e)). Validation and analysis of PSRG expression in OA samples using the GSE169077 dataset. (a) Boxplot showing the expression levels of PSRGs in OA and normal samples, with NGF and PENK showing significant differences. (b) PCA plot illustrating the separation between high and low PSRG expression samples. Dim1 accounts for 67.3% of the variance, and Dim2 accounts for 14.4% of the variance. (c) Heatmap of differential gene expression between high and low PSRG expression samples, indicating significant differences in gene expression patterns. (d) KEGG pathway enrichment analysis of differentially expressed genes, highlighting key pathways such as “ECM-receptor interaction” and “PI3K-Akt signaling pathway.” (e) GO enrichment analysis showing significant biological processes, cellular components, and molecular functions, including “collagen fibril organization” and “growth factor activity.”
Differential expression of PSRGs in OA synovial subpopulations
In the analysis of synovial samples from patients with osteoarthritis, we utilized the WISP2, IGF1 and CXCL12 to define the synovial intimal fibroblasts(SIF) subpopulation, the PRG4, CSN1S1 and INHBA gene to define the synovial subintimal fibroblasts (SSF) subpopulation, the CCL3, STAB1 and CD163 gene to define the inflammatory macrophages(I-Macrophages) subpopulation, the TM4SF1, PLVAP and DARC gene to define the endothelial cells (EC) subpopulation, the CXCR4 and CCL3 gene to define the dendritic cells (DC) subpopulation, the RGS5, ACTA2 and TAGLN gene to define the smooth muscle cells (SMC) subpopulation, HIST1H4C, PTTG1 and CENPF gene to define the proliferating immune cells (ProIC) subpopulation, and the CD79A and CD79B genes to define the B cell subpopulation (Figure 4(a)). The UMAP analysis revealed distinct clusters corresponding to these defined subpopulations, highlighting the diversity and heterogeneity of cell types within the synovial tissue. Each subpopulation, such as SIF, SSF, EC, DC, I-Macrophages, Mast cell, T cell, SMC, and B cell, formed unique and well-defined clusters, indicating their specific transcriptomic profiles (Figure 4(b)). Single-cell RNA sequencing analysis of synovial samples from osteoarthritis patients. (a) Heatmap showing the expression of specific marker genes used to define various subpopulations within the synovial samples. (b) UMAP plot illustrating the clustering of defined subpopulations: SIF, SSF, EC, DC, I-Macrophages, Mast cell, T cell, SMC, and B cell. (SIF, synovial intimal fibroblasts; SSF, synovial subintimal fibroblasts; EC, endothelial cells; DC, dendritic cells; I-Macrophages, inflammatory macrophages; SMC, smooth muscle cells). (c) Pseudotime trajectory analysis indicating the progression and differentiation pathways of the subpopulations within the osteoarthritis synovial samples (d) Violin plots showing the expression levels of PSRGs (PENK, NGF, HOXD1, MME, GRM3, CDK5 and TRPA1) across different synovial cell subpopulations. (e) UMAP plots illustrating the spatial distribution of PSRGs within the defined subpopulations, with distinct clusters observed for each gene. (f) Pseudotime analysis showing the dynamic changes in PSRGs expression along the differentiation trajectory of the subpopulations. Genes such as TRPA1, PENK, and NGF exhibited distinct expression patterns along the pseudotime axis, suggesting their roles in the progression and differentiation of osteoarthritic synovial cells. The solid and dashed lines in the pseudotime plot represent primary and secondary trajectories, respectively, with expression levels fluctuating due to dynamic gene regulation and cellular state changes. Branches Y110 and Y80 indicate different pathways in cell differentiation, highlighting changes in gene expression during cell fate decisions.
Pseudotime trajectory analysis provided insights into the differentiation pathways of these subpopulations. The analysis indicated a developmental progression from the SIF subpopulation through intermediate subpopulations such as SSF, EC, and DC, eventually leading to terminal subpopulations including I-Macrophages, Mast cell, T cell, SMC, and B cell. This suggests dynamic changes in gene expression as cells transition through different states, reflecting their roles in OA progression (Figure 4(c)).
To further investigate the distribution of PSRGs at the single-cell level, we utilized violin plots, UMAP plots, and pseudotime analysis. Violin plots displayed the expression levels of PSRGs across different synovial cell subpopulations, revealing varied patterns of PSRGs among subpopulations (Figure 4(d)). UMAP plots visualized that PSRGs were scattered across cellular subpopulations, whereas NGF genes were most prominently expressed in the SMC subpopulation as well as CDK5 in the proIC subpopulation (Figure 4(e)). Pseudotime analysis depicted dynamic changes in PSRG expression along the differentiation trajectory of the subpopulations. The expression levels of PSRGs paralleled the developmental trajectory of the SSF and SIF subpopulations. For instance, PENK expression was primarily concentrated in the SSF subpopulation during the early stages, then shifted to the SIF subpopulation, and ultimately to the SMC, EC, and other cell subpopulations. Similar developmental expression patterns were observed for genes such as TRPA1, NGF, MME, HOXD1, and CDK5. However, OPRK1, one of the eight key PSRGs, was not displayed due to its low expression levels (Figure 4(f)).
Variation in PSRGs expression across OA meniscus cell subpopulations
In the analysis of meniscus samples from patients with osteoarthritis, we utilized the COL3A1, COL6A1 and PRG4 gene to define the fibrochondrocytes (FC) subpopulation, the BMP2 and FOSL1 gene to define the regulatory chondrocytes (RegC) subpopulation, the CDK1 and BIRC5 gene to define the cartilage progenitor cells (CPC) subpopulation, the COL1A1, FGF7 and CTGF gene to define the proliferate fibrochondrocytes (ProFC) subpopulation, the COL1A1, COL3A1, MCAM and MYLK gene to define the fibrochondrocyte progenitors (FCP) subpopulation, the MMP1 and TNFAIP6 gene to define the prehypertrophic chondrocytes (PreHTC) subpopulation, and the CD93 and CDH5 gene to define the endothelial cells (EC) subpopulation (Figure 5(a)). The UMAP visualization demonstrated distinct clustering of these subpopulations, showcasing the heterogeneity within the meniscus samples. The subpopulations, including CPC, FC, EC, ProFC, RegC, and preHTC, formed well-defined clusters, indicating specific transcriptomic profiles for each cell type (Figure 5(b)). Pseudotime trajectory analysis illustrated the dynamic progression of these subpopulations, suggesting a developmental pathway from the CPC subpopulation through intermediate stages such as FC, EC, and ProFC, eventually leading to RegC and preHTC. (Figure 5(c)). Single-cell RNA sequencing analysis of meniscus samples from osteoarthritis patients. (a) Heatmap showing the expression of specific marker genes used to define various subpopulations within the meniscus samples. (b) UMAP plot illustrating the clustering of defined subpopulations: CPC, FC, FCP, EC, ProFC, RegC, and preHTC(CPC, cartilage progenitor cells; FC, fibrochondrocytes; EC, endothelial cells). (c) Pseudotime trajectory analysis indicating the progression and differentiation pathways of the subpopulations within the osteoarthritis meniscus samples. (d) Violin plots showing the expression levels of PSRGs (PENK, NGF, MME, CDK5, TRPA1, and OPRK1) across different meniscus cell subpopulations. (e) UMAP plots illustrating cellular distribution of PSRGs within the defined subpopulations, with distinct clusters observed for each gene. (f) Pseudotime analysis showing the dynamic changes in PSRGs expression along the differentiation trajectory of the subpopulations.
To further investigate the distribution of PSRGs at the single-cell level in meniscus samples, we utilized violin plots, UMAP plots, and pseudotime analysis. Violin plots revealed the expression levels of PSRGs across various meniscus cell subpopulations, showing that PENK, NGF, and MME genes were broadly expressed across multiple subpopulations. CDK5 expression was notably higher in the CPC subpopulation compared to others, while TRPA and OPRK1 genes exhibited scattered expression across various subpopulations. HOXD1 and GRM3 were not displayed due to their low expression levels (Figure 5(d)). UMAP plots illustrated the spatial distribution of these PSRGs within the defined subpopulations, with distinct clusters for each gene, indicating their unique expression profiles (Figure 5(e)).Pseudotime analysis demonstrated dynamic changes in PSRG expression along the differentiation trajectory of the meniscus subpopulations. This analysis indicated that the expression patterns of PSRGs such as PENK, CDK5, MME, and NGF were primarily concentrated in the FC subpopulation during the early stages, and later concentrated in the CPC subpopulation (Figure 5(f)). This is contrary to the expected developmental progression of these cell subpopulations
Distinct patterns of PSRG expression in OA cartilage cell subpopulations
In the analysis of cartilage samples from patients with osteoarthritis, several subpopulations were defined based on the expression of specific genes, similar to the approach used in the referenced dataset. We defined the effector chondrocyte (EC) subpopulation using TF, CHRDL2, and TPM4 genes, the regulatory chondrocytes (RegC) subpopulation with CKS2 and HMOX1, and the proliferative chondrocytes (ProC) subpopulation using P3H2, DDX21, UPP1, CDV3, NGF, and C3orf52. The prehypertrophic chondrocytes (preHTC) subpopulation was defined by TGFB1, S100A4, THBS3, ADAMTS5, and TPPP3, while the fibrocartilage chondrocytes (FC) subpopulation was identified by COL1A1, TMSB4X, ID3, PRSS23, OLFML3, LAMA4, HES1, SEPW1, ZFP36L1, TPM1, PHPT1, IFI6, ESD, UACA, TCEALB, ID1, and ZFP36L2. Additionally, the hypertrophic chondrocytes (HTC) subpopulation was defined by WWP2 and BHLHE41, and the homeostatic chondrocytes (HomC) subpopulation by JUN, BRD2, RGS16, CCNL1, SNHG12, DDIT3, TRA2A, RGS2, KMT2E, and H2AFX. The top ten highly expressed genes in each subpopulation were also displayed (Figure 6(a)).UMAP visualization highlighted the heterogeneity within the cartilage samples, showing well-defined clusters for subpopulations such as preHTC, RegC, HTC, ProC, and EC, indicating distinct transcriptomic profiles (Figure 6(b)). Pseudotime trajectory analysis revealed the dynamic progression of these subpopulations, indicating that RegC transitions into HTC, EC, and FC subpopulations in the first branch, preHTC transitions into HTC in the second branch, and ProC evolves into EC in the third branch, while progenitor cell-related subpopulations remain at the branch ends (Figure 6(c)). Single-cell RNA sequencing analysis of osteoarthritis cartilage samples. (a) Heatmap showing the expression of specific marker genes used to define various subpopulations within the cartilage samples. (b) UMAP plot illustrating the clustering of defined subpopulations: EC, FC, Homc, HTC, preHTC, ProC, and RegC. (c) Pseudotime trajectory analysis indicating the progression and differentiation pathways of the subpopulations within the osteoarthritis cartilage samples. (d) Violin plots showing the expression levels of PSRGs across different cartilage cell subpopulations, including EC, FC, Homc, HTC, preHTC, ProC, and RegC. (E) UMAP plots illustrating the spatial distribution of PSRGs within the defined subpopulations, with distinct clusters observed for each gene. (F) Pseudotime analysis showing the dynamic changes in PSRGs expression along the differentiation trajectory of the subpopulations.
To further elucidate the distribution of PSRGs within the cartilage samples, UMAP and violin plots were employed. These plots illustrated the spatial distribution of PSRGs across the defined subpopulations, with NGF being prominently expressed in EC, FC, HomC, preHTC, and ProC, particularly in the preHTC and ProC subpopulations. Other PSRGs, such as PENK, MME, and CDK5, exhibited scattered high expression levels in specific subpopulations like FC (Figures 6(d) and (e)). Pseudotime analysis demonstrated that PSRG expression was initially concentrated in development-related subpopulations such as EC and ProC, and later shifted to more stable subpopulations like HomC and HTC in OA cartilage samples (Figure 6(f)).
Discussion
Osteoarthritis (OA) is a degenerative joint disease marked by the breakdown of cartilage, inflammation of the synovium, and alterations in subchondral bone, leading to pain, stiffness, and reduced mobility. Pain is the most debilitating symptom of OA, significantly affecting patients’ quality of life and functional abilities. However, there is a lack of comprehensive studies examining the single-cell level distribution and dynamic expression of pain-sensing genes (PSRGs) throughout the progression of OA. This gap in knowledge underscores the need for systematic investigations into the role of PSRGs in OA.
Our study began with bulk transcriptomic analysis to systematically investigate the expression of PSRGs in OA. We identified 20 differentially expressed genes, with TNF and CXCL12 being upregulated and HOXD1 and ACPP downregulated in OA samples. Using LASSO, SVM, and random forest algorithms, we pinpointed eight critical PSRGs: PENK, NGF, HOXD1, MME, GRM3, CDK5, TRPA1, and OPRK1. These genes exhibited significant overexpression in KOA cartilage samples and were validated across different datasets. However, there were some differences observed between the GSE114007 and GSE169077 datasets, likely due to variations in sample size and characteristics, which we further discuss below. Single-cell RNA-seq analysis revealed varied expression patterns of these genes in synovium, meniscus, and cartilage tissues. In synovial samples, PSRGs were predominantly expressed in skeletal muscle cells and inflammatory cell subpopulations. In meniscus samples, PSRG expression was dispersed among various chondrocyte subpopulations, indicating cell subpopulation specificity. Pseudotime analysis suggested a positive feedback regulation of PSRG expression correlating with disease progression, with increasing expression levels in progenitor cell subpopulations. In cartilage samples, PSRG expression was scattered among different chondrocyte subpopulations, but fewer cells expressed PSRGs, likely reflecting the early stage of OA in the samples analyzed.
The external validation using GSE169077 showed some discrepancies in the expression patterns of PSRGs compared to GSE114007. These differences may be due to sample size variability or differences in patient characteristics. Larger datasets with more diverse samples are needed to better understand these variations and their implications in KOA pathogenesis.14,15
Traditionally, it has been believed that sensory neurons below the articular cartilage and the dorsal root ganglia are primarily responsible for OA pain sensing. 16 However, our findings indicate that PSRGs are also expressed within the OA microenvironment, challenging existing paradigms. The advent of omics technologies offers the potential to further explore the precise spatial and temporal expression of these genes, enhancing our understanding of cartilage and neuronal cell interactions, and informing new therapeutic targets. 17
The identified PSRGs play diverse roles in OA, pain, and inflammation. NGF (Nerve Growth Factor) is crucial for pain modulation and inflammation, with elevated levels in OA contributing to pain by sensitizing nociceptors. Studies 18 have shown that NGF antagonists can significantly reduce pain in OA patients, highlighting its therapeutic potential. 19 PENK (Proenkephalin) encodes enkephalins, opioid peptides that modulate pain and inflammatory responses in OA by acting on opioid receptors 20 to produce analgesic effects. 21 Alterations in PENK expression can influence pain perception, further emphasizing the complex regulation of pain in OA. ME (Membrane Metalloendopeptidase) plays a pivotal role by degrading enkephalins and other peptides, influencing pain sensation and inflammation. 22 Increased MME activity can potentially exacerbate pain in OA by reducing the availability of enkephalins, which underscores the delicate balance of peptide regulation in pain management. 23 Similarly, CDK5 (Cyclin-Dependent Kinase 5) is involved in neuronal signaling, regulating pain pathways and inflammatory responses in OA. 24 Dysregulation of CDK5 has been linked to neuropathic pain, making it a significant target for OA pain management strategies.25,26 In addition, GRM3 (Glutamate Metabotropic Receptor 3) is associated with neurotransmission and pain signaling. 27 Alterations in GRM3 expression are linked to chronic pain conditions, 28 suggesting its involvement in the complex pain mechanisms of OA. HOXD1 (Homeobox D1), although primarily known for its role in development, also regulates inflammation and has been linked to OA progression. 29 TRPA1 (Transient Receptor Potential Ankyrin 1) mediates pain and inflammation, with its activation leading to the release of pro-inflammatory cytokines. 30 This makes TRPA1 a promising target, as antagonists are being explored for their potential to alleviate OA pain. 31 Lastly, OPRK1 (Opioid Receptor Kappa 1) modulates pain and inflammatory responses,32,33 making it a critical target for pain management in OA.
These findings suggest potential future therapeutic applications, particularly for siRNA-based therapies like Inclisiran, 34 which has shown success in other diseases. Targeting PSRGs with similar delivery systems could pave the way for more effective pain management in KOA. 35 Furthermore, integrating novel targeted delivery systems, such as nanoparticle carriers, 36 may enhance the specificity and efficacy of treatments targeting PSRGs in KOA, offering promising future therapeutic avenues.
These findings underscore the multifaceted roles of PSRGs in OA, offering insights into new therapeutic avenues for managing OA pain and progression. The complex interactions and regulatory mechanisms of these genes highlight the potential for targeted therapies, such as those modulating PSRGs through RNA-based approaches or other gene-editing technologies, 37 which could offer a personalized and effective treatment strategy in the future.
Footnotes
Acknowledgements
We are grateful to the authors who made the relevant sequencing data publicly available in the GEO database.
Author contributions
Zirui Li was responsible for conceptualization, data analysis, manuscript writing and graphics. Haicheng Chen and Chujie Chen were responsible for the conceptualization and writing of the manuscript.
Declaration of conflicting interests
The author(s) declared no potential conflicts of interest with respect to the research, authorship, and/or publication of this article.
Funding
The author(s) received no financial support for the research, authorship, and/or publication of this article.
Ethical statement
Data availability statement
GSE114007, GSE169077, GSE152805, GSE133449, and GSE104782 datasets are publicly available in the GEO database. The relevant codes involved in the study are available from the corresponding author upon reasonable request.